Saracen Mineral Holdings Ltd - · PDF fileSARACEN MINERAL HOLDINGS LTD Exploring for growth....
33
Saracen Mineral Holdings Ltd Guido Staltari Executive Chairman
Transcript of Saracen Mineral Holdings Ltd - · PDF fileSARACEN MINERAL HOLDINGS LTD Exploring for growth....

Saracen Mineral Holdings Ltd
Guido Staltari
Executive Chairman
2
Guido Staltari, Executive Chairman
Raleigh Finlayson, Chief Operating Officer
SARACEN MINERAL HOLDINGS LTD
Exploring for growth.
Saracen Mineral Holdings Limited Australian Gold Producer ASX:SAR
Guido Staltari
Executive Chairman
Funded for growth - heading to 190Kozpa
ASX Spotlight Conference, New York 28 February 2013
3
Qualification
This is a presentation about geology, geoscientific interpretation, geoscientific speculation, gold deposits, gold potential, engineering, infrastructure,
potential values, costs, risks, and related matters pertinent to Saracen’s present and future activities as a publicly listed mineral exploration and
production company. It includes forecasts, predictions, targets and estimates of future expenditures which may vary over time.
Exploration targets presented and discussed here are conceptual in nature and there has been insufficient exploration to define a Mineral Resource
(“Resource”) or Ore Reserve (“Reserve”). It is uncertain if further exploration will result in the determination of a Resource or Reserve. Where
exploration, evaluation, operational and feasibility study expenditure estimates and budgets amounts are presented herein, ongoing prioritisation and
scaling of expenditures will be subject to results and, where applicable, scheduling changes. Targeted production and other outcomes are subject to
change, and may not eventuate, depending on the results of ongoing performance and assessment of data. All Reserves and Resources as referred to
herein are in accordance with JORC. Refer to last two slides of this presentation for the relevant Competent Person statements. Resources are
inclusive of Reserves.
Some of the comments, forecasts, targeted outcomes and predictions made, or that might be interpreted from the comments herein, are subjective and
speculative, in part because such is the very nature of gold exploration and exploitation, and in part also because geoscientists and engineers can be
very optimistic about the future of the exploration and other work programs they are involved in. Such optimism can lead to erroneous judgments as to
future results and valuations, and in many cases external factors may change the outcome.
Take care to question and carefully evaluate any judgments you might make, on the basis of this presentation, as to the value of Saracen and its
securities. This presentation is not intended to provide the sole or principal basis of any investment or credit decision or any other risk evaluation and
may not be considered as a recommendation by Saracen or its officers. Any investor reading this presentation should determine its interest in acquiring
securities in Saracen on the basis of independent investigations that it considers necessary, prudent or desirable.
Saracen and its officers do not accept any liability for any loss or damage suffered or incurred by any investor or any other person or entity however
caused (including negligence) relating in any way to this presentation including, without limitation, the information contained in it, any errors or
omissions however caused by any other person or entity placing any reliance on this presentation, its accuracy or reliability.
This presentation should not be construed as an offer or mooted offer in relation to Saracen securities.
United States
This document may not be released or distributed in the United States. This document does not constitute an offer to sell, or a solicitation of an offer to
buy, securities in the United States. Any securities described in this document have not been, and will not be, registered under the US Securities Act of
1933 (as amended) and may not be offered or sold in the United States except in transactions exempt from, or not subject to, registration under the US
Securities Act and applicable US state securities laws.
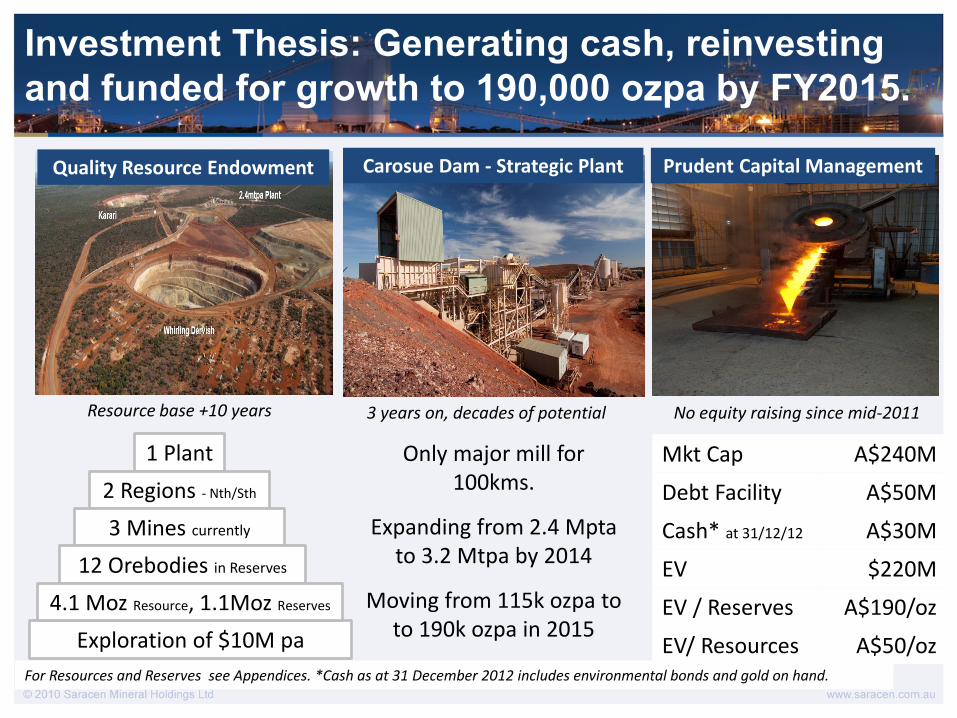
Investment Thesis: Generating cash, reinvesting
and funded for growth to 190,000 ozpa by FY2015.
Mkt Cap A$240M
Debt Facility A$50M
Cash* at 31/12/12 A$30M
EV $220M
EV / Reserves A$190/oz
EV/ Resources A$50/oz
No equity raising since mid-2011
Only major mill for 100kms.
Expanding from 2.4 Mpta to 3.2 Mtpa by 2014
Moving from 115k ozpa to to 190k ozpa in 2015
Resource base +10 years
1 Plant
2 Regions - Nth/Sth
3 Mines currently
12 Orebodies in Reserves
Exploration of $10M pa
4.1 Moz Resource, 1.1Moz Reserves
Quality Resource Endowment
3 years on, decades of potential
For Resources and Reserves see Appendices. *Cash as at 31 December 2012 includes environmental bonds and gold on hand.
Carosue Dam - Strategic Plant Prudent Capital Management
5
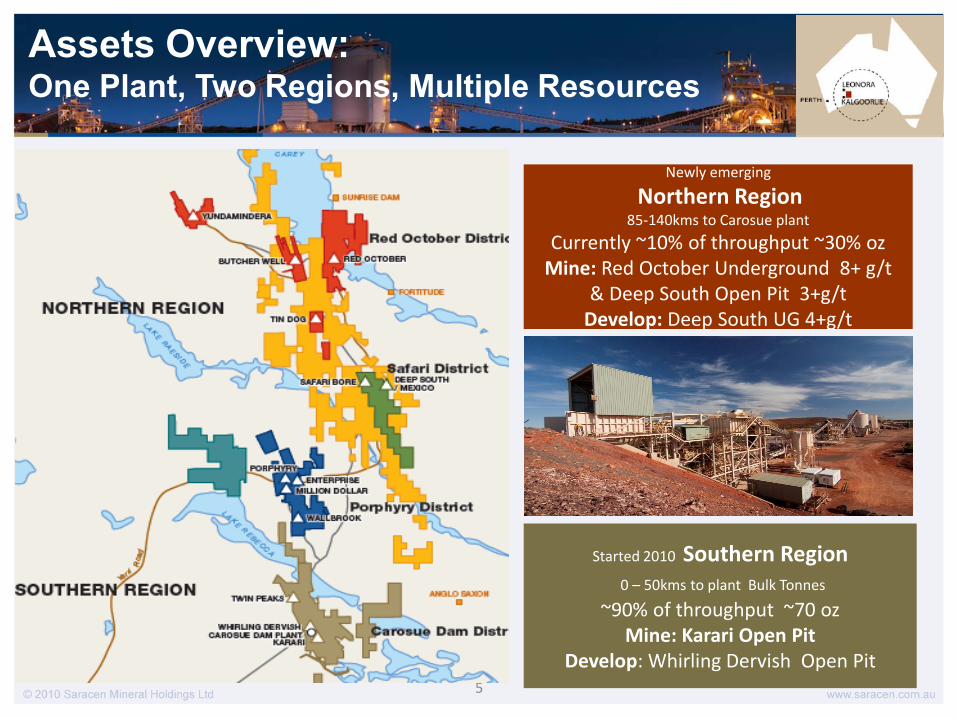
Assets Overview: One Plant, Two Regions, Multiple Resources
Started 2010 Southern Region 0 – 50kms to plant Bulk Tonnes
~90% of throughput ~70 oz Mine: Karari Open Pit
Develop: Whirling Dervish Open Pit
Newly emerging
Northern Region 85-140kms to Carosue plant
Currently ~10% of throughput ~30% oz Mine: Red October Underground 8+ g/t
& Deep South Open Pit 3+g/t Develop: Deep South UG 4+g/t
6
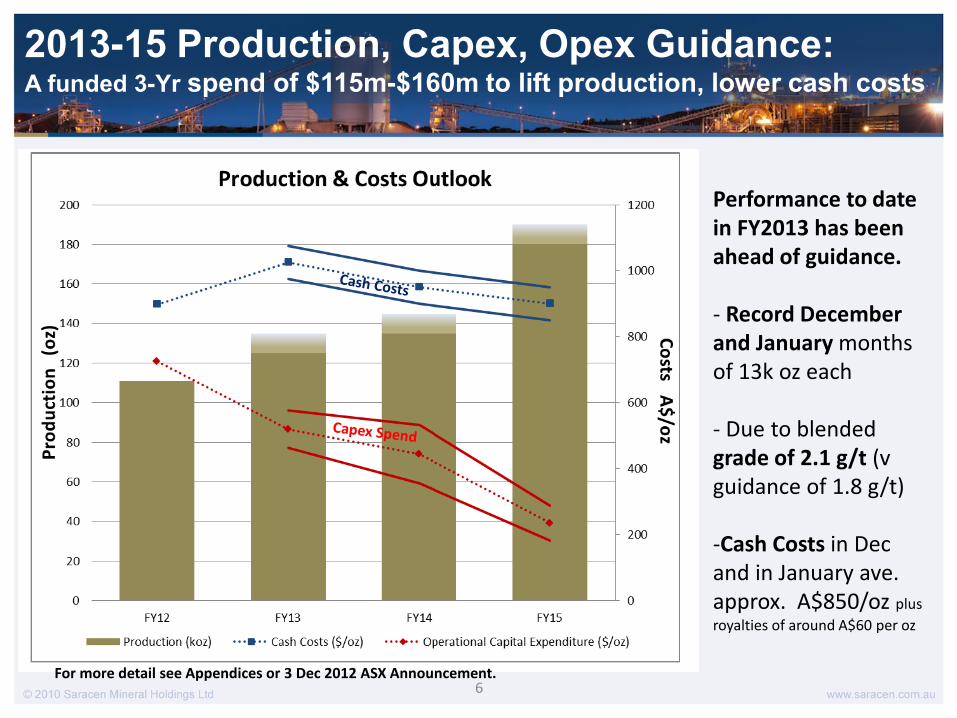
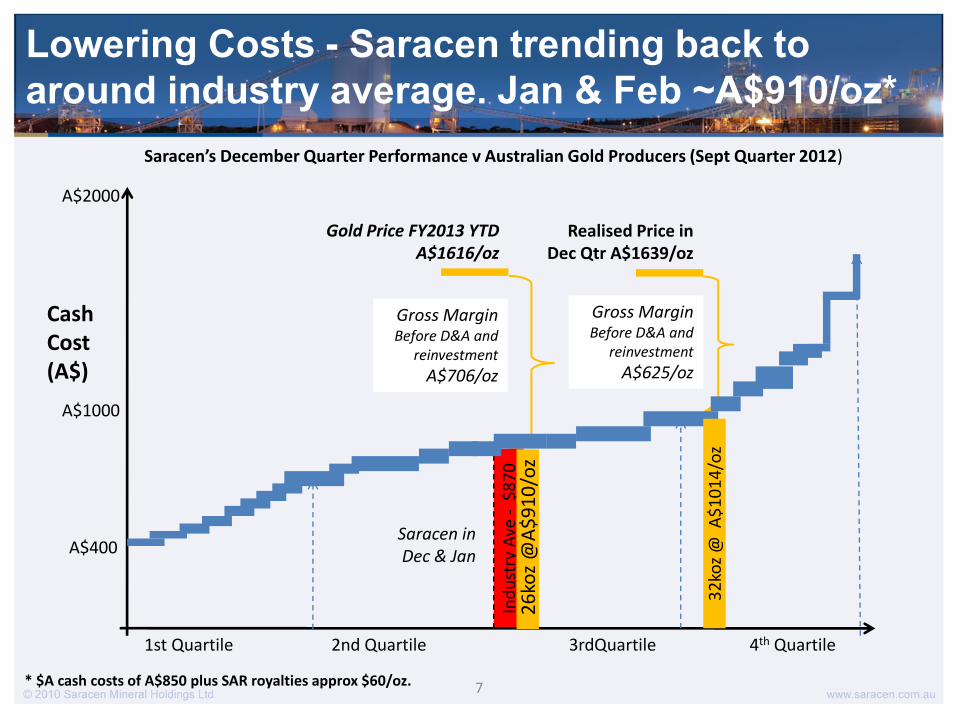
2013-15 Production, Capex, Opex Guidance: A funded 3-Yr spend of $115m-$160m to lift production, lower cash costs
Performance to date in FY2013 has been ahead of guidance. - Record December and January months of 13k oz each
- Due to blended grade of 2.1 g/t (v guidance of 1.8 g/t)
-Cash Costs in Dec and in January ave. approx. A$850/oz plus
royalties of around A$60 per oz
For more detail see Appendices or 3 Dec 2012 ASX Announcement.
Ind
ust
ry A
ve -
$8
70
7
Lowering Costs - Saracen trending back to
around industry average. Jan & Feb ~A$910/oz*
* $A cash costs of A$850 plus SAR royalties approx $60/oz.
A$2000
A$1000
A$400
Realised Price in Dec Qtr A$1639/oz
Gross Margin Before D&A and
reinvestment
A$625/oz
Saracen’s December Quarter Performance v Australian Gold Producers (Sept Quarter 2012)
1st Quartile 2nd Quartile 3rdQuartile 4th Quartile
26
koz
@A
$9
10
/oz
32
koz
@ A
$1
01
4/o
z
Saracen in Dec & Jan
Gold Price FY2013 YTD A$1616/oz
Gross Margin Before D&A and
reinvestment
A$706/oz
Cash Cost (A$)
8
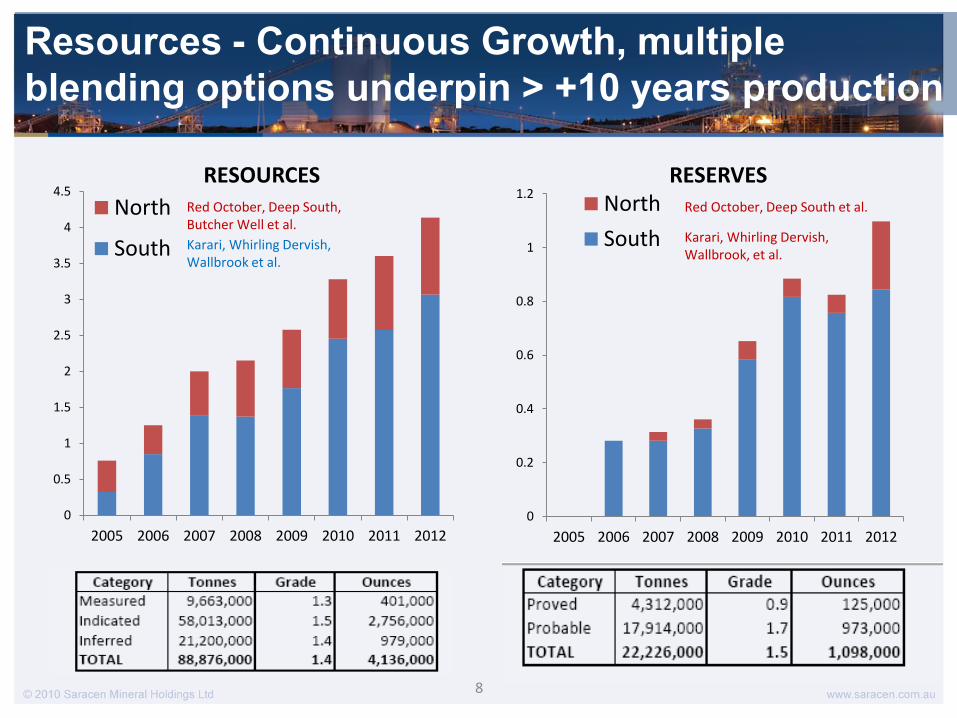
Resources - Continuous Growth, multiple
blending options underpin > +10 years production
0
0.5
1
1.5
2
2.5
3
3.5
4
4.5
2005 2006 2007 2008 2009 2010 2011 2012
North
South Karari, Whirling Dervish, Wallbrook et al.
Red October, Deep South, Butcher Well et al.
0
0.2
0.4
0.6
0.8
1
1.2
2005 2006 2007 2008 2009 2010 2011 2012
North
South
RESOURCES RESERVES Red October, Deep South et al.
Karari, Whirling Dervish, Wallbrook, et al.
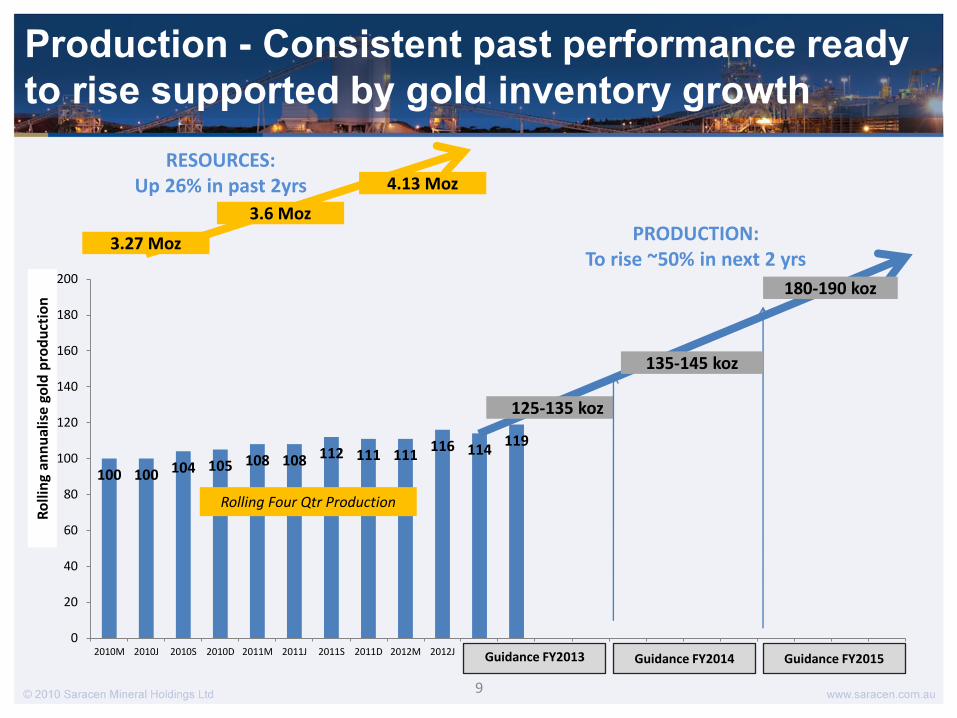
100 100 104 105 108 108 112 111 111 116 114
119
0
20
40
60
80
100
120
140
160
180
200
2010M 2010J 2010S 2010D 2011M 2011J 2011S 2011D 2012M 2012J 2012S 2012D 2013M 2013J 2013S 2013D 2014M 2014J 2014S 2014D 2015M 2015J
9
Production - Consistent past performance ready
to rise supported by gold inventory growth
125-135 koz
135-145 koz
180-190 koz
Guidance FY2014 Guidance FY2015
Ro
llin
g an
nu
alis
e g
old
pro
du
ctio
n
Guidance FY2013
PRODUCTION: To rise ~50% in next 2 yrs
3.27 Moz
3.6 Moz
4.13 Moz RESOURCES:
Up 26% in past 2yrs
Rolling Four Qtr Production
10
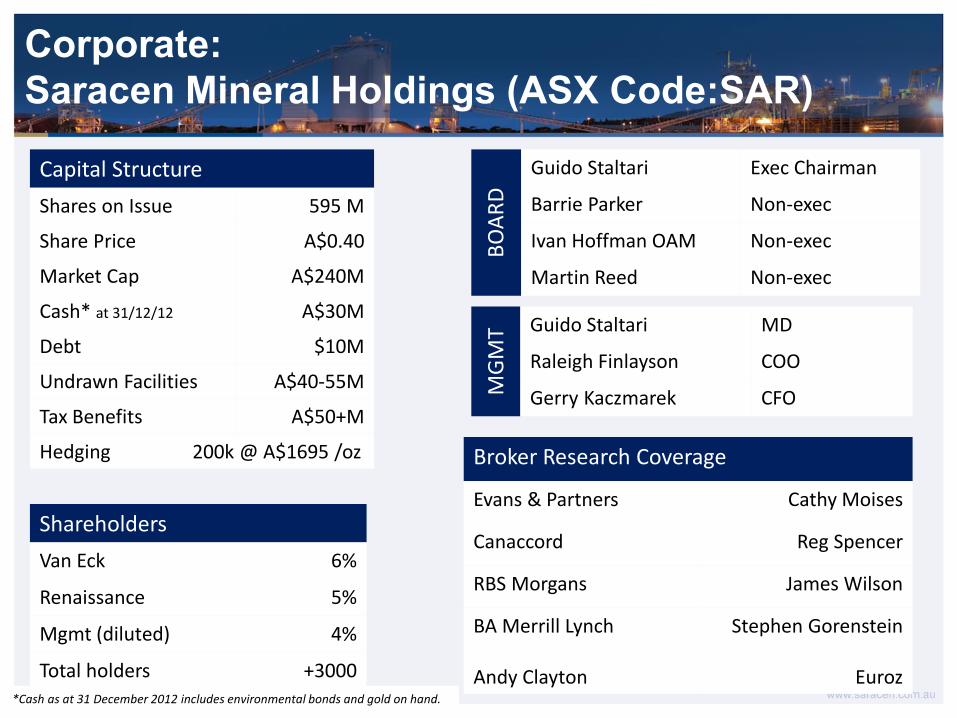
Corporate:
Saracen Mineral Holdings (ASX Code:SAR)
Capital Structure
Shares on Issue 595 M
Share Price A$0.40
Market Cap A$240M
Cash* at 31/12/12 A$30M
Debt $10M
Undrawn Facilities A$40-55M
Tax Benefits A$50+M
Hedging 200k @ A$1695 /oz
Shareholders
Van Eck 6%
Renaissance 5%
Mgmt (diluted) 4%
Total holders +3000
BO
AR
D
Guido Staltari Exec Chairman
Barrie Parker Non-exec
Ivan Hoffman OAM Non-exec
Martin Reed Non-exec
Broker Research Coverage
Evans & Partners Cathy Moises
Canaccord Reg Spencer
RBS Morgans James Wilson
BA Merrill Lynch Andy Clayton
Stephen Gorenstein
Euroz
MG
MT Guido Staltari MD
Raleigh Finlayson COO
Gerry Kaczmarek CFO
*Cash as at 31 December 2012 includes environmental bonds and gold on hand.
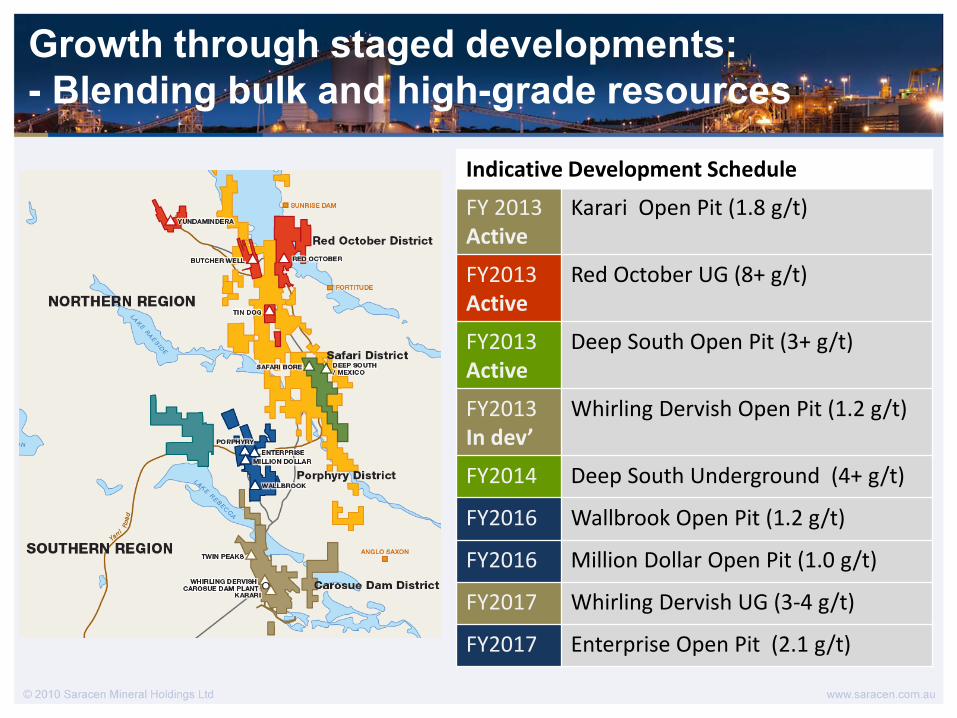
Indicative Development Schedule
FY 2013 Active
Karari Open Pit (1.8 g/t)
FY2013 Active
Red October UG (8+ g/t)
FY2013 Active
Deep South Open Pit (3+ g/t)
FY2013 In dev’
Whirling Dervish Open Pit (1.2 g/t)
FY2014 Deep South Underground (4+ g/t)
FY2016 Wallbrook Open Pit (1.2 g/t)
FY2016 Million Dollar Open Pit (1.0 g/t)
FY2017 Whirling Dervish UG (3-4 g/t)
FY2017 Enterprise Open Pit (2.1 g/t)
Growth through staged developments:
- Blending bulk and high-grade resources
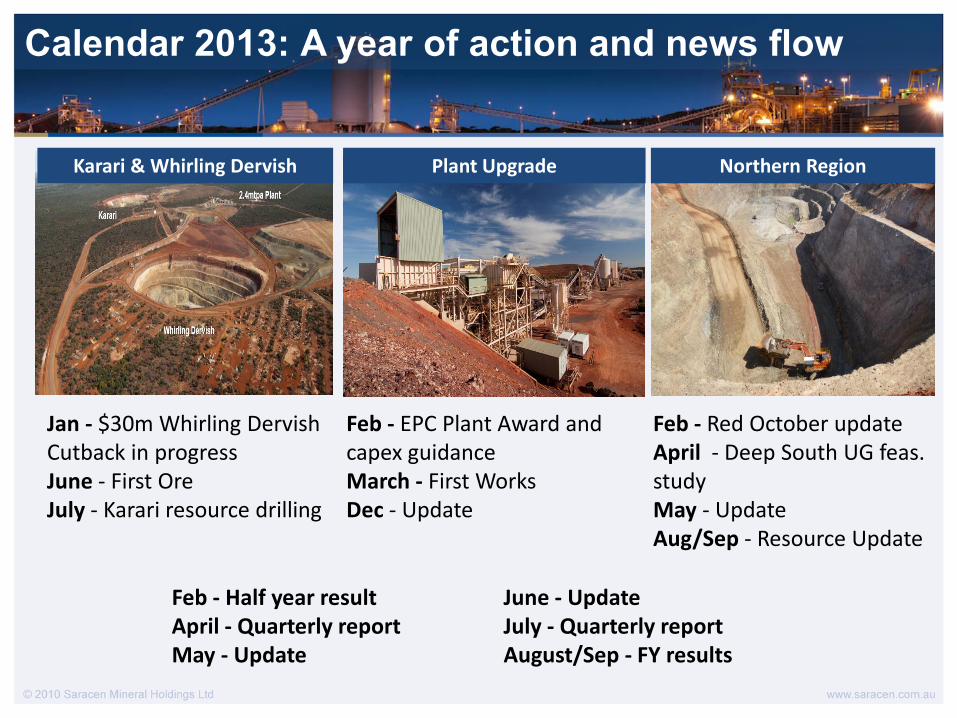
Calendar 2013: A year of action and news flow
Karari & Whirling Dervish Plant Upgrade Northern Region
Jan - $30m Whirling Dervish Cutback in progress June - First Ore July - Karari resource drilling
Feb - EPC Plant Award and capex guidance March - First Works Dec - Update
Feb - Red October update April - Deep South UG feas. study May - Update Aug/Sep - Resource Update
June - Update July - Quarterly report August/Sep - FY results
Feb - Half year result April - Quarterly report May - Update

13
Southern Region - Carosue Dam District
Karari OP & Whirling Dervish OP & UG
Karari
Whirling Dervish
2.4mtpa Plant
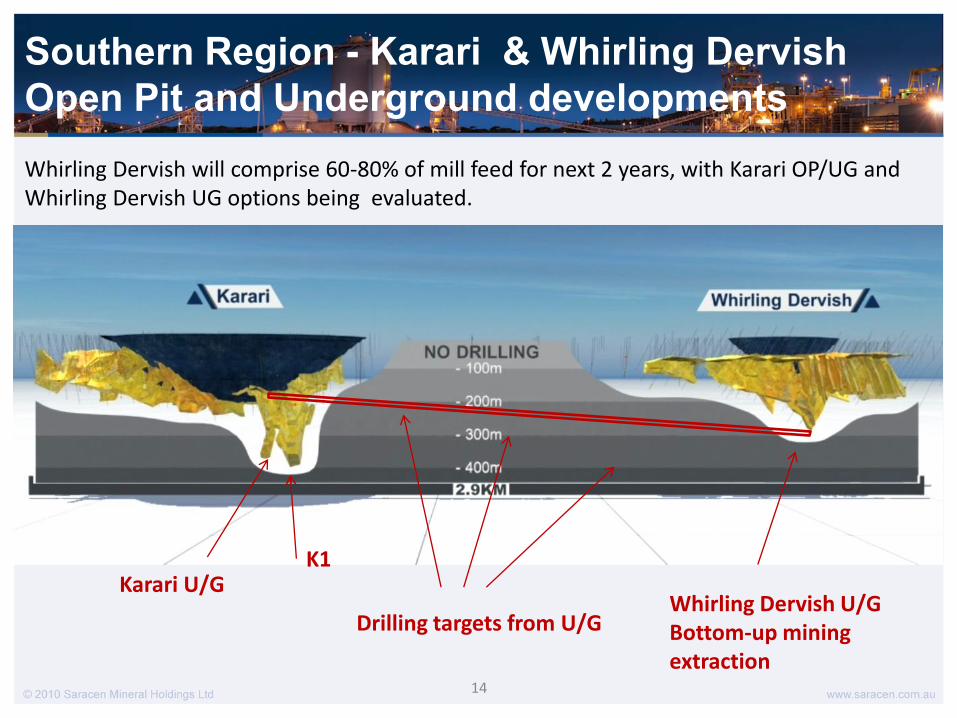
14
Karari U/G
Drilling targets from U/G Whirling Dervish U/G Bottom-up mining extraction
K1
Southern Region - Karari & Whirling Dervish
Open Pit and Underground developments
Whirling Dervish will comprise 60-80% of mill feed for next 2 years, with Karari OP/UG and Whirling Dervish UG options being evaluated.
15
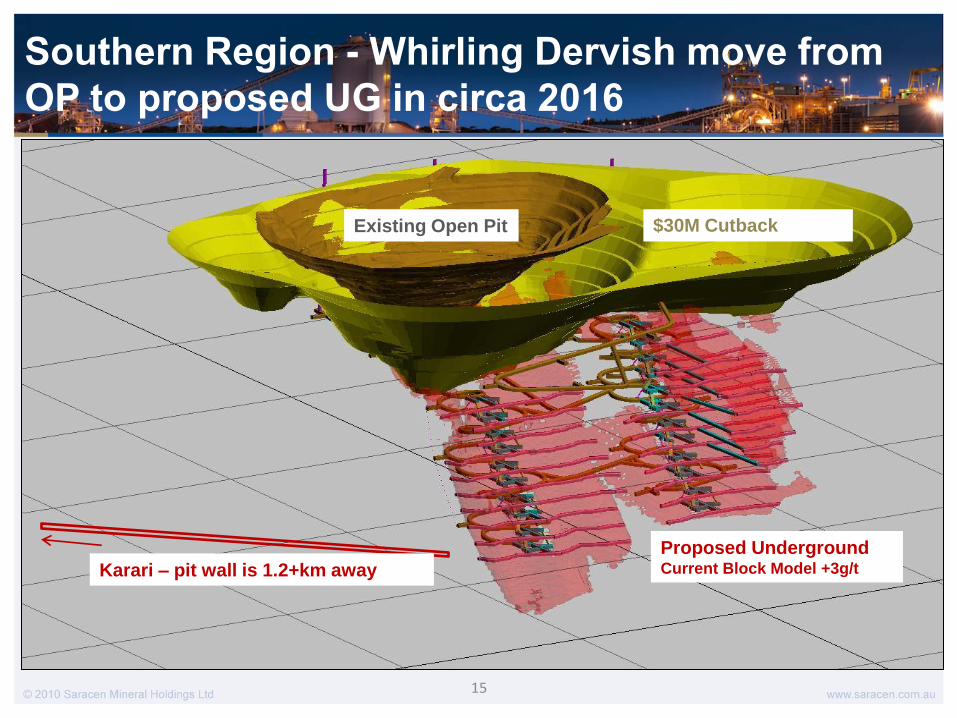
Existing Open Pit $30M Cutback
Proposed Underground Current Block Model +3g/t Karari – pit wall is 1.2+km away
Southern Region - Whirling Dervish move from
OP to proposed UG in circa 2016
16
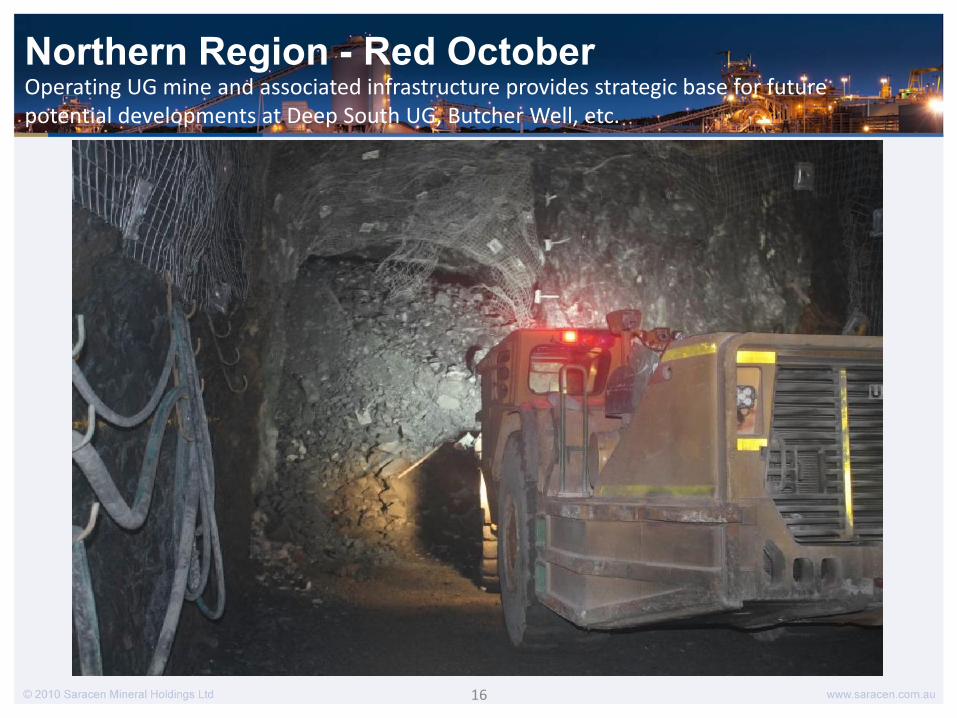
Operating UG mine and associated infrastructure provides strategic base for future potential developments at Deep South UG, Butcher Well, etc.
Northern Region - Red October
17
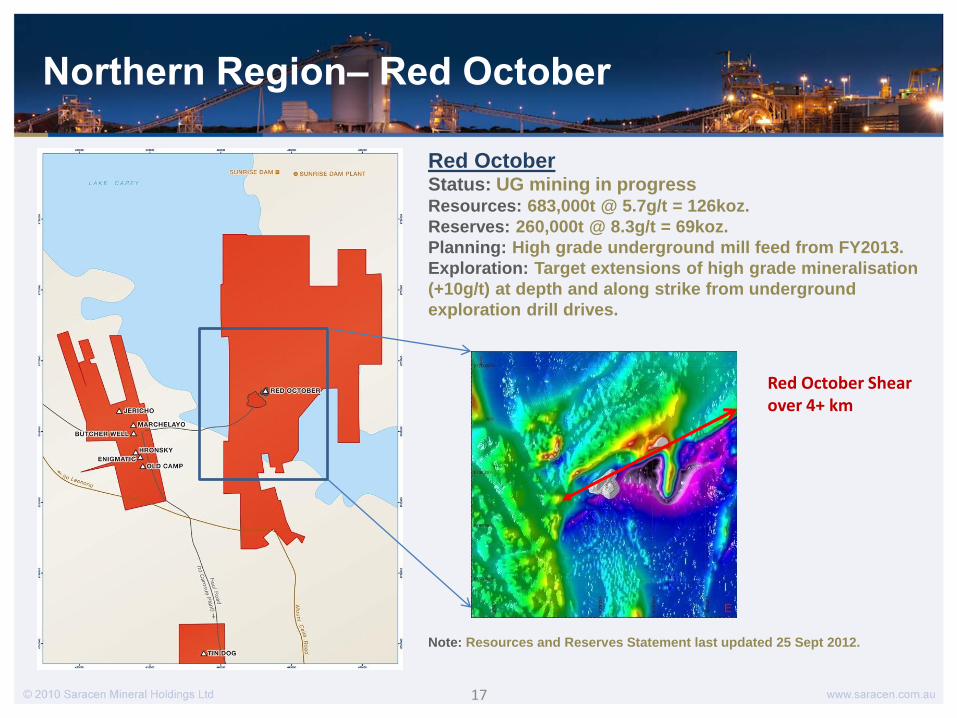
Northern Region– Red October
Red October Status: UG mining in progress Resources: 683,000t @ 5.7g/t = 126koz.
Reserves: 260,000t @ 8.3g/t = 69koz.
Planning: High grade underground mill feed from FY2013.
Exploration: Target extensions of high grade mineralisation
(+10g/t) at depth and along strike from underground
exploration drill drives.
Note: Resources and Reserves Statement last updated 25 Sept 2012.
Red October Shear over 4+ km
18
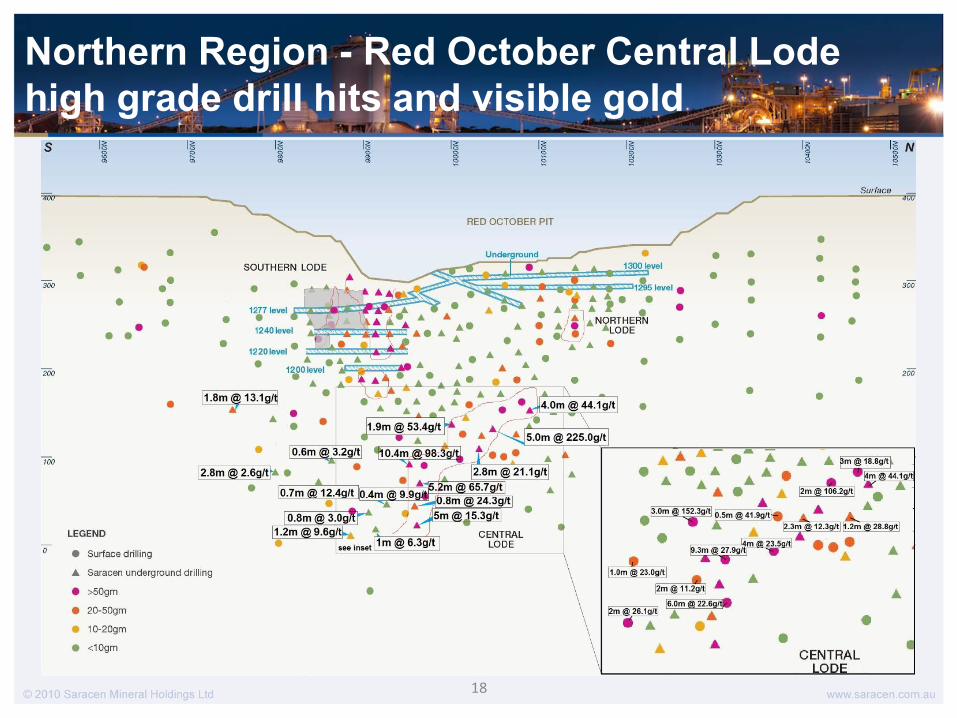
Northern Region - Red October Central Lode
high grade drill hits and visible gold
19
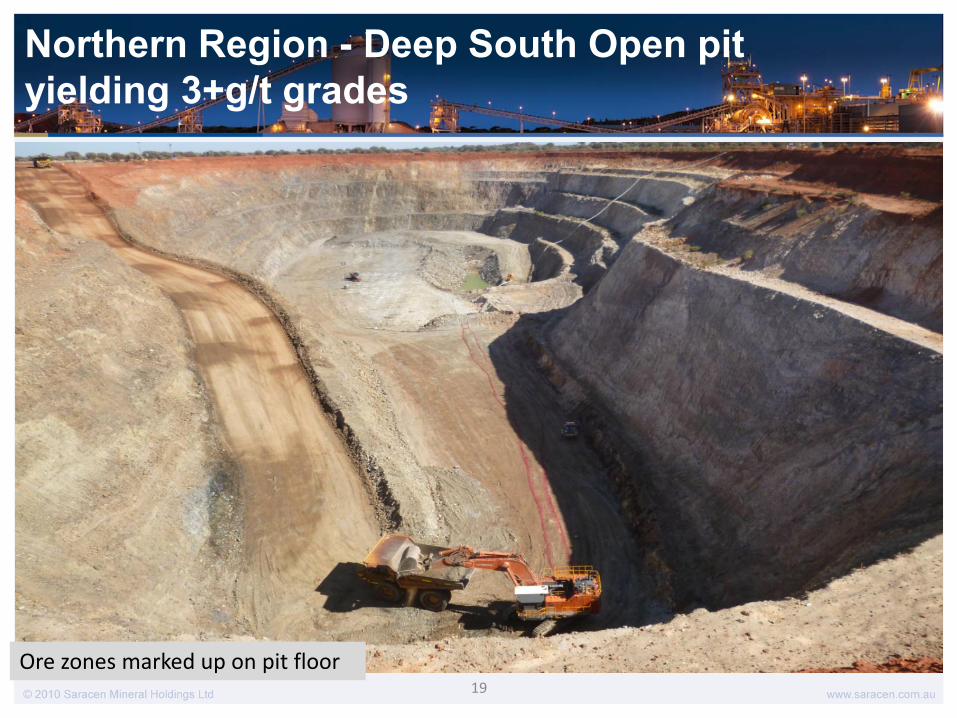
Northern Region - Deep South Open pit
yielding 3+g/t grades
Ore zones marked up on pit floor
20
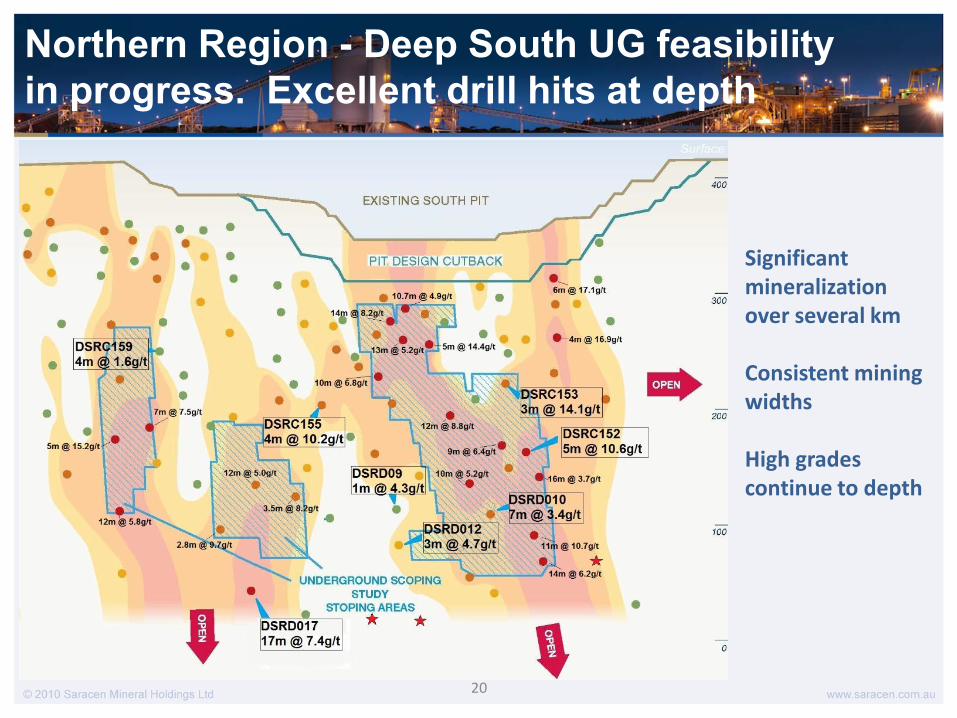
Northern Region - Deep South UG feasibility
in progress. Excellent drill hits at depth
Significant mineralization over several km Consistent mining widths High grades continue to depth
21
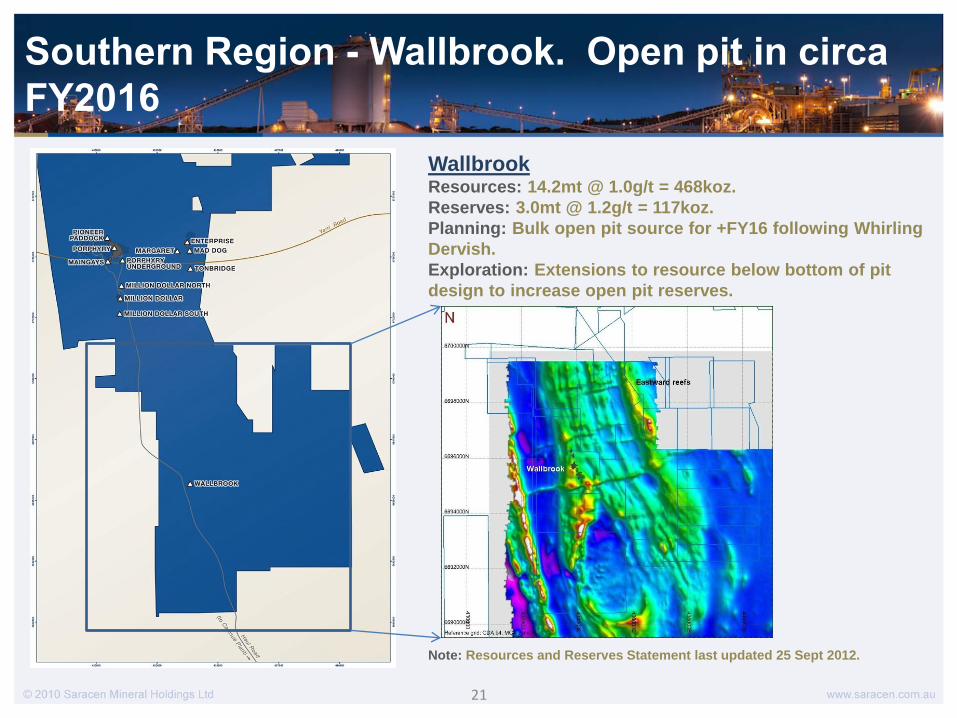
Wallbrook Resources: 14.2mt @ 1.0g/t = 468koz.
Reserves: 3.0mt @ 1.2g/t = 117koz.
Planning: Bulk open pit source for +FY16 following Whirling
Dervish.
Exploration: Extensions to resource below bottom of pit
design to increase open pit reserves.
Note: Resources and Reserves Statement last updated 25 Sept 2012.
Southern Region - Wallbrook. Open pit in circa
FY2016

22
Southern Region - Wallbrook. Open pit in circa
FY2016

Investment Thesis: Generating cash, reinvesting
and funded for growth to 190,000 ozpa by FY2015.
Mkt Cap A$240M
Debt Facility A$50M
Cash* at 31/12/12 A$30M
EV $220M
EV / Reserves A$190/oz
EV/ Resources A$50/oz
No equity raising since mid-2011
Only major mill for 100kms.
Expanding from 2.4 Mpta to 3.2 Mtpa by 2014
Moving from 115k ozpa to to 190k ozpa in 2015
Resource base +10 years
1 Plant
2 Regions - Nth/Sth
3 Mines currently
12 Orebodies in Reserves
Exploration of $10M pa
4.1 Moz Resource, 1.1Moz Reserves
Quality Resource Endowment
3 years on, decades of potential
For Resources and Reserves see Appendices. *Cash as at 31 December 2012 includes environmental bonds and gold on hand.
Carosue Dam - Strategic Plant Prudent Capital Management
24
Contact Us: ASX: SAR www.saracen.com.au info @saracen.com.au
25
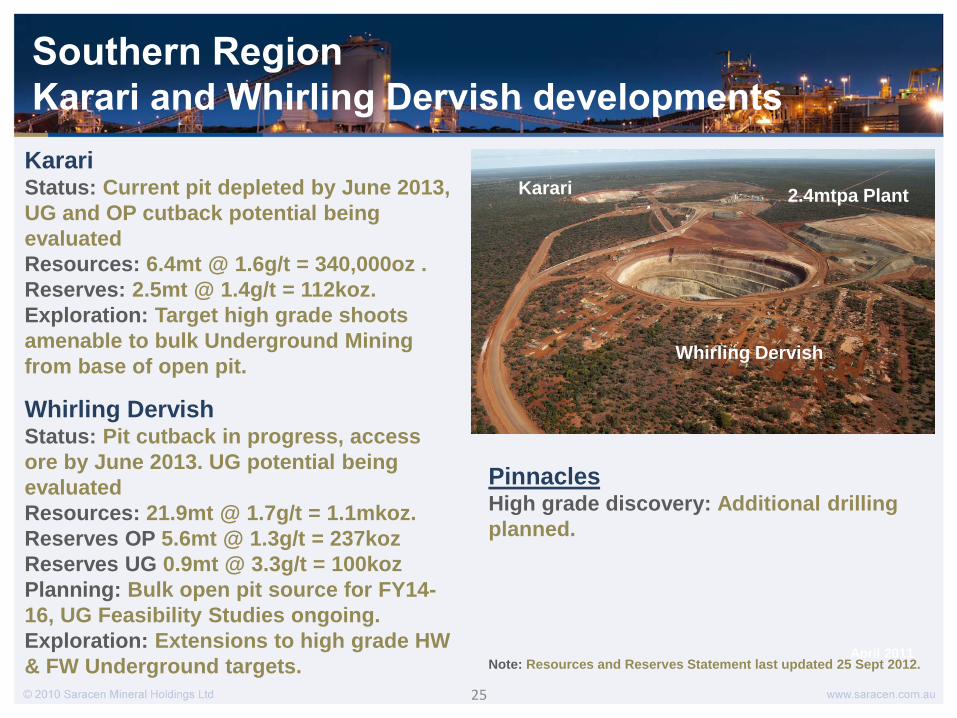
Southern Region Karari and Whirling Dervish developments
April 2011
Whirling Dervish
Karari 2.4mtpa Plant
Whirling Dervish Status: Pit cutback in progress, access
ore by June 2013. UG potential being
evaluated
Resources: 21.9mt @ 1.7g/t = 1.1mkoz.
Reserves OP 5.6mt @ 1.3g/t = 237koz
Reserves UG 0.9mt @ 3.3g/t = 100koz
Planning: Bulk open pit source for FY14-
16, UG Feasibility Studies ongoing.
Exploration: Extensions to high grade HW
& FW Underground targets.
Karari Status: Current pit depleted by June 2013,
UG and OP cutback potential being
evaluated
Resources: 6.4mt @ 1.6g/t = 340,000oz .
Reserves: 2.5mt @ 1.4g/t = 112koz.
Exploration: Target high grade shoots
amenable to bulk Underground Mining
from base of open pit.
Pinnacles High grade discovery: Additional drilling
planned.
Note: Resources and Reserves Statement last updated 25 Sept 2012.
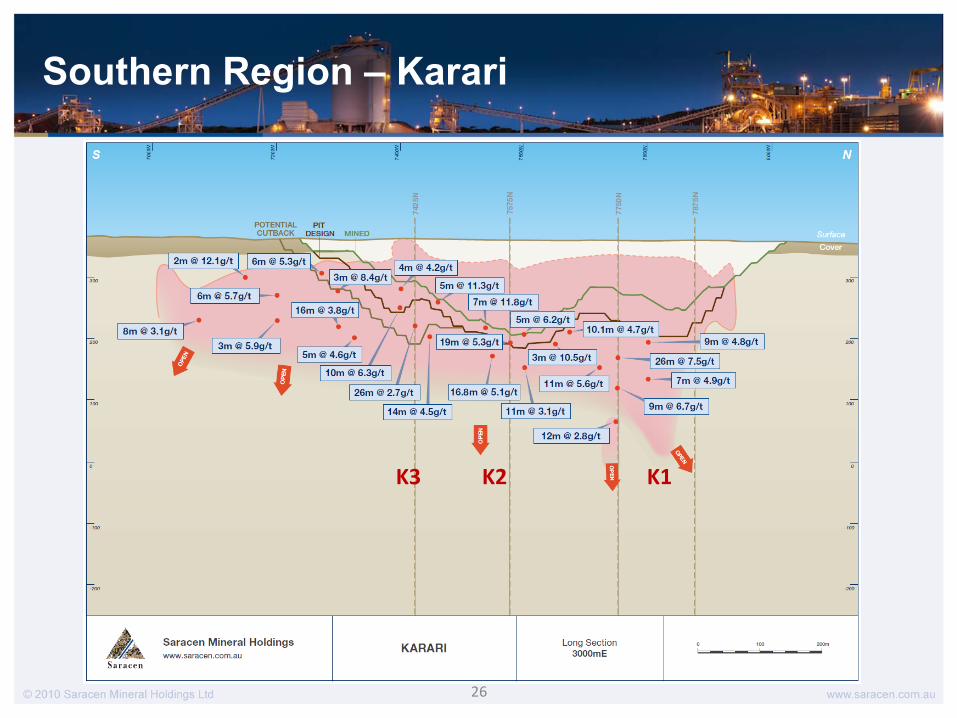
26
Southern Region – Karari
K3 K2 K1
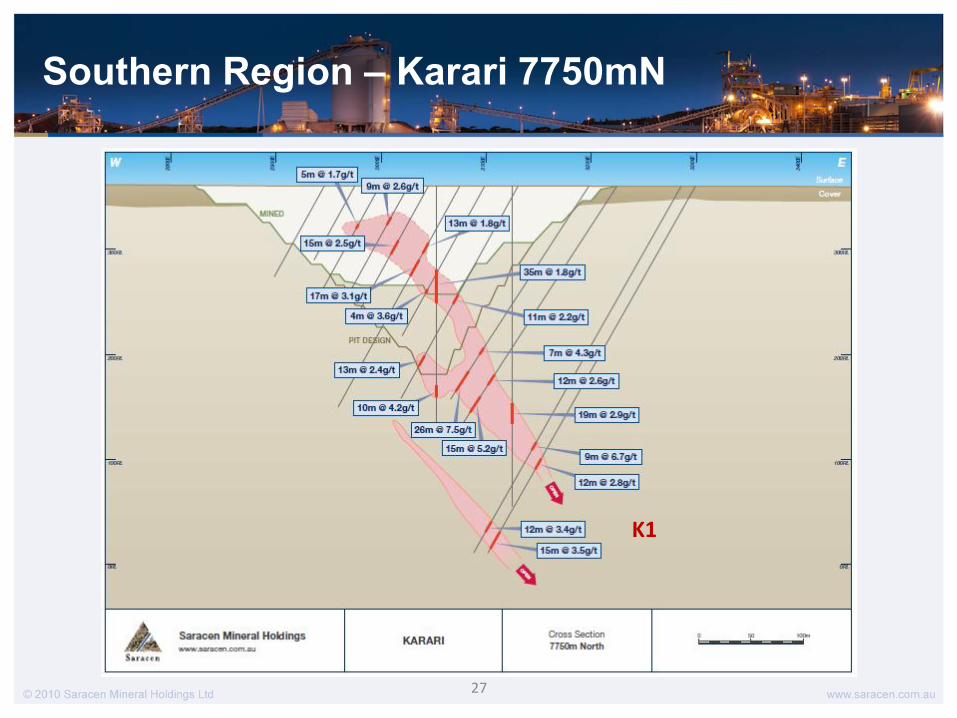
27
Southern Region – Karari 7750mN
K1
28
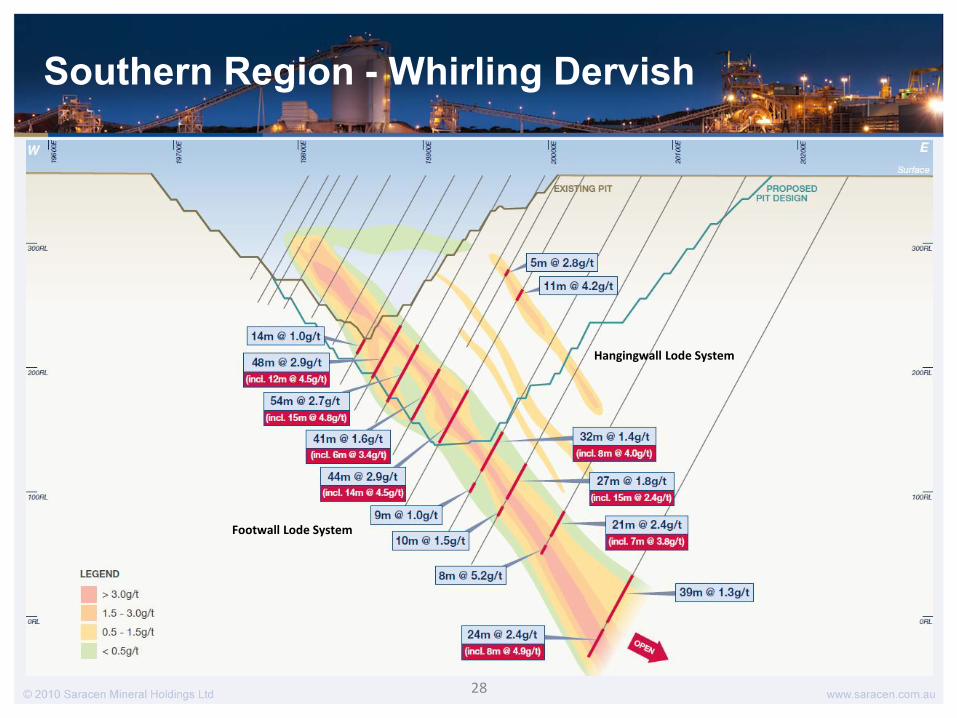
Southern Region - Whirling Dervish
Footwall Lode System
Hangingwall Lode System
29
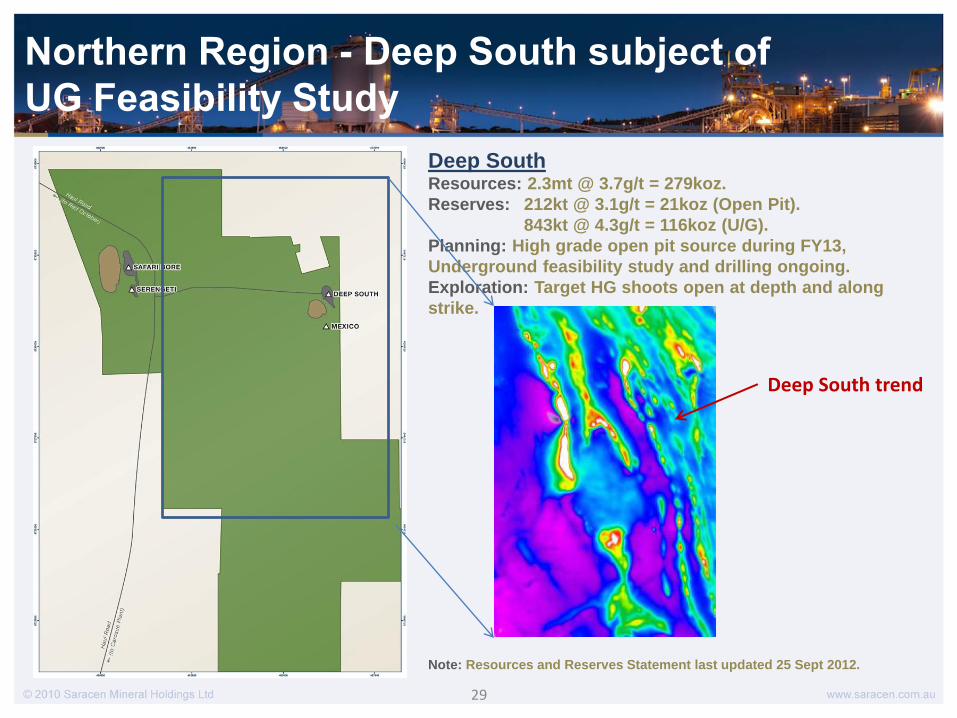
Deep South Resources: 2.3mt @ 3.7g/t = 279koz.
Reserves: 212kt @ 3.1g/t = 21koz (Open Pit).
843kt @ 4.3g/t = 116koz (U/G).
Planning: High grade open pit source during FY13,
Underground feasibility study and drilling ongoing.
Exploration: Target HG shoots open at depth and along
strike.
Note: Resources and Reserves Statement last updated 25 Sept 2012.
Deep South trend
Northern Region - Deep South subject of
UG Feasibility Study
30
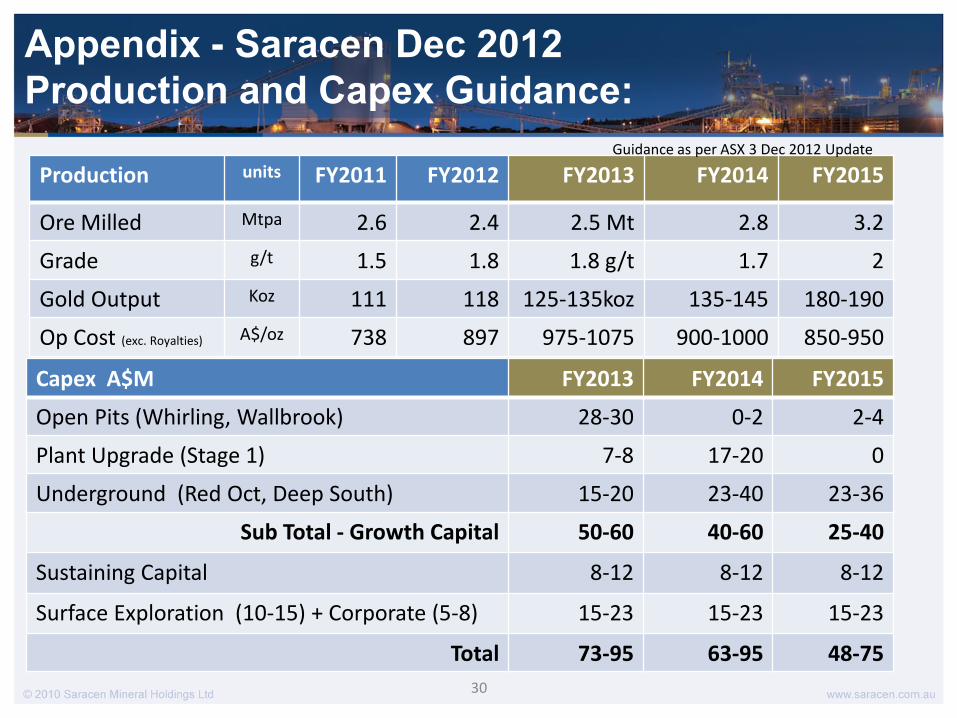
Appendix - Saracen Dec 2012
Production and Capex Guidance:
Production units FY2011 FY2012 FY2013 FY2014 FY2015
Ore Milled Mtpa 2.6 2.4 2.5 Mt 2.8 3.2
Grade g/t 1.5 1.8 1.8 g/t 1.7 2
Gold Output Koz 111 118 125-135koz 135-145 180-190
Op Cost (exc. Royalties) A$/oz 738 897 975-1075 900-1000 850-950
Guidance as per ASX 3 Dec 2012 Update
Capex A$M FY2013 FY2014 FY2015
Open Pits (Whirling, Wallbrook) 28-30 0-2 2-4
Plant Upgrade (Stage 1) 7-8 17-20 0
Underground (Red Oct, Deep South) 15-20 23-40 23-36
Sub Total - Growth Capital 50-60 40-60 25-40
Sustaining Capital 8-12 8-12 8-12
Surface Exploration (10-15) + Corporate (5-8) 15-23 15-23 15-23
Total 73-95 63-95 48-75
31
District Mine Type Category Tonnes Au grade Ounces
Measured 5,639,000 1.3 236,000
Indicated 16,478,000 1.3 697,000
Inferred 4,574,000 1.2 180,000
Total 26,691,000 1.3 1,113,000
Measured 0 0.0 0
Indicated 497,000 3.7 58,000
Inferred 755,000 3.0 73,000
Total 1,252,000 3.3 132,000
27,943,000 1.4 1,245,000
Measured 1,603,000 1.3 65,000
Indicated 22,894,000 1.2 859,000
Inferred 5,911,000 1.0 197,000
Total 30,407,000 1.1 1,121,000
Measured 0 0.0 0
Indicated 982,000 4.3 137,000
Inferred 316,000 3.4 34,000
Total 1,298,000 4.1 171,000
31,706,000 1.3 1,293,000
Measured 780,000 2.0 51,000
Indicated 2,023,000 2.4 157,000
Inferred 804,000 2.2 57,000
Total 3,607,000 2.3 266,000
Measured 0 0.0 0
Indicated 294,000 4.4 42,000
Inferred 782,000 4.6 116,000
Total 1,076,000 4.5 157,000
4,683,000 2.8 423,000
Measured 0 0.0 0
Indicated 4,474,000 1.8 255,000
Inferred 5,309,000 1.3 215,000
Total 9,784,000 1.5 470,000
Measured 0 0.0 0
Indicated 618,000 6.8 134,000
Inferred 32,000 2.9 3,000
Total 651,000 6.6 137,000
10,434,000 1.8 608,000
Stockpiles Measured 1,442,000 0.8 36,000
Measured 9,463,000 1.3 389,000
Indicated 45,869,000 1.3 1,969,000
Inferred 16,599,000 1.2 649,000
Total 71,931,000 1.3 3,006,000
Measured 0 0.0 0
Indicated 2,390,000 4.8 372,000
Inferred 1,886,000 3.7 226,000
Total 4,276,000 4.3 598,000
Measured 9,463,000 1.3 389,000
Indicated 48,259,000 1.5 2,340,000
Inferred 18,485,000 1.5 875,000
76,207,000 1.5 3,604,000
MINERAL RESOURCES
Open Pit &
Stockpiles
UndergroundMINERAL
RESOURCES
Total
GRAND TOTAL
Red October
Open Pit
Underground
Red October Total
Open Pit
Underground
Carosue Dam Total
Open Pit
Underground
Porphyry Total
Open Pit
Underground
Safari Bore Total
Carosue Dam
Porphyry
Safari Bore
Appendix – Resources & Reserves
tonnes g/t oz tonnes g/t oz tonnes g/t oz tonnes g/t oz
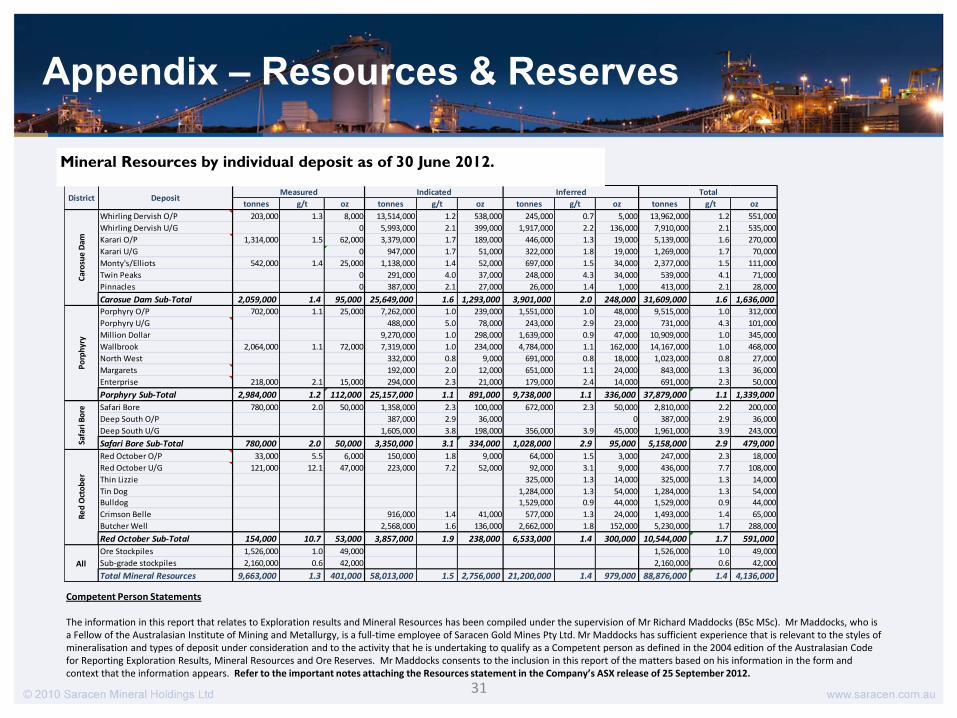
Whirling Dervish O/P 203,000 1.3 8,000 13,514,000 1.2 538,000 245,000 0.7 5,000 13,962,000 1.2 551,000
Whirling Dervish U/G 0 5,993,000 2.1 399,000 1,917,000 2.2 136,000 7,910,000 2.1 535,000
Karari O/P 1,314,000 1.5 62,000 3,379,000 1.7 189,000 446,000 1.3 19,000 5,139,000 1.6 270,000
Karari U/G 0 947,000 1.7 51,000 322,000 1.8 19,000 1,269,000 1.7 70,000
Monty's/Elliots 542,000 1.4 25,000 1,138,000 1.4 52,000 697,000 1.5 34,000 2,377,000 1.5 111,000
Twin Peaks 0 291,000 4.0 37,000 248,000 4.3 34,000 539,000 4.1 71,000
Pinnacles 0 387,000 2.1 27,000 26,000 1.4 1,000 413,000 2.1 28,000
Carosue Dam Sub-Total 2,059,000 1.4 95,000 25,649,000 1.6 1,293,000 3,901,000 2.0 248,000 31,609,000 1.6 1,636,000Porphyry O/P 702,000 1.1 25,000 7,262,000 1.0 239,000 1,551,000 1.0 48,000 9,515,000 1.0 312,000
Porphyry U/G 488,000 5.0 78,000 243,000 2.9 23,000 731,000 4.3 101,000
Million Dollar 9,270,000 1.0 298,000 1,639,000 0.9 47,000 10,909,000 1.0 345,000
Wallbrook 2,064,000 1.1 72,000 7,319,000 1.0 234,000 4,784,000 1.1 162,000 14,167,000 1.0 468,000
North West 332,000 0.8 9,000 691,000 0.8 18,000 1,023,000 0.8 27,000
Margarets 192,000 2.0 12,000 651,000 1.1 24,000 843,000 1.3 36,000
Enterprise 218,000 2.1 15,000 294,000 2.3 21,000 179,000 2.4 14,000 691,000 2.3 50,000
Porphyry Sub-Total 2,984,000 1.2 112,000 25,157,000 1.1 891,000 9,738,000 1.1 336,000 37,879,000 1.1 1,339,000
Safari Bore 780,000 2.0 50,000 1,358,000 2.3 100,000 672,000 2.3 50,000 2,810,000 2.2 200,000
Deep South O/P 387,000 2.9 36,000 0 387,000 2.9 36,000
Deep South U/G 1,605,000 3.8 198,000 356,000 3.9 45,000 1,961,000 3.9 243,000
Safari Bore Sub-Total 780,000 2.0 50,000 3,350,000 3.1 334,000 1,028,000 2.9 95,000 5,158,000 2.9 479,000
Red October O/P 33,000 5.5 6,000 150,000 1.8 9,000 64,000 1.5 3,000 247,000 2.3 18,000
Red October U/G 121,000 12.1 47,000 223,000 7.2 52,000 92,000 3.1 9,000 436,000 7.7 108,000
Thin Lizzie 325,000 1.3 14,000 325,000 1.3 14,000
Tin Dog 1,284,000 1.3 54,000 1,284,000 1.3 54,000
Bulldog 1,529,000 0.9 44,000 1,529,000 0.9 44,000
Crimson Belle 916,000 1.4 41,000 577,000 1.3 24,000 1,493,000 1.4 65,000
Butcher Well 2,568,000 1.6 136,000 2,662,000 1.8 152,000 5,230,000 1.7 288,000
Red October Sub-Total 154,000 10.7 53,000 3,857,000 1.9 238,000 6,533,000 1.4 300,000 10,544,000 1.7 591,000
Ore Stockpiles 1,526,000 1.0 49,000 1,526,000 1.0 49,000
Sub-grade stockpiles 2,160,000 0.6 42,000 2,160,000 0.6 42,000
Total Mineral Resources 9,663,000 1.3 401,000 58,013,000 1.5 2,756,000 21,200,000 1.4 979,000 88,876,000 1.4 4,136,000
Measured Indicated Inferred Total
All
Deposit District
Car
osu
e D
amSa
fari
Bo
reR
ed
Oct
ob
er
Po
rph
yry
Mineral Resources by individual deposit as of 30 June 2012.
Competent Person Statements The information in this report that relates to Exploration results and Mineral Resources has been compiled under the supervision of Mr Richard Maddocks (BSc MSc). Mr Maddocks, who is a Fellow of the Australasian Institute of Mining and Metallurgy, is a full-time employee of Saracen Gold Mines Pty Ltd. Mr Maddocks has sufficient experience that is relevant to the styles of mineralisation and types of deposit under consideration and to the activity that he is undertaking to qualify as a Competent person as defined in the 2004 edition of the Australasian Code for Reporting Exploration Results, Mineral Resources and Ore Reserves. Mr Maddocks consents to the inclusion in this report of the matters based on his information in the form and context that the information appears. Refer to the important notes attaching the Resources statement in the Company’s ASX release of 25 September 2012.
32
District Mine Type Category Tonnes Au grade Ounces
Measured 5,639,000 1.3 236,000
Indicated 16,478,000 1.3 697,000
Inferred 4,574,000 1.2 180,000
Total 26,691,000 1.3 1,113,000
Measured 0 0.0 0
Indicated 497,000 3.7 58,000
Inferred 755,000 3.0 73,000
Total 1,252,000 3.3 132,000
27,943,000 1.4 1,245,000
Measured 1,603,000 1.3 65,000
Indicated 22,894,000 1.2 859,000
Inferred 5,911,000 1.0 197,000
Total 30,407,000 1.1 1,121,000
Measured 0 0.0 0
Indicated 982,000 4.3 137,000
Inferred 316,000 3.4 34,000
Total 1,298,000 4.1 171,000
31,706,000 1.3 1,293,000
Measured 780,000 2.0 51,000
Indicated 2,023,000 2.4 157,000
Inferred 804,000 2.2 57,000
Total 3,607,000 2.3 266,000
Measured 0 0.0 0
Indicated 294,000 4.4 42,000
Inferred 782,000 4.6 116,000
Total 1,076,000 4.5 157,000
4,683,000 2.8 423,000
Measured 0 0.0 0
Indicated 4,474,000 1.8 255,000
Inferred 5,309,000 1.3 215,000
Total 9,784,000 1.5 470,000
Measured 0 0.0 0
Indicated 618,000 6.8 134,000
Inferred 32,000 2.9 3,000
Total 651,000 6.6 137,000
10,434,000 1.8 608,000
Stockpiles Measured 1,442,000 0.8 36,000
Measured 9,463,000 1.3 389,000
Indicated 45,869,000 1.3 1,969,000
Inferred 16,599,000 1.2 649,000
Total 71,931,000 1.3 3,006,000
Measured 0 0.0 0
Indicated 2,390,000 4.8 372,000
Inferred 1,886,000 3.7 226,000
Total 4,276,000 4.3 598,000
Measured 9,463,000 1.3 389,000
Indicated 48,259,000 1.5 2,340,000
Inferred 18,485,000 1.5 875,000
76,207,000 1.5 3,604,000
MINERAL RESOURCES
Open Pit &
Stockpiles
UndergroundMINERAL
RESOURCES
Total
GRAND TOTAL
Red October
Open Pit
Underground
Red October Total
Open Pit
Underground
Carosue Dam Total
Open Pit
Underground
Porphyry Total
Open Pit
Underground
Safari Bore Total
Carosue Dam
Porphyry
Safari Bore
Appendix – Resources & Reserves
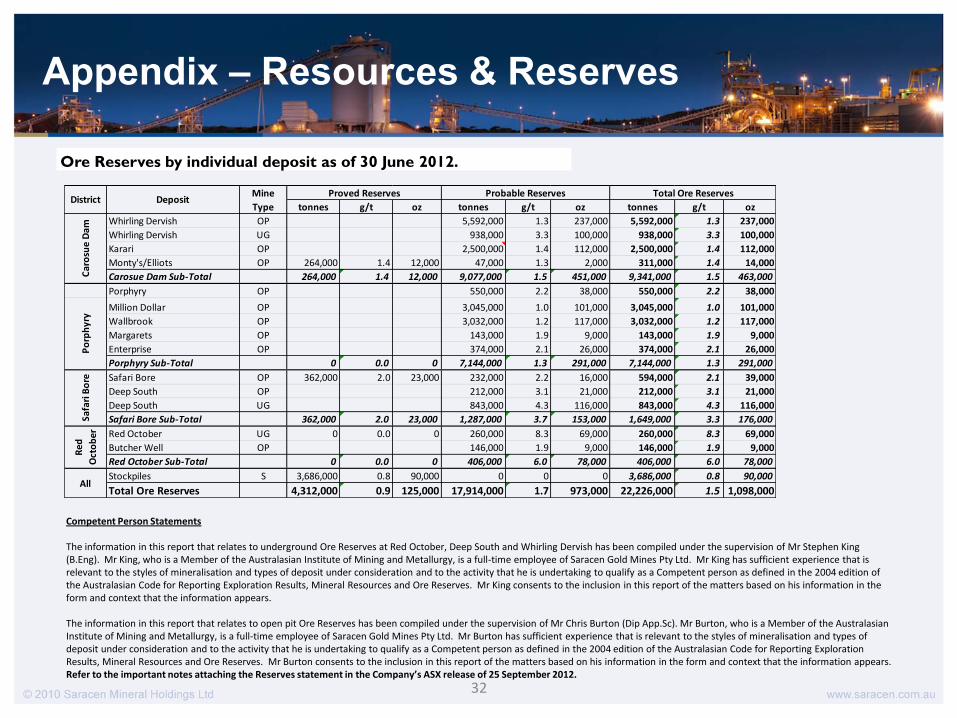
Competent Person Statements The information in this report that relates to underground Ore Reserves at Red October, Deep South and Whirling Dervish has been compiled under the supervision of Mr Stephen King (B.Eng). Mr King, who is a Member of the Australasian Institute of Mining and Metallurgy, is a full-time employee of Saracen Gold Mines Pty Ltd. Mr King has sufficient experience that is relevant to the styles of mineralisation and types of deposit under consideration and to the activity that he is undertaking to qualify as a Competent person as defined in the 2004 edition of the Australasian Code for Reporting Exploration Results, Mineral Resources and Ore Reserves. Mr King consents to the inclusion in this report of the matters based on his information in the form and context that the information appears. The information in this report that relates to open pit Ore Reserves has been compiled under the supervision of Mr Chris Burton (Dip App.Sc). Mr Burton, who is a Member of the Australasian Institute of Mining and Metallurgy, is a full-time employee of Saracen Gold Mines Pty Ltd. Mr Burton has sufficient experience that is relevant to the styles of mineralisation and types of deposit under consideration and to the activity that he is undertaking to qualify as a Competent person as defined in the 2004 edition of the Australasian Code for Reporting Exploration Results, Mineral Resources and Ore Reserves. Mr Burton consents to the inclusion in this report of the matters based on his information in the form and context that the information appears. Refer to the important notes attaching the Reserves statement in the Company’s ASX release of 25 September 2012.
tonnes g/t oz tonnes g/t oz tonnes g/t oz
Whirling Dervish OP 5,592,000 1.3 237,000 5,592,000 1.3 237,000
Whirling Dervish UG 938,000 3.3 100,000 938,000 3.3 100,000
Karari OP 2,500,000 1.4 112,000 2,500,000 1.4 112,000
Monty's/Elliots OP 264,000 1.4 12,000 47,000 1.3 2,000 311,000 1.4 14,000
Carosue Dam Sub-Total 264,000 1.4 12,000 9,077,000 1.5 451,000 9,341,000 1.5 463,000
Porphyry OP 550,000 2.2 38,000 550,000 2.2 38,000
Million Dollar OP 3,045,000 1.0 101,000 3,045,000 1.0 101,000
Wallbrook OP 3,032,000 1.2 117,000 3,032,000 1.2 117,000
Margarets OP 143,000 1.9 9,000 143,000 1.9 9,000
Enterprise OP 374,000 2.1 26,000 374,000 2.1 26,000
Porphyry Sub-Total 0 0.0 0 7,144,000 1.3 291,000 7,144,000 1.3 291,000
Safari Bore OP 362,000 2.0 23,000 232,000 2.2 16,000 594,000 2.1 39,000
Deep South OP 212,000 3.1 21,000 212,000 3.1 21,000
Deep South UG 843,000 4.3 116,000 843,000 4.3 116,000
Safari Bore Sub-Total 362,000 2.0 23,000 1,287,000 3.7 153,000 1,649,000 3.3 176,000
Red October UG 0 0.0 0 260,000 8.3 69,000 260,000 8.3 69,000
Butcher Well OP 146,000 1.9 9,000 146,000 1.9 9,000
Red October Sub-Total 0 0.0 0 406,000 6.0 78,000 406,000 6.0 78,000
Stockpiles S 3,686,000 0.8 90,000 0 0 0 3,686,000 0.8 90,000
Total Ore Reserves 4,312,000 0.9 125,000 17,914,000 1.7 973,000 22,226,000 1.5 1,098,000
Car
osu
e D
amSa
fari
Bo
reR
ed
Oct
ob
er
All
Po
rph
yry
Total Ore ReservesMine
TypeDistrict Deposit
Proved Reserves Probable Reserves
Ore Reserves by individual deposit as of 30 June 2012.
Saracen Mineral Holdings Ltd
Guido Staltari
Executive Chairman