SAP #BOBJ #BI 4.1 Upgrade Webcast Series 1: Value Proposition and Client Tools
47
© 2014 SAP AG or an SAP affiliate company. All rights reserved. 1 SAP BusinessObjects BI 4.1 Upgrade Webinar Series BI 4.1 Upgrade: Value Proposition and Client Tools Presenter: Henry Banks SAP Customer Experience Group Brought to you by the Customer Experience Group
-
Upload
sap-analytics -
Category
Sports
-
view
2.770 -
download
2
Transcript of SAP #BOBJ #BI 4.1 Upgrade Webcast Series 1: Value Proposition and Client Tools

© 2014 SAP AG or an SAP affiliate company. All rights reserved. 1
SAP BusinessObjects BI 4.1 Upgrade
Webinar Series
BI 4.1 Upgrade: Value Proposition
and Client Tools
Presenter: Henry Banks
SAP Customer Experience Group
Brought to you by the Customer Experience Group

© 2014 SAP AG or an SAP affiliate company. All rights reserved. 2
SAP BusinessObjects BI Platform 4.1 Upgrade
Enablement
We bring to you all that you need to
successfully upgrade to the SAP
BusinessObjects BI Platform 4.1.
On SCN, you can find a BI 4.1 Upgrade
Overview and other resources at:
http://scn.sap.com/docs/DOC-56525
Webinars will complement these
published resources:
http://scn.sap.com/docs/DOC-56308

BI4.1 Value Proposition Henry Banks
July 2014
Customer
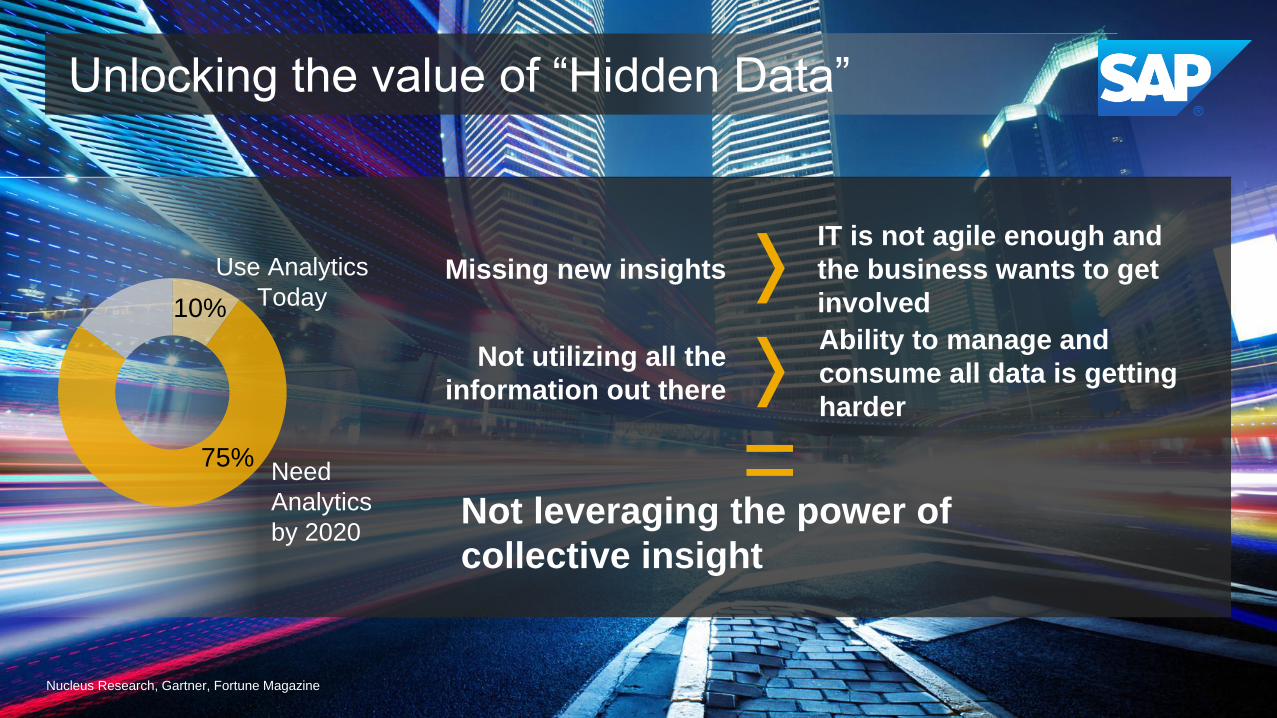
10%
75%
Use Analytics
Today
Need
Analytics
by 2020
Nucleus Research, Gartner, Fortune Magazine
Unlocking the value of “Hidden Data”
Ability to manage and
consume all data is getting
harder
Not utilizing all the
information out there
Not leveraging the power of
collective insight
Missing new insights
IT is not agile enough and
the business wants to get
involved
=

5 © 2014 SAP AG or an SAP affiliate company. All rights reserved.
Nucleus Research, Gartner, Forbes, Fortune Magazine, Forrester
The Forrester Wave™: Self-Service Business Intelligence Platforms, Q2 2012
Key Trends shaping the future of BI
33% 80%
of BI consumed on handhelds
in 2013
of information needs handled
by end users
$1
$10.66
Spent on BI Return
>10x ROI

6 © 2014 SAP AG or an SAP affiliate company. All rights reserved.
Top Reasons to upgrade to SAP BI 4.1
Enable Answers
on the Go
Deliver Governed Data
Discovery & BI to the
Entire Team
Get the most out of
your BI Solution

Analytics solutions from SAP
Agile
Visualization
Advanced
Analytics
Big Data
Mobile
Collaboration
Cloud
Enterprise
Business Intelligence

Value Drivers of SAP BusinessObjects BI4.1
Native
SAP
HANA support
Designed to
support
future
innovations
Mobile
Upgrade Ready
Reduced
TCO
DeskI
Compatibility
Native
SAP
BW support
Focus on
Quality

© 2014 SAP AG or an SAP affiliate company. All rights reserved. 9
Native SAP HANA support
• Support of HANA by every BI Client of the SAP BusinessObjects BI4.1 Suite
• Platform Integration with Native HANA supported BI Clients as Design
Studio, Analysis Office and Lumira
• Combine SAP HANA data with any other data source using Multi Source
Universes
• No performance degradation

© 2014 SAP AG or an SAP affiliate company. All rights reserved. 10
Mobile
• Embedded within installer & Central Management Console
• Support of ALL SAP BusinessObjects Client tools
• Integrated Explorer support including Exploration Views
• Support of SAP Lumira Cloud and SAP Lumira Server
• Support for every Web Application Server and OS as recorded in PAM for the
BI Platform
• Removal of legacy Third Party Communication Layer

© 2014 SAP AG or an SAP affiliate company. All rights reserved. 11
Native SAP BW support
• SAP BW Business Intelligence Connection Service (BICS) connection
embedded in BI Platform
• No need for BW JAVA deployment to SAP BusinessObjects BI4.1 Clients to
SAP BW
• Improved performance for reporting against BW*
• Query Stripping and Auto Refresh by BI CLients
* Depending on BW Version

© 2014 SAP AG or an SAP affiliate company. All rights reserved. 12
Reduced TCO
• Available as Cloud Deployment in public and private cloud options
• Ability to generate Multi Source Universes
• Leverage any investment made in SAP BW for reporting by BI4.1
• Backup without Down Time
• Embedded Monitoring Functionality including integration to SAP Solution Manager,
IBM Tivoli and JMX clients
• Embedded Promotion Management
• Improved Auditing Engine
• Enabled for parallel patching and on-going improvements for Near Zero Downtime
• Support of ALL SAP BI Clients in a single platform

© 2014 SAP AG or an SAP affiliate company. All rights reserved. 13
Designed to support future innovations
• 64 Bits Server Architecture to support modern Hardware
• Building up for Near Zero Downtime
• Full support for Virtualization
• Platform Integration with Analysis Office, Design Studio, Lumira and Lumira Server
• Support for Big Data sources as Hadoop Hive and Amazon EMR
• HTML 5 Clients and Mobile Content
• Common (extendable) Chart Engine for BI Clients
• Universe Support for the Latest and New Databases
© 2014 SAP AG or an SAP affiliate company. All rights reserved. 14
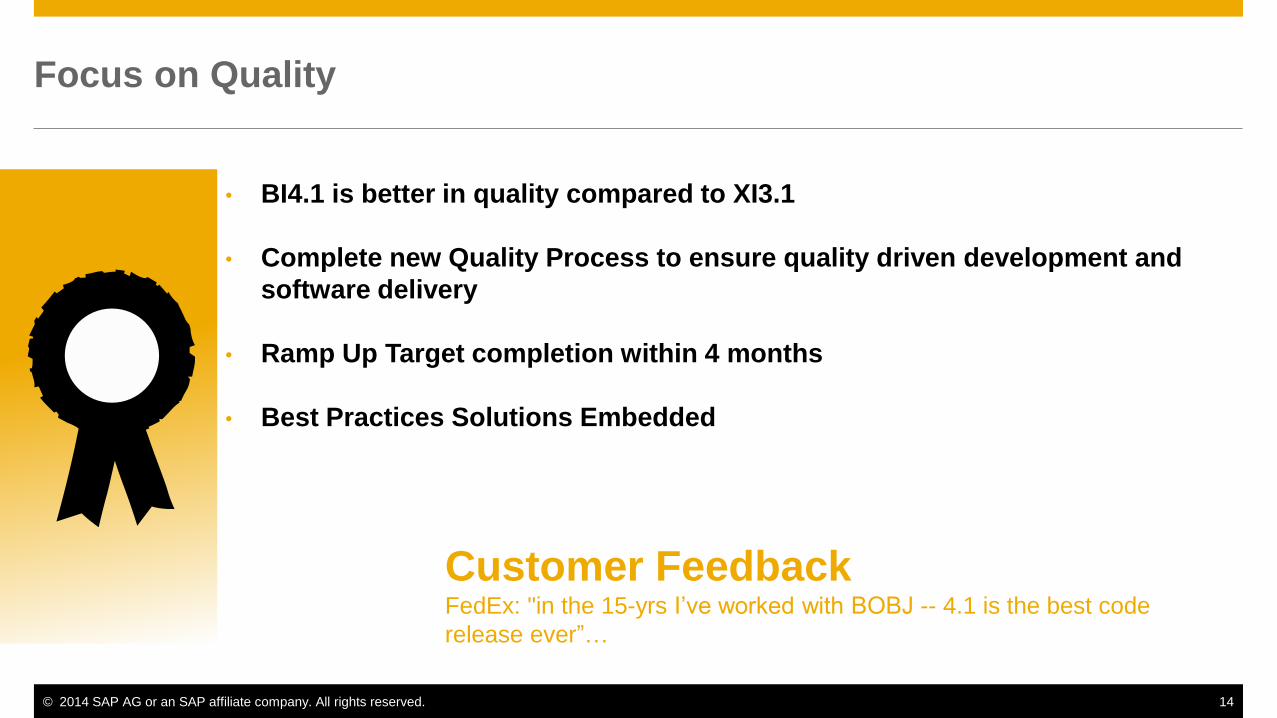
Focus on Quality
• BI4.1 is better in quality compared to XI3.1
• Complete new Quality Process to ensure quality driven development and
software delivery
• Ramp Up Target completion within 4 months
• Best Practices Solutions Embedded
Customer Feedback FedEx: "in the 15-yrs I’ve worked with BOBJ -- 4.1 is the best code
release ever”…

© 2014 SAP AG or an SAP affiliate company. All rights reserved. 15
Upgrade Ready
• Upgrade Management Tool is a dedicated product to upgrade XIR2 and XI3x
content to BI4.1
• Improved upgrade performance
• Support for Incremental* and Full upgrades
• Available as Command Line or by GUI*
* Windows Only

© 2014 SAP AG or an SAP affiliate company. All rights reserved. 16
Desktop Intelligence Compatibility
• Ability to upgrade Desktop Intelligence Documents into BI4.1 CMS
• Ability to manage and secure Desktop Intelligence Documents in BI4.1
Central Management Console
• Ability to connect Desktop Intelligence Client to BI4.1 CMS*
• Improved Report Conversion Tool for higher conversion success
* As of XI3.1 SP6 Fixpack 6.1
Customer Feedback Arun District Council: “DeskI compatibility is exactly what we needed. It
worked nicely”…

© 2014 SAP AG or an SAP affiliate company. All rights reserved. 17
0
Complete end-to-end analytics
solution
#1 leader in analytics
65,000+ analytics customers
7,000+ Partners with proven
track record of success
The SAP Difference

Choosing the right BI Client tool Henry Banks
July 2014

© 2014 SAP AG or an SAP affiliate company. All rights reserved. 19
Securely distribute information across your organization
Answer related questions by interacting with pre-defined reports
Build printable reports for operational efficiency
Distribute Information
SAP Analytics Solutions One Suite for All Insight
Reporting Agile
Visualization
Discover areas to optimize your business
Adapt data to business needs
Tell your story with beautiful visualizations
Discover. Predict. Create.
Deliver engaging information to users where they need it
Track key performance indicators and summary data
Build custom experiences - users get what they need quickly
Build Engaging Experiences
Agile
Visualization
Enterprise BI
Dashboards and
Apps
Enterprise BI
Reporting
© 2014 SAP AG or an SAP affiliate company. All rights reserved. 20
Dashboards
and Apps Reporting
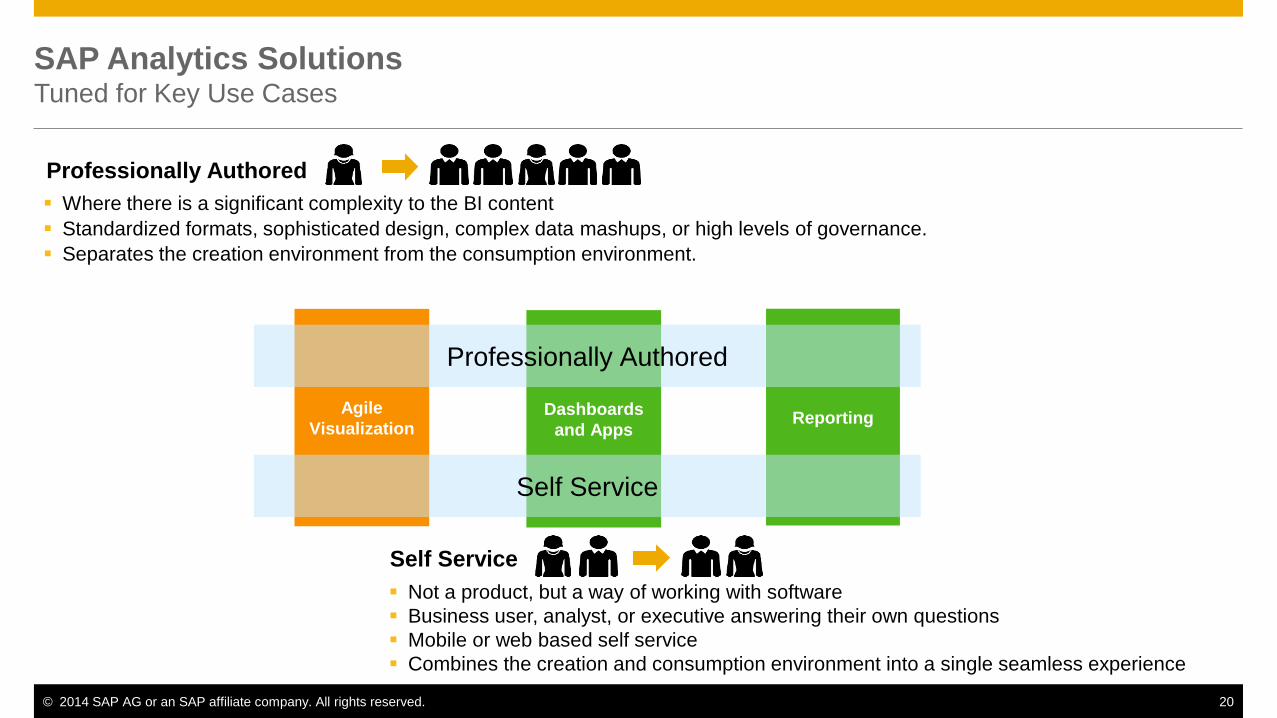
SAP Analytics Solutions Tuned for Key Use Cases
Agile
Visualization
Where there is a significant complexity to the BI content
Standardized formats, sophisticated design, complex data mashups, or high levels of governance.
Separates the creation environment from the consumption environment.
Not a product, but a way of working with software
Business user, analyst, or executive answering their own questions
Mobile or web based self service
Combines the creation and consumption environment into a single seamless experience
Agile
Visualization
Self Service
Professionally Authored
Professionally Authored
Self Service
© 2014 SAP AG or an SAP affiliate company. All rights reserved. 21
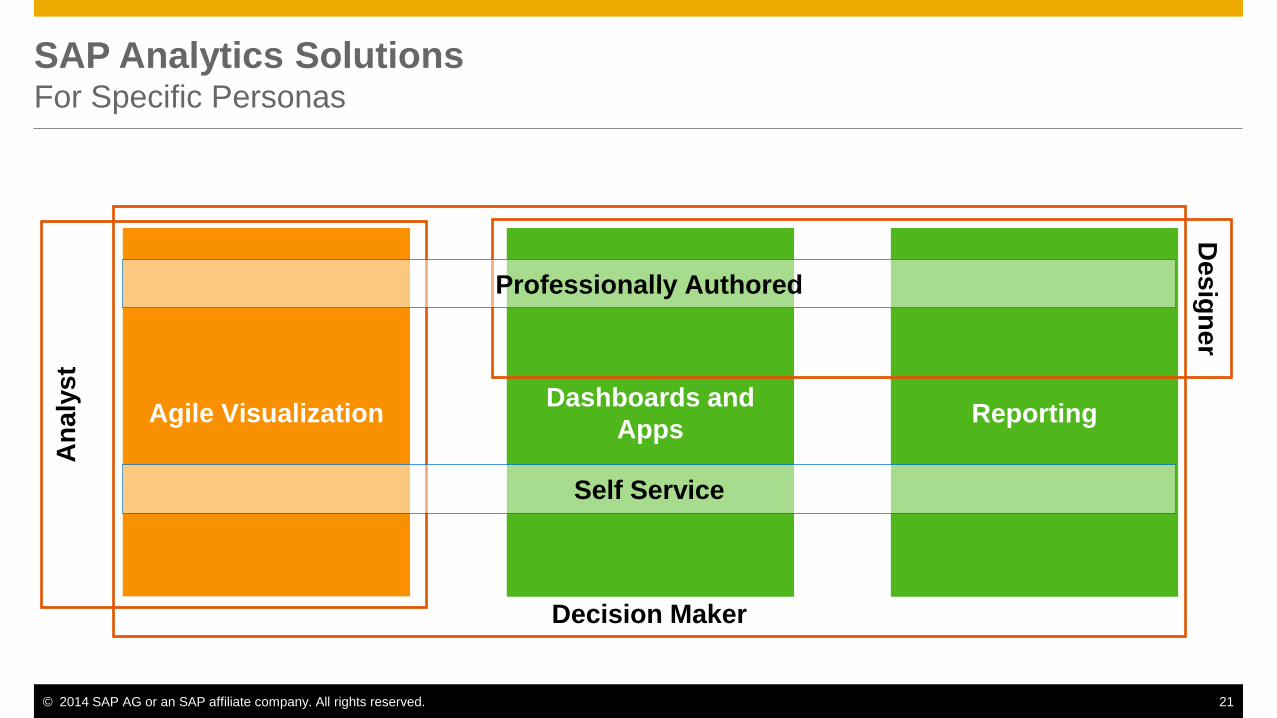
SAP Analytics Solutions For Specific Personas
Reporting Agile Visualization
Dashboards and
Apps Reporting
Decision Maker
An
aly
st
De
sig
ne
r
Professionally Authored
Self Service
© 2014 SAP AG or an SAP affiliate company. All rights reserved. 22
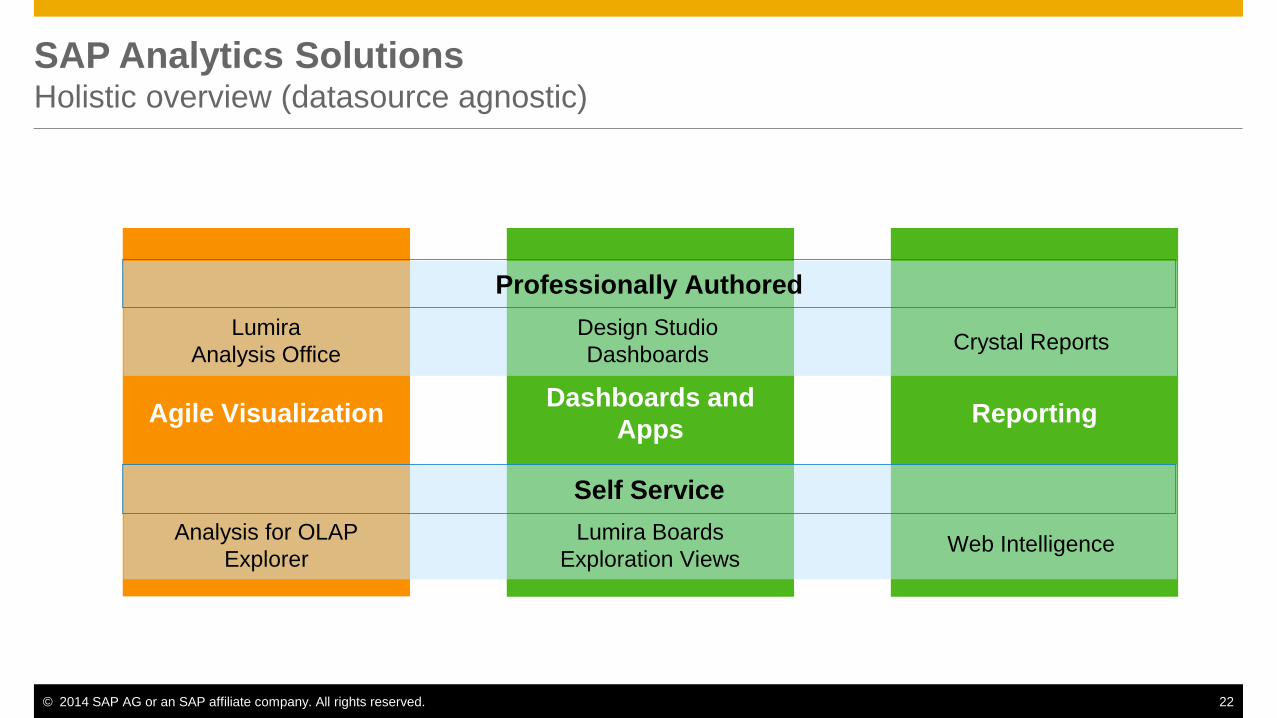
SAP Analytics Solutions Holistic overview (datasource agnostic)
Reporting Agile Visualization
Dashboards and
Apps Reporting
Professionally Authored
Self Service
Lumira
Analysis Office
Design Studio
Dashboards
Analysis for OLAP
Explorer
Lumira Boards
Exploration Views Web Intelligence
Crystal Reports

© 2014 SAP AG or an SAP affiliate company. All rights reserved. 23
SAP Crystal Reports for formatted reports
Access nearly any data source directly
Build reports that look exactly the way you
want through pixel-perfect positioning,
layout and templates
Powerful API to embed reports into
applications
Optimized for high-volume reporting and
publishing
Overview
Build pixel-perfect formatted reports for printing and operational reporting

© 2014 SAP AG or an SAP affiliate company. All rights reserved. 24
SAP BusinessObjects Web Intelligence for self-service query and reporting
Market-leading self service reporting solution
for rapid report creation
Support for multi-source semantic layer to
bring together different sources of information
– without having to know the DB structure or
SQL
Content accessible from anywhere: Mobile,
Web, Desktop
Overview
Quickly build ad-hoc queries and reports without a knowledge of SQL or the underlying data structure

© 2014 SAP AG or an SAP affiliate company. All rights reserved. 25
SAP BusinessObjects Dashboards for building custom dashboards on any data
Build rich, interactive dashboards and visualizations
Broad visualization library to support KPIs and
executive dashboards
Leverage enterprise BI infrastructure with support
for the semantic layer
Recommended for use on 3rd party data sources
Overview
Provides a rich set of visualizations and controls to build highly interactive dashboards on third-party data sources

© 2014 SAP AG or an SAP affiliate company. All rights reserved. 26
SAP BusinessObjects Design Studio for building analytic applications on BW and HANA
Modern development environment and HTML5
runtime
Native BW and HANA support
Growing library of controls
Recommended for HANA and BW customers
Overview
Provides a development environment that contains a broad library of controls and visualizations to build analytic
applications on BW and HANA

© 2014 SAP AG or an SAP affiliate company. All rights reserved. 27
SAP BusinessObjects Explorer for business users to quickly access information on their own
Provide business users with a simple experience to independently ask and answer business questions on the fly
Quickly and easily explore your data using search
Easily visualize your data
Geographic and Time awareness
Build simple, interactive views (Exploration views)
Mobile ready
Overview
© 2014 SAP AG or an SAP affiliate company. All rights reserved. 28
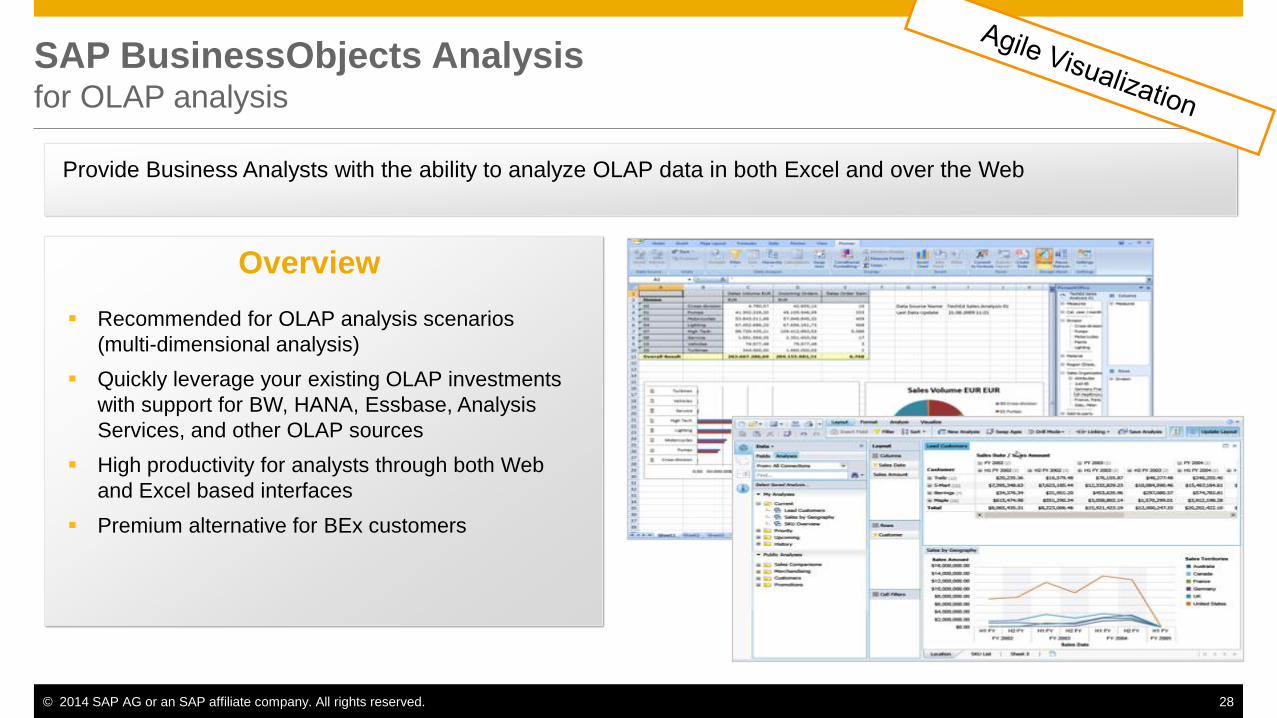
SAP BusinessObjects Analysis for OLAP analysis
Recommended for OLAP analysis scenarios
(multi-dimensional analysis)
Quickly leverage your existing OLAP investments
with support for BW, HANA, Essbase, Analysis
Services, and other OLAP sources
High productivity for analysts through both Web
and Excel based interfaces
Premium alternative for BEx customers
Overview
Provide Business Analysts with the ability to analyze OLAP data in both Excel and over the Web

© 2014 SAP AG or an SAP affiliate company. All rights reserved. 29
SAP Lumira to unleash business analyst creativity
Provides the freedom to understand your data, personalize it, and create beautiful content
Overview Download and install on your
desktop in less than 5 minutes
Insight from many data sources
Combine, manipulate and enrich
data to apply it to your business
scenarios
Self-service visualizations and
analytics to tell your story
Optimized for SAP HANA for real-
time on detailed data
Boards allow for dashboards to be
assembled from existing
visualizations

© 2014 SAP AG or an SAP affiliate company. All rights reserved. 30
Agile Visualization Compared
Data acquisition and mashups from multiple data sources including HANA
Supports Universe semantic layer and SAP Business Suite
Data manipulation – cleansing and grouping.
Rich visualizations
Desktop deployment
Data acquisition from HANA and BW
Data mashups via BW Workspaces (require BW 7.3 on HANA)
Excel based visualizations
Rich hierarchical data functionality. Full access to all BW metadata.
Excel and Powerpoint Addin
Data acquisition from HANA, BW, MS Analysis Services, Oracle OLAP, Essbase
Rich hierarchical data functionality
Web based deployment
Simple, consistent UI
Enables broad based data access with little training requirements
Exploration views enables self-service dashboards
Web based and mobile solution
More Capability
Easier to Adopt
De
cis
ion
Ma
ke
r A
naly
st SAP Lumira
Analysis for Office
Analysis for OLAP
Explorer

© 2014 SAP AG or an SAP affiliate company. All rights reserved. 31
Simplification and Integration Plans As Of Q1 2014
SAP Lumira
Explorer
Analysis for Office
Analysis for OLAP
SAP Lumira
SAP Lumira desktop
Lumira Server
Analysis Office
Design Studio
Design Studio
Web Intelligence Web Intelligence
Crystal Reports Crystal Reports
Dashboards
Incremental improvements
Incremental improvements
Analysis for OLAP Incremental improvements
Converge Dashboards with Design Studio per public SoD and
integrate with SAP Lumira
Add interoperability with Lumira
Add server to enable sharing
Remove Flash and add to SAP Lumira Server
Dashboards Incremental improvements
Key Points
Lumira transitions
from a desktop product
to an integrated product
family that is included in
the BI Suite license
Key Points
No products are
deprecated or end-of-
lifed.
All products continue to
be fully supported for
the life of the BI 4.x
platform.
Explorer

Selecting the Right Client Based on Product Capabilities
© 2014 SAP AG or an SAP affiliate company. All rights reserved. 33
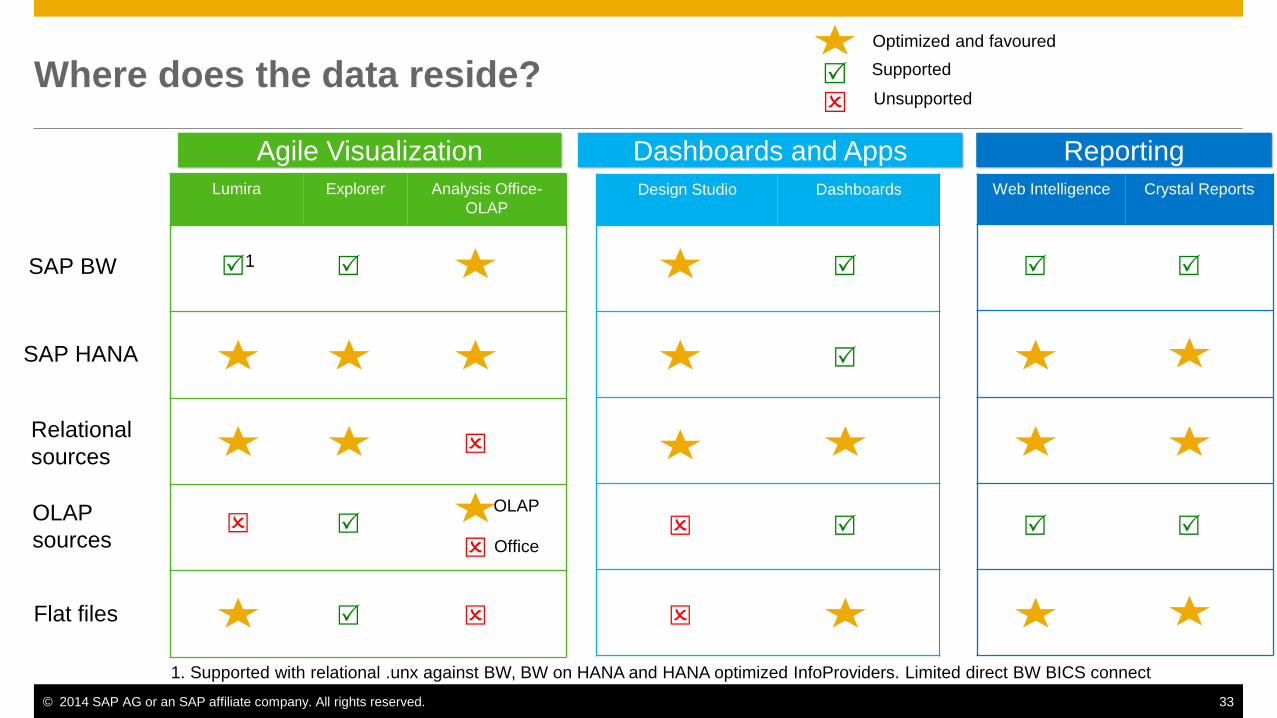
Where does the data reside?
Reporting Agile Visualization Dashboards and Apps
SAP BW
SAP HANA
Relational
sources
OLAP
sources
Flat files
Web Intelligence Crystal Reports
Design Studio Dashboards
Lumira Explorer Analysis Office-
OLAP
1
Optimized and favoured
Supported
Unsupported
OLAP
Office
1. Supported with relational .unx against BW, BW on HANA and HANA optimized InfoProviders. Limited direct BW BICS connect

© 2014 SAP AG or an SAP affiliate company. All rights reserved. 34
Selecting the Right SAP BusinessObjects BI Client Comparing Product Capabilities
Crystal Reports
for Enterprise Web Intelligence Dashboards Design Studio
Analysis for
Office
Analysis for
OLAP Lumira Explorer
Highly formatted reporting
Parameterized & Dynamic Layout
Self – Service
Hierarchical capabilities
Data Visualization
Product Interoperability
Guided Navigation
Mobile Reporting 1 1 2
Supported Not Supported 1. With Design Studio 2. With Explorer and Lumira Cloud
© 2014 SAP AG or an SAP affiliate company. All rights reserved. 35
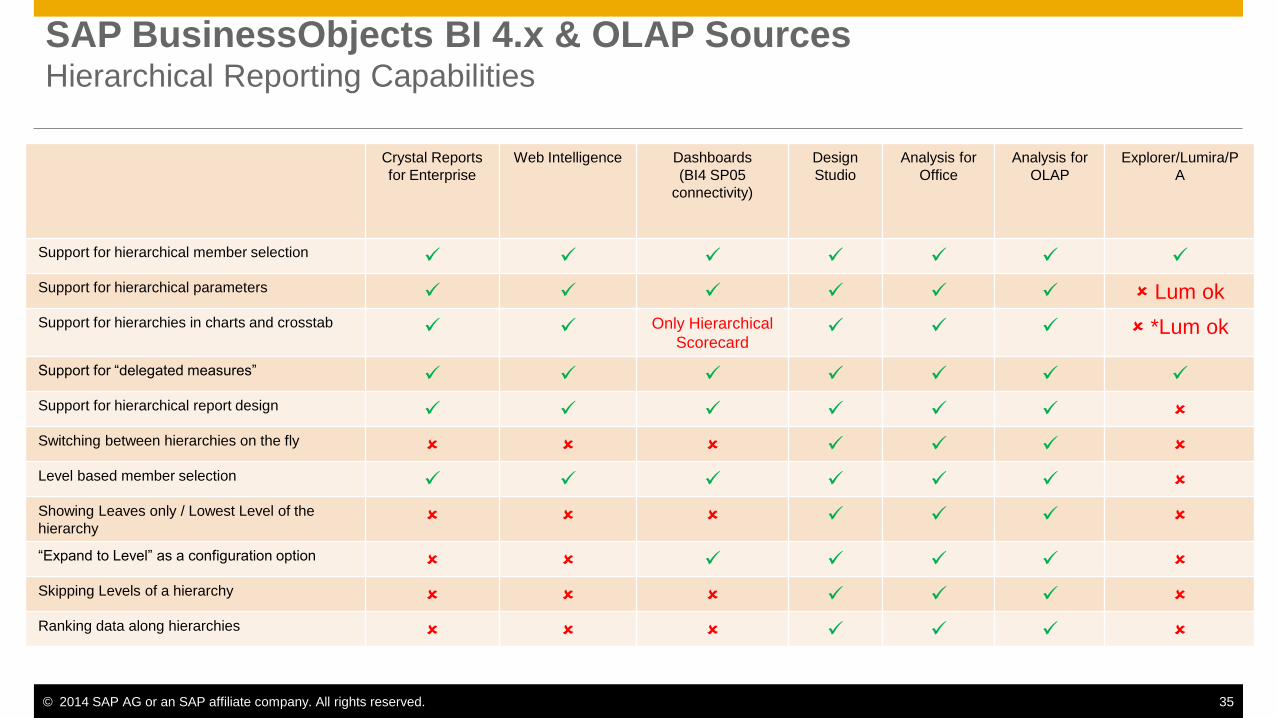
SAP BusinessObjects BI 4.x & OLAP Sources Hierarchical Reporting Capabilities
Crystal Reports
for Enterprise
Web Intelligence Dashboards
(BI4 SP05
connectivity)
Design
Studio
Analysis for
Office
Analysis for
OLAP
Explorer/Lumira/P
A
Support for hierarchical member selection
Support for hierarchical parameters Lum ok
Support for hierarchies in charts and crosstab Only Hierarchical
Scorecard *Lum ok
Support for “delegated measures”
Support for hierarchical report design
Switching between hierarchies on the fly
Level based member selection
Showing Leaves only / Lowest Level of the
hierarchy
“Expand to Level” as a configuration option
Skipping Levels of a hierarchy
Ranking data along hierarchies

© 2014 SAP AG or an SAP affiliate company. All rights reserved. 36
Where is the content created?
Reporting Agile Visualization Dashboards and Apps
Design Studio
Dashboards
Web Intelligence
Analysis OLAP
Explorer
Lumira
Analysis Office
Predictive Analysis
Lumira
Web Intelligence
Crystal Reports
Discover. Predict. Create. Build Engaging Experiences Distribute Information

© 2014 SAP AG or an SAP affiliate company. All rights reserved. 37
Where is the content consumed?
Reporting Agile Visualization Dashboards and Apps
Design Studio
Dashboards
Discover. Predict. Create. Build Engaging Experiences Distribute Information
Design Studio
Dashboards
Web Intelligence
Crystal Reports
Analysis OLAP
Explorer
Lumira
Analysis Office
Predictive Analysis
Lumira
Design Studio
Dashboards
Web Intelligence
Crystal Reports
Explorer
Lumira
Web Intelligence
Crystal Reports

Selecting the Right Client Based on Your Audience

© 2014 SAP AG or an SAP affiliate company. All rights reserved. 39
Who creates the content?
Reporting Agile Visualization Dashboards and Apps
Design Studio
Dashboards
Crystal Reports
Web Intelligence
Web Intelligence
Analysis Office/OLAP
Predictive Analysis
Explorer
Lumira
Designer
Analyst
Discover. Predict. Create. Build Engaging Experiences Distribute Information

© 2014 SAP AG or an SAP affiliate company. All rights reserved. 40
Who consumes the content?
Reporting Agile Visualization Dashboards and Apps
Design Studio1
Dashboards
Web Intelligence
Crystal Reports
Design Studio
Dashboards
Web Intelligence
Crystal Reports
Analysis Office/OLAP
Predictive Analysis2
Explorer
Lumira
Explorer
Lumira
1. Content consumed in Design Studio output, not the Design Studio IDE itself.
Analyst
Decision Maker
Discover. Predict. Create. Build Engaging Experiences Distribute Information
Selecting the Right SAP BusinessObjects BI Client
… based on your business requirements

© 2014 SAP AG or an SAP affiliate company. All rights reserved. 42
Selecting the Right SAP BusinessObjects BI Client Comparing Product Capabilities
Crystal
Reports for
Enterprise
Web
Intelligence Dashboards Design Studio
Analysis,
Edition for
Microsoft
Office
Analysis,
edition for
OLAP
Lumira Explorer
Usage of Hierarchies
Using BEx Query Structures
Microsoft Excel as client
Internet Browser as client
Creating calculations
Multiple Source in one report
Supported Not Supported

© 2014 SAP AG or an SAP affiliate company. All rights reserved. 43
Selecting the Right SAP BusinessObjects BI Client Comparing Product Capabilities
Crystal
Reports for
Enterprise
Web
Intelligence Dashboards Design Studio
Analysis for
Office
Analysis for
OLAP Lumira Explorer
Offline Capabilities
Mobile Reporting
Distribution via eMail
(Broadcasting)
Edit the report
Change the “view” of the data
What-if scenarios
Data enrichment
Supported Not Supported
© 2014 SAP AG or an SAP affiliate company. All rights reserved. 44
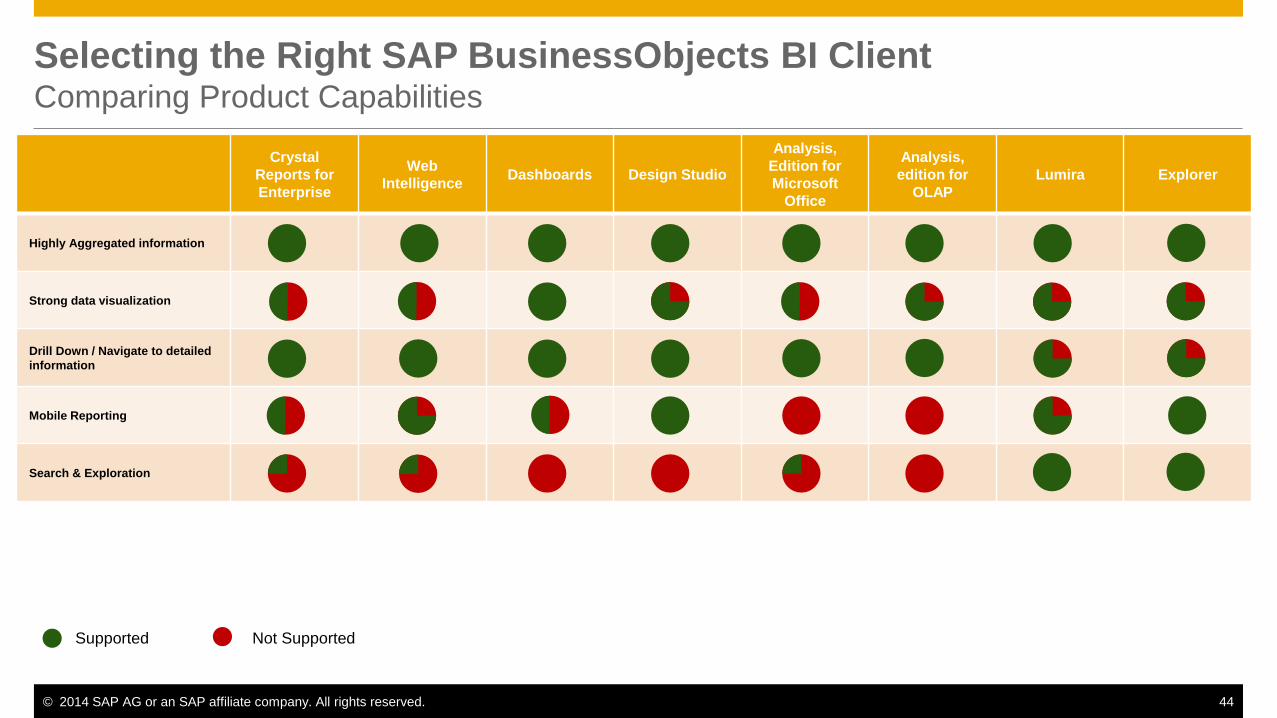
Selecting the Right SAP BusinessObjects BI Client Comparing Product Capabilities
Crystal
Reports for
Enterprise
Web
Intelligence Dashboards Design Studio
Analysis,
Edition for
Microsoft
Office
Analysis,
edition for
OLAP
Lumira Explorer
Highly Aggregated information
Strong data visualization
Drill Down / Navigate to detailed
information
Mobile Reporting
Search & Exploration
Supported Not Supported

© 2014 SAP AG or an SAP affiliate company. All rights reserved. 45
Your BI Strategy should start with the business requirements, not with the DWH.
Key Learnings
Start by defining your requirements and your desired outcome.
Focus on the business pain points by area. One use-case after the other – not all at once
Understand your audience. Let them describe their workflow. Listen !
Remember – Your BI Strategy starts with the business requirements.. Not with the DWH

© 2014 SAP AG or an SAP affiliate company. All rights reserved. 46
Key Links
sap.com/upgradebi
sap.com/learnbi
sap.com/bivirtualization
sap.com/bisizing
service.sap.com/roadmap
sapbusinessobjectsbi.com
Getting started with SAP BI
How to Select the Right BI Tool for Your Environment
SAP’s Release Strategy for Major Releases of SAP BusinessObjects BI

© 2014 SAP AG or an SAP affiliate company. All rights reserved.
Thank you
For Comments & Questions:
Henry Banks – Customer Experience Group
Email: [email protected]


![BOBJ X!4 Admin Guide[1]](https://static.fdocuments.us/doc/165x107/547e034eb4af9f0f248b4596/bobj-x4-admin-guide1.jpg)