São Paulo, July 24, 2013 Natura Cosméticos S.A. (BM ... · Natura. In addition to the SOU line,...
20
Earnings Release 2Q13 São Paulo, July 24, 2013 – Natura Cosméticos S.A. (BM&FBOVESPA: NATU3) announces today its results for the second quarter of 2013 (2Q13). Except where stated otherwise, the financial and operating information in this release is presented on a consolidated basis, in accordance with International Financial Reporting Standards (IFRS).
Transcript of São Paulo, July 24, 2013 Natura Cosméticos S.A. (BM ... · Natura. In addition to the SOU line,...
Earnings Release 2Q13
0
São Paulo, July 24, 2013 – Natura Cosméticos S.A. (BM&FBOVESPA: NATU3)
announces today its results for the second quarter of 2013 (2Q13). Except where
stated otherwise, the financial and operating information in this release is presented
on a consolidated basis, in accordance with International Financial Reporting
Standards (IFRS).

Earnings Release 2Q13
1
The International Operations maintain robust revenue growth and profitability, while in
Brazil the outlook is for growth to accelerate over the second half of the year
In the second quarter of 2013, Natura registered growth on the year-ago period of 6.7% in
consolidated net revenue, 4.7% in EBITDA1 and 11.7% in net income.
In Brazil, revenue growth in the quarter fell short of our expectations, especially in June, affected
mainly by the lower pace of orders from consultants and the lower-than-expected impact from
launches in the period.
We reaffirm our expectation of growth accelerating over the next few months, driven by our
innovation plan and higher marketing investments.
In the first half of July, we launched liquid soaps and body moisturizers of the SOU line, which, with
its innovative and unique proposal of conscientious consumption, will allow us to enter a market
segment as of yet unexplored that has significant potential to generate incremental revenue for
Natura. In addition to the SOU line, in the second half of the year, we are planning more launches of
cosmetic and fragrance products that should leave us more competitive in these categories.
We will also intensify our marketing investments to have more frequent orders from our Consultants.
This measure builds on the initiatives implemented over the last few months aimed at expanding the
shopping basket of our consumers, such as the MAIS Natura Program, to which we recently made a
few adjustments to encourage the lower sales volume consultants to place orders. The increase in
these investments will be financed by our cost efficiency program.
In the International Operations, we posted strong revenue growth and significant profitability gains
(EBITDA margin of 16.6% in 2Q13, versus 5.3% a year earlier)2. The group of countries in
consolidation posted net revenue growth of 38.9% in local currency in 2Q13, which was accompanied
by excellent channel indicators in our Argentina Operation. The Operations in Implementation
registered growth of 19.7% in local currency in 2Q13, with the Mexico Operation recovering
supported by the recent improvements made to the Sustainable Relations Network model.
We remain confident in achieving progress on the projects that will enable us, on the one hand, to
evolve and modernize the relationships with our network through the use of digital technologies and,
on the other hand, to expand the value offering through new brands and categories connected with
the concept of Well Being Well, in turn expanding the value proposition and our company’s presence.
1 Refers to pro-forma EBITDA 2 EBITDA margin of the Operations in Consolidation and in Implementation excluding the corporate structure in Argentina, the operation in France and Aesop

Earnings Release 2Q13
2
In February, we
concluded the
acquisition of the
Australian company
AESOP. To improve
comparisons, the
table does not
include the effects
from the
consolidation of this
acquisition or the
associated costs.
The table on the right
presents consolidated
data including the
effects from the
consolidation of
Aesop, concluded in
February 2013, and
the associated
transaction costs
Consolidated EBITDA margin contracted slightly by 50 basis points in the quarter. The lower dilution
of fixed expenses and higher marketing investments in Brazil were partially mitigated by the
nonrecurring effects and positive results in the International Operations.
Internal free cash flow in the first six months of 2013 was R$508.7 million, increasing 12% on the
prior year period. This internal cash generation was invested in higher working capital needs and in
capex. Working capital needs increased due to the temporary higher inventory levels and different
installment payment scheme for the Valentine’s Day cycle, which unusually increased our accounts
receivable balance. In the case of investments in property, plant and equipment and intangible
assets, the distribution of disbursements in 2013 was different than in 2012, with a higher
concentration in the first half of the year (R$186.2 million in 6M13 compared to R$97.1 million in
6M12). We reaffirm our guidance calling for investments in the full year of R$450.0 million (R$437.4
million in 2012). The combination of these factors led to free cash flow of R$12.2 million (R$432.9
million in 2012).
2Q13 2Q12 6M13 6M12
Brazil Gross Revenue 1,981.9 1,928.0 2.8 3,578.6 3,468.1 3.2
International Gross Revenue 302.9 220.7 37.3 528.1 392.7 34.5
Consolidated Gross Revenue ex. Acquisition 2,284.8 2,148.7 6.3 4,106.6 3,860.8 6.4
Brazil Net Revenue 1,450.7 1,434.3 1.1 2,615.2 2,574.5 1.6
International Net Revenue* 236.6 174.0 36.0 412.8 309.6 33.3
Consolidated Net Revenue ex. Acquisition 1,687.3 1,608.3 4.9 3,028.0 2,884.1 5.0
% Share International Net Revenue 14.0% 10.8% 3.2 pp 13.6% 10.7% 2.9 pp
Brazil pro-forma EBITDA 395.6 401.9 (1.6) 665.1 686.8 (3.1)
% Brazil pro-forma EBITDA Margin 27.3% 28.0% (0.8) pp 25.4% 26.7% (1.2) pp
International pro-forma EBITDA 12.1 (10.3) (217.2) 9.0 (23.0) (139.2)
% International pro-forma EBITDA Margin 5.1% (5.9)% 11.0 pp 2.2% (7.4)% 9.6 pp
EBITDA ex. Acquisition 407.7 391.6 4.1 674.2 663.7 1.6
% Consolidated EBITDA Margin ex. Acquisition 24.2% 24.3% (0.2) pp 22.3% 23.0% (0.7) pp
*Growth in local currency of 31,5% in 2Q13 vs 2Q12 and 25,1% in 6M13 vs 6M12
(R$ million)
1Q13 1Q12 6M13 6M12
Consolidated Net Revenue 1,715.8 1,608.3 6.7 3,067.1 2,884.1 6.3
Consolidated EBITDA 409.9 391.6 4.7 671.9 663.7 1.2
% Consolidated EBITDA Margin 23.9% 24.3% (0.5) pp 21.9% 23.0% (1.1) pp
Consolidated Net Income 240.2 215.1 11.7 364.8 366.6 (0.5)
% Consolidated Net Margin 14.0% 13.4% 0.6 pp 11.9% 12.7% (0.8) pp
Internal cash generation 310.1 264.1 17.4 508.7 454.2 12.0
Free Cash Generation 122.3 305.3 (60.0) 12.2 432.9 (97.2)
Net Debt / EBITDA n/a n/a n/a 0.75 0.43
(R$ million)
Earnings Release 2Q13
3
1. cosmetics, fragrance and toiletries
industry
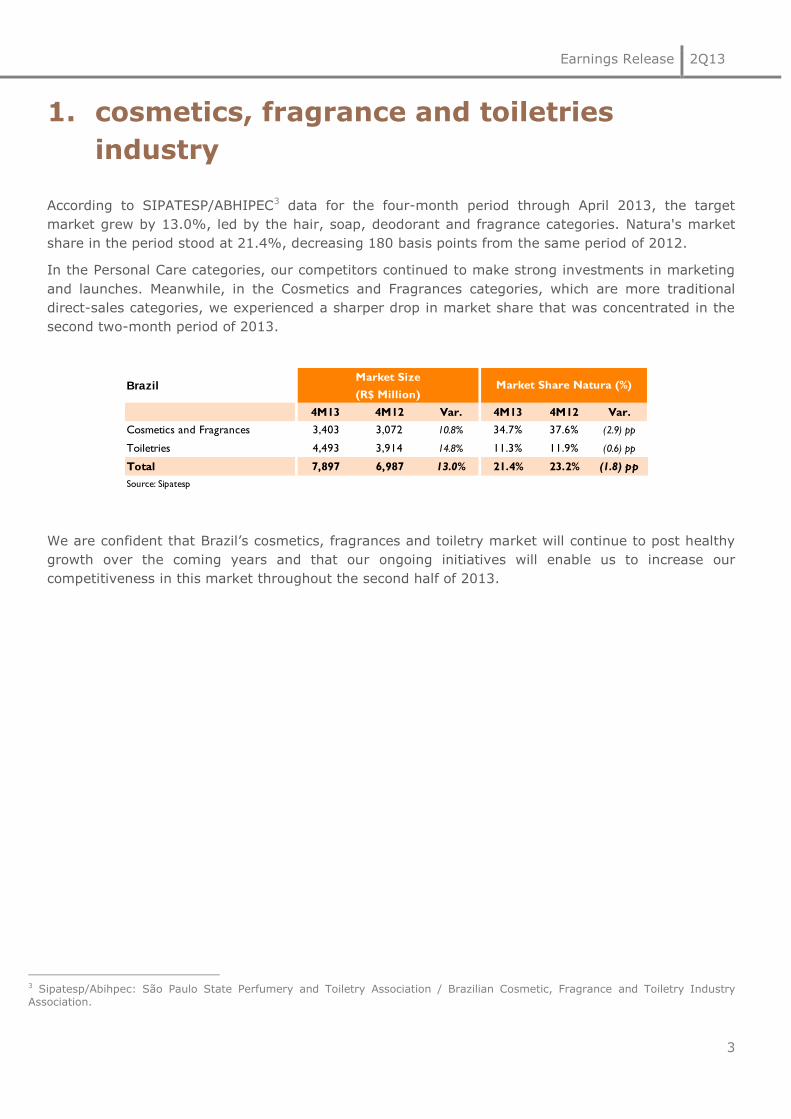
According to SIPATESP/ABHIPEC3 data for the four-month period through April 2013, the target
market grew by 13.0%, led by the hair, soap, deodorant and fragrance categories. Natura's market
share in the period stood at 21.4%, decreasing 180 basis points from the same period of 2012.
In the Personal Care categories, our competitors continued to make strong investments in marketing
and launches. Meanwhile, in the Cosmetics and Fragrances categories, which are more traditional
direct-sales categories, we experienced a sharper drop in market share that was concentrated in the
second two-month period of 2013.
We are confident that Brazil’s cosmetics, fragrances and toiletry market will continue to post healthy
growth over the coming years and that our ongoing initiatives will enable us to increase our
competitiveness in this market throughout the second half of 2013.
3 Sipatesp/Abihpec: São Paulo State Perfumery and Toiletry Association / Brazilian Cosmetic, Fragrance and Toiletry Industry Association.
4M13 4M12 Var. 4M13 4M12 Var.
Cosmetics and Fragrances 3,403 3,072 10.8% 34.7% 37.6% (2.9) pp
Toiletries 4,493 3,914 14.8% 11.3% 11.9% (0.6) pp
Total 7,897 6,987 13.0% 21.4% 23.2% (1.8) pp
Source: Sipatesp
BrazilMarket Size
(R$ Million)Market Share Natura (%)

Earnings Release 2Q13
4
2. social and environmental highlights
In July, Natura received, for the sixth consecutive year, the IR Magazine Awards Brazil Award for
“Best Social and Environmental Sustainability.” The award, which is one of many organized around
the world by IR Magazine/Cross Border, recognizes best practices in relations with the capital
markets, with the winners selected based on surveys of investment professionals.
The social and environmental targets for 2013 and the actual results through 2Q13 are presented
below:
The result for the climate change indicator was in line with the target for the quarter. For the
second half of 2013, we expect lower relative emissions than in the first half, due to the sale of
products with lower relative emissions, such as the SOU line.
The good result for solid waste generation in the quarter was mainly due to the reduction in
product disposal. The other indicators presented results in line with expectations.
Indicator
* Refers to 1Q13.
** Indicator refers to compensation and purchase of raw materials.
*** Considers Natura and other partners.
2012 Results 2013 Commitment 2Q13 Results
Greenhouse gas (GHG) emissionsReduction of 28.4% over
2006
Reduce relative greenhouse gas (GHG) emissions by 33% over
2006
Reduction of 28.3% over
2006*
Water consumption 0.40 liter/ unit produced Reduce to 0.39 liter/ unit produced in Brazil 0.39 liter / unit produced
Solid Waste25.56 grams / unit
produced
Maintain quantity of solid waste generated per unit produced in
Brazil at 24.70 grams
20.99 grams/unit
produced
Collections Crer para Ver R$ 12.8 millionAchieve R$14.0 million sales from Crer para Ver product line in
BrazilR$ 6.5 million
Funding to Supplier Communities ** R$ 12.1 million Distribute R$13.6 million in wealth to supplier communities R$ 5.9 million
Business volume in the Amazon region*** R$ 121.8 million56.0% increase in business volume in the Amazon region to
R$190 million in 2013R$ 78 million
Earnings Release 2Q13
5
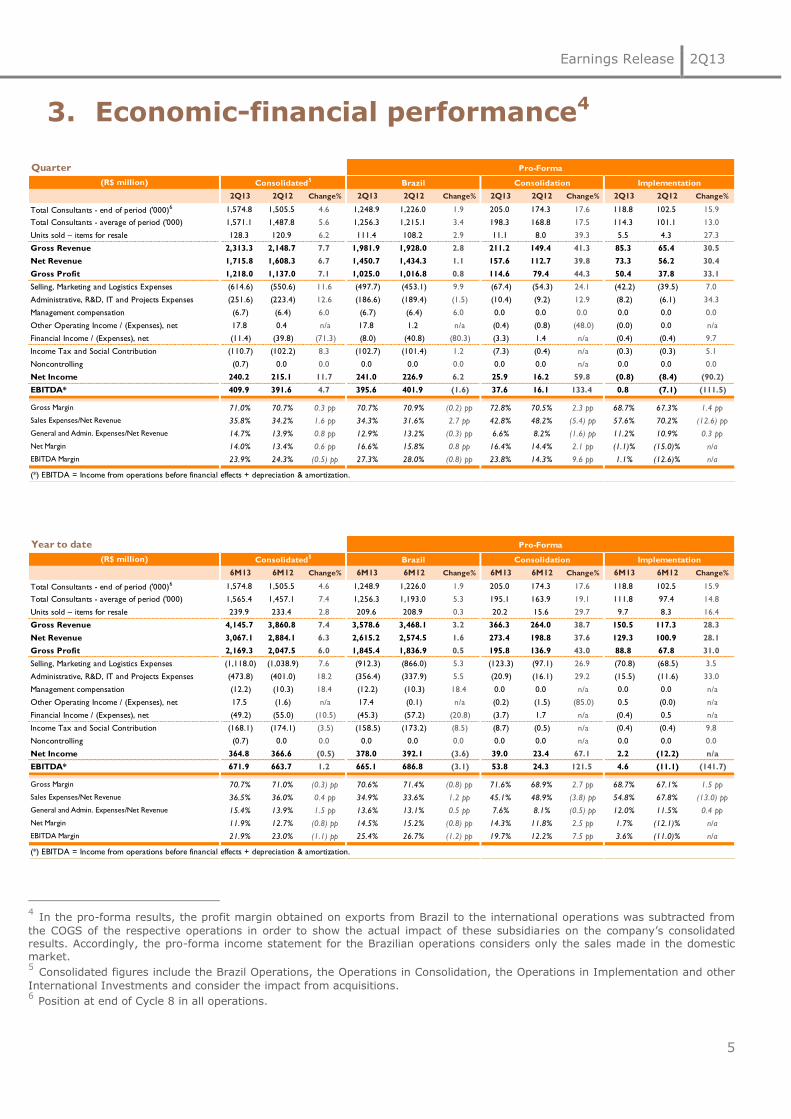
3. Economic-financial performance456
4 In the pro-forma results, the profit margin obtained on exports from Brazil to the international operations was subtracted from
the COGS of the respective operations in order to show the actual impact of these subsidiaries on the company’s consolidated results. Accordingly, the pro-forma income statement for the Brazilian operations considers only the sales made in the domestic market. 5 Consolidated figures include the Brazil Operations, the Operations in Consolidation, the Operations in Implementation and other
International Investments and consider the impact from acquisitions. 6 Position at end of Cycle 8 in all operations.
Quarter Pro-Forma Pro-Forma
(R$ million) Consolidated5 Brazil Consolidation Implementation Novos Negócios
2Q13 2Q12 Change% 2Q13 2Q12 Change% 2Q13 2Q12 Change% 2Q13 2Q12 Change%
Total Consultants - end of period ('000)6 1,574.8 1,505.5 4.6 1,248.9 1,226.0 1.9 205.0 174.3 17.6 118.8 102.5 15.9
Total Consultants - average of period ('000) 1,571.1 1,487.8 5.6 1,256.3 1,215.1 3.4 198.3 168.8 17.5 114.3 101.1 13.0
Units sold – items for resale 128.3 120.9 6.2 111.4 108.2 2.9 11.1 8.0 39.3 5.5 4.3 27.3
Gross Revenue 2,313.3 2,148.7 7.7 1,981.9 1,928.0 2.8 211.2 149.4 41.3 85.3 65.4 30.5
Net Revenue 1,715.8 1,608.3 6.7 1,450.7 1,434.3 1.1 157.6 112.7 39.8 73.3 56.2 30.4
Gross Profit 1,218.0 1,137.0 7.1 1,025.0 1,016.8 0.8 114.6 79.4 44.3 50.4 37.8 33.1
Selling, Marketing and Logistics Expenses (614.6) (550.6) 11.6 (497.7) (453.1) 9.9 (67.4) (54.3) 24.1 (42.2) (39.5) 7.0
Administrative, R&D, IT and Projects Expenses (251.6) (223.4) 12.6 (186.6) (189.4) (1.5) (10.4) (9.2) 12.9 (8.2) (6.1) 34.3
Management compensation (6.7) (6.4) 6.0 (6.7) (6.4) 6.0 0.0 0.0 0.0 0.0 0.0 0.0
Other Operating Income / (Expenses), net 17.8 0.4 n/a 17.8 1.2 n/a (0.4) (0.8) (48.0) (0.0) 0.0 n/a
Financial Income / (Expenses), net (11.4) (39.8) (71.3) (8.0) (40.8) (80.3) (3.3) 1.4 n/a (0.4) (0.4) 9.7
Income Tax and Social Contribution (110.7) (102.2) 8.3 (102.7) (101.4) 1.2 (7.3) (0.4) n/a (0.3) (0.3) 5.1
Noncontrolling (0.7) 0.0 0.0 0.0 0.0 0.0 0.0 0.0 n/a 0.0 0.0 0.0
Net Income 240.2 215.1 11.7 241.0 226.9 6.2 25.9 16.2 59.8 (0.8) (8.4) (90.2)
EBITDA* 409.9 391.6 4.7 395.6 401.9 (1.6) 37.6 16.1 133.4 0.8 (7.1) (111.5)
Gross Margin 71.0% 70.7% 0.3 pp 70.7% 70.9% (0.2) pp 72.8% 70.5% 2.3 pp 68.7% 67.3% 1.4 pp
Sales Expenses/Net Revenue 35.8% 34.2% 1.6 pp 34.3% 31.6% 2.7 pp 42.8% 48.2% (5.4) pp 57.6% 70.2% (12.6) pp
General and Admin. Expenses/Net Revenue 14.7% 13.9% 0.8 pp 12.9% 13.2% (0.3) pp 6.6% 8.2% (1.6) pp 11.2% 10.9% 0.3 pp
Net Margin 14.0% 13.4% 0.6 pp 16.6% 15.8% 0.8 pp 16.4% 14.4% 2.1 pp (1.1)% (15.0)% n/a
EBITDA Margin 23.9% 24.3% (0.5) pp 27.3% 28.0% (0.8) pp 23.8% 14.3% 9.6 pp 1.1% (12.6)% n/a
(*) EBITDA = Income from operations before financial effects + depreciation & amortization.
Year to date Pro-Forma Pro-Forma
(R$ million) Consolidated5 Brazil Consolidation Implementation Novos Negócios
6M13 6M12 Change% 6M13 6M12 Change% 6M13 6M12 Change% 6M13 6M12 Change%
Total Consultants - end of period ('000)6 1,574.8 1,505.5 4.6 1,248.9 1,226.0 1.9 205.0 174.3 17.6 118.8 102.5 15.9
Total Consultants - average of period ('000) 1,565.4 1,457.1 7.4 1,256.3 1,193.0 5.3 195.1 163.9 19.1 111.8 97.4 14.8
Units sold – items for resale 239.9 233.4 2.8 209.6 208.9 0.3 20.2 15.6 29.7 9.7 8.3 16.4
Gross Revenue 4,145.7 3,860.8 7.4 3,578.6 3,468.1 3.2 366.3 264.0 38.7 150.5 117.3 28.3
Net Revenue 3,067.1 2,884.1 6.3 2,615.2 2,574.5 1.6 273.4 198.8 37.6 129.3 100.9 28.1
Gross Profit 2,169.3 2,047.5 6.0 1,845.4 1,836.9 0.5 195.8 136.9 43.0 88.8 67.8 31.0
Selling, Marketing and Logistics Expenses (1,118.0) (1,038.9) 7.6 (912.3) (866.0) 5.3 (123.3) (97.1) 26.9 (70.8) (68.5) 3.5
Administrative, R&D, IT and Projects Expenses (473.8) (401.0) 18.2 (356.4) (337.9) 5.5 (20.9) (16.1) 29.2 (15.5) (11.6) 33.0
Management compensation (12.2) (10.3) 18.4 (12.2) (10.3) 18.4 0.0 0.0 n/a 0.0 0.0 n/a
Other Operating Income / (Expenses), net 17.5 (1.6) n/a 17.4 (0.1) n/a (0.2) (1.5) (85.0) 0.5 (0.0) n/a
Financial Income / (Expenses), net (49.2) (55.0) (10.5) (45.3) (57.2) (20.8) (3.7) 1.7 n/a (0.4) 0.5 n/a
Income Tax and Social Contribution (168.1) (174.1) (3.5) (158.5) (173.2) (8.5) (8.7) (0.5) n/a (0.4) (0.4) 9.8
Noncontrolling (0.7) 0.0 0.0 0.0 0.0 0.0 0.0 0.0 n/a 0.0 0.0 0.0
Net Income 364.8 366.6 (0.5) 378.0 392.1 (3.6) 39.0 23.4 67.1 2.2 (12.2) n/a
EBITDA* 671.9 663.7 1.2 665.1 686.8 (3.1) 53.8 24.3 121.5 4.6 (11.1) (141.7)
Gross Margin 70.7% 71.0% (0.3) pp 70.6% 71.4% (0.8) pp 71.6% 68.9% 2.7 pp 68.7% 67.1% 1.5 pp
Sales Expenses/Net Revenue 36.5% 36.0% 0.4 pp 34.9% 33.6% 1.2 pp 45.1% 48.9% (3.8) pp 54.8% 67.8% (13.0) pp
General and Admin. Expenses/Net Revenue 15.4% 13.9% 1.5 pp 13.6% 13.1% 0.5 pp 7.6% 8.1% (0.5) pp 12.0% 11.5% 0.4 pp
Net Margin 11.9% 12.7% (0.8) pp 14.5% 15.2% (0.8) pp 14.3% 11.8% 2.5 pp 1.7% (12.1)% n/a
EBITDA Margin 21.9% 23.0% (1.1) pp 25.4% 26.7% (1.2) pp 19.7% 12.2% 7.5 pp 3.6% (11.0)% n/a
(*) EBITDA = Income from operations before financial effects + depreciation & amortization.
Earnings Release 2Q13
6
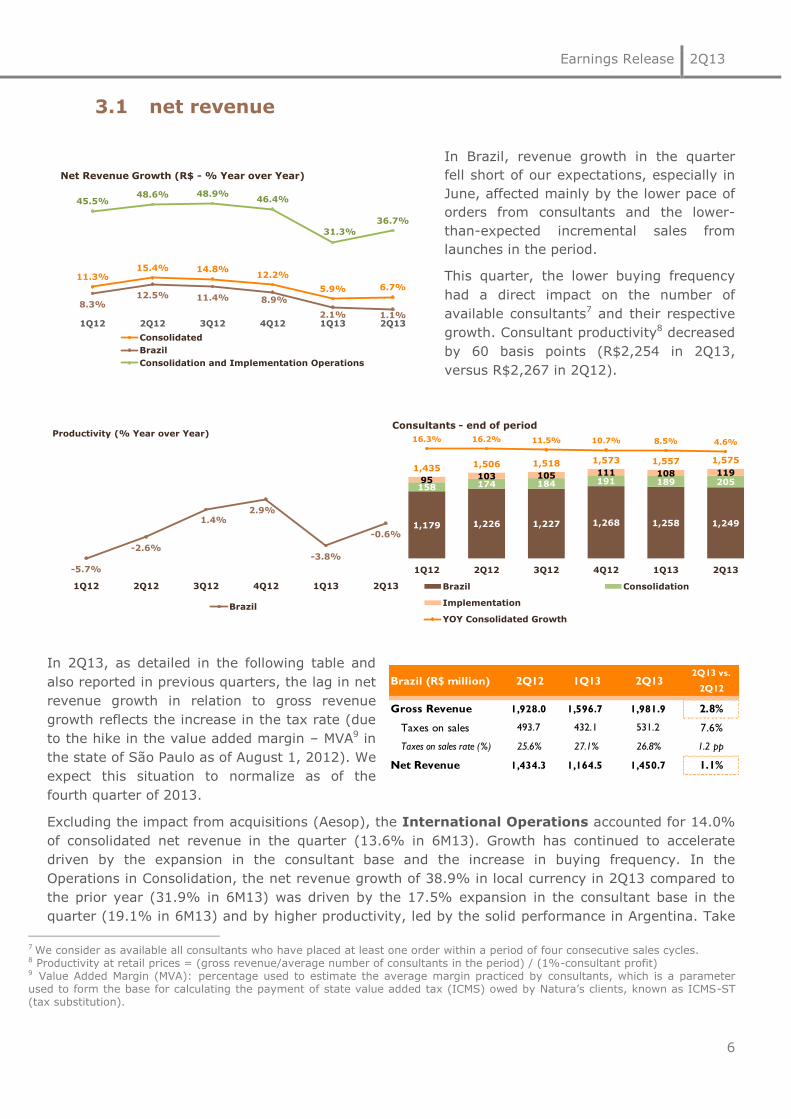
3.1 net revenue
In Brazil, revenue growth in the quarter
fell short of our expectations, especially in
June, affected mainly by the lower pace of
orders from consultants and the lower-
than-expected incremental sales from
launches in the period.
This quarter, the lower buying frequency
had a direct impact on the number of
available consultants7 and their respective
growth. Consultant productivity8 decreased
by 60 basis points (R$2,254 in 2Q13,
versus R$2,267 in 2Q12).
In 2Q13, as detailed in the following table and
also reported in previous quarters, the lag in net
revenue growth in relation to gross revenue
growth reflects the increase in the tax rate (due
to the hike in the value added margin – MVA9 in
the state of São Paulo as of August 1, 2012). We
expect this situation to normalize as of the
fourth quarter of 2013.
Excluding the impact from acquisitions (Aesop), the International Operations accounted for 14.0%
of consolidated net revenue in the quarter (13.6% in 6M13). Growth has continued to accelerate
driven by the expansion in the consultant base and the increase in buying frequency. In the
Operations in Consolidation, the net revenue growth of 38.9% in local currency in 2Q13 compared to
the prior year (31.9% in 6M13) was driven by the 17.5% expansion in the consultant base in the
quarter (19.1% in 6M13) and by higher productivity, led by the solid performance in Argentina. Take
7 We consider as available all consultants who have placed at least one order within a period of four consecutive sales cycles. 8 Productivity at retail prices = (gross revenue/average number of consultants in the period) / (1%-consultant profit) 9 Value Added Margin (MVA): percentage used to estimate the average margin practiced by consultants, which is a parameter used to form the base for calculating the payment of state value added tax (ICMS) owed by Natura’s clients, known as ICMS-ST (tax substitution).
11.3%15.4% 14.8%
12.2%
5.9% 6.7%
8.3%12.5% 11.4% 8.9%
2.1% 1.1%
45.5%48.6% 48.9%
46.4%
31.3%
36.7%
1Q12 2Q12 3Q12 4Q12 1Q13 2Q13
Net Revenue Growth (R$ - % Year over Year)
Consolidated
Brazil
Consolidation and Implementation Operations
Brazil (R$ million) 2Q12 1Q13 2Q132Q13 vs.
2Q122T12 1T13 2T13
Gross Revenue 1,928.0 1,596.7 1,981.9 2.8%
Taxes on sales 493.7 432.1 531.2 7.6%
Taxes on sales rate (%) 25.6% 27.1% 26.8% 1.2 pp
Net Revenue 1,434.3 1,164.5 1,450.7 1.1%
-5.7%
-2.6%
1.4%2.9%
-3.8%
-0.6%
1Q12 2Q12 3Q12 4Q12 1Q13 2Q13
Productivity (% Year over Year)
Brazil
1,179 1,226 1,227 1,268 1,258 1,249
158 174 184 191 189 20595 103 105 111 108 1191,435 1,506 1,518 1,573 1,557 1,575
16.3% 16.2% 11.5% 10.7% 8.5% 4.6%
1Q12 2Q12 3Q12 4Q12 1Q13 2Q13
Consultants - end of period
Brazil Consolidation
Implementation
YOY Consolidated Growth
Earnings Release 2Q13
7
into account that in 2Q12, the Argentina operation was impacted by high levels of out-of-stock
products caused by import difficulties in that period. In the Operations in Implementation, which
posted net revenue growth of 19.7% in local currency in the quarter (15.1% in 6M13), the
adjustments made since 1Q13 to Mexico’s Sustainable Relations Network have already leveraged an
increase in buying frequency by consultants.
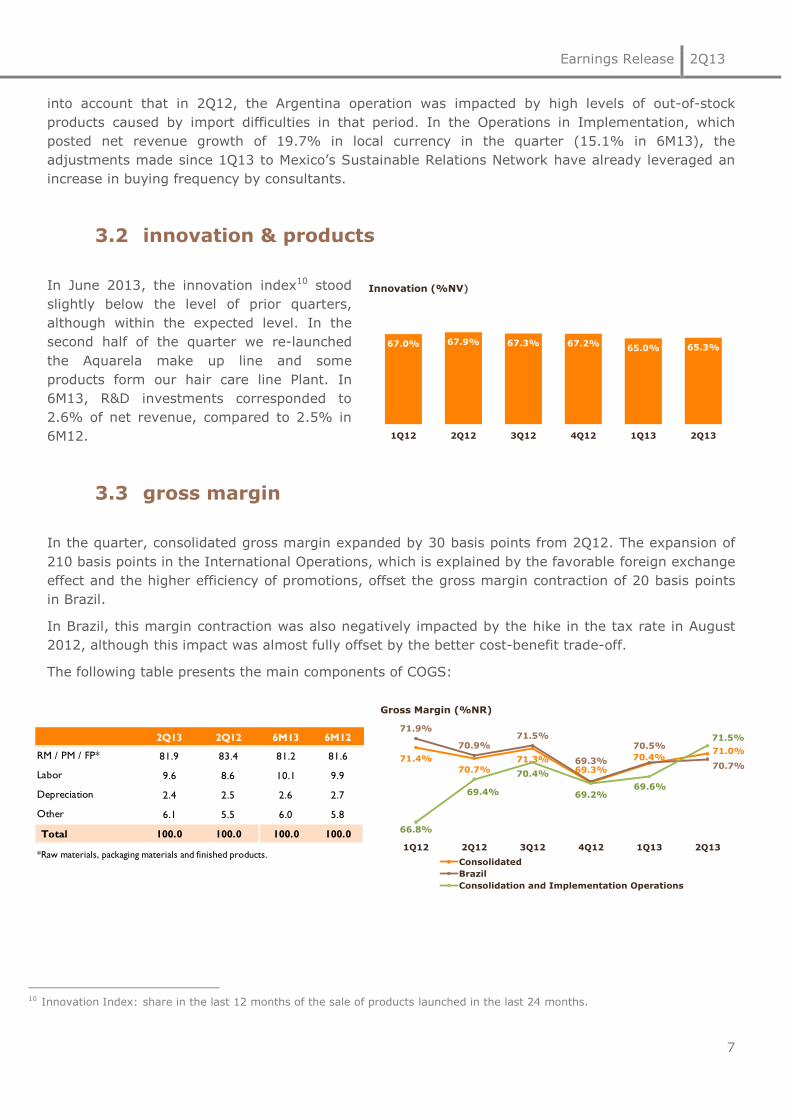
3.2 innovation & products
In June 2013, the innovation index10 stood
slightly below the level of prior quarters,
although within the expected level. In the
second half of the quarter we re-launched
the Aquarela make up line and some
products form our hair care line Plant. In
6M13, R&D investments corresponded to
2.6% of net revenue, compared to 2.5% in
6M12.
3.3 gross margin
In the quarter, consolidated gross margin expanded by 30 basis points from 2Q12. The expansion of
210 basis points in the International Operations, which is explained by the favorable foreign exchange
effect and the higher efficiency of promotions, offset the gross margin contraction of 20 basis points
in Brazil.
In Brazil, this margin contraction was also negatively impacted by the hike in the tax rate in August
2012, although this impact was almost fully offset by the better cost-benefit trade-off.
The following table presents the main components of COGS:
10 Innovation Index: share in the last 12 months of the sale of products launched in the last 24 months.
67.0% 67.9% 67.3% 67.2%65.0% 65.3%
1Q12 2Q12 3Q12 4Q12 1Q13 2Q13
Innovation (%NV)
2Q13 2Q12 6M13 6M12
81.9 83.4 81.2 81.6
9.6 8.6 10.1 9.9
2.4 2.5 2.6 2.7
6.1 5.5 6.0 5.8
Total 100.0 100.0 100.0 100.0
*Raw materials, packaging materials and finished products.
RM / PM / FP*
Labor
Depreciation
Other
71.4%
70.7%71.3%
69.3%
70.4%71.0%
71.9%
70.9%71.5%
69.3%
70.5%
70.7%
66.8%
69.4%
70.4%
69.2%69.6%
71.5%
1Q12 2Q12 3Q12 4Q12 1Q13 2Q13
Gross Margin (%NR)
Consolidated
Brazil
Consolidation and Implementation Operations

Earnings Release 2Q13
8
3.4 operating expenses
In Brazil, the increase in selling,
marketing and logistics expenses in
relation to net revenue is explained by
the lower dilution of expenses, the
higher storage expenses arising from the
lower-than-expected sales and the
higher investments in marketing, such as
the start of initiatives for the launch of
the SOU line. In the International
Operations, the reduction in selling,
marketing and logistics expenses in
relation to net revenue was due to the
higher dilution of fixed expenses, as well
as to a different phasing of marketing
expenses.
In Brazil, administrative, R&D, IT and project expenses were stable in 2Q13. The planned
increase in R&D investments at a rate
above sales growth and the increase in
depreciation, reflecting the investments
already made in IT, were offset by
efficiency gains in discretionary expenses
and tax credits in the first half of the year.
In the International Operations, the
relative decrease in administrative
expenses is explained by the higher
leverage, which offset the investments in
systems needed to manage the
Sustainable Relations Network model in
Mexico.
3.5 other operating expenses and revenues
In 2Q13, considering the Brazil Operations and the International Operations, we registered other
revenue of R$17.8 million, compared to the other revenue of R$0.4 million in 2Q12 (revenue of
R$17.5 million in 6M13, compared to an expense of R$1.6 million in 6M12). In Brazil, this result was
mainly due to the divestment of a property in Itapecerica da Serra and to the recognition of tax
credits from prior periods.
3.6 other international investments
Other international investments, which are related to the operation in France, the international
corporate structure based in Buenos Aires and the AESOP operation and associated acquisition costs,
recorded EBITDA losses of R$24.1 million in 2Q13 (loss of R$19.3 million in 2Q12) and R$51.6 million
in 6M13 (loss of R$36.2 million in 6M12). This increase in investments mainly reflects the level of
inflation in Argentina, which impacted corporate expenses.
31.6% 33.6%
55.5% 55.3%
34.3% 34.9%
47.5% 48.2%
Quarter Year to Date Quarter Year to Date
Selling Expenses (%NR)
2012 2013
BrazilConsolidation and
Implementation Operations
13.6% 13.5%
9.1% 9.3%
13.3% 14.1%
8.1%9.0%
Quarter Year to Date Quarter Year to Date
Administrative, R&D, IT and Projects Expenses,
Employee profit sharing and Management compensation (%NR)
2011 2012
BrazilConsolidation and
Implementation Operations

Earnings Release 2Q13
9
3.7 EBITDA
In 2Q13, consolidated EBITDA was R$409.9 million, up 4.7% from the same period of 2012 (EBITDA
margin of 23.9% in 2Q13, vs. 24.3% in 2Q12). In Brazil, EBITDA decreased by 1.6%, reflecting the
lower-than-expected sales and higher selling expenses. The reduction was partially offset by
nonrecurring effects, i.e., the sale of a property in Itapecerica da Serra and the use of tax credits.
Moreover, the result from the International Operations made a positive contribution to consolidated
EBITDA.
EBITDA (R$ million)11 Figures include the operating result and transaction costs associated with Aesop
Pro-forma EBITDA by operational bloc (R$ million) Figures include the operating result and transaction costs associated with Aesop
3.8 net income
Net income in the quarter grew by 11.7%,
with net margin expanding 0.6 p.p. The
reduction of 71.3% in financial expenses
offset the negative impacts on EBITDA
explained above.
11 Adjust in 2Q13 refers to the Non-controlling Interest of 1Q13 that was booked and published into ”other operating expenses and revenues” in 1Q13 and in the current quarter the 1Q13 figure was booked correctly into “Non-controlling interest”.
2Q13 2Q12 Change % 6M13 6M12 Change %
Net Revenue 1,715.8 1,608.3 6.7 3,067.1 2,884.1 6.3
(-) Cost of Sales and Expenses 1,352.9 1,251.3 8.1 2,484.3 2,288.5 8.6
EBIT 363.0 357.0 1.7 582.8 595.7 (2.2)
Adjust Non-controlling interest (0.2) 0.0 0.0 0.0 0.0 0.0
(+) Depreciation/Amortization 47.1 34.6 36.2 89.2 68.1 31.0
EBITDA 409.9 391.6 4.7 671.9 663.7 1.2
2Q13 2Q12 Change % 6M13 6M12 Change %
Brazil 395.6 401.9 (1.6) 665.1 686.8 (3.1)
Argentina, Chile and Peru 37.6 16.1 133.4 53.8 24.3 121.5
Mexico and Colombia 0.8 (7.1) (111.5) 4.6 (11.1) (141.7)
Other Investments (24.1) (19.3) 24.6 (51.6) (36.2) 42.6
EBITDA 409.9 391.6 4.7 671.9 663.7 1.2
11.9%
13.4%
15.0%13.7%
9.2%
14.0%
1Q12 2Q12 3Q12 4Q12 1Q13 2Q13
Net Margin (%NR)
Earnings Release 2Q13
10
The Financial Result in 2Q13 was an expense of R$11.4 million, compared to an expense of R$39.8
million in 2Q12. In 6M13, the financial result was an expense of R$49.2 million (R$55.0 million
expense in 1H12).
The financial expense in the quarter was positively impacted primarily by the mark-to-market
adjustments to derivative12 instruments given the variation in the currency coupon, which generated
revenue of R$17.5 million in 2Q13, compared to the loss of R$17.7 million in the same period a year
earlier. Note that this is a noncash impact that will be zeroed over the duration of these loans, since
the operations are settled only upon maturity. Excluding the mark-to-market impact, the financial
expenses in 2Q13 would be 6.9% higher than 2Q12 reflecting the increase in average net debt in the
period, partially offset by the reduction in the Selic basic interest rate.
In the first six months of the year, the financial result was also impacted by the mark-to-market
adjustment to derivative instruments (income of R$12.8 million in 6M13, compared to an expense of
R$12.8 million in 6M12), as described above, and by the R$8.4 million in hedge expenses with the
positions contracted to hedge the commitment related to the acquisition of 65% interest in Emeis
Holding (AESOP) for AU$69 million. The hedge positions were contracted to offset the impact of
foreign exchange fluctuation on the agreed price between the commitment and the settlement date,
in accordance with our foreign currency exposure policy.
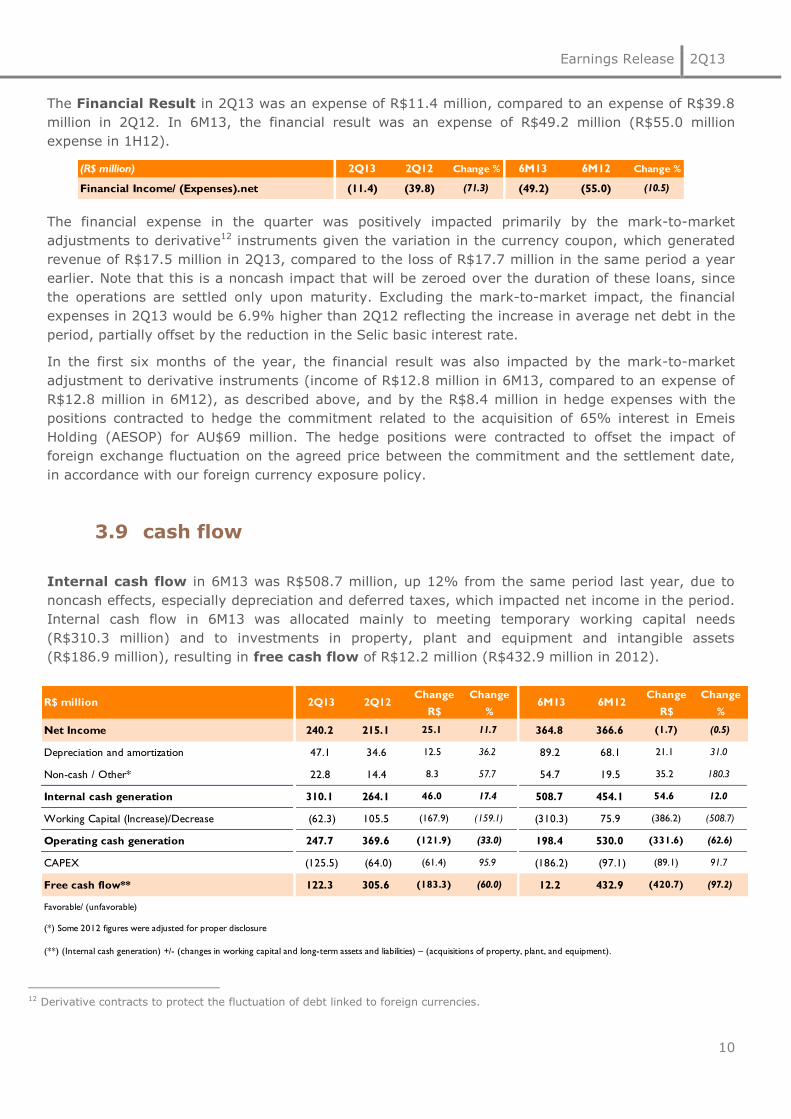
3.9 cash flow
Internal cash flow in 6M13 was R$508.7 million, up 12% from the same period last year, due to
noncash effects, especially depreciation and deferred taxes, which impacted net income in the period.
Internal cash flow in 6M13 was allocated mainly to meeting temporary working capital needs
(R$310.3 million) and to investments in property, plant and equipment and intangible assets
(R$186.9 million), resulting in free cash flow of R$12.2 million (R$432.9 million in 2012).
12 Derivative contracts to protect the fluctuation of debt linked to foreign currencies.
R$ million 2Q13 2Q12Change
R$
Change
%6M13 6M12
Change
R$
Change
%
Net Income 240.2 215.1 25.1 11.7 364.8 366.6 (1.7) (0.5)
Depreciation and amortization 47.1 34.6 12.5 36.2 89.2 68.1 21.1 31.0
Non-cash / Other* 22.8 14.4 8.3 57.7 54.7 19.5 35.2 180.3
Internal cash generation 310.1 264.1 46.0 17.4 508.7 454.1 54.6 12.0
Working Capital (Increase)/Decrease (62.3) 105.5 (167.9) (159.1) (310.3) 75.9 (386.2) (508.7)
Operating cash generation 247.7 369.6 (121.9) (33.0) 198.4 530.0 (331.6) (62.6)
CAPEX (125.5) (64.0) (61.4) 95.9 (186.2) (97.1) (89.1) 91.7
Free cash flow** 122.3 305.6 (183.3) (60.0) 12.2 432.9 (420.7) (97.2)
Favorable/ (unfavorable)
(**) (Internal cash generation) +/- (changes in working capital and long-term assets and liabilities) – (acquisitions of property, plant, and equipment).
(*) Some 2012 figures were adjusted for proper disclosure
(R$ million) 2Q13 2Q12 Change % 6M13 6M12 Change %
Financial Income/ (Expenses).net (11.4) (39.8) (71.3) (49.2) (55.0) (10.5)

Earnings Release 2Q13
11
Working capital needs increased as a result of the higher inventory levels and different installment
payment scheme for the Valentine’s Day cycle, which unusually increased our accounts receivable
balance. Moreover, a comparison of the variation between December 2012 and June 2013 shows that
the position on the former date was positively impacted by some R$80 million in expenses with media
and capital expenditure in that period, as commented in 1Q13. Note also that the variation in working
capital in 6M12 benefitted from the unfavorable position at the close of 2011 due to the lack of
provisioning for the profit-sharing plan for 2011, the use of PIS/COFINS tax credits and the higher
inventory coverage.
Some factors that led to an increase in the working capital position in 2Q13 are expected to be
reversed in the coming months.
With regard to investments in property, plant and equipment and intangible assets, the
distribution of disbursements in 2013 was different than in 2012, with a higher concentration in the
first half of the year (R$186.2 million in 6M13 compared to R$97.1 million in 6M12), led by
investments in our plants in Pará and Cajamar, in molds for new product launches and in information
technology. We maintain our capital expenditure guidance for the full year of R$450.0 million
(R$437.4 million in 2012).
3.10 Indebtedness The higher total debt and net debt reflect unusual higher investments in working capital needs, the
investments in property, plant and equipment and intangible assets, and the acquisition of a 65%
stake in AESOP.
In the quarter, we observed a lengthening in the debt profile, with maturities concentrated around
2015. In May 2013, we settled a debenture issue with principal of around R$350 million and
contracted new long-term credit facilities.
4. dividends
In a meeting held on July 24, 2013, the Board of Directors approved management's proposal for the
payment, on August 15, 2013, of dividends relative to the net income recorded in the first six months
of 2013, and interest on equity relative to the period from January 1, 2013 to July 24, 2013, in the
amounts of R$337.3 million and R$27.5 million (R$23.4 million, net of withholding tax), respectively.
These dividends and interest on equity relative to the first six months of 2013 combined represent a
net payment of R$0.8384 per share to be made on August 15, 2013 to shareholders of record as of
July 31, 2013, with the Company’s shares trading ex-dividends and ex-IOE as of August 1, 2013. The
interest on equity will be recorded in July 2013.
Debt (R$ million) Jun/13 Share (%) Jun/12 Share (%) Change (%)
Short-Term 404.7 21.1 1,088.8 75.4 (62.8)
Long-Term 1,892.7 98.5 476.4 33.0 297.3
Derivatives (141.0) (7.3) (65.7) (4.6) 114.5
Finance Leases (235.1) (12.2) (56.0) (3.9) 319.9
Total Debt 1,921.3 100.0 1,443.5 100.0 33.1
(-) Cash, cash equivalents and short-term investment 778.8 803.3 (3.0)
(=) Net Debt - Net Cash 1,142.5 640.2 78.5
Net Debt / Ebitda 0.75 0.43
Total Debt / Ebitda 1.26 0.96
Earnings Release 2Q13
12
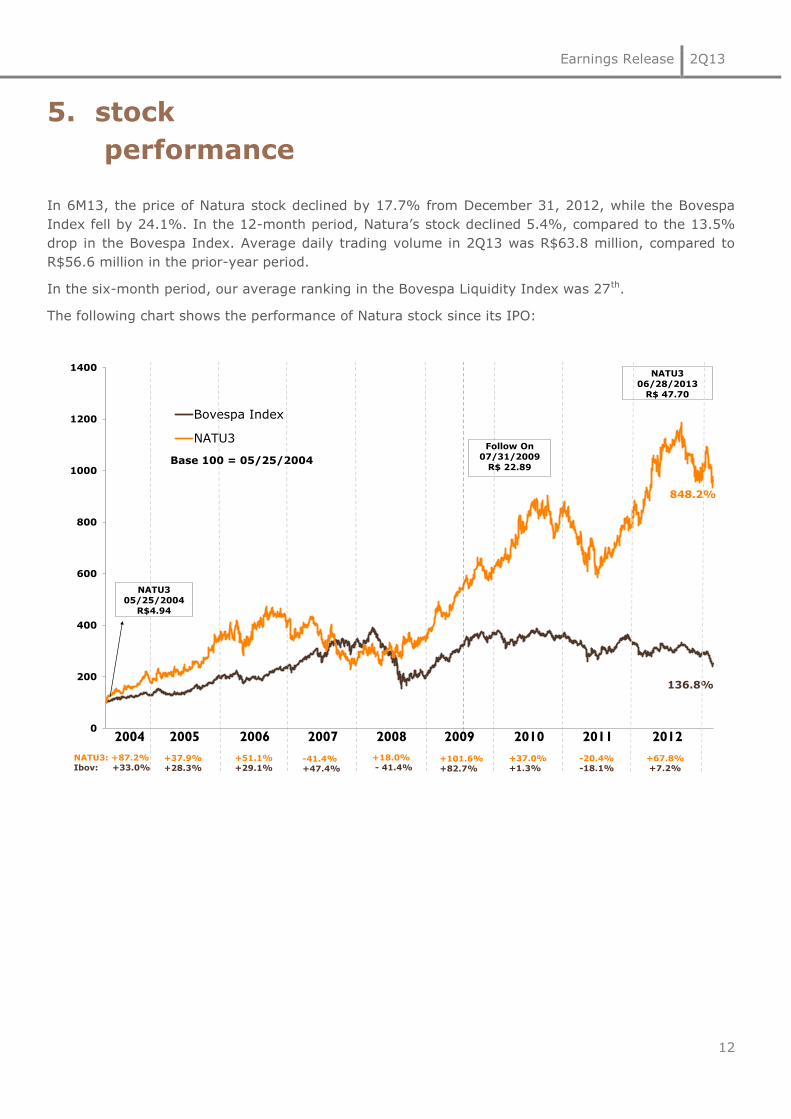
5. stock
performance
In 6M13, the price of Natura stock declined by 17.7% from December 31, 2012, while the Bovespa
Index fell by 24.1%. In the 12-month period, Natura’s stock declined 5.4%, compared to the 13.5%
drop in the Bovespa Index. Average daily trading volume in 2Q13 was R$63.8 million, compared to
R$56.6 million in the prior-year period.
In the six-month period, our average ranking in the Bovespa Liquidity Index was 27th.
The following chart shows the performance of Natura stock since its IPO:
848.2%
0
200
400
600
800
1000
1200
1400
Base 100 = 05/25/2004
Bovespa Index
NATU3
NATU3: +87.2%
Ibov: +33.0%+37.9%
+28.3%
+51.1%
+29.1%-41.4%
+47.4%
+18.0%
- 41.4%+101.6%
+82.7%
+37.0%
+1.3%
NATU3
05/25/2004
R$4.94
2004 2005 2006 2007 2008 2009 2010
NATU3
06/28/2013
R$ 47.70
136.8%
Follow On
07/31/2009
R$ 22.89
2011
-20.4%
-18.1%
2012
+67.8%
+7.2%

Earnings Release 2Q13
13
conference call
& webcast
PORTUGUESE: Friday, July 26, 2013
10:00 a.m. (Brasília time)
ENGLISH: Friday, July 26, 2013
12:00 p.m. (Brasília time)
From Brazil: +55 11 4688 6341
From the U.S. (toll free): + 1 855 281 6021
From other countries: +1 786 924 6977
Code: Natura
Live webcast:
www.natura.net/investidor
investor
relations
Phone: +55 (11) 4196-1421
Fabio Cefaly, [email protected]
Tatiana Bravin, [email protected]
Taísa Hernandez, [email protected]
Yakatherine Menendez, [email protected]

Earnings Release 2Q13
14
balance
sheets at June 2013 and December 2012 (in millions of Brazilian real - R$)
ASSETS Jun/13 Dec/12 LIABILITIES AND SHAREHOLDERS' EQUITY Jun/13 Dec/12
CURRENT ASSETS CURRENT LIABILITIES
Cash and cash equivalents 592.4 1,144.4 Borrowings and financing 404.7 999.5
Short-term investments 186.4 498.7 Trade and other payables 620.9 649.9
Trade receivables 687.6 651.4 Payroll, profit sharing and related taxes 194.2 211.8
Inventories 836.4 700.7 Taxes payable 464.4 501.5
Recoverable taxes 185.0 144.5 Other payables 62.0 52.0
Derivatives 141.0 80.9 Total current liabilities 1,746.1 2,414.7
Other receivables 200.2 157.8
Total current assets 2,828.9 3,378.3
NONCURRENT ASSETS NONCURRENT LIABILITIES
Long-term assets: Borrowings and financing 1,892.7 1,325.1
Recoverable taxes 170.4 151.4 Taxes payable 198.9 177.3
Deferred income tax and social contribution 203.7 214.2 Provision for tax, civil and labor risks 63.3 63.3
Escrow deposits 385.8 349.5 Others provisions 199.0 89.0
Other noncurrent assets 37.2 41.3 Total noncurrent liabilities 2,353.8 1,654.6
Property, plant and equipment 1,257.7 1,012.1
Intangible assets 368.4 228.5 SHAREHOLDERS' EQUITY
Total noncurrent assets 2,423.2 1,997.1 Capital 427.1 427.1
Capital reserves 149.9 155.9
Earnings reserves 597.9 308.1
Treasury shares (34.7) (66.1)
Proposed additional dividend 0.0 491.3
Other comprehensive losses (7.1) (10.2)
Total equity attributable to owners of the Company 1,133.1 1,306.1
Non- controlling interests 19.1 0.0
Total equity 1,152.2 1,306.1
TOTAL ASSETS 5,252.1 5,375.4 TOTAL LIABILITIES AND SHAREHOLDERS' EQUITY 5,252.1 5,375.4
Earnings Release 2Q13
15
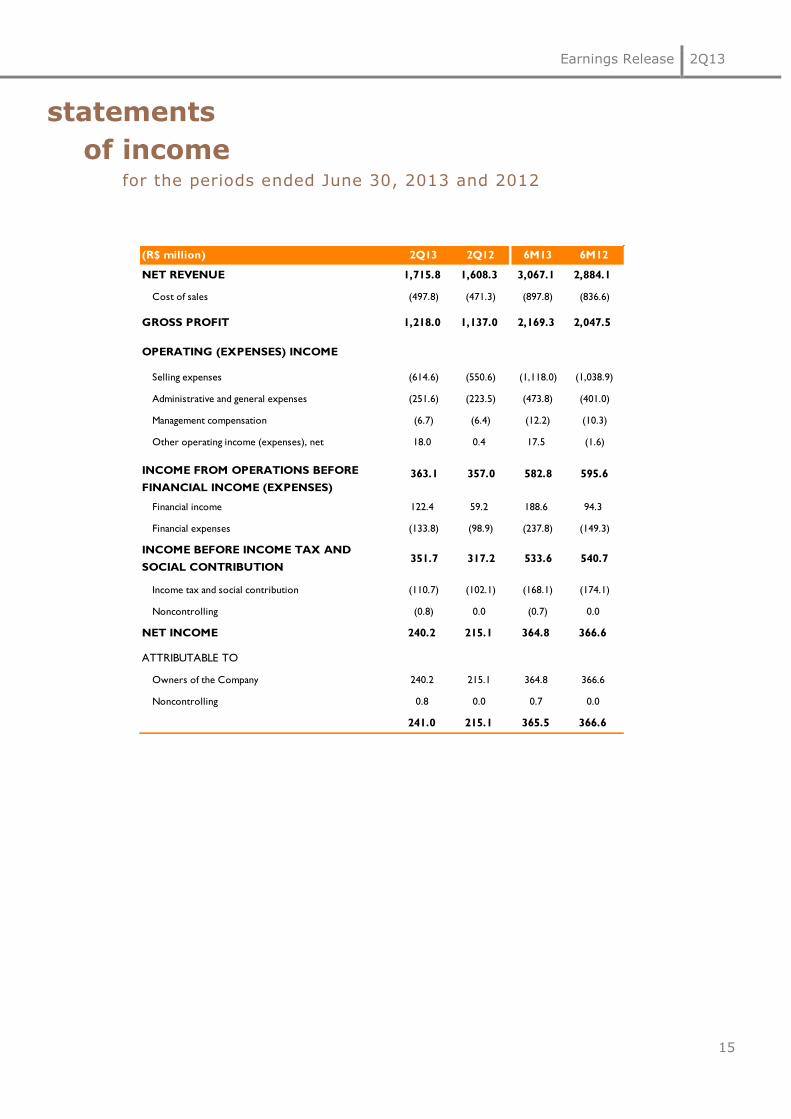
statements
of income for the periods ended June 30, 2013 and 2012
(R$ million) 2Q13 2Q12 6M13 6M12
NET REVENUE 1,715.8 1,608.3 3,067.1 2,884.1
Cost of sales (497.8) (471.3) (897.8) (836.6)
GROSS PROFIT 1,218.0 1,137.0 2,169.3 2,047.5
OPERATING (EXPENSES) INCOME
Selling expenses (614.6) (550.6) (1,118.0) (1,038.9)
Administrative and general expenses (251.6) (223.5) (473.8) (401.0)
Management compensation (6.7) (6.4) (12.2) (10.3)
Other operating income (expenses), net 18.0 0.4 17.5 (1.6)
Financial income 122.4 59.2 188.6 94.3
Financial expenses (133.8) (98.9) (237.8) (149.3)
Income tax and social contribution (110.7) (102.1) (168.1) (174.1)
Noncontrolling (0.8) 0.0 (0.7) 0.0
NET INCOME 240.2 215.1 364.8 366.6
Owners of the Company 240.2 215.1 364.8 366.6
Noncontrolling 0.8 0.0 0.7 0.0
241.0 215.1 365.5 366.6
363.1 357.0 582.8 595.6INCOME FROM OPERATIONS BEFORE
FINANCIAL INCOME (EXPENSES)
351.7 317.2 533.6 540.7INCOME BEFORE INCOME TAX AND
SOCIAL CONTRIBUTION
ATTRIBUTABLE TO

Earnings Release 2Q13
16
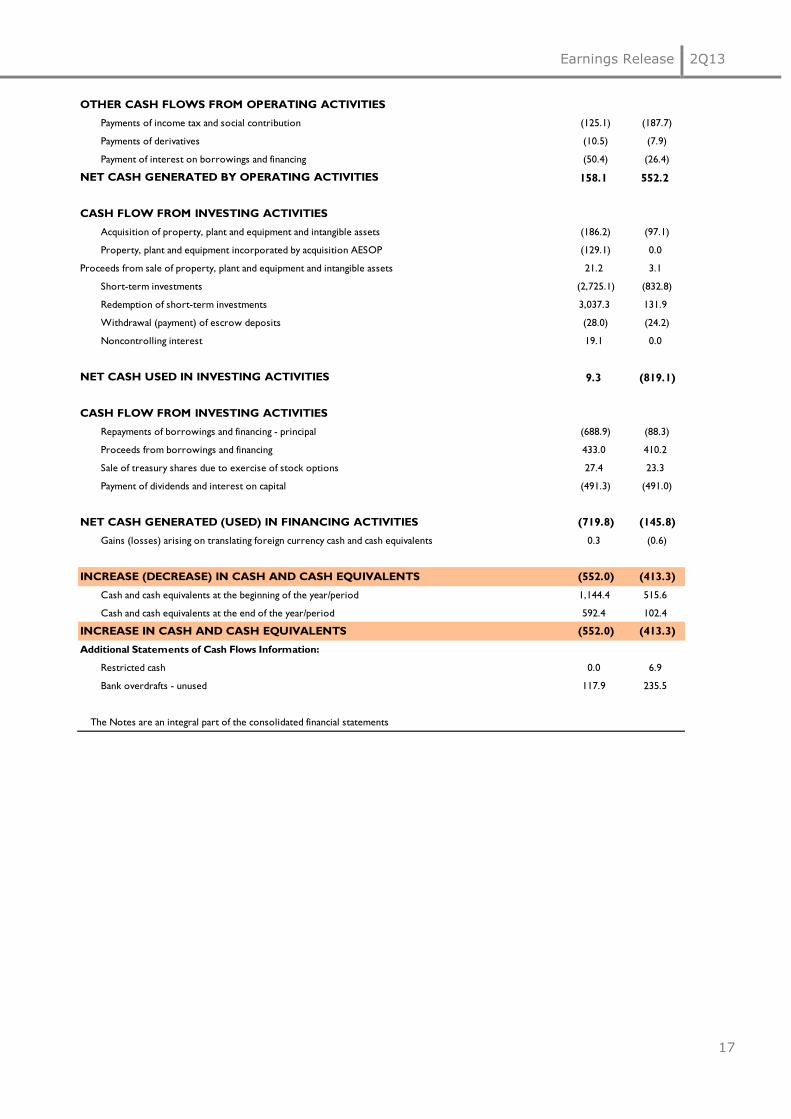
statements
of cash flow for the periods ended
June 30, 2013 and 2012
(R$ million) 2Q13 2Q12
CASH FLOW FROM OPERATING ACTIVITIES
Net income 364.8 366.6
Depreciation and amortization 89.2 68.1
Provision for losses on swap and forward transactions (49.6) (37.1)
Provision (reversal) for tax, civil and labor contingencies 2.5 9.3
Interest and inflation adjustment of escrow deposits (8.3) (10.3)
Income tax and social contribution 168.1 174.1
(Gain) loss on sale on property, plant and equipment and intangible assets (8.7) (1.3)
Interest and exchange rate changes on borrowings and financing and other liabilities 141.5 83.0
Exchange rate changes on other assets and other liabilities 4.2 11.0
Stock options plans expenses 5.4 6.3
Provision for discount on assignment of ICMS credits (3.5) 0.0
Allowance for doubtful accounts 15.1 7.8
Allowance for inventory losses 8.8 (3.5)
Net income attributable to Noncontrolling 0.7 0.0
Provision for healthcare plan and carbon credits 0.6 12.1
Recognition of untimely used tax credits (6.8) (3.5)
723.9 682.5
(INCREASE) DECREASE IN ASSETS
Trade receivables (51.3) 79.7
Inventories (144.5) (38.2)
Recoverable taxes (49.4) 15.3
Other receivables (38.3) 2.6
Subtotal (283.4) 59.4
INCREASE (DECREASE) IN LIABILITIES
Domestic and foreign suppliers (30.3) (31.5)
Payroll, profit sharing and related taxes, net (17.6) 36.3
Taxes payable (47.9) 8.5
Other payables 2.0 21.9
Payments of provision for tax, civil and labor contingencies (2.5) (3.0)
Subtotal (96.4) 32.3
CASH GENERATED BY OPERATING ACTIVITIES 344.1 774.2
Adjustments to reconcile net income to net cash provided by operating
activities:
Earnings Release 2Q13
17
OTHER CASH FLOWS FROM OPERATING ACTIVITIES
Payments of income tax and social contribution (125.1) (187.7)
Payments of derivatives (10.5) (7.9)
Payment of interest on borrowings and financing (50.4) (26.4)
NET CASH GENERATED BY OPERATING ACTIVITIES 158.1 552.2
CASH FLOW FROM INVESTING ACTIVITIES
Acquisition of property, plant and equipment and intangible assets (186.2) (97.1)
Property, plant and equipment incorporated by acquisition AESOP (129.1) 0.0
Proceeds from sale of property, plant and equipment and intangible assets 21.2 3.1
Short-term investments (2,725.1) (832.8)
Redemption of short-term investments 3,037.3 131.9
Withdrawal (payment) of escrow deposits (28.0) (24.2)
Noncontrolling interest 19.1 0.0
NET CASH USED IN INVESTING ACTIVITIES 9.3 (819.1)
CASH FLOW FROM INVESTING ACTIVITIES
Repayments of borrowings and financing - principal (688.9) (88.3)
Proceeds from borrowings and financing 433.0 410.2
Sale of treasury shares due to exercise of stock options 27.4 23.3
Payment of dividends and interest on capital (491.3) (491.0)
NET CASH GENERATED (USED) IN FINANCING ACTIVITIES (719.8) (145.8)
Gains (losses) arising on translating foreign currency cash and cash equivalents 0.3 (0.6)
INCREASE (DECREASE) IN CASH AND CASH EQUIVALENTS (552.0) (413.3)
Cash and cash equivalents at the beginning of the year/period 1,144.4 515.6
Cash and cash equivalents at the end of the year/period 592.4 102.4
INCREASE IN CASH AND CASH EQUIVALENTS (552.0) (413.3)
Additional Statements of Cash Flows Information:
Restricted cash 0.0 6.9
Bank overdrafts - unused 117.9 235.5
The Notes are an integral part of the consolidated financial statements
Earnings Release 2Q13
18
Glossary
_Benefit Sharing: based on Natura’s Policy for the Sustainable Use of Biodiversity and Associated Traditional Knowledge, benefits are shared whenever we perceive various forms of value in the access gained to biodiversity. Therefore, one of the practices that defines the way in which these resources will be shared is to associate payments with the number of raw materials produced from each plant as well as the commercial success of the products in which these raw materials are used.
_CDI: the overnight rate for interbank deposits.
_GHG: Greenhouse gases.
_Innovation Index: the percentage of revenue earned in the last 12 months from the sale of products launched in the last 24 months.
_Natura Crer Para Ver Program: Crer Para Ver, which translates literally as “Believing is Seeing”, is a special line of non-cosmetic products whose profits are transferred to the Natura Institute. Neither Natura nor Consultants earn money from sales of this line.
_Natura Consultant (CN): independent sales representatives who do not have a formal labor relationship with Natura.
_Natura Institute: is a non-profit organization created in 2010 to strengthen and expand our private social investment initiatives. The institute has enabled us to leverage our efforts and investments in actions that contribute to the quality of public education.
_Natura Super Consultant (CNO): independent sales representatives who do not have a formal labor relationship with Natura and support the Relationship Managers in their activities;
_Operations in Consolidation: grouping of operations: Argentina, Chile and Peru
_Operations in Implementation: grouping of operations: Colombia and Mexico
_Profit Sharing: the share of profit allocated to employees under the profit-sharing program.
_Sipatesp/Abihpec: São Paulo State Perfumery and Toiletry Association / Brazilian Cosmetics, Fragrance and Toiletry Industry Association.
_Supplier Communities: the communities of people engaged in small-scale farming and extraction activities in a variety of locations in Brazil, especially in the Amazon Region, from which the inputs used in our products are extracted from the local social and biodiversity. We form production chains with these communities that are based on fair prices, the sharing of benefits gained from access to the genetic heritage and associated traditional knowledge and support for local sustainable development projects. This business model has proven effective in generating social, economic and environmental value for Natura and for the communities.
_Sustainable Relations Network: sales model adopted in Mexico that features eight stages in a consultant’s development: Natura Consultant, Natura Consultant Entrepreneur, Natura Trainer 1 and 2, Natura Transformer 1 and 2, Natura Inspirer and Natura Associate. To advance through the stages consultants must meet targets for sales volume and attracting new consultants and (unlike the models adopted in other countries) also for personal development and social and environmental engagement in the community.
_Target Market: refers to the market data published by Sipatesp/Abihpec. Considers only the segments in which Natura operates. Excludes diapers, oral hygiene products, hair dyes, nail polish, feminine hygiene products as well as other products.
restated figures
_Productivity (new calculation method): at retail prices = (gross revenue/average number of consultants in the period) /
(1%-consultant profit).
_Breakdown of Cost: Restatement of values of the frame with the gap between: Raw Material and Packaging, Labor,
depreciation and others regarding the 2Q12 and 6M12.

Earnings Release 2Q13
19
EBITDA is not a measure under BR GAAP and does not represent cash flow for the periods presented.
EBITDA should not be considered an alternative to net income as an indicator of operating
performance or an alternative to cash flow as an indicator of liquidity. EBITDA does not have a
standardized meaning and the definition of EBITDA used by Natura may not be comparable with that
used by other companies. Although EBITDA does not provide under BR GAAP a measure of cash flow,
Management has adopted its use to measure the Company’s operating performance. Natura also
believes that certain investors and financial analysts use EBITDA as an indicator of performance of its
operations and/or its cash flow.
This report contains forward-looking statements. These forward-looking statements are not historical
fact, but rather reflect the wishes and expectations of Natura’s management. Words such as
"anticipate", "wish", "expect", "foresee", "intend", "plan", "predict", "project", "desire" and similar
terms identify statements that necessarily involve known and unknown risks. Known risks include
uncertainties that are not limited to the impact of price and product competitiveness, the acceptance
of products by the market, the transitions of the Company’s products and those of its competitors,
regulatory approval, currency fluctuations, supply and production difficulties and changes in product
sales, among other risks. This report also contains certain pro forma data, which are prepared by the
Company exclusively for informational and reference purposes and as such are unaudited. This report
is updated up to the present date and Natura does not undertake to update it in the event of new
information and/or future events.


![DSAT · 2015. 7. 22. · cheng han weng long so, u sam sol, chi mencj sonci chin cheng sono tan i sot', sou, sot], sou, sou, sot], sou, sot], sou, sou, sou, sou, in 10 hong kam choi](https://static.fdocuments.us/doc/165x107/60c2f5f91082346bf41443bb/2015-7-22-cheng-han-weng-long-so-u-sam-sol-chi-mencj-sonci-chin-cheng-sono.jpg)