Sandia National Laboratories Results for the 2010 … · Quick-Scan results for Pulse #1, on...
48
SANDIA REPORT SAND2011-6416 Unlimited Release Printed September, 2011 Sandia National Laboratories Results for the 2010 Criticality Accident Dosimetry Exercise, at the CALIBAN Reactor, CEA Valduc France. September 2010 Dann C. Ward Prepared by Sandia National Laboratories Albuquerque, New Mexico 87185 and Livermore, California 94550 Sandia National Laboratories is a multi-program laboratory managed and operated by Sandia Corporation, a wholly owned subsidiary of Lockheed Mart in Corporation, for the U.S. Department of Energy’s National Nuclear Security Administration under contract DE-AC04-94AL85000. Approved for public release; further dissemination unlimited.
Transcript of Sandia National Laboratories Results for the 2010 … · Quick-Scan results for Pulse #1, on...

SANDIA REPORT SAND2011-6416 Unlimited Release Printed September, 2011
Sandia National Laboratories Results for the
2010 Criticality Accident Dosimetry Exercise,
at the CALIBAN Reactor, CEA Valduc
France. September 2010
Dann C. Ward
Prepared by Sandia National Laboratories Albuquerque, New Mexico 87185 and Livermore, California 94550
Sandia National Laboratories is a multi-program laboratory managed and operated by Sandia Corporation, a wholly owned subsidiary of Lockheed Mart in Corporation, for the U.S. Department of Energy’s National Nuclear Security Administration under contract DE-AC04-94AL85000.
Approved for public release; further dissemination unlimited.
2
Issued by Sandia National Laboratories, operated for the United States Department of Energy by
Sandia Corporation.
NOTICE: This report was prepared as an account of work sponsored by an agency of the United
States Government. Neither the United States Government, nor any agency thereof, nor any of
their employees, nor any of their contractors, subcontractors, or their employees, make any
warranty, express or implied, or assume any legal liability or responsibility for the accuracy,
completeness, or usefulness of any information, apparatus, product, or process disclosed, or
represent that its use would not infringe privately owned rights. Reference herein to any specific
commercial product, process, or service by trade name, trademark, manufacturer, or otherwise,
does not necessarily constitute or imply its endorsement, recommendation, or favoring by the
United States Government, any agency thereof, or any of their contractors or subcontractors. The
views and opinions expressed herein do not necessarily state or reflect those of the United States
Government, any agency thereof, or any of their contractors.
Printed in the United States of America. This report has been reproduced directly from the best
available copy.
Available to DOE and DOE contractors from
U.S. Department of Energy
Office of Scientific and Technical Information
P.O. Box 62
Oak Ridge, TN 37831
Telephone: (865) 576-8401
Facsimile: (865) 576-5728
E-Mail: [email protected]
Online ordering: http://www.osti.gov/bridge
Available to the public from
U.S. Department of Commerce
National Technical Information Service
5285 Port Royal Rd.
Springfield, VA 22161
Telephone: (800) 553-6847
Facsimile: (703) 605-6900
E-Mail: [email protected]
Online order: http://www.ntis.gov/help/ordermethods.asp?loc=7-4-0#online

3
SAND2011-6416 Unlimited Release
Printed September, 2011
Sandia National Laboratories Results for the
2010 Criticality Accident Dosimetry Exercise,
at the CALIBAN Reactor, CEA Valduc France,
September 2010
Dann C. Ward, Ph.D., C.H.P.
Radiation Protection Department
Sandia National Laboratories
P.O. Box 5800
Albuquerque, NM 87185-1103
Abstract
This document describes the personal nuclear accident dosimeter (PNAD) used by Sandia
National Laboratories (SNL) and presents PNAD dosimetry results obtained during the Nuclear
Accident Dosimeter Intercomparison Study held 20 – 23 September, 2010, at CEA Valduc,
France. SNL PNADs were exposed in two separate irradiations from the CALIBAN reactor.
Biases for reported neutron doses ranged from -15% to +0.4% with an average bias of -7.7%.
PNADs were also exposed on the back side of phantoms to assess orientation effects.

4
Acknowledgement
The author wishes to thank Bob Miltenberger (Sandia National Laboratories, Radiation
Protection Program Manager) and David Heinricks/David Hickman (Lawrence Livermore
National Laboratories) for their support and guidance regarding this work.
Acronyms and Abbreviations
Al Aluminum
Cu Copper
F Fluorine
FNAD Fixed Nuclear Accident Dosimeter
In Indium
Na Sodium
Ni Nickel
PNAD Personal Nuclear Accident Dosimeter
SNL Sandia National Laboratories
Ti Titanium
TLD Thermoluminescent Dosimeter

5
CONTENTS
Introduction ..................................................................................................................................... 7
Purpose ........................................................................................................................................ 7
Background ................................................................................................................................. 7
Methods......................................................................................................................................... 10
Results ........................................................................................................................................... 13
Overall PNAD and TLD Results .............................................................................................. 13
The Quick-Scan process ........................................................................................................... 15
Comparison of Quick-Scan versus PNAD Foil Analysis values. ............................................. 15
PNAD Foil Activation .............................................................................................................. 16
Operational Field Equipment .................................................................................................... 17
Neutron and Gamma Dose Measurements Using the SNL TLDs ............................................ 17
Conclusions ................................................................................................................................... 18
References ..................................................................................................................................... 19
APPENDIX A: Description of the Thermo Electron Type 8823 TLD ...................................... A-1
APPENDIX B: Quick-Scan Data............................................................................................... B-1
Quick-Scan results for Pulse #1, on Phantom ......................................................................... B-1
Quick-Scan results for Pulse #1, Free In-Air .......................................................................... B-4
Quick-scan Results for Pulse # 2 – Torso Phantom ................................................................ B-6
APPENDIX C: PNAD Data Tables ........................................................................................... C-1
APPENDIX D: Quick-Scan Nomograms Technical Basis ........................................................ D-1
TABLES
Table 1: Dosimetry Reactions ...................................................................................................... 10
Table 2: Dosimeter Placement ..................................................................................................... 12
Table 3: Dose Results - Pulse #1 ................................................................................................. 13
Table 5: Comparison of Measured to Delivered Doses. .............................................................. 14
Table B-1: Quick-Scan Data for Pulse # 1; On Phantom .......................................................... B-1
Table B-2: Quick-Scan Data For Pulse # 1; Free In-Air ........................................................... B-4
Table B-3: Quick-Scan Data For Pulse # 2; On Torso Phantom ............................................... B-6
Table D- 1: Average Cross-Section Values for the 115
In(n,γ)116m
In Reaction ........................... D-2

6
FIGURES
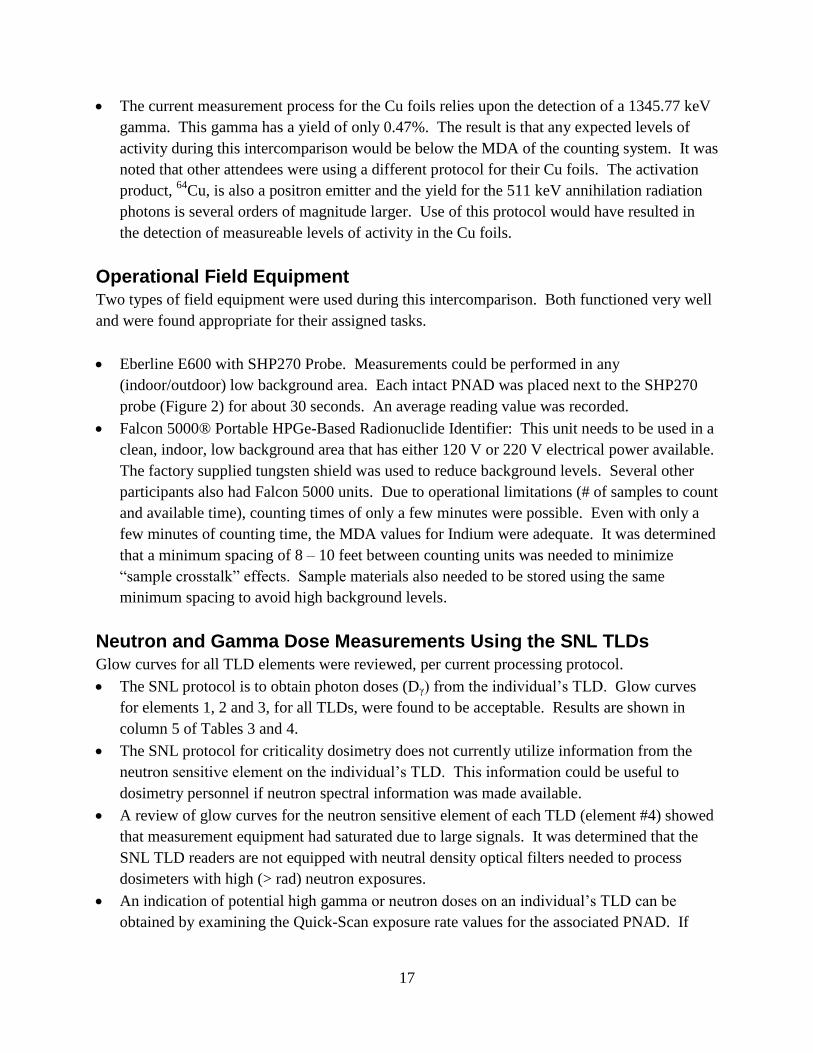
Figure 1: A PNAD measures 19 mm wide by 7 mm thick by 65 mm long. Weight is 11.3 g. .... 8
Figure 2: The SNL “PNAD Quick-Scan” process an SHP270 probe (shield in closed position)
connected to an Eberline E600. The SHP270 probe is calibrated to 137Cs. ............................... 8
Figure 3: Nomogram for “PNAD Quick-Scan” measurements. This nomogram is applicable to
a bare metal (or lightly filtered) 235U fission spectrum. Nomograms for other types of neutron
spectrums can be developed (see Appendix D). ............................................................................. 9
Figure 4: SNL dosimeters were located at position # 13 (Lucite phantom) and position # 2 (free
in-air). (Courtesy of CEA Valduc). .............................................................................................. 10
Figure 5: SNL dosimeters were located on the phantom which was located 2.5 m from
CALIBAN. (Courtesy of CEA Valduc). ....................................................................................... 11
Figure A- 1: The four type 8823 dosimeter card elements and associated filters. ..................... A-1
Figure A-2: Picture of the Thermo Electron four-element aluminum TLD card and polyethylene
case front with Cu and Sn filters. ................................................................................................ A-2
Figure B- 1: Quick-Scan data from PNAD # 0137. This PNAD was front mounted on the
phantom....................................................................................................................................... B-2
Figure B-2: Quick-Scan data from PNAD # 0085. This PNAD was front mounted on the
Phantom. ..................................................................................................................................... B-3
Figure B-3: Quick-Scan data from PNAD # 0336. The PNAD was back mounted on the
phantom....................................................................................................................................... B-3
Figure B-4: Quick-Scan data from PNAD # 0143. This PNAD was back mounted on the
phantom....................................................................................................................................... B-4
Figure B-5: Quick-Scan data from PNAD # 0344. This PNAD was free in-air. ...................... B-5
Figure B-6: Quick-Scan data from PNAD # 0364. This PNAD was free in-air. ...................... B-5
Figure B-7: Quick-Scan data from PNAD # 0139. This PNAD was front mounted on a human
torso phantom. The phantom was located at a distance of 2.5 m from CALIBAN. .................. B-6
Figure B-8: Quick-Scan data from PNAD # 0039. This PNAD was front mounted on a human
torso phantom. The front side of the phantom was located at a distance of 2.5 m from
CALIBAN. .................................................................................................................................. B-7
Figure B-9: Quick-Scan data from PNAD # 0372. This PNAD was back mounted on a human
torso phantom. The front side of the phantom was located at a distance of 2.5 m from
CALIBAN. .................................................................................................................................. B-7
Figure B-10: Quick-Scan data from PNAD # 0385. This PNAD was back mounted on a human
torso phantom. The phantom was located at a distance of 2.5 m from CALIBAN. .................. B-8

7
Introduction
Purpose During the period of 20 – 24 September, 2010, Sandia National Laboratories (SNL) participated
in a criticality accident dosimetry exercise at Commissariat A L ’énergie Atomique Et Aux
Énergies Alternatives (CEA) Valduc, France. The exercise was funded by the U.S. Department
of Energy Nuclear Criticality Safety Program and coordinated through Lawrence Livermore
National Laboratory (LLNL). Other participating facilities included LLNL, Pacific Northwest
National Laboratory (PNL), Y-12 National Security Complex, Los Alamos National Laboratory
(LANL), and Oak Ridge National Laboratory (ORNL).
The goals for SNLs participation were to: (1) test and validate the procedures used to determine
dose values resulting from a criticality accident; (2) test and validate the Quick-Scan procedure
used to produce an initial neutron dose estimate, and (3) evaluate the use of operational field
equipment for the measurement of accident dosimeter materials.
Background The exercise was conducted using the CALIBAN reactor. CALIBAN is a metallic core
cylindrical reactor. Its diameter is 19.5 cm and its height is 25 cm. It is composed of two
blocks: a fixed block and a mobile one. Each block is made of five metallic plates of a
molybdenum and highly enriched uranium alloy. Four cylindrical control rods, made of the
same alloy, allow operation in two modes: a steady state power mode and a pulsed mode (Casoli,
2007). For this exercise, two exposures were performed consisting of an unshielded (bare) low-
power pulse and a bare high-power pulse. Participants were free to select the placement of their
dosimetry materials according to the radial distance from the center axis of the assembly,
orientation to the assembly, and whether or not they were placed on a phantom.
The SNL Personal Nuclear Accident Dosimeter (PNAD) contains six different types of
activation foils (Figure 1) and is a sealed unit (Ward et al, 1996). The dosimeter has an
indefinite shelf life and remains inert until it becomes activated. SNL PNADs are serial
numbered and issued to individuals. PNADs are not exchanged on an established schedule.
Per current SNL guidance, a single PNAD is worn on the upper torso along side of the SNL
Whole body Thermoluminescent Dosimeter (TLD). The SNL TLD is a Thermo Electron Type
8825 dosimeter badge (See Appendix A). In an accident situation, the SNL PNAD is the
primary dosimeter used to determine neutron dose (Dn)1 and elements 1 & 2 of the SNL TLD are
used to estimate the deep dose due to X-rays & gammas (Dγ).
1 Dn = DHP + Dnγ, See Appendix C, PNAD Data Tables

8
If a criticality accident should occur, an initial “rough” estimate of neutron exposures can be
quickly obtained by measuring the exposure rate on the surface of the PNAD with a portable
survey instrument (Figure 2). Figure 3 is the nomogram used by SNL monitoring personnel to
quickly sort individuals by estimated exposure level (Ward et al, 1996; Hill 2004). This provides
Health Physics and Medical personnel with a triage process. In this way, immediate medical
care can be focused where it is needed the most. Medical personnel can also be provided with
information that identifies individuals who may have received little or no exposure to neutron
radiation. The Nomogram does not however, provide any information regarding possible
exposure to X-ray/gamma radiation.
Figure 1: A PNAD measures 19 mm wide by 7 mm thick by 65 mm long. Weight is 11.3 g.
Figure 2: The SNL “PNAD Quick-Scan” process an SHP270 probe (shield in closed position)
connected to an Eberline E600. The SHP270 probe is calibrated to 137Cs.
NaF Pellet
Cd Covered Cu
foil
Al, Ni, Ti, & In
foils
Plastic housing with top
removed
NaF Pellet
Cd Covered Cu
foil
Al, Ni, Ti, & In
foils
Plastic housing with top
removed

9
Figure 3: Nomogram for “PNAD Quick-Scan” measurements. This nomogram is applicable to
a bare metal (or lightly filtered) 235U fission spectrum. Nomograms for other types of neutron
spectrums can be developed (see Appendix D).
Table 1 identifies the reactions in commonly used neutron foils that are useful for dosimetry
purposes (Griffin et al., 1993). The two indium reactions shown in Table 1 have different uses.
The 115
In(n,)116m
In reaction has a very large cross section for low energy neutrons but a short
(54 m) half-life. This reaction produces a relatively large foil activity that dies away quite
rapidly. This activity is most useful for determining if the wearer was involved in a criticality
accident. Portable health physics survey equipment is used to “Quick-Scan” the PNAD (Figure
2). Appendix B contains the Quick-Scan data obtained during this intercomparison. The Quick-
Scan results are intended for medical triage purposes only.
The second indium reaction, 115
In(n,n’)115m
In, has a longer half-life (4.36 h) and is used for
dosimetry purposes. After exposure to neutron radiation, the resulting activity due to 116m
In is
several times that of 115m
In. As a result (in order to minimize counting system dead time) an
indium foil is not counted immediately. A cool-down period of several hours is used to allow the
majority of the 116m
In activity to decay away.

10
Table 1: Dosimetry Reactions
Material
Reaction
Half-Life
E
(keV)
Gamma
Yield
(%)
Threshold
(MeV)
Al 27Al(n,)
24Na 15 h 1368.633 100.0 8
Ti 47
Ti(n,p)47
Sc 3.4 d 159.381 67.9 2
Ni 58
Ni(n,p)58
Co 70.9 d 810.775 99.4 3
Cu 63Cu(n,)
64Cu 12.9 h 1345.77 0.47 Epithermal
In 115
In(n,n’)115m
In 4.36 h 336.241 45.9 1
115In(n,)
116mIn 54.4 m 1293.54 84.4 Thermal
†
Na 23Na(n,)
24Na 15 h 1368.633 100.0 Epithermal
† Not used for dosimetry purposes, but used for Quick-Scan purposes.
Methods The CALIBAN reactor was used to provide two separate exposure pulses. Each pulse was done
without any shielding external to the core. For each pulse, PNADs and TLDs were placed
together. Dosimeter and PNAD locations are indicated in Table 2. For Pulse # 1, two exposure
locations were used (Figure 4). The first location was on a Lucite phantom located at a distance
of 4 meters from CALIBAN. The second location was a free in-air location at a distance of 2
meters from CALIBAN. The following day, Pulse # 2 was provided. The exposure location was
on a torso phantom located at a distance of 2.5 meters from CALIBAN. Dosimeters were
retrieved approximately 3 hours after each pulse exposure.
Figure 4: SNL dosimeters were located at position # 13 (Lucite phantom) and position # 2
(free in-air). (Courtesy of CEA Valduc).
DRMN/SRNC/LC
PE

11
Figure 5: SNL dosimeters were located on the phantom which was located 2.5 m from
CALIBAN. (Courtesy of CEA Valduc).
Upon retrieval, the PNADs and TLDs were treated differently. Surface exposure rate
measurements were performed on the PNADs as shown in Figure 2. Afterwards, the PNADs
were opened, their foils were visually inspected for signs of deterioration (there were no signs of
deterioration) weighted, and then counted using a Falcon 5000 portable high purity germanium
detector. TLD badges were opened and the cards placed into clean paper envelopes and returned
to SNL for processing. TLD cards were removed from their badge holders because each holder
contained thin copper and tin filters that become activated during the exposure and which were
subsequently irradiating the enclosed card (See Appendix A). To ensure accuracy, the TLD
cards were removed as soon as possible (approximately 3 hours post irradiation) from their
holders. Foil counting data were analyzed using the methods described by Ward, et. al. (1996).

12
Table 2: Dosimeter Placement
Pulse # Location Dosimeters
1 4 meters from CALIBAN, on Lucite phantom (30 cm wide by
20 cm high by 10 cm thick)
Phantom Front TLD # 54258
TLD # 77967
TLD # 51961
TLD # 73154
PNAD # 0137
PNAD # 0085
Phantom Side TLD # 78166
TLD # 67961
Phantom Back TLD† # 75735
TLD† # 56354
TLD† # 75943
TLD† # 63126
PNAD # 0336
PNAD #0143
2 meters from CALIBAN, free in-air TLD # 52179
TLD # 56859
TLD # 73515
TLD # 64788
PNAD # 0344
PNAD # 0364
2 2.5 meters from CALIBAN on torso phantom.
Phantom Front TLD # 70074
TLD # 75826
TLD # 80078
TLD # 72580
PNAD # 0139
PNAD # 0039
Phantom Back TLD† # 67195
TLD† # 51676
TLD† # 63698
TLD† # 74233
PNAD # 0372
PNAD # 0385 † Orientation of TLD was facing away from the reactor to simulate and individuals with their backs to the source of
the pulse.

13
Results
Overall PNAD and TLD Results Tables 3 and 4 contain the dosimetry results. Table 5 is a summary of the relative bias between
the SNL determined dose values and what was reported by CEA Valduc. ANSI N13.3 (ANSI,
1969) requires that under test conditions a criticality dosimetry system shall allow computation
of neutron absorbed dose (Dn) to within ± 25%. Test conditions apply to dosimeters mounted on
the front of the phantom (facing the source) or free in-air.
As shown in Table 5, the relative bias values (for Dn) for the front-mounted and free in-air
dosimeters range from a low of -15% to a high of 0.4 %. All values are well within the
performance limits specified in ANSI N13.3. The relative bias for gamma doses ranged for +3%
to 66%.
The relative bias in SNL total dose2 values varies from -13% to +9.6%.
Table 3: Dose Results - Pulse #1
SNL CEA Valduc
Distance
&
Location
PNAD
#
Quick-
Scan†
Triage Est.
(rad)
Dn
From‡
PNAD
Foils
(rad)
Dγ
From
TLD
(rad)
Total
(rad)
Dn*
(rad)
Dγ*
(rad)
Total*
(rad)
4 m,
Phantom
Front
0137 122 148±56.1 64 ±
10 218±40.8 170 40 210
0085 120 158±55.8
4 m,
Phantom
Side
n/a n/a 58 ±
14
n/a n/a
4 m,
Phantom
Back
0336 92 28.8±27.5
58± 6 95±22.2
0143 93 44.4±32.9
2 m, Free
In-Air
0344 68 417±74
72± 14 505±55.8 510 70 580 0364 70 450±78.6
† See Appendix B for supporting data. Assumed spectrum is a bare Godiva (spectrum #12, Ward et al, [1996])
‡ See Appendix C for supporting data. The average of the Dn values from the PNADs foils were used to calculate
the total dose. Stated uncertainty is 2σ.
* Delivered values reported by CEA Valduc.
2 Total dose = Dn + Dγ

14
Table 4: Dose Results - Pulse #2
SNL CEA Valduc
Distance
&
Location
PNAD #
Quick-Scan†
Triage Est.
(rad)
Dn From‡
PNAD
Foils
(rad)
Dγ
From
TLD
(rad)
Total
(rad)
Dn*
(rad)
Dγ*
(rad)
Total*
(rad)
2.5 m,
Phantom
Front
0139 207 516± 135
136± 26 638 500 82 582 0039 207 489± 98.5
2.5 m,
Phantom
Back
0372 108 74.9± 77.8
101± 10
0385 109 49.7± 37.8
† See Appendix B for supporting data. Assumed spectrum is a bare Godiva (spectrum #12, Ward et al, [1996])
‡ See Appendix C for supporting data. The average of the Dn values from the PNAD foils was used to calculate the
total dose. Calculated fluence values are available in this Appendix.
Table 5: Comparison of Measured to Delivered Doses.
Relative Bias (%)
Pulse # Location Dn Dγ Total Dose
1 4 m Phantom-Front -10 60 4
2 m Free In-Air -15 3 -13
2 2.5 m Phantom Front 0.4 66 9.6
Dosimeters were also mounted on the back portion of the phantoms positioned at 2.5 and 4 m.
The purpose of doing this was to estimate the worst case effect of wearer orientation on the
dosimetry results. For the phantom mounted at 4 m, the Front-to-Back ratio for Dn is (153/36.6)
or 4.18. For the phantom mounted at 2.5 m the ratio is (502/42.3) or 11.86. It is noted that the
ratio values are very dependent upon the interplay between the incident spectrum, phantom
thickness and room scatter effects. These Dn ratio values indicate that wearer orientation can
have a large effect on calculated accident dosimetry values. In a real accident situation,
extensive modeling using radiation transport codes or alternate dosimetry methods such as hair
and blood analysis (Hankins, 1980), may be the only way to address this issue.

15
The Quick-Scan process Multiple exposure rate measurements of intact PNADs were made to: (1) verify that dose
estimates are independent of the time interval between a criticality event and when the exposure
rate measurement is made, (2) to estimate the potential accuracy of the Quick-Scan dose
estimate, and (3) to see if the Quick-Scan dose values produce suitable screening results. In an
actual criticality event, only a single exposure rate measurement may be possible. Screening
results should allow the rapid identification of personnel exposures in descending order from
most-to-least severely exposed. Only a rough evaluation of doses is important at this stage
(IAEA, 1982). There is no specific guidance on dose levels, but it is desirable to separate
victims into those requiring immediate medical attention, (generally above 50 rad), those
requiring further dose analysis and possible medical attention, (generally between 10 and 50
rad), and those who should not require further medical attention unless they develop unexpected
symptoms (generally below 10 rad). This provides immediate guidance to medical services in
selecting those in need of treatment and to prevent unnecessary overcrowding of medical
facilities by lightly exposed individuals, reassurance to those who have received small or
negligible doses and a rapid indication to management of the scope of the accident (IAEA,
1982).
Comparison of Quick-Scan versus PNAD Foil Analysis values.
Measured exposure rate values and the resulting dose estimates are contained in Appendix B.
For each PNAD, measured values were plotted on the nomogram shown in Figure 3. These
experimental results verify the nomogram shown in Figure 3.
The nomogram shown in Figure 3 is based upon calculated foil activation due to a specific
neutron spectrum. If this selected spectrum is representative of the spectrum that the PNAD was
actually exposed to, both the Quick-Scan dose value and the foil analysis value should be fairly
close. If the two values are significantly different, then the analyst should suspect that the
selected spectrum may not be a good match to the actual exposure spectrum. It is noted that in
an actual criticality event, the neutron spectrum, at different points relative to the source, will
vary due to scatter and attenuation effects.
Performance at 4 m, phantom front: The Quick-Scan neutron dose estimate was 121 ± 5 rad
and the average of the PNAD foil values was 153 ± 40 rad. These values are not
significantly different and they suggest that the Bare Godiva3 spectrum chosen for this
analysis was appropriate. The Quick-Scan value would produce the correct screening result
which would be in the > 50 rad category, i.e., immediate medical attention. The foil estimate
of 153 rad was in good agreement with the 170 rad value provided by CEA Valduc.
Performance at 4 m, phantom back: The Quick-Scan neutron dose estimate was 92 ± 5 rad
and the PNAD foil value was 36.6 ± 21 rad. These values are significantly different and
3 Bare Godiva means no significant shielding between the core and the instrumentation used to make spectral
measurements.

16
suggest that the actual exposure spectrum was of lower average energy and fluence than the
Bare Godiva spectrum assumed in the calculations. Use of the Quick-Scan dose value for
screening purposes would have produced the correct screening result which would be in the >
50 rad category, i.e., immediate medical attention. The significant difference between the
two values strongly suggests to the analyst that further evaluation is needed, and that neither
estimated dose value is accurate.
Performance at 2 m, free in-air: The Quick-Scan neutron dose estimate was 69 ± 5 rad and
the PNAD foil estimate was 433 ± 54 rad. These values are significantly different. The
neutron spectrum that the PNAD sees in a phantom mounted situation with significant
absorption and reflection is different than what the free in-air PNAD sees. The Quick-Scan
dose rate is determined by the magnitude of the 115
In(n,γ)116m
In reaction which has a thermal
threshold and is affected mostly by the low energy component of the spectrum. Since the foil
dose estimate is greater than the Quick-Scan estimate, the free in-air spectrum had a smaller
proportion of low energy neutrons than the assumed Bare Godiva spectrum. This strongly
suggests that use of a different (and harder spectrum) may provide better agreement between
the free in-air Quick-Scan and foil estimates. It is noted that free in-air exposure is typical of
a fixed criticality dosimeter. Since the majority of tissue dose comes from the spectral
component above 0.1 Mev, and the 115
In(n,n’)115m
In reaction used for dosimetry responds
primarily to neutrons of 1 Mev and above, the foil dose estimate of 433 rad cannot be
discounted. It is noted that the foil dose estimate is 15% below the value given by CEA
Valduc. When analyzing PNAD and FNAD dosimeters, different neutron spectrums may
have to be used. The degree of difference between the Quick-Scan and foil estimates for a
dosimeter should be minimized when the most appropriate spectrum is used.
PNAD Foil Activation Although the In foils in each PNAD showed measureable levels of activation, none of the Cu,
Al, Ti and Ni foils showed any detectable activity based upon the dosimetry reactions shown in
Table 1. A review of the neutron fluence levels and foil cross section4 values indicated the
following:
The expected activation of the In foils is above the MDA of the counting system and activity
should be detectable.
The cross section values for the 47
Ti(n,p)47
Sc and 27
Al(n,α)24
Na reactions are (respectively)
one and three orders of magnitude smaller than for In and the anticipated amount of
activation is below the MDA of the counting system.
The expected amount of activation in the Ni foils was just below the MDA of the counting
system.
4 Spectrum # 12, Godiva Bare.
17
The current measurement process for the Cu foils relies upon the detection of a 1345.77 keV
gamma. This gamma has a yield of only 0.47%. The result is that any expected levels of
activity during this intercomparison would be below the MDA of the counting system. It was
noted that other attendees were using a different protocol for their Cu foils. The activation
product, 64
Cu, is also a positron emitter and the yield for the 511 keV annihilation radiation
photons is several orders of magnitude larger. Use of this protocol would have resulted in
the detection of measureable levels of activity in the Cu foils.
Operational Field Equipment Two types of field equipment were used during this intercomparison. Both functioned very well
and were found appropriate for their assigned tasks.
Eberline E600 with SHP270 Probe. Measurements could be performed in any
(indoor/outdoor) low background area. Each intact PNAD was placed next to the SHP270
probe (Figure 2) for about 30 seconds. An average reading value was recorded.
Falcon 5000® Portable HPGe-Based Radionuclide Identifier: This unit needs to be used in a
clean, indoor, low background area that has either 120 V or 220 V electrical power available.
The factory supplied tungsten shield was used to reduce background levels. Several other
participants also had Falcon 5000 units. Due to operational limitations (# of samples to count
and available time), counting times of only a few minutes were possible. Even with only a
few minutes of counting time, the MDA values for Indium were adequate. It was determined
that a minimum spacing of 8 – 10 feet between counting units was needed to minimize
“sample crosstalk” effects. Sample materials also needed to be stored using the same
minimum spacing to avoid high background levels.
Neutron and Gamma Dose Measurements Using the SNL TLDs Glow curves for all TLD elements were reviewed, per current processing protocol.
The SNL protocol is to obtain photon doses (Dγ) from the individual’s TLD. Glow curves
for elements 1, 2 and 3, for all TLDs, were found to be acceptable. Results are shown in
column 5 of Tables 3 and 4.
The SNL protocol for criticality dosimetry does not currently utilize information from the
neutron sensitive element on the individual’s TLD. This information could be useful to
dosimetry personnel if neutron spectral information was made available.
A review of glow curves for the neutron sensitive element of each TLD (element #4) showed
that measurement equipment had saturated due to large signals. It was determined that the
SNL TLD readers are not equipped with neutral density optical filters needed to process
dosimeters with high (> rad) neutron exposures.
An indication of potential high gamma or neutron doses on an individual’s TLD can be
obtained by examining the Quick-Scan exposure rate values for the associated PNAD. If

18
there is any measureable exposure rate from the PNAD, then the associated TLD should be
processed as if it has received a high gamma/neutron exposure.
When exposed to a large neutron fluence, the tin and copper filters, in the badge holder, will
become activated. The X-ray and gamma emissions from the activated filters will
subsequently contribute to the exposure of the TLD elements in the badge. As a good
practice, dosimetry personnel should remove the TLD cards from their holders as soon as
possible to minimize this effect.
Upon retrieval, irradiated PNADs and TLD badges were not stored together. After retrieval
from CALIBAN, TLD cards were removed from their holders to minimize irradiation effects
due to activated filter elements (appendix A, Figure A-2.)
Conclusions The SNL Personal Nuclear Accident Dosimeter (PNAD) meets the ANSI N13.3 performance
standard for determination of absorbed dose to within ± 25%.
There is a need to review the current protocol for counting the Cu foils. The current
measurement process for the Cu foils relies upon the detection of a 1345.77 keV gamma from 64
Cu which is produced by the following reaction: 63
Cu(n,)64
Cu. Unfortunately, the yield for
this gamma is only 0.47%, which makes use of the Cu foils impractical at neutron doses less that
several hundreds of rad. It was noted that other attendees were using a different protocol for their
Cu foils. The activation product, 64
Cu, is also a positron emitter and the yield for the 511 keV
annihilation radiation photons is several orders of magnitude larger. Use of this different
protocol will allow better utilization of information from the Cu foils.
There is a need to equip the SNL TLD readers with neutral density optical filters to allow the
processing of dosimeters with high (> rad) neutron exposures.

19
References
American National Standards Institute (ANSI) Standard N13.3-1969 (R1981), Dosimetry For
Criticality Accidents, American National Standards Institute, New York, New York.
Casoli, P.; Authier, N., Reactivity Worth Measurements with Caliban and Silene Experimental
Reactors, International Conference on Nuclear Data for Science and Technology 2007.
Hankins, D. E., Dosimetry of Criticality Accidents Using Activation of The Blood and Hair,
Health Physics 38, No. 4, pp. 529-541, April, 1980.
Hill, Carolyn D., 2004, Verification and Documentation of the Sandia PNAD Quick-Scan
Procedure, SAND2004-5828P, Sandia National Laboratories, Albuquerque, NM.
International Atomic Energy Agency (IAEA). Compendium of Neutron Spectra in Criticality
Accident Dosimetry. Technical Report Series No. 180. IAEA. 1978
International Atomic Energy Agency (IAEA). 1982. Dosimetry for Criticality Accidents, A
Manual, IAEA Technical Reports Series No. 211, Vienna, Austria: IAEA.
P. J. Griffin, J. G. Kelly, T. F. Luera, J. VanDenburg, 1993. SNL RML Recommended
Dosimetry Cross Section Compendium, SAND92-0094. Sandia National Laboratories,
Albuquerque NM.
Ward, D. C.; Mohagheghi, A., and Burrows, R. Personal Nuclear Accident Dosimetry at Sandia
National Laboratories, Sand Report SAND96-2204, September 1996.

A - 1
APPENDIX A: Description of the Thermo Electron Type 8823 TLD
The Thermo Electron5 Type 8825 whole-body dosimeter (Figure A-1) consists of a four-element
aluminum TLD card holder containing three TLD-700 (7LiF:Mg,Ti) chips and one TLD-600 chip,
surrounded by a polyethylene case containing filtration for each of the four chips. The TLD-700
chips in positions one and two are 0.38 mm (0.015 in.) thick, while the position three chip is 0.15
mm (0.006 in.) thick. The TLD-600 chip in position four is 0.38 mm (0.015 in.) thick. All chips
measure 3mm × 3mm (1/8 × 1/8) in. in area. The 8825 holder filtration for element 1 consists of a
91 mg/cm2 copper filter and 242 mg/cm2 ABS plastic. Element 2 is filtered by 1000 mg/cm2
PTFE and ABS plastic. Element 3 is filtered by 8 mg/cm2 Teflon and 9 mg/cm2 Mylar. Element
4 filtration consists of 240 mg/cm2 ABS plastic and 463 mg/cm2 tin.
Each chip/filter combination performs a specific function as follows:
• The TLD-700 chip in Element 1 with its ABS and copper filter is used for low energy photon
discrimination and dose to the lens of the eye measurement.
• The TLD-700 chip in Element 2 with its PTFE/ABS filtration measures deep dose.
• The thin TLD-700 chip in Element 3 with its aluminized Mylar filter is used for shallow dose
determination.
• The TLD-600 chip with its ABS and tin filters is located in Element 4 and is used for neutron dose
measurement and medium energy photon discrimination.
Figure A- 1: The four type 8823 dosimeter card elements and associated filters.
5 Thermo Electron Corporation (formerly Solon Technologies, Inc. and the Englehard Corporation). Prior to that, the
company’s name was the Harshaw/Filtrol Partnership. For brevity, this report will reference the company name as
“Thermo.”

A - 2
Figure A-2: Picture of the Thermo Electron four-element aluminum TLD card and polyethylene
case front with Cu and Sn filters.

B - 1
APPENDIX B: Quick-Scan Data
Quick-Scan results for Pulse #1, on Phantom For this exposure, the PNADs were mounted on a 30 cm wide X 20 cm high X 10 cm thick
Lucite phantom, at a distance of 4 meters from CALIBAN. PNAD locations are indicated in
Table B-1. The Quick-scan procedure uses a nomogram based upon a bare Godiva spectrum
(spectrum #12, Ward et al, [1996]). This spectrum was considered to be the most representative
for work at Sandia. In this particular intercomparison, a bare Godiva spectrum is also considered
to be representative of the CALIBAN spectrum. Quick-scan results will therefore be the most
accurate for the two PNADs placed on the front of the phantom. The results for the two PNADs
on the backside of the phantom will be slightly different due to moderation and attenuation of the
neutron spectrum as it passes through the phantom material. The intent of a front-to-back
comparison is to estimate the error associated with applying the current Quick-scan process
without regard to the orientation of the wearer.
Table B-1 contains measured exposure rate data for both the front and back mounted PNADs.
The time between exposure and retrieval from CALIBAN was about three hours. Even after 3 to
4 hours post-exposure time, each PNAD had an easily measureable exposure rate. This exposure
rate is due mainly to the short lived isotope of 116
In. In an accident situation, only a single
Quick-scan measurement of exposure rate is needed. After the Quick-scan measurement is
completed, a further delay of several hours will be needed to allow for additional decay of the 116
In activity in the Indium foil. This delay is suggested in order to minimize the dead time of
the counting system. During this cool-down time, the other PNAD foils can be counted.
Table B-1: Quick-Scan Data for Pulse # 1; On Phantom
Time Since
“Accident”
(min)
Exposure Rate (mR/h)
Front Backside
# 0137 # 0085 # 0336 # 0143
196 17.6 17.4
204 12.2 11.8
209 15.1 14.7
218 13.5 13.4 10.0
220 13.4
228 9.1 9.1
237 11.1 10.4
283 6.2
286 4.5
318 3.0 2.9
341 2.40

B - 2
Figures B-1 through B-4 show results from individual PNADs. The series of measurements for
each PNAD was plotted and a best-fit line was added. The estimated neutron dose (Dn) was
determined based upon the value of the best-fit line. Using this process, the two front mounted
PNADs suggested neutron doses of 122 ± 2 and 120 ± 2 rad, and the two back mounted PNADs
suggested doses of 92 ± 2 and 93 ± 2 rad.
Figure B- 1: Quick-Scan data from PNAD # 0137. This PNAD was front mounted on the
phantom.
Both the front and back sets of readings suggest an excellent reproducibility of just a few percent
(± 2%) between individual PNAD s. The average of the two front readings was 121 rad and the
average of the two back readings was 92 rad. Both average values are sufficient for medical
triage purposes. This suggests that the Quick-scan process does not need to be modified to
account for wearer orientation with respect to the neutron source.
1.00
10.00
100.00
150 200 250 300
Mea
sure
d E
xp
osu
re R
ate
(mR
/ h
r)
Time Since Criticality (min)
100 rad
150 rad
Best Fit Value of 122 rad
Quickscan Measurements

B - 3
Figure B-2: Quick-Scan data from PNAD # 0085. This PNAD was front mounted on the
Phantom.
Figure B-3: Quick-Scan data from PNAD # 0336. The PNAD was back mounted on the
phantom.
1
10
100
150 200 250 300
Mea
sure
d E
xp
osu
re R
ate
(mR
/hr)
Time Since Criticality (min)
100 rad
150 rad
Best fit Value of 120 rad
Quickscan Measurements
1.00
10.00
100.00
150 200 250 300
Mea
usr
ed E
xp
osu
re R
ate
(mR
/hr)
Time since Criticality (min)
70 rad
100 rad
Best Fit Value of 92 rad
Quickscan Measurements

B - 4
Figure B-4: Quick-Scan data from PNAD # 0143. This PNAD was back mounted on the
phantom.
Quick-Scan results for Pulse #1, Free In-Air The Quick-Scan procedure was performed on two PNADs mounted free in-air. The PNADs
were located at a distance of 2 meters from CALIBAN. Results are shown in Figures B-5 and B-
6.
Table B-2: Quick-Scan Data For Pulse # 1; Free In-Air
Time Since
“Accident”
(min)
PNAD # 0344 PNAD # 0364
215 7.8 8.3
227 7.1 6.8
284 3.2
285 3.2
318 2.2 2.4
341 1.60 1.60
360 1.42 1.41
380 1.22
1.00
10.00
100.00
150 200 250 300
Mea
usr
ed E
xp
osu
re R
ate
(mR
/hr)
Time since Criticality (min)
70 rad100 radBest Fit Value of 93 radQuickscan Measurements

B - 5
Figure B-5: Quick-Scan data from PNAD # 0344. This PNAD was free in-air.
Figure B-6: Quick-Scan data from PNAD # 0364. This PNAD was free in-air.
0.10
1.00
10.00
200 250 300 350
Mea
usr
ed E
xp
osu
re R
ate
(mR
/hr)
Time since Criticality (min)
100 rad
50 rad
Best fit value of 68 rad
Quickscan Measurements
0.10
1.00
10.00
200 250 300 350
Mea
usr
ed E
xp
osu
re R
ate
(mR
/hr)
Time since Criticality (min)
100 rad
50 rad
Best Fit of 70 rad
Quickscan Measurements

B - 6
Quick-scan Results for Pulse # 2 – Torso Phantom
Table B-3: Quick-Scan Data For Pulse # 2; On Torso Phantom
Time Since
“Accident”
(min)
Exposure Rate (mR/h)
Front Backside
# 0139 # 0039 # 0372 # 0385
181 19.8 19.8
191 31.9 32.0
196 16.2
216 12.1
217 22.9
218 23.4
236 18.6 9.8
247 16.2 8.3
279 10.7
Figure B-7: Quick-Scan data from PNAD # 0139. This PNAD was front mounted on a human
torso phantom. The phantom was located at a distance of 2.5 m from CALIBAN.
1.00
10.00
100.00
150 200 250 300
Mea
sure
d E
xp
osu
re R
ate
(mR
/ h
r)
Time Since Criticality (min)
400 rad
Best Fit Value of 207 rad
100 rad
Quickscan Measurements

B - 7
Figure B-8: Quick-Scan data from PNAD # 0039. This PNAD was front mounted on a human
torso phantom. The front side of the phantom was located at a distance of 2.5 m from
CALIBAN.
Figure B-9: Quick-Scan data from PNAD # 0372. This PNAD was back mounted on a human
torso phantom. The front side of the phantom was located at a distance of 2.5 m from
CALIBAN.
1.00
10.00
100.00
150 200 250 300
Mea
sure
d E
xp
osu
re R
ate
(mR
/ h
r)
Time Since Criticality (min)
400 rad
Best Fit Value of 207 rad
100 rad
Quickscan Measurements
1.00
10.00
100.00
150 200 250 300
Mea
sure
d E
xp
osu
re R
ate
(mR
/ h
r)
Time Since Criticality (min)
150 rad
Best Fit Value of 108 rad
70 rad
Quickscan Measurements

B - 8
Figure B-10: Quick-Scan data from PNAD # 0385. This PNAD was back mounted on a human
torso phantom. The phantom was located at a distance of 2.5 m from CALIBAN.
1.00
10.00
100.00
150 200 250 300
Mea
sure
d E
xp
osu
re R
ate
(mR
/ h
r)
Time Since Criticality (min)
150 rad
Best Fit Value of 109 rad
70 rad
Quickscan Measurements

C - 1
APPENDIX C: PNAD Data Tables
PNAD
#
SET UP: Pulse # 1, On Phantom,
Front Materials
0137 Spectrum Type†: # 12 Godiva
Bare In Cu Ti Ni Al
Foil Wt (g) 0.2300 0.6095 0.524 0.8371 0.271
MDA (u`Ci) 5.42E-03 N/A N/A N/A N/A
Foil Activity (uCi) 8.87E-03 NDA NDA NDA NDA
Uncertainty in Foil Activity (2σ) 3.81E-03 N/A N/A N/A N/A
A=Specific Foil Activity (uCi/g) 3.86E-02 N/A N/A N/A N/A
(nrad n-1
cm2)† 2.07 2.07 2.07 2.07 2.07
Effective Cross Section‡ 0.101 0.101 0.0103 0.0607 0.000693
(nrad n-1
cm2) †† 0.255 0.255 0.255 0.255 0.255
Φ = Fluence (n/cm2) 6.38E+10 N/A N/A N/A N/A
DHP = Absorbed Dose (rad) 1.32E+02 N/A N/A N/A N/A
Dnγ = Capture Gamma Dose (rad) 1.63E+1 N/A N/A N/A N/A
Dn = Total Neutron Dose* 1.48E+02 N/A N/A N/A N/A
Uncertainty In Absorbed Dose 5.67E+01 N/A N/A N/A N/A
† Heavy particle dose conversion factor. DHP = Φ * .
‡Values selected from Ward et al., 1996, Appendix A
†† Conversion factor for dose from gamma rays produced by
1H(n,γ)
2H reaction. Dnγ = * Φ
* Dn = DHP + Dnγ

C - 2
PNAD
#
SET UP: Pulse # 1, On Phantom,
Front Materials
0085 Spectrum Type†: # 12 Godiva
Bare In Cu Ti Ni Al
Foil Wt (g) 0.2270 0.6075 0.5207 0.8312 0.2709
MDA (uCi) 5.13E-03 N/A N/A N/A N/A
Foil Activity (uCi) 9.36E-03 NDA NDA NDA NDA
Uncertainty in Foil Activity (2σ) 3.70E-03 N/A N/A N/A N/A
A=Specific Foil Activity (uCi/g) 4.12E-02 N/A N/A N/A N/A
† (nrad n-1
cm2) 2.07 2.07 2.07 2.07 2.07
Effective Cross Section‡ 0.101 0.101 0.0103 0.0607 0.000693
(nrad n-1
cm2) †† 0.255 0.255 0.255 0.255 0.255
Φ = Fluence (n/cm2) 6.82E+10 N/A N/A N/A N/A
DHP = Absorbed Dose (rad) 1.41E+02 N/A N/A N/A N/A
Dnγ = Capture Gamma Dose (rad) 1.74E+1 N/A N/A N/A N/A
Dn = Total Neutron Dose* (rad) 1.58E+02 N/A N/A N/A N/A
Uncertainty In Absorbed Dose 5.58E+01 N/A N/A N/A N/A
† Heavy particle dose conversion factor. DHP = Φ * .
‡Values selected from Ward et al., 1996, Appendix A
†† Conversion factor for dose from gamma rays produced by
1H(n,γ)
2H reaction. Dnγ = * Φ
* Dn = DHP + Dnγ

C - 3
PNAD
#
SET UP: Pulse # 1, On Phantom,
Back Materials
0336 Spectrum Type†: # 13 Godiva
with 12 cm Lucite In Cu Ti Ni Al
Foil Wt (g) 0.2177 0.603 0.5222 0.8327 0.2737
MDA (uCi) 2.97E-03 N/A N/A N/A N/A
Foil Activity (uCi) 1.68E-03 NDA NDA NDA NDA
Uncertainty in Foil Activity (2σ) 1.86E-03 N/A N/A N/A N/A
A=Specific Foil Activity (uCi/g) 7.72E-03 N/A N/A N/A N/A
† (nrad n-1
cm2) 1.4 2.07 2.07 2.07 2.07
Effective Cross Section‡ 0.0728 0.143 0.0064 0.0364 0.000257
(nrad n-1
cm2) †† 0.228 0.228 0.228 0.228 0.228
Φ = Fluence (n/cm2) 1.77E+10 N/A N/A N/A N/A
DHP = Absorbed Dose (rad) 2.48E+01 N/A N/A N/A N/A
Dnγ = Capture Gamma Dose (rad) 4.04E+00 N/A N/A N/A N/A
Dn = Total Neutron Dose* (rad) 2.88E+01 N/A N/A N/A N/A
Uncertainty In Absorbed Dose 2.75E+01 N/A N/A N/A N/A
† Heavy particle dose conversion factor. DHP = Φ * .
‡ Values selected from Ward et al., 1996, Appendix A
†† Conversion factor for dose from gamma rays produced by
1H(n,γ)
2H reaction. Dnγ = * Φ
* Dn = DHP + Dnγ

C - 4
PNAD
#
SET UP: Pulse # 1, On Phantom,
Back Materials
0143 Spectrum Type†: # 13 Godiva
with 12 cm Lucite In Cu Ti Ni Al
Foil Wt (g) 0.2253 0.6127 0.5237 0.8356 0.2731
MDA (uCi) 3.62E-03 9.09E-02 1.96E-04 3.04E-04 3.67E-04
Foil Activity (uCi) 2.68E-03 NDA NDA NDA NDA
Uncertainty in Foil Activity (2σ) 2.31E-03 N/A N/A N/A N/A
A=Specific Foil Activity (uCi/g) 1.19E-02 N/A N/A N/A N/A
† (nrad n-1
cm2) 1.4 1.4 1.4 1.4 1.4
Effective Cross Section‡ 0.0728 0.143 0.0064 0.0364 0.000257
(nrad n-1
cm2) †† 0.228 0.228 0.228 0.228 0.228
Φ = Fluence (n/cm2) 2.73E+10 N/A N/A N/A N/A
DHP = Absorbed Dose (rad) 3.82E+01 N/A N/A N/A N/A
Dnγ = Capture Gamma Dose (rad) 6.22E+00 N/A N/A N/A N/A
Dn = Total Neutron Dose* (rad) 4.44E+01 N/A N/A N/A N/A
Uncertainty In Absorbed Dose 3.29E+01 N/A N/A N/A N/A
† Heavy particle dose conversion factor. DHP = Φ * .
‡Values selected from Ward et al., 1996, Appendix A
†† Conversion factor for dose from gamma rays produced by
1H(n,γ)
2H reaction. Dnγ = * Φ
* Dn = DHP + Dnγ

C - 5
PNAD
#
SET UP: Pulse # 1, Free In-Air, 2
m from CALIBAN Materials
0344 Spectrum Type†: # 12 Godiva
Bare In Cu Ti Ni Al
Foil Wt (g) 0.2318 0.6127 0.5333 0.8355 0.2707
MDA (uCi) 2.48E-03 N/A N/A N/A N/A
Foil Activity (uCi) 2.51E-02 NDA NDA NDA NDA
Uncertainty in Foil Activity (2σ) 5.01E-03 N/A N/A N/A N/A
A=Specific Foil Activity (uCi/g) 1.08E-01 N/A N/A N/A N/A
† (nrad n-1
cm2) 2.07 2.07 2.07 2.07 2.07
Effective Cross Section‡ 0.101 0.101 0.0103 0.0607 0.000693
(nrad n-1
cm2) †† 0.255 0.255 0.255 0.255 0.255
Φ = Fluence (n/cm2) 1.79E+11 N/A N/A N/A N/A
DHP = Absorbed Dose (rad) 3.71E+02 N/A N/A N/A N/A
Dnγ = Capture Gamma Dose (rad) 4.56E+01 N/A N/A N/A N/A
Dn = Total Neutron Dose* (rad) 4.17E+02 N/A N/A N/A N/A
Uncertainty In Absorbed Dose 7.40E+01 N/A N/A N/A N/A
† Heavy particle dose conversion factor. DHP = Φ * .
‡Values selected from Ward et al., 1996, Appendix A
†† Conversion factor for dose from gamma rays produced by
1H(n,γ)
2H reaction. Dnγ = * Φ
* Dn = DHP + Dnγ
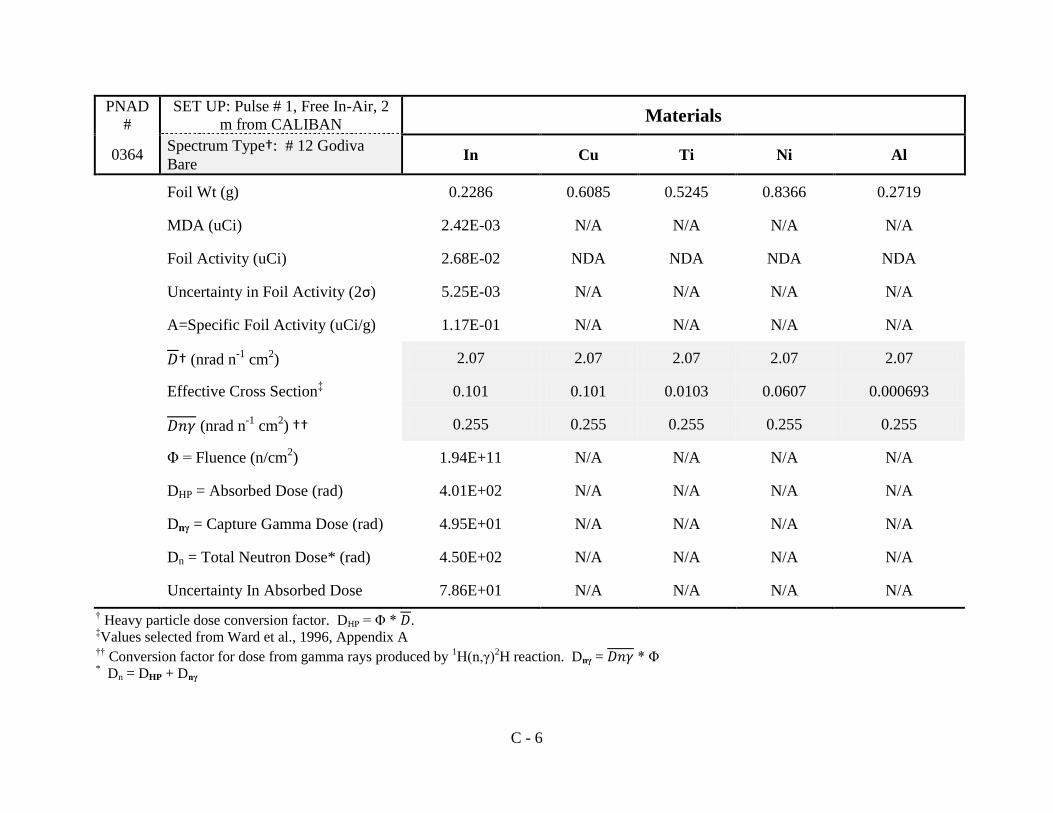
C - 6
PNAD
#
SET UP: Pulse # 1, Free In-Air, 2
m from CALIBAN Materials
0364 Spectrum Type†: # 12 Godiva
Bare In Cu Ti Ni Al
Foil Wt (g) 0.2286 0.6085 0.5245 0.8366 0.2719
MDA (uCi) 2.42E-03 N/A N/A N/A N/A
Foil Activity (uCi) 2.68E-02 NDA NDA NDA NDA
Uncertainty in Foil Activity (2σ) 5.25E-03 N/A N/A N/A N/A
A=Specific Foil Activity (uCi/g) 1.17E-01 N/A N/A N/A N/A
† (nrad n-1
cm2) 2.07 2.07 2.07 2.07 2.07
Effective Cross Section‡ 0.101 0.101 0.0103 0.0607 0.000693
(nrad n-1
cm2) †† 0.255 0.255 0.255 0.255 0.255
Φ = Fluence (n/cm2) 1.94E+11 N/A N/A N/A N/A
DHP = Absorbed Dose (rad) 4.01E+02 N/A N/A N/A N/A
Dnγ = Capture Gamma Dose (rad) 4.95E+01 N/A N/A N/A N/A
Dn = Total Neutron Dose* (rad) 4.50E+02 N/A N/A N/A N/A
Uncertainty In Absorbed Dose 7.86E+01 N/A N/A N/A N/A
† Heavy particle dose conversion factor. DHP = Φ * .
‡Values selected from Ward et al., 1996, Appendix A
†† Conversion factor for dose from gamma rays produced by
1H(n,γ)
2H reaction. Dnγ = * Φ
* Dn = DHP + Dnγ

C - 7
PNAD
#
SET UP: Pulse # 2, On Torso
Phantom, Front, 2.5 m from
CALIBAN Materials
0139 Spectrum Type†: # 12 Godiva
Bare In Cu Ti Ni Al
Foil Wt (g) 0.2273 0.6099 0.5215 0.8303 0.2704
MDA (uCi) 1.03E-02 N/A N/A N/A N/A
Foil Activity (uCi) 3.05E-02 NDA NDA NDA NDA
Uncertainty in Foil Activity (2σ) 8.95E-03 N/A N/A N/A N/A
A=Specific Foil Activity (uCi/g) 1.34E-01 N/A N/A N/A N/A
† (nrad n-1
cm2) 2.07 2.07 2.07 2.07 2.07
Effective Cross Section‡ 0.101 0.101 0.0103 0.0607 0.000693
(nrad n-1
cm2) †† 0.255 0.255 0.255 0.255 0.255
Φ = Fluence (n/cm2) 2.22E+11 N/A N/A N/A N/A
DHP = Absorbed Dose (rad) 4.59E+02 N/A N/A N/A N/A
Dnγ = Capture Gamma Dose 5.66E+01 N/A N/A N/A N/A
Dn = Total Neutron Dose* 5.16E+02 N/A N/A N/A N/A
Uncertainty In Absorbed Dose 1.35E+02 N/A N/A N/A N/A
† Heavy particle dose conversion factor. DHP = Φ * .
‡Values selected from Ward et al., 1996, Appendix A
†† Conversion factor for dose from gamma rays produced by
1H(n,γ)
2H reaction. Dnγ = * Φ
* Dn = DHP + Dnγ

C - 8
PNAD
#
SET UP: Pulse # 2, On Torso
Phantom, Front, 2.5 m from
CALIBAN Materials
0039 Spectrum Type†: # 12 Godiva
Bare In Cu Ti Ni Al
Foil Wt (g) 0.2259 0.6038 0.5261 0.8304 0.2713
MDA (uCi) 5.71E-03 N/A N/A N/A N/A
Foil Activity (uCi) 2.87E-02 NDA NDA NDA NDA
Uncertainty in Foil Activity (2σ) 6.50E-03 N/A N/A N/A N/A
A=Specific Foil Activity (uCi/g) 1.27E-01 N/A N/A N/A N/A
† (nrad n-1
cm2) 2.07 2.07 2.07 2.07 2.07
Effective Cross Section‡ 0.101 0.101 0.0103 0.0607 0.000693
(nrad n-1
cm2) †† 0.255 0.255 0.255 0.255 0.255
Φ = Fluence (n/cm2) 2.10E+11 N/A N/A N/A N/A
DHP = Absorbed Dose (rad) 4.35E+02 N/A N/A N/A N/A
Dnγ = Capture Gamma Dose (rad) 5.36E+01 N/A N/A N/A N/A
Dn = Total Neutron Dose* 4.89E+02 N/A N/A N/A N/A
Uncertainty In Absorbed Dose 9.85E+01 N/A N/A N/A N/A
† Heavy particle dose conversion factor. DHP = Φ * .
‡Values selected from Ward et al., 1996, Appendix A
†† Conversion factor for dose from gamma rays produced by
1H(n,γ)
2H reaction. Dnγ = * Φ
* Dn = DHP + Dnγ
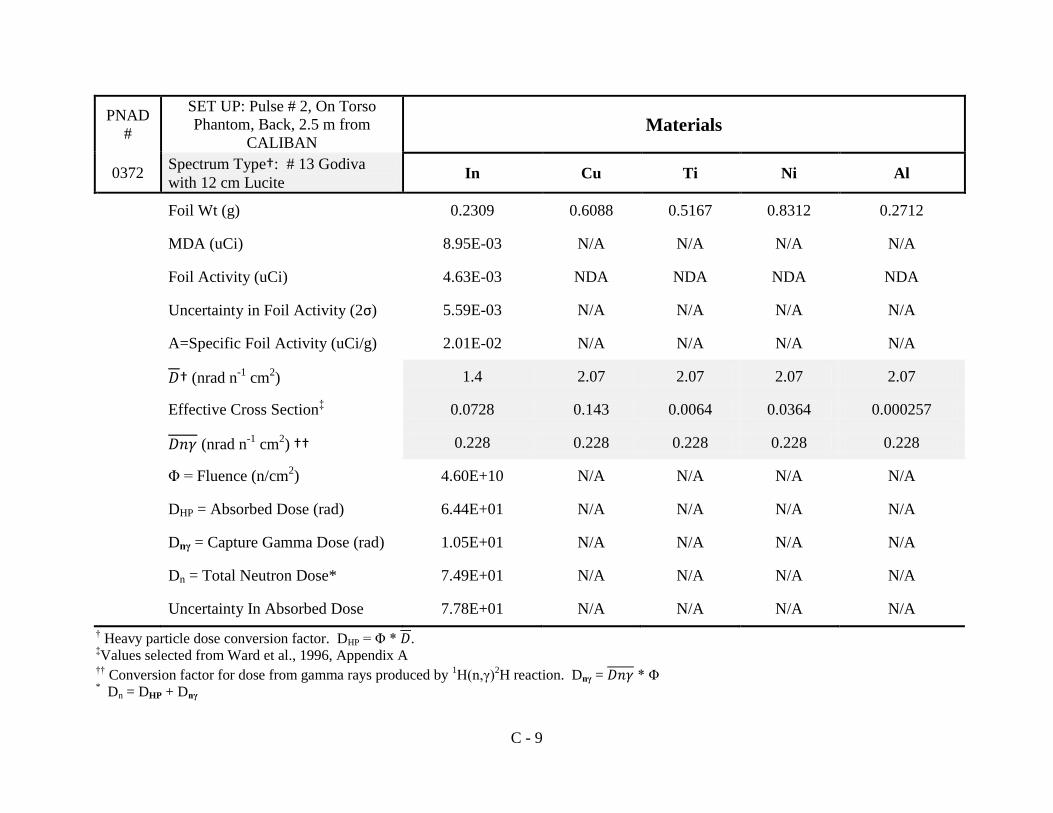
C - 9
PNAD
#
SET UP: Pulse # 2, On Torso
Phantom, Back, 2.5 m from
CALIBAN Materials
0372 Spectrum Type†: # 13 Godiva
with 12 cm Lucite In Cu Ti Ni Al
Foil Wt (g) 0.2309 0.6088 0.5167 0.8312 0.2712
MDA (uCi) 8.95E-03 N/A N/A N/A N/A
Foil Activity (uCi) 4.63E-03 NDA NDA NDA NDA
Uncertainty in Foil Activity (2σ) 5.59E-03 N/A N/A N/A N/A
A=Specific Foil Activity (uCi/g) 2.01E-02 N/A N/A N/A N/A
† (nrad n-1
cm2) 1.4 2.07 2.07 2.07 2.07
Effective Cross Section‡ 0.0728 0.143 0.0064 0.0364 0.000257
(nrad n-1
cm2) †† 0.228 0.228 0.228 0.228 0.228
Φ = Fluence (n/cm2) 4.60E+10 N/A N/A N/A N/A
DHP = Absorbed Dose (rad) 6.44E+01 N/A N/A N/A N/A
Dnγ = Capture Gamma Dose (rad) 1.05E+01 N/A N/A N/A N/A
Dn = Total Neutron Dose* 7.49E+01 N/A N/A N/A N/A
Uncertainty In Absorbed Dose 7.78E+01 N/A N/A N/A N/A
† Heavy particle dose conversion factor. DHP = Φ * .
‡Values selected from Ward et al., 1996, Appendix A
†† Conversion factor for dose from gamma rays produced by
1H(n,γ)
2H reaction. Dnγ = * Φ
* Dn = DHP + Dnγ

C - 10
PNAD
#
SET UP: Pulse # 2, On Torso
Phantom, Back, 2.5 m from
CALIBAN Materials
0385 Spectrum Type†: # 13 Godiva
with 12 cm Lucite In Cu Ti Ni Al
Foil Wt (g) 0.2310 0.6024 0.5248 0.8308 0.2724
MDA (uCi) 4.28E-03 N/A N/A N/A N/A
Foil Activity (uCi) 3.07E-03 NDA NDA NDA NDA
Uncertainty in Foil Activity (2σ) 2.72E-03 N/A N/A N/A N/A
A=Specific Foil Activity (uCi/g) 1.33E-02 N/A N/A N/A N/A
† (nrad n-1
cm2) 1.4 0.143 0.0064 0.0364 0.000257
Effective Cross Section‡ 0.0728 0.143 0.0064 0.0364 0.000257
(nrad n-1
cm2) †† 0.228 0.228 0.228 0.228 0.228
Φ = Fluence (n/cm2) 3.05E+10 N/A N/A N/A N/A
DHP = Absorbed Dose (rad) 4.27E+01 N/A N/A N/A N/A
Dnγ = Capture Gamma Dose (rad) 6.95E+0 N/A N/A N/A N/A
Dn = Total Neutron Dose* 4.97E+01 N/A N/A N/A N/A
Uncertainty In Absorbed Dose 3.78E+01 N/A N/A N/A N/A
† Heavy particle dose conversion factor. DHP = Φ * .
‡Values selected from Ward et al., 1996, Appendix A
†† Conversion factor for dose from gamma rays produced by
1H(n,γ)
2H reaction. Dnγ = * Φ
* Dn = DHP + Dnγ

D - 1
APPENDIX D: Quick-Scan Nomograms Technical Basis
The following example can be used to reproduce the nomogram shown in Figure 3 of the main
report. Data used in the development of this nomogram is for a Bare Godiva – LANL Spectrum
(Spectrum Type #126). The only foil in the SNL PNAD that will have a sufficient level of
activation that can be detected with portable health physics survey equipment is the Indium (In)
foil. The following information is taken from the reference listed in footnote 4 below.
Figure D-1: Extract of dosimetry information relevant to Spectrum Type # 12
6 Appendix A – Dosimetry Data; Ward, D. C.; Mohagheghi, A., and Burrows, R., Personal Nuclear Accident
Dosimetry at Sandia National Laboratories, Sand Report SAND96-2204, September 1996.
Spectrum
Type
Spectrum-
Averaged
Cross Section
(barns)
#12
GODIVA
Bare,
Measured
at LANL
63Cu(n,)
64Cu 0.101
115In(n,n’)
115mIn 0.101
58Ni (n,p)
58Co 0.0607
47Ti(n,p)
47Sc 0.0103
27Al(n,)
24Na 0.000693
23Na(n,)
24Na 0.0191
197Au(n,)
198Au 24.9
K nrad
n cm/ 2 1.79
D nrad
n cm/ 2 2.07
DE nrem
n cm/ 2 20.7
D nrad
n cm/ 2 0.255
Average cross-section in barns, for
the spectrum Type. The value for
the 115
In(n,n’)115m
In reaction is used
for nomogram development.
D = Average recoil-particle dose to
Auxier phantom element 57 (in
nanorad/(n/cm2)). For more
information, see Page # 13,
International Atomic Energy
Agency (IAEA), Compendium Of
Neutron Spectra In Criticality
Accident Dosimetry. Technical
Report Series No. 180. IAEA. 1978

D - 2
To develop a nomogram for a particular neutron spectrum, the average cross-section value for
the 115
In(n,)116m
In reaction is also required. Values are provided in Table D-1 below.
Table D- 1: Average Cross-Section Values for the 115
In(n,γ)116m
In Reaction
Spectrum Type
Average
Cross-Section
(barns)
Spectrum Type
Average
Cross-Section
(barns)
#1
WATT 0.160
#19
H2O Solution,
5 cm Diameter
3.54
#2
GODIVA (Taken from Ing and
Makra, 1990)
0.183 #20
SPRIII, Central Cavity 0.245
#3
1/E + WATT 364.
#21
Cf-252, from NBS Compendium 0.154
#4
ZPR-6, 4Z+, Thermal 43.2
#22
Fission Neutrons through
Concrete (10 cm)a
2.05
#5
FISSION through
10 cm Carbon
15.5 #23
Fission Neutrons through
Concrete (20 cm) a
11.5
#6
FISSION through 90 cm Water 59.9
#24
Fission Neutrons through
Concrete (30 cm) a
19.8
#7
20 cm Li-H Slab 25.4
#25
Fission Neutrons through
Concrete (40 cm) a
23.6
#8
Graphite Test Lattice 255.
#26
Fission Neutrons through
Polyethylene (5 cm)b
58.9
#9
FERMI Reactor Test
8.33 #27
Fission Neutrons through
Polyethylene (10 cm)
93.5
#10
SPR-III 17” Leakage 3.61
#28
Fission Neutrons through
Polyethylene (20 cm) b
97.2
#11
ACRR Central Cavity 114.
#29
Fission Neutrons through
Polyethylene (40 cm) b
86.9
#12
GODIVA Bare, Measured at
LANL
40.4 #30
Fission Neutrons through
Polyethylene (60 cm) b
80.1
#13
GODIVA with 12 cm Lucite,
Measured at LANL
140 #31
Fission Neutrons through Iron (5
cm)c
0.186
#14
GODIVA with 20 cm Concrete
Measured at LANL
166. #32
Fission Neutrons through Iron (10
cm) c
0.206

D - 3
Spectrum Type
Average
Cross-Section
(barns)
Spectrum Type
Average
Cross-Section
(barns)
#15
SHEBA Bare, Measured at
LANL
47.8 #33
Fission Neutrons through Iron (20
cm) c
0.260
#16
H2O Solution, 50 cm Diameter 7.00
#34
Fission Neutrons through Iron (30
cm) c
0.275
#17
H2O Solution, 30 cm Diameter 6.52
#35
Fission Neutrons through Iron (50
cm) c
0.720
#18
H2O Solution, 10 cm Diameter 5.76
a Taken from page 88, Ing & Makra, 1978.
b Taken from page 80, Ing & Makra, 1978
c Taken from page 100, Ing & Makra, 1978
The following calculations will produce the estimated exposure rate reading for a PNAD
exposed to a neutron fluence (spectrum Type # 12) that will deposit 100 rad recoil particle dose
to phantom element #57. Estimated exposure rate readings for other doses can then be scaled to
this value.
Required fluence for 100 rad recoil particle dose:
D Eqn D-1
Eqn D-2
Eqn D-3

D - 4
Number of 115
In atoms in a SNL In foil:
Atomic wt of In: 114.818 g/mole
Average Indium foil weight: 0.228 g
Foil purity: 99.9%
% abundance of 115
In atoms: 95.71%
Eqn D-4
1.14 x 10²¹
atoms Eqn D-5
Determination of 116m
In Initial Activity in a Counting foil
Number of 116m
In atoms in foil immediately after irradiation = No-116m
Cross Section for 115
In(n,)116m
In reaction,
Spectrum type # 12 = 40.4 barns (Table D-1)
Eqn D-6
2.22 x 10⁹
nuclei Eqn D-7
Activity of 116m
In in foil immediately after irradiation = Ao-116m
Decay constant for 116m
In (λ116m) = 2.12 x 10⁻⁴
Bq s-1
nuclei-1
Eqn D-8
1.27 x 101
µCi Eqn D-9

D - 5
Determination of 115m
In Initial Activity in a Counting foil
Number of 115m
In atoms in foil immediately after irradiation = No-115m
Cross Section for 115
In(n,n’)115m
In reaction,
Spectrum type # 12 = 0.101 barns (Fig. D-1)
Eqn D-10
5.56 x 10⁶
nuclei Eqn D-11
Activity of 116m
In in foil immediately after irradiation = Ao-116m
Decay constant for 115m
In (λ115m) = 4.29 x 10⁻⁵
Bq s-1
nuclei-1
Gamma constant for 115m
In = 1.97 x 10⁻⁴
mrem/h/µCi @ 1m
Eqn D-12
6.45 x 10⁻³
µCi Eqn D-13
Expected initial exposure rate from foil due to 116m
In activity = .
NOTE: This calculation is based upon equipment and measurement geometry shown in
Figure 2 of the main report. The measured distance from the foil to the center of the
active detector volume is 1 cm. Based upon the relative size of the foil and the detector,
point source geometry is assumed.
Gamma constant for 116m
In = 1.354 x 10⁻³
mrem/h/µCi @ 1m
Eqn D-14
1.72 x 10² mrem h
-1 Eqn D-15

D - 6
Expected initial exposure rate from foil due to 115m
In activity = .
NOTE: This calculation is based upon equipment and measurement geometry shown in
Figure 2 of the main report. The measured distance from the foil to the center of the
active detector volume is 1 cm. Based upon the relative size of the foil and the detector,
point source geometry is assumed.
Gamma constant for 115m
In = 1.97 x 10⁻⁴
mrem/h/µCi @ 1m
Eqn D-16
1.27 x 10⁻²
mrem h-1
Eqn D-17
Comparison of Initial Exposure Rates
The ratio of
=
Eqn D-18
This ratio indicates that any measurable exposure rate values will be determined essentially by
the 116m
In component. The half-life of 116m
In is 54.4 min and the half-life of 115m
In is 4.36 h. As
time passes, the 116m
In component will decay faster than the 115m
In component resulting in a
bigger fraction of the total exposure eventually coming from the 115m
In component. It is the 115m
In component that is used for dosimetry purposes.
This also has implications for the use of sensitive counting room equipment. There will need to
be a few hours of foil decay time to allow the 116m
In component to be reduced to help minimize
system dead-time.
Expected total In foil exposure rate, due to activation products,
as a function of time =
Eqn D-19
Where t is the time since the foil was exposed to neutrons.
Equation D-19 is then used within a spreadsheet program to plot exposure rate vs. time for a 100
rad exposure. This yields a single line. Additional lines for different doses are easily added, as
the amount of foil activation (exposure rate) scales linearly with dose (fluence).

DISTRIBUTION:
1 Lawrence Livermore National Laboratory
Attn: David P. Heinricks
P.O. Box 808, L-198
Livermore, CA 94551
1 Lawrence Livermore National Laboratory
Attn: David P. Hickman
P.O. Box 808, L-383
Livermore, CA 94551
1 MS 0425 C. A. Potter, 0245
1 MS 0651 S. H. Goke, 4121
1 MS 0651 N. R. Elliot, 4121
1 MS 0899 Technical Library, 9536 (electronic copy)
1 MS 1103 R. P. Miltenberger (Manager) 4128
1 MS 1103 R. L. Miller, 4128