Samsung Card - Tistory
38
DISCLOSURE APPENDIX CONTAINS ANALYST CERTIFICATIONS AND THE STATUS OF NON-US ANALYSTS. U.S. Disclosure: Credit Suisse does and seeks to do business with companies covered in its research reports. As a result, investors should be aware that the Firm may have a conflict of interest that could affect the objectivity of this report. Investors should consider this report as only a single factor in making their investment decision. 07 September 2010 Asia Pacific/South Korea Equity Research Consumer Finance Samsung Card (029780.KS / 029780 KS) ASSUMING COVERAGE Leveraged play on consumption and group restructuring ■ Assuming coverage with OUTPERFORM: We assume coverage of Samsung Card (SSC) with an OUTPERFORM rating and a 12-month (SOTP-based) target price of W71,000. We believe SSCs share price will strengthen in the next six to 12 months, driven by: 1) resilient domestic consumption and 2) the groups impending circular ownership restructuring. ■ SSCs leveraging to resume amid resilient domestic consumption: As SSCs business mix adjustment comes to an end in 2H10, we expect SSC to resume leveraging (i.e., asset growth) from 2H versus negative growth since 2Q09. In terms of macro factors, retail sales remain strong against the backdrop of a recovery from the financial crisis and structural growth factors, i.e., Korean consumers trading-up of consumption, as evidenced by strong retail sales numbers in July-August. ■ SSC as the biggest beneficiary from group ownership restructuring: As part of the belated compliance with the Financial Restructuring Law (FRL), SSC should divest a 20.6% stake in Everland by April 2012. We envisage that SSC will divest its stake through an IPO in 2011. Meanwhile, the market should interpret SSCs divesture of the other affiliate stake before year-end for a tax credit as the start of ownership restructuring, in our view. ■ SOTP target price of W71,000 with new emphasis on holding co. value: We derive our target price by reflecting the holding company value of its Everland stake. Our target price comprises the value of: 1) the credit card operation (W45,000), 2) investment assets (W11,000), and 3) the Everland stake as a de facto holding company (W15,000). Key risks include: 1) a possible funding cost increase driven by a interest rate hike and 2) SG&A cost increase amid competition. Share price performance 20000 40000 60000 Sep-08 Jan-09 May-09 Sep-09 Jan-10 May-10 80 100 120 140 Price (LHS) Rebased Rel (RHS) The price relative chart measures performance against the KOREA SE COMPOSITE (KOSPI) index which closed at 1787.74 on 07/09/10 On 07/09/10 the spot exchange rate was W1172.12/US$1 Performance Over 1M 3M 12M Absolute (%) 13.9 0.6 Relative (%) -0.2 4.3 -9.5 Financial and valuation metrics Year 12/09A 12/10E 12/11E 12/12E Pre-provision profit (W bn) 658.8 608.4 742.3 859.7 Pre -tax profit (W bn) 690.8 583.1 668.4 769.4 Net attributable profit (W bn) 603.8 582.9 521.3 600.1 EPS (CS adj.) (W) 4,910.59 4,740.66 4,239.89 4,880.77 Change from previous EPS (%) n.a. 31.6 12.8 Consensus EPS (W) n.a. 3,870 4,165 4,761 EPS growth (%) 130.2 -3.5 -10.6 15.1 P/E (x) 10.9 11.2 12.6 10.9 Dividend yield (%) 1.7 2.1 2.1 2.3 CS adj. BVPS (W) 35,997.1 47,262.6 50,930.5 55,079.0 P/B (x) 1.5 1.1 1.0 1.0 ROE 14.8 11.4 8.7 9.3 ROA (%) 4.0 4.0 3.2 3.4 Tier 1 Ratio (%) 35.0 39.1 38.0 37.1 Source: Company data, Thomson Reuters, Credit Suisse estimates. Rating OUTPERFORM* Price (07 Sep 10, W) 53,300.00 Target price (W) (from 60,000) 71,000„ Chg to TP (%) 33.2 Market cap. (W bn) 6,553.71 (US$ 5.59) Enterprise value (W bn) 6,554 Number of shares (mn) 122.96 Free float (%) 32.28 52-week price range 58200 - 45250 *Stock ratings are relative to the relevant country benchmark. „Target price is for 12 months. Research Analysts Sokmo Yun 822 3707 3763 [email protected] Soyeon Hong 822 3707 3740 [email protected] Seok Yun, CFA, CA 822 3707 3730 [email protected]
Transcript of Samsung Card - Tistory

DISCLOSURE APPENDIX CONTAINS ANALYST CERTIFICATIONS AND THE STATUS OF NON-US ANALYSTS. U.S. Disclosure: Credit Suisse does and seeks to do business with companies covered in its research reports. As a result, investors should be aware that the Firm may have a conflict of interest that could affect the objectivity of this report. Investors should consider this report as only a single factor in making their investment decision.
07 September 2010Asia Pacific/South Korea
Equity ResearchConsumer Finance
Samsung Card (029780.KS / 029780 KS)
ASSUMING COVERAGE
Leveraged play on consumption and group restructuring ■ Assuming coverage with OUTPERFORM: We assume coverage of
Samsung Card (SSC) with an OUTPERFORM rating and a 12-month (SOTP-based) target price of W71,000. We believe SSC�s share price will strengthen in the next six to 12 months, driven by: 1) resilient domestic consumption and 2) the group�s impending circular ownership restructuring.
■ SSC�s leveraging to resume amid resilient domestic consumption: As SSC�s business mix adjustment comes to an end in 2H10, we expect SSC to resume leveraging (i.e., asset growth) from 2H versus negative growth since 2Q09. In terms of macro factors, retail sales remain strong against the backdrop of a recovery from the financial crisis and structural growth factors, i.e., Korean consumers� trading-up of consumption, as evidenced by strong retail sales numbers in July-August.
■ SSC as the biggest beneficiary from group ownership restructuring: As part of the belated compliance with the Financial Restructuring Law (FRL), SSC should divest a 20.6% stake in Everland by April 2012. We envisage that SSC will divest its stake through an IPO in 2011. Meanwhile, the market should interpret SSC�s divesture of the other affiliate stake before year-end for a tax credit as the start of ownership restructuring, in our view.
■ SOTP target price of W71,000 with new emphasis on holding co. value: We derive our target price by reflecting the holding company value of its Everland stake. Our target price comprises the value of: 1) the credit card operation (W45,000), 2) investment assets (W11,000), and 3) the Everland stake as a de facto holding company (W15,000). Key risks include: 1) a possible funding cost increase driven by a interest rate hike and 2) SG&A cost increase amid competition.
Share price performance
20000
40000
60000
Sep-08 Jan-09 May-09 Sep-09 Jan-10 May-1080100120140
Price (LHS) Rebased Rel (RHS)
The price relative chart measures performance against the KOREA SE COMPOSITE (KOSPI) index which closed at 1787.74 on 07/09/10 On 07/09/10 the spot exchange rate was W1172.12/US$1
Performance Over 1M 3M 12M Absolute (%) � 13.9 0.6 Relative (%) -0.2 4.3 -9.5
Financial and valuation metrics
Year 12/09A 12/10E 12/11E 12/12EPre-provision profit (W bn) 658.8 608.4 742.3 859.7Pre -tax profit (W bn) 690.8 583.1 668.4 769.4Net attributable profit (W bn) 603.8 582.9 521.3 600.1EPS (CS adj.) (W) 4,910.59 4,740.66 4,239.89 4,880.77Change from previous EPS (%) n.a. 31.6 12.8Consensus EPS (W) n.a. 3,870 4,165 4,761EPS growth (%) 130.2 -3.5 -10.6 15.1P/E (x) 10.9 11.2 12.6 10.9Dividend yield (%) 1.7 2.1 2.1 2.3CS adj. BVPS (W) 35,997.1 47,262.6 50,930.5 55,079.0P/B (x) 1.5 1.1 1.0 1.0ROE 14.8 11.4 8.7 9.3ROA (%) 4.0 4.0 3.2 3.4Tier 1 Ratio (%) 35.0 39.1 38.0 37.1
Source: Company data, Thomson Reuters, Credit Suisse estimates.
Rating OUTPERFORM* Price (07 Sep 10, W) 53,300.00 Target price (W) (from 60,000) 71,000¹ Chg to TP (%) 33.2 Market cap. (W bn) 6,553.71 (US$ 5.59) Enterprise value (W bn) 6,554 Number of shares (mn) 122.96 Free float (%) 32.28 52-week price range 58200 - 45250 *Stock ratings are relative to the relevant country benchmark. ¹Target price is for 12 months.
Research Analysts Sokmo Yun
822 3707 3763 [email protected]
Soyeon Hong 822 3707 3740
Seok Yun, CFA, CA 822 3707 3730

07 September 2010
Samsung Card (029780.KS / 029780 KS) 2
Focus charts and table Figure 1: SSC � a leveraged domestic consumption play Figure 2: SSC�s asset growth to resume from 2H10
6070
8090
100110
120130
Jan
00
Jan
01
Jan
02
Jan
03
Jan
04
Jan
05
Jan
06
Jan
07
Jan
08
Jan
09
Jan
10
-25-20-15-10-50510152025(%)
Retail sales index , seasonally adjusted YoY grow th (RHS)
-20
-10
0
10
20
30
1Q07 3Q07 1Q08 3Q08 1Q09 3Q09 1Q10 3Q10 1Q11 3Q11 1Q12 3Q12
-20
-15
-10
-5
0
5
10
Asset growth Y/Y (LHS) Cardholders growth Y/Y (RHS)
CS estimate(%) (%)
-20
-10
0
10
20
30
1Q07 3Q07 1Q08 3Q08 1Q09 3Q09 1Q10 3Q10 1Q11 3Q11 1Q12 3Q12
-20
-15
-10
-5
0
5
10
Asset growth Y/Y (LHS) Cardholders growth Y/Y (RHS)
CS estimate(%) (%)
Source: National Statistics Office Source: FSS, and Credit Suisse
Figure 3: SSC � a beneficiary of unwinding of circular Figure 4: Target price of W71,000 based on SOTP
1.8% 3.1%
4.9% 1.9% 3.0%
1.3%
4.7% 4.9%
Samsung Eng. Samsung Fine Chemicals
S1
Hotel Shilla
Samsung F&M
25.1%
Samsung Life
Samsung Elec.
Everland
Family
Samsung Card
20.8%
4.7%
35.3%
26.4%
19.3%
7.5%
25.6%
Samsung Securities
Cheil Ind.
Cheil Worldwide
SSC should reduce below 5% by April 2012
SSC might sell some of these stakes to utilize W1.3 tn of tax credit within 2010
(W bn) Equity and target multiple Value
Shareholders' equity at 2Q10 5,811"Other comprehensive income" at 2Q10 1,550Shareholders' equity excl. "OCI" 4,261Target P/B (x) 1.3Credit card operation value 5,540
Operation value � credit card
Per share 45,000"Other comprehensive income" at 2Q10 1,550(Post-tax) MTM value of investment assets 278Sub-total 1,828Target P/B (x) 0.75Investment asset value 1,371
Investment asset value
Per share 11,00025.6% of Everland's BV at Dec-09 593(Post-tax) Revaluation of SLI stake 33425.6% of Everland's BV (e) at Jun-10 927Target P/B (x) - Applying multiple of SK C&C 3.0Hold co value (excluding BV) 1,854
Hold co value of Everland
Per share 15,000Firm value (W bn) 8,764SOTP value (W) 71,000
Source: Company data, Credit Suisse estimates Source: Company data, Credit Suisse estimates
Figure 5: Cost-income ratio remains stable unlike concern Figure 6: Interest rate hike perceived as a potential risk
0
200
400
600
800
1Q04 1Q05 1Q06 1Q07 1Q08 1Q09 1Q10 1Q11 1Q12
(W b
n)
0%
20%
40%
60%
80%
100%
Income (LHS) Cost (LHS) Cost-income ratio (RHS)
CS fo recast
20,000
30,000
40,000
50,000
60,000
70,000
Jul 0
7
Nov
07
Mar
08
Jul 0
8
Nov
08
Mar
09
Jul 0
9
Nov
09
Mar
10
Jul 1
0
(W)
45678910
(%)
Share price (LHS) 3Y Corp. bond (AA0, RHS)
Source: Company data, Credit Suisse estimates Source: Datastream
07 September 2010
Samsung Card (029780.KS / 029780 KS) 3
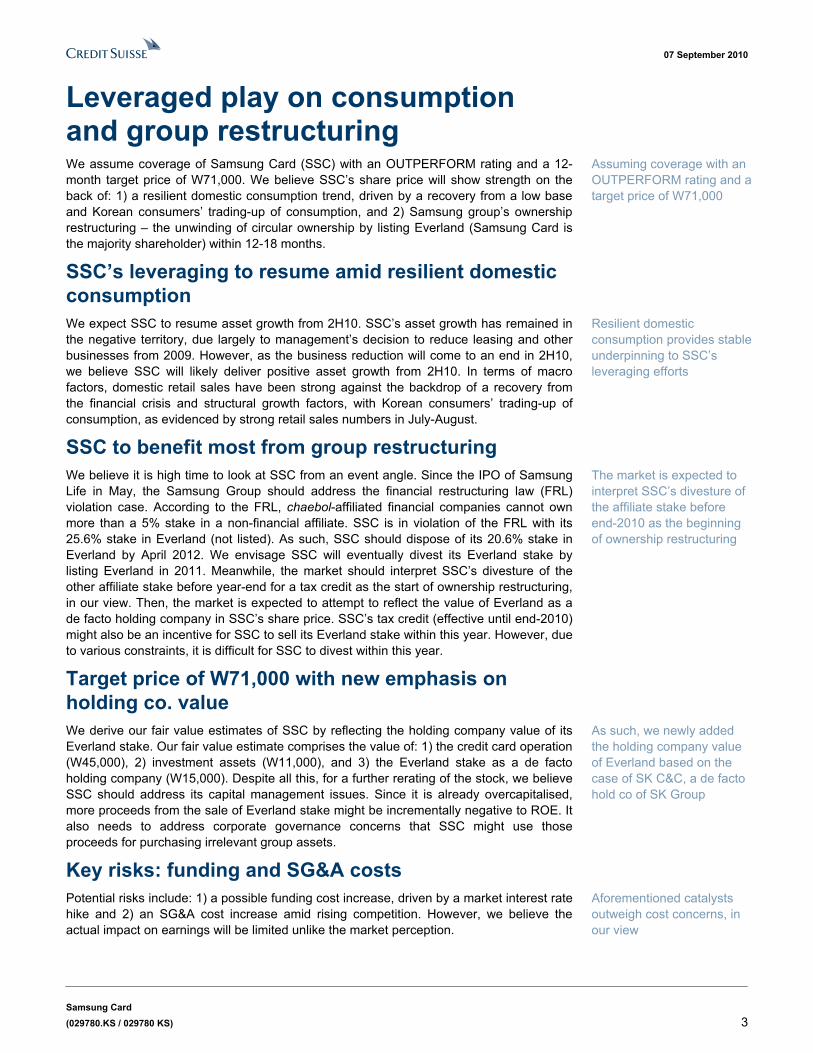
Leveraged play on consumption and group restructuring We assume coverage of Samsung Card (SSC) with an OUTPERFORM rating and a 12-month target price of W71,000. We believe SSC�s share price will show strength on the back of: 1) a resilient domestic consumption trend, driven by a recovery from a low base and Korean consumers� trading-up of consumption, and 2) Samsung group�s ownership restructuring � the unwinding of circular ownership by listing Everland (Samsung Card is the majority shareholder) within 12-18 months.
SSC�s leveraging to resume amid resilient domestic consumption We expect SSC to resume asset growth from 2H10. SSC�s asset growth has remained in the negative territory, due largely to management�s decision to reduce leasing and other businesses from 2009. However, as the business reduction will come to an end in 2H10, we believe SSC will likely deliver positive asset growth from 2H10. In terms of macro factors, domestic retail sales have been strong against the backdrop of a recovery from the financial crisis and structural growth factors, with Korean consumers� trading-up of consumption, as evidenced by strong retail sales numbers in July-August.
SSC to benefit most from group restructuring We believe it is high time to look at SSC from an event angle. Since the IPO of Samsung Life in May, the Samsung Group should address the financial restructuring law (FRL) violation case. According to the FRL, chaebol-affiliated financial companies cannot own more than a 5% stake in a non-financial affiliate. SSC is in violation of the FRL with its 25.6% stake in Everland (not listed). As such, SSC should dispose of its 20.6% stake in Everland by April 2012. We envisage SSC will eventually divest its Everland stake by listing Everland in 2011. Meanwhile, the market should interpret SSC�s divesture of the other affiliate stake before year-end for a tax credit as the start of ownership restructuring, in our view. Then, the market is expected to attempt to reflect the value of Everland as a de facto holding company in SSC�s share price. SSC�s tax credit (effective until end-2010) might also be an incentive for SSC to sell its Everland stake within this year. However, due to various constraints, it is difficult for SSC to divest within this year.
Target price of W71,000 with new emphasis on holding co. value We derive our fair value estimates of SSC by reflecting the holding company value of its Everland stake. Our fair value estimate comprises the value of: 1) the credit card operation (W45,000), 2) investment assets (W11,000), and 3) the Everland stake as a de facto holding company (W15,000). Despite all this, for a further rerating of the stock, we believe SSC should address its capital management issues. Since it is already overcapitalised, more proceeds from the sale of Everland stake might be incrementally negative to ROE. It also needs to address corporate governance concerns that SSC might use those proceeds for purchasing irrelevant group assets.
Key risks: funding and SG&A costs Potential risks include: 1) a possible funding cost increase, driven by a market interest rate hike and 2) an SG&A cost increase amid rising competition. However, we believe the actual impact on earnings will be limited unlike the market perception.
Assuming coverage with an OUTPERFORM rating and a target price of W71,000
Resilient domestic consumption provides stable underpinning to SSC�s leveraging efforts
The market is expected to interpret SSC�s divesture of the affiliate stake before end-2010 as the beginning of ownership restructuring
As such, we newly added the holding company value of Everland based on the case of SK C&C, a de facto hold co of SK Group
Aforementioned catalysts outweigh cost concerns, in our view

07 September 2010
Samsung C
ard (029780.K
S / 029780 KS)
4
Valuation comparison Figure 7: Valuation summary Earnings outlook Valuation (x) EPS Book Dividend Loan Equity/ Loan/ Current Target NP Consensus gr gr ROA ROE yield P / P / P / gr NIM assets deposit price % price Upside (W bn) (W bn) NP (%) (%) (%) (%) (%) PPP assets deposit P/E P/B (%) (%) (%) (%) (W) YTD (W) (%)
KB Finanial 08A 1,887.8 -32.8 9.3 0.77 12.1 0.0 3.9 0.06 0.10 8.9 0.94 16.6 3.39 6.9 124 48,800 -18.3 62,000 27.0 Outperform 09A 539.8 -73.3 1.1 0.20 3.2 0.4 6.0 0.07 0.11 33.3 0.93 -2.0 2.69 7.8 114 105560 KS 10E 1,182.3 1,413.6 108.8 3.1 0.44 6.5 1.0 4.3 0.07 0.10 15.9 0.90 1.0 3.09 7.8 107 11E 2,179.7 2,335.1 84.4 10.4 0.76 10.9 2.3 4.0 0.07 0.09 8.6 0.81 2.0 3.12 8.2 102 Shinhan 08A 2,018.6 -16.0 1.1 0.82 15.0 0.0 3.8 0.06 0.13 8.0 1.20 13.6 3.73 5.4 135 43,150 -0.1 62,000 43.7 Outperform 09A 1,305.3 -44.1 1.9 0.50 8.9 0.9 4.9 0.08 0.14 14.4 1.18 -0.8 3.22 6.8 115 055550 KS 10E 2,512.2 2,368.6 87.6 9.3 0.96 14.8 1.6 4.2 0.08 0.13 7.7 1.08 2.1 3.69 7.2 110 11E 3,091.5 2,722.9 7.0 15.1 1.15 14.0 2.5 4.1 0.08 0.13 7.2 0.94 3.1 3.80 8.1 110 Woori 08A 454.5 -77.6 -7.2 0.17 3.5 0.0 3.7 0.04 0.06 23.6 0.88 16.6 2.60 4.2 116 13,300 -4.0 16,000 20.3 Neutral 09A 1,026.0 125.8 12.4 0.35 7.9 0.0 2.7 0.04 0.06 10.4 0.78 -1.3 2.34 4.8 109 053000 KS 10E 1,271.6 1,432.5 23.9 6.8 0.43 9.0 1.5 2.2 0.04 0.06 8.4 0.73 1.8 2.62 4.9 106 11E 2,000.5 1,898.6 57.3 10.1 0.65 13.0 3.0 2.4 0.03 0.05 5.4 0.66 2.1 2.72 5.3 102 Hana 08A 483.4 -62.2 -2.9 0.33 5.3 0.6 3.6 0.04 0.07 13.8 0.74 16.3 2.39 5.7 110 31,500 -4.3 44,000 39.7 Outperform 09A 306.3 -36.6 6.5 0.19 3.4 0.0 5.0 0.04 0.07 21.8 0.69 1.0 1.98 6.4 112 086790 KS 10E 1,118.0 1,012.0 264.9 12.9 0.71 11.0 1.6 2.9 0.04 0.07 6.0 0.6 2.3 2.53 6.9 110 11E 1,208.1 1,146.2 8.1 11.1 0.75 10.6 2.9 2.9 0.04 0.06 5.5 0.55 2.9 2.59 7.6 106 IBK 08A 767.0 -36.6 -4.6 0.59 11.0 0.0 3.2 0.05 0.19 8.9 1.03 17.2 2.70 5.3 263 14,300 2.1 20,000 39.9 Outperform 09A 710.4 -28.4 3.2 0.47 8.3 0.7 3.9 0.06 0.18 12.4 1.00 11.3 2.63 6.1 233 024110 KS 10E 1,317.7 1,327.9 77.6 13.0 0.82 13.5 1.4 2.8 0.06 0.18 7.0 0.88 6.0 2.90 6.6 244 11E 1,538.1 1,529.6 16.7 15.1 0.90 13.8 2.8 2.9 0.05 0.14 6.0 0.77 7.0 2.85 7.1 210 Daegu 08A 261.2 0.1 12.3 1.02 17.6 1.8 3.8 0.07 0.11 7.0 1.14 10.1 3.47 6.0 105 13,800 -19.8 17,000 23.2 Neutral 09A 170.5 -34.7 10.9 0.62 10.2 1.2 3.9 0.07 0.10 10.7 1.03 6.0 3.34 6.4 106 005270 KS 10E 281.2 269.0 64.9 15.5 0.97 14.7 2.9 3.0 0.06 0.10 6.5 0.89 4.0 3.45 7.1 104 11E 321.2 317.0 14.2 13.1 1.07 14.8 3.6 2.9 0.06 0.09 5.7 0.79 3.0 3.56 7.8 99 Busan 08A 275.0 1.6 11.8 1.00 17.8 1.6 3.4 0.07 0.11 6.6 1.11 12.5 3.36 5.9 118 12,450 -10.8 14,500 16.5 Neutral 09A 245.1 -26.8 1.2 0.83 12.7 1.3 4.1 0.08 0.13 9.1 1.10 1.1 3.40 7.0 108 005280 KS 10E 367.0 343.3 43.3 16.7 1.14 16.0 3.2 3.8 0.07 0.12 6.3 0.94 3.0 3.40 7.7 106 11E 380.5 369.4 3.7 12.4 1.13 14.6 4.0 3.7 0.07 0.11 6.1 0.84 3.0 3.49 8.2 98
Samsung Card 08A 258.0 0.0 -51.5 4.7 1.65 7.0 1.1 10.8 0.401) n.a. 25.0 1.74 5.92) 15.93 22.73) n.a. 53,300 -7.3 71,000 33.2 Outperform 09A 603.8 0.0 134.0 17.4 4.04 14.8 1.7 9.9 0.491) n.a. 10.9 1.48 -15.72) 17.18 32.93) n.a. 029780 KS 10E 582.9 483.4 -3.5 31.3 4.02 11.4 2.1 10.8 0.421) n.a. 11.2 1.13 10.22) 18.49 36.83) n.a. 11E 521.3 522.1 -10.6 7.8 3.20 8.7 2.1 8.8 0.391) n.a. 12.6 1.05 10.62) 18.36 36.93) n.a.
1) P/total managed asset, 2) managed receivable growth, 3) Equity/ total managed asset Source: Company data, Bloomberg consensus as of 7 Sep 2010, Credit Suisse estimates

07 September 2010
Samsung Card (029780.KS / 029780 KS) 5
SSC�s leveraging to resume amid domestic consumption SSC is set to resume leveraging from 2H10 We expect SSC to resume asset growth from 2H10. SSC�s asset growth has turned negative since 2Q09, due largely to management�s decision to reduce the (high risk/high return) leasing, instalment financing and consumer loan businesses from 2009. The receivable mix has also changed from cash advance with high credit risk to general credit card sales with low risk. However, as the business reduction comes to an end in 2H10, we expect SSC to deliver high-teen asset growth from 2H10.
Figure 8: SSC to resume its asset growth from 2H10 Figure 9: Gradual leveraging resumes from 2H10
-20-15
-10
-5
05
10
1520
25
1Q07 4Q07 3Q08 2Q09 1Q10 4Q10 3Q11 2Q12
-20
-15
-10
-5
0
5
10
Asset growth Y/Y (LHS) Cardholders growth Y/Y (RHS)
CS estimate(%) (%)
-20-15
-10
-5
05
10
1520
25
1Q07 4Q07 3Q08 2Q09 1Q10 4Q10 3Q11 2Q12
-20
-15
-10
-5
0
5
10
Asset growth Y/Y (LHS) Cardholders growth Y/Y (RHS)
CS estimate(%) (%)
0
5
10
15
20
25
30
1Q03 1Q04 1Q05 1Q06 1Q07 1Q08 1Q09 1Q10 1Q11 1Q12
(x)
0%
5%
10%
15%20%
25%30%
35%
40%
45%
Card receivable / shareholders' fund (LHS) Tier 1 CAR (RHS)
CS estimate
0
5
10
15
20
25
30
1Q03 1Q04 1Q05 1Q06 1Q07 1Q08 1Q09 1Q10 1Q11 1Q12
(x)
0%
5%
10%
15%20%
25%30%
35%
40%
45%
Card receivable / shareholders' fund (LHS) Tier 1 CAR (RHS)
CS estimate
Source: Company data, Credit Suisse estimates Source: Company data, Credit Suisse estimates
Figure 10: Samsung Card � active cardholders rise faster from 3Q10
Figure 11: Samsung Card has relatively high-rated credit card holders
3,000
4,000
5,000
6,000
7,000
8,000
9,000
4Q05
1Q06
2Q06
3Q06
4Q06
1Q07
2Q07
3Q07
4Q07
1Q08
2Q08
3Q08
4Q08
1Q09
2Q09
3Q09
4Q09
1Q10
2Q10
3Q10
(e)
('000)
Av ailable cardholders Activ e cardholders
0%
10%
20%
30%
40%A
B
C
D
E
F
G
H
ShinhanSamsung
Hy undaiLotte
Source: Company data, Credit Suisse estimates Source: CREFIA
Against this backdrop, Samsung Card has stepped up its promotion efforts since the beginning of this year. Samsung Card is aggressively acquiring new customers by taking advantage of its affiliate Samsung Electronics� distribution network. According to management, this cross-selling initiative in collaboration with Samsung Electronics is likely
SSC�s leveraging (i.e. asset growth) is set to begin from 2H10
Negative knock-on effect should be limited from asset/volume growth

07 September 2010
Samsung Card (029780.KS / 029780 KS) 6
to materialise from July 2010 or 3Q10. Although Samsung Card stepped up promotion efforts from the start of this year, we believe the negative knock-on effect should be limited, as: 1) strong asset or volume growth is likely to be driven more by the low base of last year, 2) cost-to-income ratio remains at a disciplined level, as evidenced by 1H10 results, 3) Samsung Card strategically focuses on high-quality customers, and 4) asset growth is likely to be funded by sizeable excess capital rather than costly wholesale funding. Although our growth estimate is not enough to dissolve the overcapitalised status, we believe it should enhance capital efficiency to a certain degree.
Resilient domestic consumption provides positive underpinning to SSC�s leveraging efforts Korean consumers� trading-up of consumption positive for credit card issuers
In terms of macro factors, domestic retail sales have been strong since 2009 against the backdrop of a recovery from the financial crisis. However, there were some structural growth factors behind the retail sales growth besides the low base effect. Korean consumers� trading-up of consumption and wage growth have supported sales at department stores as well as discount stores. As we move into 2H10, some investors may have concerns about the higher base, which could drag down the sales growth momentum; however, July-August sales numbers actually trended stronger than expected � 6-10% at department stores and 3-6% at discount stores in August. Backed by benign retail sales growth, credit card spending should also increase, in our view.
Figure 12: Retail sales index trend Figure 13: Retailers� same-store-sales growth trend
60
70
80
90
100
110
120
130
Jan
00
Jan
01
Jan
02
Jan
03
Jan
04
Jan
05
Jan
06
Jan
07
Jan
08
Jan
09
Jan
10
-25-20-15-10-50510152025(%)
Retail sales index , seasonally adjusted YoY grow th (RHS)
-15.0
-10.0
-5.0
0.0
5.0
10.0
15.0
20.0
Jan-01
Jan-02
Jan-03
Jan-04
Jan-05
Jan-06
Jan-07
Jan-08
Jan-09
Jan-10
(%)
Discount store - 3mo. mov. avg. Department store - 3mo. mov. avg.
-15.0
-10.0
-5.0
0.0
5.0
10.0
15.0
20.0
Jan-01
Jan-02
Jan-03
Jan-04
Jan-05
Jan-06
Jan-07
Jan-08
Jan-09
Jan-10
(%)
Discount store - 3mo. mov. avg. Department store - 3mo. mov. avg.
Source: NSO Source: Ministry of Knowledge Economy
Credit card business continues its steady growth with benign asset/credit quality
Despite the bleak economic outlook, further downside to the credit card business appears limited, in our view. The main rationales for this are: 1) asset/credit quality as well as capitalisation are in much better shape; 2) the cash to credit migration continues; 3) credit card spending is mostly focused on non-discretionary items; and 4) the stable trend of NIM amid the financial market turmoil at 15-20% for the past three years. The overall asset quality of credit card companies shows a clear improvement for the past year. Delinquency ratio fell to 1.84% as of June 2010. Capital adequacy ratio stood at 30.2% as of June 2010, up about 2 p.p. over the past one year. In general, the slowdown in high-risk/high-return businesses, such as cash advances, improved asset quality as well as capitalisation, but lowered profitability, in our view.
July-August domestic consumption is actually trending stronger than expected
Growth with stable margins, benign asset/credit quality, and improving capitalisation

07 September 2010
Samsung Card (029780.KS / 029780 KS) 7
Figure 14: Credit card firms� asset quality and CAR (%) Figure 15: Credit card companies� earnings trends (W bn)
0.0
5.0
10.0
15.0
20.0
25.0
30.0
35.0
1Q08 2Q 3Q 4Q 1Q09 2Q 3Q 4Q 1Q10 2Q0.0
0.5
1.0
1.5
2.0
2.5
3.0
3.5
4.0
CAR (LHS) Delinquency ratio (RHS)
0
200
400
600
800
1000
1200
4Q 1Q07 2Q 3Q 4Q 1Q08 2Q 3Q 4Q 1Q09 2Q 3Q 4Q 1Q10 2Q
NP
Source: FSS. Source: FSS.
Figure 16: Shinhan Card vs Samsung Card NP (W bn) Figure 17: Trend of net interest margin
-200
-
200
400
600
800
1,000
1Q07 3Q 1Q08 3Q 1Q09 3Q 1Q10
Shinhan Card Samsung Card
Shinhan Card (ex . Writeback)
0%
5%
10%
15%
20%
25%
1Q07 3Q 1Q08 3Q 1Q09 3Q 1Q10 3QE
Shinhan Card Samsung Card
Source: Company data, Credit Suisse estimates Source: Company data, Credit Suisse estimates
Figure 18: NPL ratio Figure 19: Equity-to-card receivable ratio
0.0%
1.0%
2.0%
3.0%
4.0%
5.0%
6.0%
7.0%
8.0%
1Q07 3Q 1Q08 3Q 1Q09 3Q 1Q10 3QE
Shinhan Card Samsung Card
0%
10%
20%
30%
40%
50%
60%
1Q07 3Q 1Q08 3Q 1Q09 3Q 1Q10 3QE
Shinhan Card Samsung Card
Source: Company data, Credit Suisse estimates Source: Company data, Credit Suisse estimates

07 September 2010
Samsung Card (029780.KS / 029780 KS) 8
Industry trend shows �Goldilocks� environment for credit card issuers Increased risk aversion with more focus on the credit sales
Credit card sales (merchant/instalment sales) have continuously increased while cash advances have been tightly controlled by credit card companies after the credit card burst in 2003. Total credit card usage for 2009 amounted to W472 tn, up 1.7% YoY. Credit sales increased to W373 tn, up 4.6% YoY, on the back of increased new car sales amid tax incentives, but cash advances dropped to W99 tn, down 7.9% YoY, mainly due to tightened risk management.
Cash-to-credit migration decelerating a little
The credit card payment portion has also steadily increased since 2004, currently at 65% of the total. We anticipate further growth, as we see continued aggressive marketing by credit card companies and the regulatory changes � the scope of credit card sales is likely to expand as seen in tax payments and car purchases.
Figure 20: Annual credit card sales trend Figure 21: Private consumption vs credit card payment portion
0.0
100.0
200.0
300.0
400.0
500.0
600.0
700.0
1997 1999 2001 2003 2005 2007 2009
(W tn
)
Merchants Installments Cash advances
14.112.214.7
24.1
48.2
64.957.4
52.955.655.958.963.564.6
0
100
200
300
400
500
600
700
1997 1999 2001 2003 2005 2007 2009
(W tn
)
0
10
20
30
40
50
60
70
(%)
Private consmuption (LHS)Credit card payment portion (merchant+installments, RHS)
Source: Credit Finance Association (CREFIA) Source: BOK, CREFIA
�Negative� settlement system � The reform of the Specialized Credit Financial Business Act took place in June 2010 which included the change to the �negative� credit card settlement system from the �positive� settlement system. Under the �negative� settlement system, consumers are instructed on what they cannot pay by credit card, not what they can pay. In other words, consumers can use credit cards for purchases of all goods and services unless listed in the Act � a few exceptions include investment in securities, derivatives and other financial products, bank savings deposits, and purchases in casinos and horse racing. For example, college tuition, public utility bills and other various goods and services would be able to be paid by credit card. Along with the revision of national tax laws (effected last February) which implemented an expanded range of taxes payable by credit card, the reform of this Act should boost structural growth in the credit card market, in our view.
However, despite the revision of the law, a few problems remain unsolved. Some colleges and public institutions are still not willing to take credit cards blaming high credit card fees on the credit card companies. Recently, big life insurance companies in Korea announced they would not take credit cards for customers� paying monthly premiums. The companies are complaining about the high credit-card fees and different treatment applied compared
Credit card companies focus more on credit sales than cash advance
Cash to credit migration continues slower than before

07 September 2010
Samsung Card (029780.KS / 029780 KS) 9
to other derivatives/investments/savings products. Though the relevant law is revised, it will take some time to come into effect in reality.
Credit sales still recovering along with private consumption:
Credit card sales growth has been picking up along with the remarkable private consumption recovery since 2H09. The recent strong growth trend is due to the low base from last year (7% in July 2009) and the continued consumption recovery after the global financial crisis. However, sales growth has slowed more recently, posting 15% in June from 19% in March, and 21% in February largely owing to concerns over the weak global macro environment; however, as seen in Figure 22, sales growth has started to pick up from July posting 17% growth from 15% in June.
Figure 22: Private consumption vs credit card sales growth
Figure 23: Monthly credit card sales trend
-5.0
0.0
5.0
10.0
15.0
20.0
1Q05
2Q05
3Q05
4Q05
1Q06
2Q06
3Q06
4Q06
1Q07
2Q07
3Q07
4Q07
1Q08
2Q08
3Q08
4Q08
1Q09
2Q09
3Q09
4Q09
1Q10
(% Y
oY)
Nominal private consumption Credit card sales
0
5,000
10,000
15,000
20,000
25,000
30,000
35,000
Jan-
04
Jul-0
4
Jan-
05
Jul-0
5
Jan-
06
Jul-0
6
Jan-
07
Jul-0
7
Jan-
08
Jul-0
8
Jan-
09
Jul-0
9
Jan-
10
Jul-1
0
(W b
n)
-15
-10
-5
0
5
10
15
20
25
30
(%)
Credit card settlement % YoY (RHS)
Source: BOK Source: CREFIA
As well as fiscal tightening in the Euro zone and concerns on the weak global macro recovery, other factors such as domestically another potential interest rate hike in 2H, a declining property market and a slowdown in employment growth might negatively affect private consumption growth, in our view. As seen in Figure 23, credit card sales growth has been slowing for a few months. July�s number picked up to 17.1% from 15.3% in June mainly due to a low base from last year; however, if we take into account the relatively high base in 2H of last year, it is hard to expect strong credit card sales growth in 2H this year. Despite credit card companies� efforts to boost demand by lowering merchant fee rates, and lifting the cash advance-related handling fee, the effect has been somewhat lukewarm.
More consumption on non-discretionary items � limited downside
Domestically, credit card sales at retailers (27.2%) and restaurants (11.4%) and for fuel purchases (10.8%) account for half of total credit card sales. The notable trend of credit sales with retailers is that credit sales at online shopping malls are almost equivalent to those of discount stores. And this segment is the major growth driver in the retailers whereas credit sales at department stores have dwindled. As a substantial portion of credit card sales is for the purchase of non-discretionary items as well as more frugal outlets, credit card sales are not expected to be too volatile even in a potential economic slowdown.
Credit sales growth picking up to 15-17%
Retail consumption so far focused on the non-discretionary, but the recent pattern of Korean consumers� trading up should be a upside risk in the near term
07 September 2010
Samsung Card (029780.KS / 029780 KS) 10
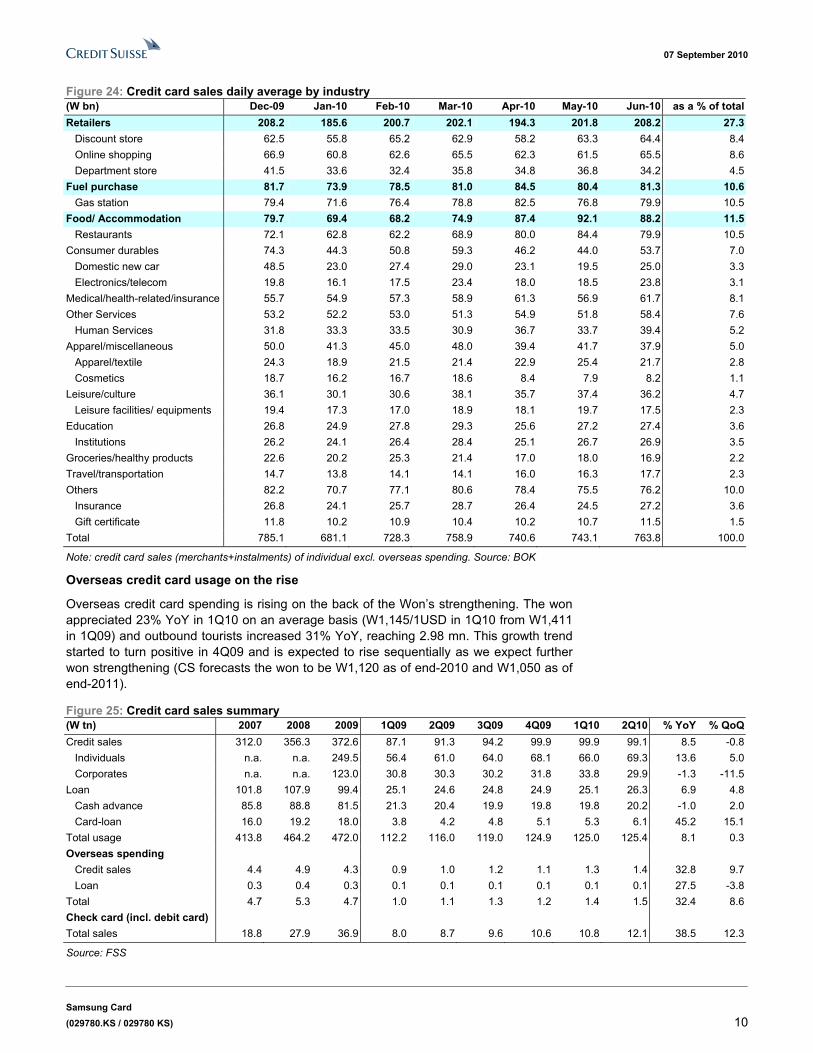
Figure 24: Credit card sales daily average by industry (W bn) Dec-09 Jan-10 Feb-10 Mar-10 Apr-10 May-10 Jun-10 as a % of totalRetailers 208.2 185.6 200.7 202.1 194.3 201.8 208.2 27.3 Discount store 62.5 55.8 65.2 62.9 58.2 63.3 64.4 8.4 Online shopping 66.9 60.8 62.6 65.5 62.3 61.5 65.5 8.6 Department store 41.5 33.6 32.4 35.8 34.8 36.8 34.2 4.5Fuel purchase 81.7 73.9 78.5 81.0 84.5 80.4 81.3 10.6 Gas station 79.4 71.6 76.4 78.8 82.5 76.8 79.9 10.5Food/ Accommodation 79.7 69.4 68.2 74.9 87.4 92.1 88.2 11.5 Restaurants 72.1 62.8 62.2 68.9 80.0 84.4 79.9 10.5Consumer durables 74.3 44.3 50.8 59.3 46.2 44.0 53.7 7.0 Domestic new car 48.5 23.0 27.4 29.0 23.1 19.5 25.0 3.3 Electronics/telecom 19.8 16.1 17.5 23.4 18.0 18.5 23.8 3.1Medical/health-related/insurance 55.7 54.9 57.3 58.9 61.3 56.9 61.7 8.1Other Services 53.2 52.2 53.0 51.3 54.9 51.8 58.4 7.6 Human Services 31.8 33.3 33.5 30.9 36.7 33.7 39.4 5.2Apparel/miscellaneous 50.0 41.3 45.0 48.0 39.4 41.7 37.9 5.0 Apparel/textile 24.3 18.9 21.5 21.4 22.9 25.4 21.7 2.8 Cosmetics 18.7 16.2 16.7 18.6 8.4 7.9 8.2 1.1Leisure/culture 36.1 30.1 30.6 38.1 35.7 37.4 36.2 4.7 Leisure facilities/ equipments 19.4 17.3 17.0 18.9 18.1 19.7 17.5 2.3Education 26.8 24.9 27.8 29.3 25.6 27.2 27.4 3.6 Institutions 26.2 24.1 26.4 28.4 25.1 26.7 26.9 3.5Groceries/healthy products 22.6 20.2 25.3 21.4 17.0 18.0 16.9 2.2Travel/transportation 14.7 13.8 14.1 14.1 16.0 16.3 17.7 2.3Others 82.2 70.7 77.1 80.6 78.4 75.5 76.2 10.0 Insurance 26.8 24.1 25.7 28.7 26.4 24.5 27.2 3.6 Gift certificate 11.8 10.2 10.9 10.4 10.2 10.7 11.5 1.5Total 785.1 681.1 728.3 758.9 740.6 743.1 763.8 100.0
Note: credit card sales (merchants+instalments) of individual excl. overseas spending. Source: BOK
Overseas credit card usage on the rise
Overseas credit card spending is rising on the back of the Won�s strengthening. The won appreciated 23% YoY in 1Q10 on an average basis (W1,145/1USD in 1Q10 from W1,411 in 1Q09) and outbound tourists increased 31% YoY, reaching 2.98 mn. This growth trend started to turn positive in 4Q09 and is expected to rise sequentially as we expect further won strengthening (CS forecasts the won to be W1,120 as of end-2010 and W1,050 as of end-2011).
Figure 25: Credit card sales summary (W tn) 2007 2008 2009 1Q09 2Q09 3Q09 4Q09 1Q10 2Q10 % YoY % QoQCredit sales 312.0 356.3 372.6 87.1 91.3 94.2 99.9 99.9 99.1 8.5 -0.8 Individuals n.a. n.a. 249.5 56.4 61.0 64.0 68.1 66.0 69.3 13.6 5.0 Corporates n.a. n.a. 123.0 30.8 30.3 30.2 31.8 33.8 29.9 -1.3 -11.5Loan 101.8 107.9 99.4 25.1 24.6 24.8 24.9 25.1 26.3 6.9 4.8 Cash advance 85.8 88.8 81.5 21.3 20.4 19.9 19.8 19.8 20.2 -1.0 2.0 Card-loan 16.0 19.2 18.0 3.8 4.2 4.8 5.1 5.3 6.1 45.2 15.1Total usage 413.8 464.2 472.0 112.2 116.0 119.0 124.9 125.0 125.4 8.1 0.3Overseas spending Credit sales 4.4 4.9 4.3 0.9 1.0 1.2 1.1 1.3 1.4 32.8 9.7 Loan 0.3 0.4 0.3 0.1 0.1 0.1 0.1 0.1 0.1 27.5 -3.8Total 4.7 5.3 4.7 1.0 1.1 1.3 1.2 1.4 1.5 32.4 8.6Check card (incl. debit card) Total sales 18.8 27.9 36.9 8.0 8.7 9.6 10.6 10.8 12.1 38.5 12.3
Source: FSS

07 September 2010
Samsung Card (029780.KS / 029780 KS) 11
Figure 26: Overseas credit card spending (incl. Check card and debit card sales) 2005 2006 2007 2008 2009 1Q09 2Q09 3Q09 4Q09 1Q10Spending (US$ mn) 3,647 4,808 6,373 6,796 5,379 1,100 1,283 1,487 1,509 1681 % YoY 30.7 31.8 32.6 6.6 -20.9 -40.0 -31.5 -19.5 21.2 52.8# of persons (thou) 5,919 7,054 8,866 9,371 8,438 1,852 2,040 2,237 2,309 2,810 % YoY 18.0 19.2 25.7 5.7 -10.0 -22.7 -18.6 -9.8 16.1 51.7Spending per person (US$) 616 682 719 725 637 594 629 665 654 598 % YoY 10.8 10.6 5.5 0.9 -12.1 -22.3 -15.8 -10.7 4.4 0.7
Source: BOK
Debit card gains popularity, but not meaningful yet
Debit card transactions have steadily increased since the launch due to tax deduction benefits and aggressive marketing by credit card companies. However, in terms of sales amount, they are still not comparable to credit cards.
Figure 27: Credit card vs check card (transaction) Figure 28: Credit card vs check card (sales)
050,000
100,000150,000200,000250,000300,000350,000400,000450,000500,000
Jan-
04Ju
l-04
Jan-
05Ju
l-05
Jan-
06Ju
l-06
Jan-
07Ju
l-07
Jan-
08Ju
l-08
Jan-
09Ju
l-09
Jan-
10
(thou
)
0
20,000
40,000
60,000
80,000
100,000
120,000
140,000
(thou
)
Credit card sales (ex cl. cash adv ance) Check card sales (RHS)
0
5,000
10,000
15,000
20,000
25,000
30,000
35,000
40,000
Jan-
04Ju
l-04
Jan-
05Ju
l-05
Jan-
06Ju
l-06
Jan-
07Ju
l-07
Jan-
08Ju
l-08
Jan-
09Ju
l-09
Jan-
10
(W b
n)
05001,0001,5002,0002,5003,0003,5004,0004,500
(W b
n)
Credit card sales (ex cl. cash adv ance) Check card sales (RHS)
Source: BOK Source: BOK

07 September 2010
Samsung Card (029780.KS / 029780 KS) 12
SSC to benefit from group restructuring We believe that it is high time to look at Samsung Card from an event angle � unlocking the value amid the unwinding of its circular ownership structure. Since Samsung Life�s IPO in May, Samsung Group should address the FRL violation case. According to the FRL, chaebol-affiliated financial companies cannot own more than a 5% stake in a non-financial affiliate. Samsung Card violates the FRL with its 25.6% stake in Everland. As such, Samsung Card should dispose of its 20.6% stake in Everland by April 2012. Separately, Samsung Card�s tax credit (effective until end-2010) might also be an incentive for Samsung Card to sell its Everland stake within this year. However, due to time constraints, it appears difficult for Samsung Card to do so within this year.
Figure 29: Samsung Card from an event angle � unlocking the value amid the unwinding of its circular ownership structure
1.8%
3.1%
4.9%
1.9%
3.0%
1.3%
4.7%
4.9%
Samsung Eng.
Samsung Fine Chemicals
Cheil Ind.
S1
Hotel Shilla
Samsung Securities
Samsung F&M
Cheil Worldwide
25.1%
Samsung Life
Samsung Elec.
Everland
Family
Samsung Card
20.8%
4.7%35.3%
26.4%
19.3%
7.5%
25.6%
Samsung Card should reduce below 5% by April 2012
Samsung Card might sell some of these stakes to utilize W1.3 tn of tax credit within 2010
Source: Company data, Credit Suisse estimates
Given that Everland is a de facto holding company for the whole of Samsung Group affiliates and Samsung Group previously had legal trouble with the transaction of unlisted affiliate shares, we envisage that Samsung Card will divest its Everland stake by listing it sometime in 2011. We expect this discussion is likely to kick off from early next year. Then, we expect the market will attempt to reflect the value of Everland as a de facto holding company in the share price of Samsung Card.
Despite all this, for a further rerating of the stock, we believe that Samsung Card should address its capital management issues. Since it is already overcapitalised, more proceeds from the sale of Everland stake might be incrementally negative to its ROE. It also needs to address corporate governance concerns that Samsung Card might use those proceeds for the purchase of irrelevant group assets.
We envisage the IPO of Everland in 2011 as part of Samsung group�s ownership restructuring 1) The recent IPO of Samsung Life has allowed the creditor banks (of Samsung Motors
(unlisted)) to cash out their long-held 35.4 mn shares in Samsung Life (given by Chairman Lee to pay off Samsung Motors� debts back in 1999). Our computation shows that the IPO price of W110,000 looks sufficient for the creditor banks to cover their original loan principal and foregone interest (due to a delay in the IPO) at an
High potential for Samsung Group to seek some sort of holding company structure over the coming years
SSC should reduce its 25.6% Everland stake below 5% by April 2012
The IPO of Everland is an effective solution, in our view
SSC should address its overcapitalisation, especially in terms of sales proceeds

07 September 2010
Samsung Card (029780.KS / 029780 KS) 13
interest rate of 6.0%. With this, the group is soon likely to resolve its long-pending dispute with the creditor banks of Samsung Motors;
2) The group has strong incentives for reforming its current circular ownership structure and moving towards some sort of holding company structure over the medium term, given the combination of Samsung Card�s regulatory need to reduce its 25.6% stake in Everland, a de facto holding company for the group, to below 5% by April 2012 and the majority shareholders� ongoing desire for better control and smooth inheritance; and
3) Several recent regulatory developments (i.e. easing restrictions on the Financial Holding Company Act, the enactment of the Insurance Holding Company Act, etc.) have collectively reduced the cost of transformation towards a holding company structure for those conglomerates which rely heavily on their financial affiliates for overall control.
To this end, we not only see high potential for the group to pursue some sort of holding company transition over the medium term, but also expect increased signs of progress over the next six to 12 months. Even if this is the case, we find that the group�s whole transition is likely to be a fairly complicated, multi-year process given the combination of a large number of sizeable affiliates involved and a complex web of cross-shareholdings between them. As such, it looks premature to exactly tell what form this potential transformation will take. But with the group likely to take increased transitional steps over the next six to 12 months, we expect the market to increasingly revisit the group�s potential holding company transition story. In our view, key questions for the shareholders of Samsung Card on this front are two-fold:
1) How much out of W1.3 tn of tax credit (which expires in December 2010) Samsung Card will take advantage of by selling its equity stake in affiliate companies.
2) How Samsung Card will deal with its equity stake in the financial affiliates, such as Samsung Fire & Marine and Samsung Securities. Will Samsung Card sell them to Samsung Life as part of the steps for the holding company transition.
3) How Samsung Card will lower its equity stake in Everland to below 5%. Also how Samsung Card will deal with the sales proceeds of its Everland stake in the mid- and long-term, especially considering its low ROE and overcapitalisation. Whether Samsung Card can use them to boost its capital efficiency through share buyback.
SSC poised to benefit from a possible Everland IPO According to our checks with management, we presume that Samsung Card cannot sell its stake in Everland within this year. This means that Samsung Card is likely to sell another affiliate stake, such as Samsung Fire & Marine Insurance (000810 KS) and Samsung Securities (016360 KS). And given the group ownership structure, we presume that Samsung Card will likely sell its financial affiliate stake to Samsung Life. And we believe that this will likely boost the value of Everland as a true holding company of the whole group. In particular, if SSC divest some of its investment equities within 2010 in order to utilise tax credit, market will likely interpret the equity sales as another progress of resolving Samsung Group�s circular ownership structure.
Figure 30 shows our projected roadmap for the group�s potential journey towards its holding company structure. Among a few plausible scenarios, we view our roadmap as one of the most logical and cost-efficient options for the group given the combination of its current shareholding structure and the type of business that each affiliate is engaged. We believe that this whole transition will essentially comprise the following two phases:
1) Phase I: the beak-up of the group�s long-held circular ownership structure between Samsung Electronics (005930 KS), Samsung Card, and Everland; and
The market is expected to interpret SSC�s divesture of the affiliate stake before end-2010 for a tax credit as the beginning of ownership restructuring

07 September 2010
Samsung Card (029780.KS / 029780 KS) 14
2) Phase II: the re-alignment of the group�s current ownership structure by several major business lines, triggering the separation of the whole group between the manufacturing and financial business segments and the creation of several sub-holding companies (i.e. financial, electronic, and etc.).
That said, we see a high chance of phase I taking place over the next 12-18 months given Samsung Card�s regulatory need to bring down its current 25.6% stake in Everland to below 5% by April, 2012. And we believe that phase I may well involve:
1) the IPO of Everland: this would establish an �undisputable� market price for Everland, leading Samsung Card to unload its Everland stakes at prevailing market prices; and
2) Samsung Card�s buy-back of the bulk of stakes held by Samsung Electronics using its excess capital: Since share buybacks from selective shareholders are not allowed, Samsung Card cannot directly buy back its stake from Samsung Electronics alone. However, the buyback in an indirect way would lead not only Samsung Electronics to eliminate its entire stakes in Samsung Card, but also for Samsung Life to become Samsung Card�s single-largest shareholder with a 40% stake.
Meanwhile, we find no strong need for the group to rush into phase II (which involves a series of potential share swaps between different affiliates and the creation of sub-holding companies to form some sort of holding company structure, including the transformation of Samsung Life as the group�s financial holding company). This, plus a heavy transition cost burden (to meet the shareholding requirement at the subsidiary level, i.e. 20% for listed subsidiaries and 30% for unlisted subsidiaries, and capital gains tax from potential share swaps), suggests that phase II may well prove to be a gradual and long-term process.
Nonetheless, the phase I itself is likely to be a meaningful share price catalyst for Samsung Card over the next six to 12 months, in our view. Timing-wise, Samsung Card is likely to dispose of some of its affiliate stake to utilise its tax credit before end-2010 and then the group is likely to initiate the IPO process of Everland from early 2011. In the meantime, we reckon that the market is likely to attempt to reflect the value of Everland as a holding company of the group in the share price of Samsung Card.
The group is likely to unravel its circular ownership web over the next 12-18 months
But further transition is likely to be a more gradual and long-term process

07 September 2010
Samsung C
ard (029780.K
S / 029780 KS)
15
Figure 31: Samsung group�s holding company transition road map
Source: Credit Suisse estimates

07 September 2010
Samsung Card (029780.KS / 029780 KS) 16
Target price of W71,000 with new emphasis on holding co. value Given that: 1) one of Samsung Card�s core assets is its 25.6% equity stake in Everland (a de facto holding company of Samsung Group); 2) Samsung Card should dispose its 20.6% stake in Everland by April 2012; and 3) the IPO of Everland, presumably sometime in 2011, is the most feasible way to dispose of the Everland stake, we believe that it is time to reflect the value of Everland stake as a de facto holding company into the Samsung Card valuation. As such, we derived our fair value estimate based on a sum-of-the-parts valuation � 1) the value of the credit card operation, 2) the value of investment assets and 3) the value of the Everland stake as a de facto holding company of Samsung Group.
Figure 32: Samsung Card � its sum-of-the-parts valuation (W bn) Equity & target multiple Value
Shareholders' equity at 4Q10E 5,811 �Other comprehensive income� at 2Q10 1,550 Shareholders' equity ex. �other comprehensive income� 4,261 Target P/B (x) 1.3 Credit card operation value 5,540
I. Operation value
Per share 45,000 �Other comprehensive income� at 2Q10 1,550 (Post-tax) MTM value of investment assets (refer to Figure 34) 278 Sub-total 1,828 Target P/B (x) 0.75 Investment asset value 1,371
II. Investment value
Per share 11,000 25.6% of Everland's BV at Dec-09 593 Revaluation gain of Everland's stake in Samsung Life (refer to Figure 36) 334 25.6% of Everland's BV (e) at Jun-10 927 Target P/B (x) - Applying multiple of SK C&C 3.0 Hold co value 2,780 Hold co value (excluding BV) 1,854
III. Hold co value of Everland
Per share 15,000 Firm value (W bn) 8,764 # of shares (mn) 123.0 SOTP value (W) 71,000 Source: Company data, Credit Suisse estimates.
■ I. Value of credit card operation: We stripped out the investment asset (booked as W1,550 bn of �other comprehensive income� as of the end of 2Q10) from the shareholders� equity. Based on our normalised ROE estimate (12%), we get our fair P/B multiple of 1.3x for the credit card operation. As such, we derived W5,540 bn or W45,000 per share for the fair value of Samsung Card�s credit card operation.
Fair value of W71,000 based on the sum of three parts: 1) the value of the credit card operation, 2) the value of investment assets, and 3) the value of a de facto holding company

07 September 2010
Samsung Card (029780.KS / 029780 KS) 17
Figure 33: SSC � ROE estimates ex. investment assets or �other comprehensive income� (%) 2007A 2008A 2009A 2010E 2011E 2012EMerchant fee rate 2.0 1.9 2.0 2.2 2.2 2.2Lending yield (based on mgd receivables) 19.3 20.0 21.3 21.7 21.7 22.0Funding cost 5.7 6.0 6.3 6.0 6.2 6.4Net interest spread 13.7 14.0 15.0 15.7 15.5 15.6Net interest margins 15.4 15.9 17.2 18.5 18.4 18.5SG&A costs / average managed receivables 11.8 11.6 11.9 13.6 13.0 12.8PPP margins 4.2 4.9 5.9 5.6 6.1 6.4LLP / average managed receivables 0.0 2.9 0.9 0.7 1.0 1.0ROA (based on mgd total assets) 3.7 1.6 4.0 4.0 3.2 3.4Leverage ratio (x) 5. 4.3 3.7 2.8 2.7 2.7ROE 19.4 7.0 14.8 11.4 8.7 9.3ROE excl. �Other comprehensive income� 24.9 8.4 17.1 14.5 11.8 12.4Card receivable / shareholders' fund (x) 3.3 3.3 2.4 2.0 2.1 2.1 Card receivable / shareholders' fund (ex. OCI) (x) 4.1 3.8 2.8 2.7 2.8 2.8 Tier 1 CAR 27.8 26.6 35.0 39.1 38.0 37.1Tier 1 CAR (ex. OCI) 22.1 23.0 30.0 28.4 28.1 27.8
Source: Company data, Credit Suisse estimates
■ II. Value of investment assets: We derived the value of investment assets by adding the MTM gain of investment assets to �Other comprehensive income� at end-1H10. The MTM gain of the available-for-sale stocks is only W9 bn as of June 2010. Since Samsung Card revalued its Everland stake in 2Q10 (mainly reflecting the [post-IPO] market value of Samsung Life held by Everland), we used the book value as of 2Q10 for the current (or fair market) value. We separately discuss about the possible valuation premium above the book value as a holding company of the group in the �III. Hold co value of Everland�. Thus, most of the MTM gain of investment assets are from: 1) 25.64% of Samsung Everland�s additional value of Samsung Life stake (W171 bn) and 2) 25.64% of Samsung Everland�s incremental land value (W165 bn). In addition, Samsung Everland is likely to see 3) the MTM gain of its 3.71% stake in recently listed �I Market Korea�. So, we reflected 25.64% of the MTM gain, or W10.3 bn, based on the closing price at the end of 2Q10. And then, we applied a 0.75x multiple, or 25% discount, as a typical holding company of the affiliate stocks in Korea.
Figure 34: Samsung Card-MTM gain of investment assets (W bn) Book value (4Q09) Current value Gain
1. MTM gain of available-for-sale stocks (Refer to below Figure 35) 2,582.4 2,591.4 9.02. 25.64% of Samsung Everland's additional value of Samsung Life stake 1) 171.33. 25.64% of Samsung Everland's 3.71% stake in I Market Korea 10.34. 25.64% of Samsung Everland�s incremental land value 2) 165.4Total gain before tax 356.1Total gain after tax 277.8Gain per share (W) 2,2591) Gap between 19.34% of Samsung Life's current shareholders' equity and Samsung Everland's current book value accrual of its 19.34% Samsung Life stake. 2) Assuming a 100% price appreciation relative to the current book value based on the 1998 appraisal value Source: Company data, Credit Suisse estimates

07 September 2010
Samsung Card (029780.KS / 029780 KS) 18
Figure 35: Samsung Card � details of available-for-sale equity investment in the group affiliates (W bn) % stake # of shares (�000) Purchase value Book value (end-2Q10) Current valueSamsung Securities 4.70 3,141.3 57.3 171.6 189.1Samsung Fire & Marine 4.85 2,297.7 90.4 449.3 482.5Hotel Shilla 1.34 525.9 4.6 13.0 11.4Cheil Worldwide 3.04 139.9 22.8 45.0 48.8Cheil Industry 4.90 2,450.0 18.3 231.3 203.8S-one 1.91 725.8 16.2 37.8 34.3Samsung Engineering 1.76 704.0 9.0 80.6 76.4Samsung Fine Chemicals 3.12 805.0 15.7 51.7 43.0Samsung Renault Motors 19.90 87.6 145.7 145.7Others 38.3 15.9 15.9Sub-total 360.4 1,241.9 1,250.9Samsung Everland 25.64 64.1 1,340.5 1,340.5Available-for-sale securities 424.5 2,582.4 2,591.4Gains before tax 9.0
Source: Company data, Credit Suisse estimates
■ III. Value of Everland stake as a de facto holding company of Samsung Group:
Before we derive the value of Everland as a de facto holding company of the group, we adjusted Everland�s BV. Basically, we calculated the book value estimate of Everland as of June 2010 by adding the revaluation gain (W334 bn) of Everland�s stake in Samsung Life to Everland�s BV as of December 2010. As a result, we derived W927 bn for 25.6% of Everland�s BV estimate as of June 2010.
Figure 36: Details of revaluation gain of Everland�s stake in Samsung Life Items Reference Amount (W bn) Samsung Life share price as of June-10 (W) (a) 103,500 Samsung Life shares held by Everland (mn) (b) 38.7 SLI market value as of Jun-10 (c) =(a)x(b) 4,004 SLI book value as of Dec-09 (d) 2,321 Revaluation gain of SLI shares (e) = (c) - (d) 1,683 (Post-tax) Revaluation gain (f) = (1-22.5%) x (e) 1,304 Samsung Card: 25.6% of (post-tax) revaluation gain 25.6% x (f) 334
Source: Company data, Credit Suisse estimates
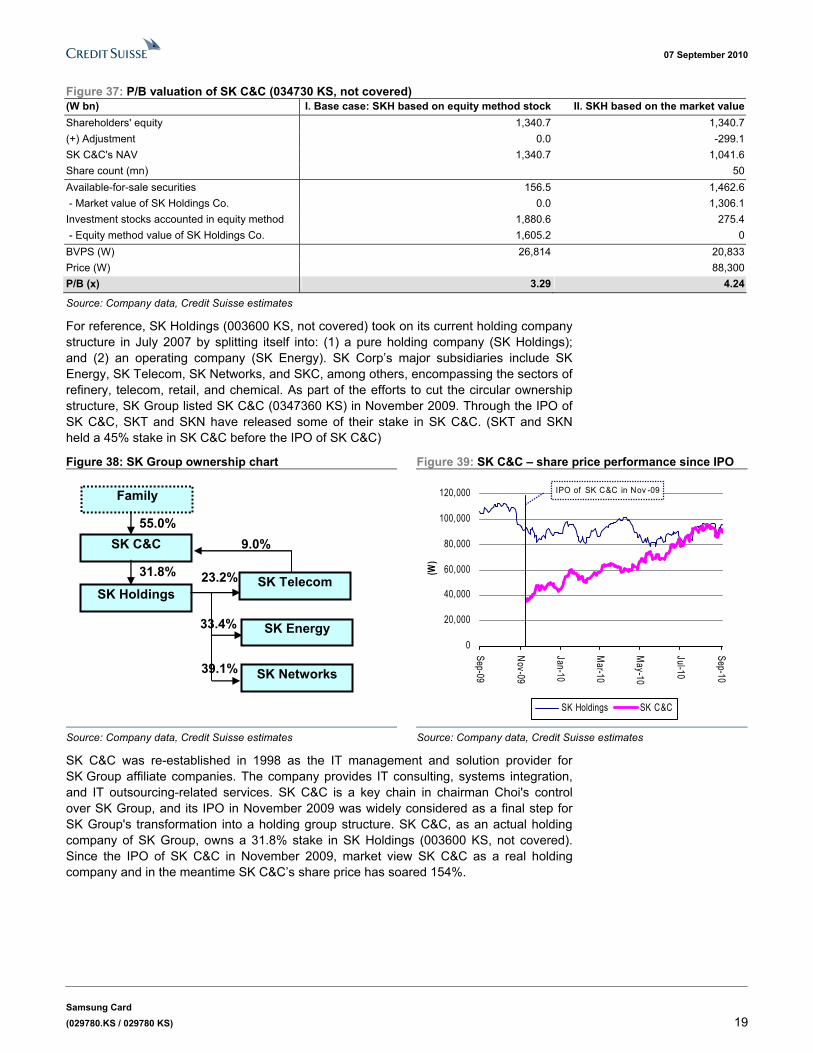
Given Samsung Card should dispose of its 20.6% stake in Everland by April 2012 and that the IPO of Everland is the most feasible option, we expect that Everland is likely to go public sometime in 2011. If this is the case, we expect that the (post-IPO) share price of Everland is likely to show a similar pattern to that of SK C&C (034730 KS, not covered). As such, we applied the P/B multiple of SK C&C�s share price to our BV estimate of Everland.
One of SK C&C�s main investment assets is its 31.8% equity stake in SK Holdings vis-a-vis Everland�s 25.6% equity stake in Samsung Life. Although SK Holdings is a listed company, SK C&C currently booked its stake under the equity method. Thus, we calculated the P/B multiple in two ways � 1) a base case assuming SKH shares, based on the equity method and 2) applying the market value of SKH shares, based on the assumption of SKH as �available for sale� securities. Since we cannot presume whether Everland is likely to book the Samsung Life stake as �available-for-sale� stock or equity-method stock, we review both. However, since SK Holdings� share price has languished since the IPO of SK C&C, the P/B multiple based on the market value might be overstated. Thus, for conservatism�s sake, we used the lower multiple between scenario I and scenario II, or around 3.0x. By applying this multiple, we derived the holding company value of the Everland stake.
Samsung Group�s holding company transition is likely to follow the case of SK Group. SK C&C�s IPO in November 2009 is an especially good comparison for Everland
07 September 2010
Samsung Card (029780.KS / 029780 KS) 19
Figure 37: P/B valuation of SK C&C (034730 KS, not covered) (W bn) I. Base case: SKH based on equity method stock II. SKH based on the market valueShareholders' equity 1,340.7 1,340.7(+) Adjustment 0.0 -299.1SK C&C's NAV 1,340.7 1,041.6Share count (mn) 50Available-for-sale securities 156.5 1,462.6 - Market value of SK Holdings Co. 0.0 1,306.1Investment stocks accounted in equity method 1,880.6 275.4 - Equity method value of SK Holdings Co. 1,605.2 0BVPS (W) 26,814 20,833Price (W) 88,300P/B (x) 3.29 4.24
Source: Company data, Credit Suisse estimates
For reference, SK Holdings (003600 KS, not covered) took on its current holding company structure in July 2007 by splitting itself into: (1) a pure holding company (SK Holdings); and (2) an operating company (SK Energy). SK Corp�s major subsidiaries include SK Energy, SK Telecom, SK Networks, and SKC, among others, encompassing the sectors of refinery, telecom, retail, and chemical. As part of the efforts to cut the circular ownership structure, SK Group listed SK C&C (0347360 KS) in November 2009. Through the IPO of SK C&C, SKT and SKN have released some of their stake in SK C&C. (SKT and SKN held a 45% stake in SK C&C before the IPO of SK C&C)
Figure 38: SK Group ownership chart Figure 39: SK C&C � share price performance since IPO
Family
SK C&C
SK HoldingsSK Telecom
SK Energy
SK Networks
55.0%
31.8% 23.2%
33.4%
39.1%
9.0%
0
20,000
40,000
60,000
80,000
100,000
120,000
Sep-09
Nov-09
Jan-10
Mar-10
May-10
Jul-10
Sep-10
(W)
SK Holdings SK C&C
IPO of SK C&C in Nov -09
Source: Company data, Credit Suisse estimates Source: Company data, Credit Suisse estimates
SK C&C was re-established in 1998 as the IT management and solution provider for SK Group affiliate companies. The company provides IT consulting, systems integration, and IT outsourcing-related services. SK C&C is a key chain in chairman Choi's control over SK Group, and its IPO in November 2009 was widely considered as a final step for SK Group's transformation into a holding group structure. SK C&C, as an actual holding company of SK Group, owns a 31.8% stake in SK Holdings (003600 KS, not covered). Since the IPO of SK C&C in November 2009, market view SK C&C as a real holding company and in the meantime SK C&C�s share price has soared 154%.
07 September 2010
Samsung Card (029780.KS / 029780 KS) 20
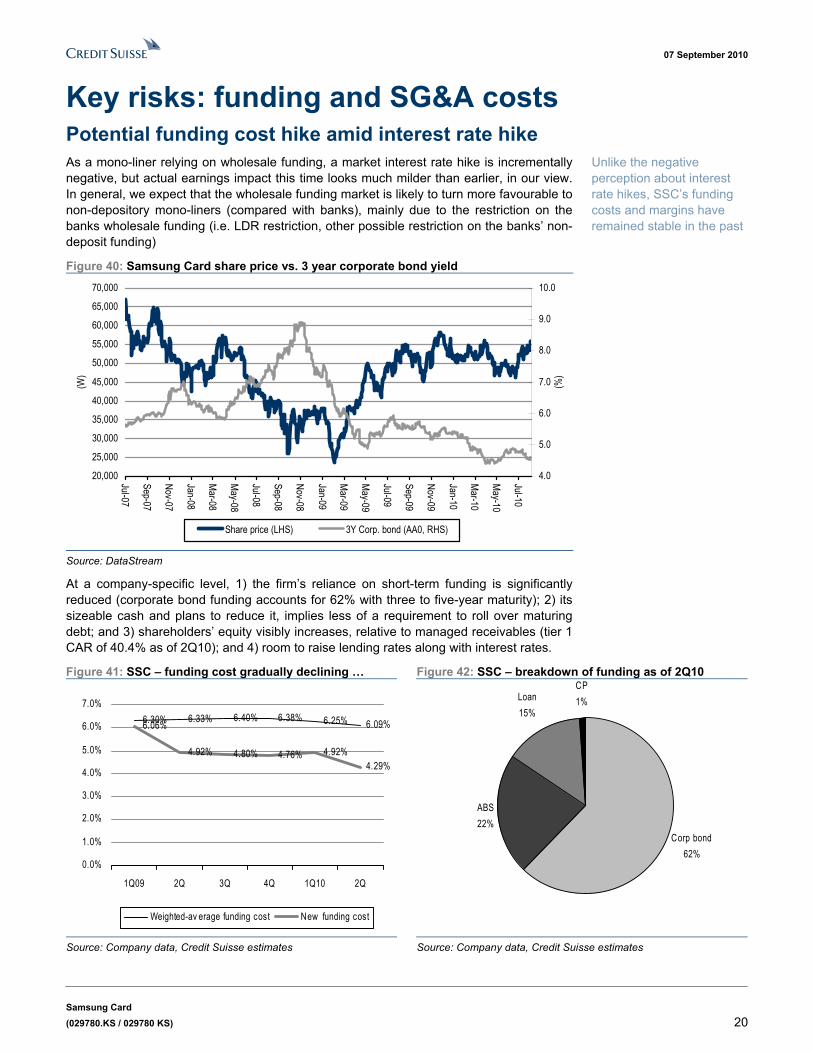
Key risks: funding and SG&A costs Potential funding cost hike amid interest rate hike As a mono-liner relying on wholesale funding, a market interest rate hike is incrementally negative, but actual earnings impact this time looks much milder than earlier, in our view. In general, we expect that the wholesale funding market is likely to turn more favourable to non-depository mono-liners (compared with banks), mainly due to the restriction on the banks wholesale funding (i.e. LDR restriction, other possible restriction on the banks� non-deposit funding)
Figure 40: Samsung Card share price vs. 3 year corporate bond yield
20,000
25,000
30,000
35,000
40,000
45,000
50,000
55,000
60,000
65,000
70,000
Jul-07
Sep-07
Nov-07
Jan-08
Mar-08
May-08
Jul-08
Sep-08
Nov-08
Jan-09
Mar-09
May-09
Jul-09
Sep-09
Nov-09
Jan-10
Mar-10
May-10
Jul-10
(W)
4.0
5.0
6.0
7.0
8.0
9.0
10.0
(%)
Share price (LHS) 3Y Corp. bond (AA0, RHS)
Source: DataStream
At a company-specific level, 1) the firm�s reliance on short-term funding is significantly reduced (corporate bond funding accounts for 62% with three to five-year maturity); 2) its sizeable cash and plans to reduce it, implies less of a requirement to roll over maturing debt; and 3) shareholders� equity visibly increases, relative to managed receivables (tier 1 CAR of 40.4% as of 2Q10); and 4) room to raise lending rates along with interest rates.
Figure 41: SSC � funding cost gradually declining � Figure 42: SSC � breakdown of funding as of 2Q10
6.30% 6.33% 6.40% 6.38% 6.25% 6.09%6.06%
4.92% 4.80% 4.76% 4.92%4.29%
0.0%
1.0%
2.0%
3.0%
4.0%
5.0%
6.0%
7.0%
1Q09 2Q 3Q 4Q 1Q10 2Q
Weighted-av erage funding cost New funding cost
Corp bond62%
ABS22%
Loan15%
CP1%
Source: Company data, Credit Suisse estimates Source: Company data, Credit Suisse estimates
Unlike the negative perception about interest rate hikes, SSC�s funding costs and margins have remained stable in the past

07 September 2010
Samsung Card (029780.KS / 029780 KS) 21
Figure 43: Funding cost trend Figure 44: Net interest margin trend
0.0%
1.0%
2.0%
3.0%
4.0%
5.0%
6.0%
7.0%
1Q07 3Q 1Q08 3Q 1Q09 3Q 1Q10 3QE
Shinhan Card Samsung Card
0%
5%
10%
15%
20%
25%
1Q07 3Q 1Q08 3Q 1Q09 3Q 1Q10 3QE
Shinhan Card Samsung Card
Source: Company data, Credit Suisse estimates Source: Company data, Credit Suisse estimates
In terms of middle-line margin, NIM remains largely unchanged, hovering around the 18-19% level. However, as new funding costs drop to 4.29% in 2Q10 from 4.92% in 1Q10, management expects the average funding cost to be around 6% (versus 6.09% in 2Q10) from 3Q onwards. Separately, the company�s delinquency ratio remained stable at 2.77% in 2Q10 versus 2.72% a quarter ago, and 4.2% a year ago. And credit costs (LLP/receivables) dropped to 1.6% in 2Q10 from 2.0% a quarter ago and 1.8% a year ago.
Figure 45: PPOP margin Figure 46: ROA
0%
2%
4%
6%
8%
10%
12%
14%
1Q07 3Q 1Q08 3Q 1Q09 3Q 1Q10 3QE
Shinhan Card Samsung Card
-4%
-2%
0%
2%
4%
6%
8%
10%
12%
1Q07 3Q 1Q08 3Q 1Q09 3Q 1Q10 3QE
Shinhan Card Samsung Card
Source: Company data, Credit Suisse estimates Source: Company data, Credit Suisse estimates
Potential SG&A cost hike amid rising competition There have been several signs of rising competition, such as: 1) Hana Financial Group�s credit card joint venture with SK Telecom; 2) mono-line credit card companies� increased mileage bonuses; 3) KB Bank�s plan to spin off its credit card operation sometime in 2011; and 4) KT (Korea Telecom)�s purchase of BC Card stake. Against this backdrop, Samsung Card has stepped up its promotion efforts since the beginning of this year. Samsung Card is aggressively acquiring new customers by taking advantage of its affiliate Samsung Electronics� distribution network. Although Samsung Card stepped up promotion efforts from the start of the year, the cost to income ratio YTD remains stable.
Unlike market concern about potential cost increases amid rising competition, SSC has so far maintained its disciplined cost efficiency

07 September 2010
Samsung Card (029780.KS / 029780 KS) 22
Figure 47: Samsung Card � quarterly trend of cost-income ratio
0
100
200
300
400
500
600
700
800
1Q04 4Q04 3Q05 2Q06 1Q07 4Q07 3Q08 2Q09 1Q10 4Q10 3Q11 2Q12
(W b
n)
0%10%20%30%40%50%60%70%80%90%100%
Income (LHS) Cost (LHS) Cost-income ratio (RHS)
CS forecast
Source: Company data, Credit Suisse estimates
In general, although the system�s credit sales growth is robust (15-18% YoY), our view is that the sector is rather overcrowded especially for the new entrant. Although Hana Financial Group�s new experiment on the mobile credit card so far has not received much traction in the market, overall competition might turn more heated in the mobile credit card market. The new chairman of KB Financial Group recently said it will spin off its credit card operation as a subsidiary (it is part of the bank�s operation). KB Financial Group�s management believe that KB credit cards lost market share to competitors, mainly due to the conflict of risk management and marketing promotions between the bank and credit card. Separately, he revealed his interest in a strategic alliance with KT (Korea Telecom), although he did not specifically mention the mobile credit card business, etc. So, in this case, we should wait to see how other mono-line credit card companies, such as Hyundai Card (not listed), are likely to react.
Despite all this, the recent trend basically reaffirms that concerns over an SG&A cost increase for market share gains is overdone. Credit card receivables are increasing at a healthy pace (4.1% QoQ and 12.2% YoY), while delinquency is under control. In terms of market share (based on new credit purchases), Samsung Card slightly regained its market share to 14.2% in 1H10 from 13.6% in 2009. Management revealed that it plans to maintain its market share at least above the 14% level.

07 September 2010
Samsung Card (029780.KS / 029780 KS) 23
Figure 48: Samsung Card � one-year forward P/B (W) Figure 49: Samsung Card � one-year forward P/PPP (W)
0
20,000
40,000
60,000
80,000
100,000
120,000Ju
n-07
Oct-0
7
Feb-
08
Jun-
08
Oct-0
8
Feb-
09
Jun-
09
Oct-0
9
Feb-
10
Jun-
10
0.65x
0.95x
1.25x
1.80x
2.10x
0
10,000
20,000
30,000
40,000
50,000
60,000
70,000
80,000
90,000
Jun-
07
Oct-0
7
Feb-
08
Jun-
08
Oct-0
8
Feb-
09
Jun-
09
Oct-0
9
Feb-
10
Jun-
10
4.5x
8.0x
9.5x
12.0x
14.0x
Source: Datastream, company data, Credit Suisse estimates Source: Datastream, Company data, Credit Suisse estimates

07 September 2010
Samsung C
ard (029780.K
S / 029780 KS)
24
Figure 50: Samsung Card � financial statement summary (W bn) 2008 2009 2010E 2011E 2012E 2008 2009 2010E 2011E 2012EProfit & loss Key ratio (%) Interest revenue 1,766 1,592 1,405 1,598 1,841 Merchant fee rate 1.88 1.98 2.18 2.21 2.21 Merchant fees 705 770 957 1,035 1,108 Lending yield (based on mgd receiv.) 20.0 21.3 21.7 21.7 22.0Total interest revenue 2,471 2,362 2,361 2,633 2,949 Funding cost 6.0 6.3 6.0 6.2 6.4Interest expenses 499 453 351 409 462 Net interest spread 14.0 15.0 15.7 15.5 15.6Net interest income 1,972 1,909 2,010 2,224 2,487 Net interest margins (%) 15.9 17.2 18.5 18.4 18.5Non-interest income 79 70 82 88 94 SG&A costs / avg mgd receivables 11.6 11.9 13.6 13.0 12.8Gross revenues 2,051 1,979 2,092 2,312 2,582 PPP margins 4.9 5.9 5.6 6.1 6.4SG&A costs 1,442 1,320 1,484 1,570 1,722 LLP / avg mgd receivables 2.9 0.9 0.7 1.0 1.0Pre-provision profit 609 659 608 742 860 ROA (based on mgd total assets) 1.6 4.0 4.0 3.2 3.4Loan-loss provision 354 104 81 118 135 ROE 7.0 14.8 11.4 8.7 9.3Non-operating gains 74 136 56 45 45 Equity-to-mgd receivables ratio (%) 30.2 42.0 50.1 48.8 47.5Net profit before tax 329 691 583 668 769 Credit card usage Tax 71 87 0 147 169 Card sales 37,434 38,931 43,865 46,936 50,221Net profit after tax 258 604 583 521 600 Cash advance 8,981 8,726 8,590 8,481 8,374# of common shares (mn) 123 123 123 123 123 Total usage 46,415 47,657 52,455 55,417 58,595Managed receivables Cash advance as a % of total usage 19.3 18.3 16.4 15.3 14.3Normal receivables 11,245 9,973 11,146 12,366 13,723 Asset quality (%) Over 1M delinquent loans 556 224 188 296 417 NPL ratio 3.7 1.7 1.4 1.4 1.2Re-aged loans not/below 1M delinquent 689 333 272 179 117 Precautionary loan ratio 5.9 3.8 3.2 2.9 2.6Managed receivables 12,490 10,530 11,606 12,841 14,257 New NPLs of avg. receivables 1.5 0.4 1.3 1.7 1.6Average managed IEA 12,230 11,344 10,741 11,941 13,233 Write-offs / average receivables 2.4 3.1 1.6 1.6 1.6Per share data LLP as % of avg credits 2.9 0.9 0.7 1.0 1.0EPS (W) 2,134 4,911 4,741 4,240 4,881 New over 1M / average receivables -0.5 0.7 0.7 1.7 2.0BVPS (W) 30,653 35,997 47,263 50,931 55,079 'True' delinquent loan ratio 10.0 5.3 4.0 3.7 3.7DPS (W) 600 900 1,100 1,100 1,200 Reserves / True > 1M 52.7 61.2 74.9 78.4 74.1Source: Company data, Credit Suisse estimates

07 September 2010
Samsung Card (029780.KS / 029780 KS) 25
As of close of business 6 September 2010, Credit Suisse Securities (Europe) Limited, Seoul Branch performs the role of liquidity provider on the warrants of which underlying asset is Samsung Electronics/ Samsung Securities/ Samsung F&M/ Samsung Eng./ Samsung SDI/ SEMCO/ Samsung Techwin/ Samsung C&T/ Samsung Heavy/ SK Corp/ SK Telecom/ SK Energy/ KB Financial/ Shinhan FG/ Woori FH/ Hana FG/ Hynix Semi and holds 35,307,480/ 16,642,100/ 13,454,310/ 3,399,280/ 16,286,520/ 17,782,390/ 13,066,710/ 23,473,460/ 13,449,370/ 3,396,040/ 46,966,840/ 20,323,500/ 16,393,280/ 16,602,270/ 15,037,870/ 6,703,700/ 18,490,210 of warrants concerned. These may be covered warrants that constitute part of a hedged position.
Credit Suisse is acting as financial advisor to the Share Management Council on the potential sale of their collective stake in Hynix Semiconductor. The Share Management Council is composed of the following companies: Korea Exchange Bank; Woori Bank; Korea Development Bank; Shinhan Bank; Resolution & Finance Corp; National Agricultural Cooperative Federation; SH Asset Management; Daewoo Securities; and, Woori Investment and Securities.

07 September 2010
Samsung Card (029780.KS / 029780 KS) 26
Companies Mentioned (Price as of 07 Sep 10) Busan Bank (005280.KS, W12,450, NEUTRAL [V], TP W14,500) Cheil Industries Inc (001300.KS, W103,000, NEUTRAL, TP W91,000) Cheil Worldwide (030000.KS, W13,200, OUTPERFORM, TP W15,000) Daegu Bank (005270.KS, W13,800, NEUTRAL, TP W17,000) Hana Financial Group (086790.KS, W31,500, OUTPERFORM [V], TP W44,000) Hotel Shilla Co Ltd (008770.KS, W29,200, NOT RATED) Hynix Semiconductor (000660.KS, W21,500, RESTRICTED [V]) Industrial Bank of Korea (024110.KS, W14,300, OUTPERFORM [V], TP W20,000) KB Financial Group (105560.KS, W48,800, OUTPERFORM [V], TP W62,000) S1 Corporation (012750.KS, W59,200, NEUTRAL, TP W60,000) Samsung C&T Corporation (000830.KS, W55,900, NEUTRAL [V], TP W62,000) Samsung Card (029780.KS, W53,300, OUTPERFORM, TP W71,000) Samsung Electro-Mechanics (009150.KS, W120,500, NEUTRAL, TP W141,500) Samsung Electronics (005930.KS, W788,000, OUTPERFORM, TP W940,000) Samsung Engineering Co Ltd (028050.KS, W129,500, OUTPERFORM [V], TP W150,000) Samsung Fine Chemicals Co. Ltd (004000.KS, W66,100, NOT RATED) Samsung Fire & Marine (000810.KS, W195,000, OUTPERFORM, TP W245,000) Samsung Heavy Industries (010140.KS, W26,650, NEUTRAL [V], TP W22,000) Samsung Life Insurance (032830.KS, W113,500, NEUTRAL [V], TP W118,000) Samsung SDI (006400.KS, W174,500, UNDERPERFORM, TP W130,000) Samsung Securities (016360.KS, W59,800, UNDERPERFORM, TP W47,000) Samsung Techwin Co. Ltd (012450.KS, W114,500, NOT RATED) Shinhan Financial Group (055550.KS, W43,150, OUTPERFORM, TP W62,000) SK C&C (034730.KS, W88,100, NOT RATED) SK Energy (096770.KS, W127,000, OUTPERFORM [V], TP W181,000) SK Holdings (003600.KS, W94,800, NOT RATED) SK Networks (001740.KS, W10,100, NOT RATED) SK Telecom (017670.KS, W163,500, NEUTRAL, TP W183,000) Woori Finance Holdings (053000.KS, W13,300, NEUTRAL [V], TP W16,000)
Disclosure Appendix Important Global Disclosures Sokmo Yun, Soyeon Hong & Seok Yun, CFA, CA each certify, with respect to the companies or securities that he or she analyzes, that (1) the views expressed in this report accurately reflect his or her personal views about all of the subject companies and securities and (2) no part of his or her compensation was, is or will be directly or indirectly related to the specific recommendations or views expressed in this report. See the Companies Mentioned section for full company names. 3-Year Price, Target Price and Rating Change History Chart for 005280.KS 005280.KS Closing
Price Target
Price
Initiation/ Date (W) (W) Rating Assumption 11-Apr-08 13450 17000 O X 29-Sep-08 10700 14900 20-Oct-08 8200 10000 12-Dec-08 6250 7000 27-Apr-09 6900 N 18-Jun-09 9280 10000 O 24-Jul-09 10900 12200 22-Oct-09 13900 17000 15-Jun-10 11300 13000 N X 30-Jul-10 12750 14500
17000
14900
10000
7000
10000
12200
17000
13000
14500
11-Apr-08 15-Jun-10
N
O
N
O
4985
6985
8985
10985
12985
14985
16985
8-Sep-07
8-Nov-07
8-Jan-
08
8-Mar-0
8
8-May-08
8-Jul-08
8-Sep-08
8-Nov-0
8
8-Jan-0
9
8-Mar-09
8-May-
09
8-Jul-09
8-Sep-09
8-Nov-09
8-Jan-10
8-Mar-10
8-May-
10
8-Jul-1
0
Closing Price Target Price Initiation/Assumption Rating
W
O=Outperform; N=Neutral; U=Underperform; R=Restricted; NR=Not Rated; NC=Not Covered

07 September 2010
Samsung Card (029780.KS / 029780 KS) 27
3-Year Price, Target Price and Rating Change History Chart for 001300.KS 001300.KS Closing
Price Target
Price
Initiation/ Date (W) (W) Rating Assumption 14-Feb-08 39000 47000 22-Jul-08 50400 49500 9-Feb-09 36500 36500 29-Jul-09 48300 45000 3-Feb-10 56800 51500 6-May-10 85000 72000 30-Jul-10 90800 91000
47000 49500
36500
4500051500
72000
91000
32550
42550
52550
62550
72550
82550
92550
102550
8-Sep-07
8-Nov-07
8-Jan-
08
8-Mar-0
8
8-May-08
8-Jul-08
8-Sep-08
8-Nov-0
8
8-Jan-0
9
8-Mar-09
8-May-
09
8-Jul-09
8-Sep-09
8-Nov-09
8-Jan-10
8-Mar-10
8-May-
10
8-Jul-1
0
Closing Price Target Price Initiation/Assumption Rating
W
O=Outperform; N=Neutral; U=Underperform; R=Restricted; NR=Not Rated; NC=Not Covered
3-Year Price, Target Price and Rating Change History Chart for 030000.KS 030000.KS Closing
Price Target
Price
Initiation/ Date (W) (W) Rating Assumption 17-Jan-08 10280 11200 25-Apr-08 10660 11320 15-Jul-08 8880 9400 24-Oct-08 7100 8400 7-Jul-09 9600 12000 O 23-Oct-09 12720 13200 N 26-Feb-10 12120 13520 31-May-10 12600 15000 O
11200 11320
94008400
12000
13200 13520
15000
ON
O
5360
6360
7360
8360
9360
10360
11360
12360
13360
14360
8-Sep-07
8-Nov-07
8-Jan-
08
8-Mar-0
8
8-May-08
8-Jul-08
8-Sep-08
8-Nov-0
8
8-Jan-0
9
8-Mar-09
8-May-
09
8-Jul-09
8-Sep-09
8-Nov-09
8-Jan-10
8-Mar-10
8-May-
10
8-Jul-1
0
Closing Price Target Price Initiation/Assumption Rating
W
O=Outperform; N=Neutral; U=Underperform; R=Restricted; NR=Not Rated; NC=Not Covered
3-Year Price, Target Price and Rating Change History Chart for 005270.KS 005270.KS Closing
Price Target
Price
Initiation/ Date (W) (W) Rating Assumption 11-Apr-08 13950 18000 O X 29-Sep-08 10750 15700 20-Oct-08 7800 10500 12-Dec-08 6980 8000 28-Apr-09 8540 N 18-Jun-09 11600 12800 O 29-Jul-09 13700 14900 29-Oct-09 15950 20100 15-Jun-10 14300 15600 N X 2-Aug-10 15150 17000
18000
15700
10500
8000
12800
14900
20100
1560017000
11-Apr-08 15-Jun-10
N
O
N
O
5500
7500
9500
11500
13500
15500
17500
19500
8-Sep-07
8-Nov-07
8-Jan-
08
8-Mar-0
8
8-May-08
8-Jul-08
8-Sep-08
8-Nov-0
8
8-Jan-0
9
8-Mar-09
8-May-
09
8-Jul-09
8-Sep-09
8-Nov-09
8-Jan-10
8-Mar-10
8-May-
10
8-Jul-1
0
Closing Price Target Price Initiation/Assumption Rating
W
O=Outperform; N=Neutral; U=Underperform; R=Restricted; NR=Not Rated; NC=Not Covered

07 September 2010
Samsung Card (029780.KS / 029780 KS) 28
3-Year Price, Target Price and Rating Change History Chart for 086790.KS 086790.KS Closing
Price Target
Price
Initiation/ Date (W) (W) Rating Assumption 11-Apr-08 46650 58000 19-Sep-08 29400 30500 N 20-Oct-08 22000 24600 12-Dec-08 19000 17600 27-Apr-09 20650 U 18-Jun-09 25750 24000 27-Jul-09 32200 31300 N 26-Oct-09 37800 39000 14-Dec-09 35800 R 1-Mar-10 33500 N 15-Jun-10 33100 44000 O X
58000
30500
24600
17600
24000
31300
39000
44000
15-Jun-10
ONR
N
U
N
12450
17450
22450
27450
32450
37450
42450
47450
52450
57450
8-Sep-07
8-Nov-07
8-Jan-
08
8-Mar-0
8
8-May-08
8-Jul-08
8-Sep-08
8-Nov-0
8
8-Jan-0
9
8-Mar-09
8-May-
09
8-Jul-09
8-Sep-09
8-Nov-09
8-Jan-10
8-Mar-10
8-May-
10
8-Jul-1
0
Closing Price Target Price Initiation/Assumption Rating
W
O=Outperform; N=Neutral; U=Underperform; R=Restricted; NR=Not Rated; NC=Not Covered
3-Year Price, Target Price and Rating Change History Chart for 024110.KS 024110.KS Closing
Price Target
Price
Initiation/ Date (W) (W) Rating Assumption 1-Nov-07 17350 26300 O 15-Feb-08 15900 23000 11-Apr-08 16850 20000 29-Sep-08 14550 15600 N 20-Oct-08 7980 10400 12-Dec-08 8100 6400 U 8-May-09 9210 7700 18-Jun-09 10200 9400 N 31-Jul-09 14100 13500 2-Nov-09 14300 16000 15-Jun-10 14650 19000 O X 29-Jul-10 15950 20000
26300
23000
20000
15600
10400
64007700
9400
13500
16000
1900020000
15-Jun-10
O
NU
N
O
5360
10360
15360
20360
25360
8-Sep-07
8-Nov-07
8-Jan-
08
8-Mar-0
8
8-May-08
8-Jul-08
8-Sep-08
8-Nov-0
8
8-Jan-0
9
8-Mar-09
8-May-
09
8-Jul-09
8-Sep-09
8-Nov-09
8-Jan-10
8-Mar-10
8-May-
10
8-Jul-1
0
Closing Price Target Price Initiation/Assumption Rating
W
O=Outperform; N=Neutral; U=Underperform; R=Restricted; NR=Not Rated; NC=Not Covered
3-Year Price, Target Price and Rating Change History Chart for 105560.KS 105560.KS Closing
Price Target
Price
Initiation/ Date (W) (W) Rating Assumption 5-Feb-08 62000 83500 11-Apr-08 64700 79000 29-Sep-08 54500 66000 N 20-Oct-08 39050 55000 12-Dec-08 31250 43000 O 21-May-09 46800 54500 18-Jun-09 39350 56000 21-Aug-09 54500 63000 12-Nov-09 57800 70000 15-Jun-10 51200 64000 X 2-Aug-10 52200 62000
8350079000
66000
55000
43000
5450056000
63000
700006400062000
15-Jun-10O
N
22800
32800
42800
52800
62800
72800
82800
8-Sep-07
8-Nov-07
8-Jan-
08
8-Mar-0
8
8-May-08
8-Jul-08
8-Sep-08
8-Nov-0
8
8-Jan-0
9
8-Mar-09
8-May-
09
8-Jul-09
8-Sep-09
8-Nov-09
8-Jan-10
8-Mar-10
8-May-
10
8-Jul-1
0
Closing Price Target Price Initiation/Assumption Rating
W
O=Outperform; N=Neutral; U=Underperform; R=Restricted; NR=Not Rated; NC=Not Covered

07 September 2010
Samsung Card (029780.KS / 029780 KS) 29
3-Year Price, Target Price and Rating Change History Chart for 012750.KS 012750.KS Closing
Price Target
Price
Initiation/ Date (W) (W) Rating Assumption 6-Nov-07 61700 75000 25-Jul-08 57500 64000 N 28-Oct-08 39450 51000 11-Mar-09 45050 56000 O 24-Jul-09 59000 61000 N 26-Oct-09 49000 O 27-Jan-10 47000 58000 25-Jun-10 51100 N 26-Jul-10 59200 60000
75000
64000
51000
56000
6100058000
60000
NO
N
O
N
38000
43000
48000
53000
58000
63000
68000
73000
8-Sep-07
8-Nov-07
8-Jan-
08
8-Mar-0
8
8-May-08
8-Jul-08
8-Sep-08
8-Nov-0
8
8-Jan-0
9
8-Mar-09
8-May-
09
8-Jul-09
8-Sep-09
8-Nov-09
8-Jan-10
8-Mar-10
8-May-
10
8-Jul-1
0
Closing Price Target Price Initiation/Assumption Rating
W
O=Outperform; N=Neutral; U=Underperform; R=Restricted; NR=Not Rated; NC=Not Covered
3-Year Price, Target Price and Rating Change History Chart for 000830.KS 000830.KS Closing
Price Target
Price
Initiation/ Date (W) (W) Rating Assumption 18-Sep-07 63900 N 25-Jul-08 54500 60000 24-Oct-08 31400 34000 U 23-Oct-09 53500 49000 26-Feb-10 59100 62000 N
60000
34000
49000
62000N
U
N
28000
38000
48000
58000
68000
78000
8-Sep-07
8-Nov-07
8-Jan-
08
8-Mar-0
8
8-May-08
8-Jul-08
8-Sep-08
8-Nov-0
8
8-Jan-0
9
8-Mar-09
8-May-
09
8-Jul-09
8-Sep-09
8-Nov-09
8-Jan-10
8-Mar-10
8-May-
10
8-Jul-1
0
Closing Price Target Price Initiation/Assumption Rating
W
O=Outperform; N=Neutral; U=Underperform; R=Restricted; NR=Not Rated; NC=Not Covered
3-Year Price, Target Price and Rating Change History Chart for 029780.KS 029780.KS Closing
Price Target
Price
Initiation/ Date (W) (W) Rating Assumption 31-Jan-08 46000 O 29-Oct-08 27800 46000 3-Jun-09 48500 56000 22-Jul-09 47150 57000 28-Oct-09 49800 60000 26-Jul-10 X
46000
560005700060000
26-Jul-10
O
23600
28600
33600
38600
43600
48600
53600
58600
63600
8-Sep-07
8-Nov-07
8-Jan-
08
8-Mar-0
8
8-May-08
8-Jul-08
8-Sep-08
8-Nov-0
8
8-Jan-0
9
8-Mar-09
8-May-
09
8-Jul-09
8-Sep-09
8-Nov-09
8-Jan-10
8-Mar-10
8-May-
10
8-Jul-1
0
Closing Price Target Price Initiation/Assumption Rating
W
O=Outperform; N=Neutral; U=Underperform; R=Restricted; NR=Not Rated; NC=Not Covered

07 September 2010
Samsung Card (029780.KS / 029780 KS) 30
3-Year Price, Target Price and Rating Change History Chart for 009150.KS 009150.KS Closing
Price Target
Price
Initiation/ Date (W) (W) Rating Assumption 22-Oct-07 59000 58800 21-Jan-08 41500 45000 30-Apr-08 54500 55400 22-May-08 48500 43000 28-Jul-08 35100 34000 U 10-Dec-08 33550 32400 28-Jan-09 34100 27300 27-Apr-09 49700 39000 24-Jul-09 67400 63000 N 23-Oct-09 100000 90800 29-Jan-10 97500 96000 26-Apr-10 139000 130000 26-Jul-10 144500 141500
5880045000
5540043000
34000 324002730039000
63000
9080096000
130000141500
N
U27300
47300
67300
87300
107300
127300
147300
8-Sep-07
8-Nov-07
8-Jan-
08
8-Mar-0
8
8-May-08
8-Jul-08
8-Sep-08
8-Nov-0
8
8-Jan-0
9
8-Mar-09
8-May-
09
8-Jul-09
8-Sep-09
8-Nov-09
8-Jan-10
8-Mar-10
8-May-
10
8-Jul-1
0
Closing Price Target Price Initiation/Assumption Rating
W
O=Outperform; N=Neutral; U=Underperform; R=Restricted; NR=Not Rated; NC=Not Covered
3-Year Price, Target Price and Rating Change History Chart for 005930.KS 005930.KS Closing
Price Target
Price
Initiation/ Date (W) (W) Rating Assumption 15-Oct-07 542000 730000 28-Apr-08 716000 780000 28-Jul-08 560000 710000 1-Sep-08 506000 630000 27-Oct-08 438000 520000 16-Jan-09 469000 N 27-Apr-09 585000 560000 9-Jun-09 565000 670000 O 7-Jul-09 650000 740000 20-Aug-09 740000 860000 23-Nov-09 759000 940000
730000780000
710000
630000
520000560000
670000
740000
860000
940000
O
N
407500
507500
607500
707500
807500
907500
8-Sep-07
8-Nov-07
8-Jan-
08
8-Mar-0
8
8-May-08
8-Jul-08
8-Sep-08
8-Nov-0
8
8-Jan-0
9
8-Mar-09
8-May-
09
8-Jul-09
8-Sep-09
8-Nov-09
8-Jan-10
8-Mar-10
8-May-
10
8-Jul-1
0
Closing Price Target Price Initiation/Assumption Rating
W
O=Outperform; N=Neutral; U=Underperform; R=Restricted; NR=Not Rated; NC=Not Covered
3-Year Price, Target Price and Rating Change History Chart for 028050.KS 028050.KS Closing
Price Target
Price
Initiation/ Date (W) (W) Rating Assumption 15-Apr-08 X 16-Apr-08 92700 110000 O X 14-Jul-08 68300 78000 28-Jul-08 79800 N 15-Oct-08 69200 72000 3-Nov-08 52800 52000 21-Jan-09 57000 58000 23-Apr-09 75000 65000 28-May-09 88900 78000 24-Jul-09 83300 83000 22-Oct-09 118500 110000 29-Jan-10 113500 120000 22-Jul-10 123500 150000 O
110000
7800072000
5200058000
65000
7800083000
110000120000
150000
15-Apr-0816-Apr-08
O
N
O
29000
49000
69000
89000
109000
129000
149000
8-Sep-07
8-Nov-07
8-Jan-
08
8-Mar-0
8
8-May-08
8-Jul-08
8-Sep-08
8-Nov-0
8
8-Jan-0
9
8-Mar-09
8-May-
09
8-Jul-09
8-Sep-09
8-Nov-09
8-Jan-10
8-Mar-10
8-May-
10
8-Jul-1
0
Closing Price Target Price Initiation/Assumption Rating
W
O=Outperform; N=Neutral; U=Underperform; R=Restricted; NR=Not Rated; NC=Not Covered
07 September 2010
Samsung Card (029780.KS / 029780 KS) 31
3-Year Price, Target Price and Rating Change History Chart for 000810.KS 000810.KS Closing
Price Target
Price
Initiation/ Date (W) (W) Rating Assumption 1-Nov-07 244000 265000 4-Feb-08 200000 230000 21-May-08 227000 240000 N 14-Oct-08 200500 200000 3-Aug-09 210000 230000 12-Oct-09 230500 260000 1-Feb-10 181500 220000 10-May-10 195000 245000 O
265000
230000240000
200000
230000
260000
220000
245000
O
N
148000
168000
188000
208000
228000
248000
8-Sep-07
8-Nov-07
8-Jan-
08
8-Mar-0
8
8-May-08
8-Jul-08
8-Sep-08
8-Nov-0
8
8-Jan-0
9
8-Mar-09
8-May-
09
8-Jul-09
8-Sep-09
8-Nov-09
8-Jan-10
8-Mar-10
8-May-
10
8-Jul-1
0
Closing Price Target Price Initiation/Assumption Rating
W
O=Outperform; N=Neutral; U=Underperform; R=Restricted; NR=Not Rated; NC=Not Covered
3-Year Price, Target Price and Rating Change History Chart for 010140.KS 010140.KS Closing
Price Target
Price
Initiation/ Date (W) (W) Rating Assumption 20-Sep-07 46250 44000 N X 31-Oct-07 53700 50500 7-May-08 38000 32300 6-Nov-08 17800 22300 12-May-09 30950 29900 4-Nov-09 23500 23000 28-Jan-10 24900 20000 U 29-Jul-10 24550 22000 N
44000
50500
32300
22300
29900
2300020000
22000
20-Sep-07
NU
N
11850
16850
21850
26850
31850
36850
41850
46850
51850
8-Sep-07
8-Nov-07
8-Jan-
08
8-Mar-0
8
8-May-08
8-Jul-08
8-Sep-08
8-Nov-0
8
8-Jan-0
9
8-Mar-09
8-May-
09
8-Jul-09
8-Sep-09
8-Nov-09
8-Jan-10
8-Mar-10
8-May-
10
8-Jul-1
0
Closing Price Target Price Initiation/Assumption Rating
W
O=Outperform; N=Neutral; U=Underperform; R=Restricted; NR=Not Rated; NC=Not Covered
3-Year Price, Target Price and Rating Change History Chart for 032830.KS 032830.KS Closing
Price Target
Price
Initiation/ Date (W) (W) Rating Assumption 4-Aug-10 112500 118000 N X
118000
4-Aug-10
N
98000
103000
108000
113000
118000
8-Sep-07
8-Nov-07
8-Jan-
08
8-Mar-0
8
8-May-08
8-Jul-08
8-Sep-08
8-Nov-0
8
8-Jan-0
9
8-Mar-09
8-May-
09
8-Jul-09
8-Sep-09
8-Nov-09
8-Jan-10
8-Mar-10
8-May-
10
8-Jul-1
0
Closing Price Target Price Initiation/Assumption Rating
W
O=Outperform; N=Neutral; U=Underperform; R=Restricted; NR=Not Rated; NC=Not Covered

07 September 2010
Samsung Card (029780.KS / 029780 KS) 32
3-Year Price, Target Price and Rating Change History Chart for 006400.KS 006400.KS Closing
Price Target
Price
Initiation/ Date (W) (W) Rating Assumption 24-Apr-08 76800 74500 30-Mar-09 64600 63000 29-Apr-09 90000 65000 22-Jul-09 104000 108700 N 1-Oct-09 142000 127000 U 28-Apr-10 144500 130000
745006300065000
108700
127000 130000U
N
52600
72600
92600
112600
132600
152600
172600
8-Sep-07
8-Nov-07
8-Jan-
08
8-Mar-0
8
8-May-08
8-Jul-08
8-Sep-08
8-Nov-0
8
8-Jan-0
9
8-Mar-09
8-May-
09
8-Jul-09
8-Sep-09
8-Nov-09
8-Jan-10
8-Mar-10
8-May-
10
8-Jul-1
0
Closing Price Target Price Initiation/Assumption Rating
W
O=Outperform; N=Neutral; U=Underperform; R=Restricted; NR=Not Rated; NC=Not Covered
3-Year Price, Target Price and Rating Change History Chart for 016360.KS 016360.KS Closing
Price Target
Price
Initiation/ Date (W) (W) Rating Assumption 1-Feb-08 66000 55000 21-Oct-08 70100 46500 25-Aug-09 78900 47000
55000
46500 4700046500
56500
66500
76500
86500
96500
106500
8-Sep-07
8-Nov-07
8-Jan-
08
8-Mar-0
8
8-May-08
8-Jul-08
8-Sep-08
8-Nov-0
8
8-Jan-0
9
8-Mar-09
8-May-
09
8-Jul-09
8-Sep-09
8-Nov-09
8-Jan-10
8-Mar-10
8-May-
10
8-Jul-1
0
Closing Price Target Price Initiation/Assumption Rating
W
O=Outperform; N=Neutral; U=Underperform; R=Restricted; NR=Not Rated; NC=Not Covered
3-Year Price, Target Price and Rating Change History Chart for 055550.KS 055550.KS Closing
Price Target
Price
Initiation/ Date (W) (W) Rating Assumption 14-Nov-07 53900 73500 5-Feb-08 51100 68000 11-Apr-08 55100 63000 29-Sep-08 42750 58000 20-Oct-08 35500 50000 4-Dec-08 30750 R 8-Dec-08 34000 O 12-Dec-08 29700 34000 N 5-Aug-09 41450 44000 17-Nov-09 47800 52000 15-Jun-10 46000 61000 O X 11-Aug-10 48200 62000
7350068000
6300058000
50000
34000
44000
52000
61000 62000
15-Jun-10
O
NOR
20500
30500
40500
50500
60500
70500
8-Sep-07
8-Nov-07
8-Jan-
08
8-Mar-0
8
8-May-08
8-Jul-08
8-Sep-08
8-Nov-0
8
8-Jan-0
9
8-Mar-09
8-May-
09
8-Jul-09
8-Sep-09
8-Nov-09
8-Jan-10
8-Mar-10
8-May-
10
8-Jul-1
0
Closing Price Target Price Initiation/Assumption Rating
W
O=Outperform; N=Neutral; U=Underperform; R=Restricted; NR=Not Rated; NC=Not Covered

07 September 2010
Samsung Card (029780.KS / 029780 KS) 33
3-Year Price, Target Price and Rating Change History Chart for 096770.KS 096770.KS Closing
Price Target
Price
Initiation/ Date (W) (W) Rating Assumption 19-Oct-07 168000 205000 4-Feb-08 127000 160000 3-Sep-08 76700 100000 9-Apr-09 96000 90000 N 29-Sep-09 131500 165000 O 22-Apr-10 125000 181000
205000
160000
10000090000
165000181000
O
N
48650
68650
88650
108650
128650
148650
168650
188650
208650
8-Sep-07
8-Nov-07
8-Jan-
08
8-Mar-0
8
8-May-08
8-Jul-08
8-Sep-08
8-Nov-0
8
8-Jan-0
9
8-Mar-09
8-May-
09
8-Jul-09
8-Sep-09
8-Nov-09
8-Jan-10
8-Mar-10
8-May-
10
8-Jul-1
0
Closing Price Target Price Initiation/Assumption Rating
W
O=Outperform; N=Neutral; U=Underperform; R=Restricted; NR=Not Rated; NC=Not Covered
3-Year Price, Target Price and Rating Change History Chart for 017670.KS 017670.KS Closing
Price Target
Price
Initiation/ Date (W) (W) Rating Assumption 1-Feb-08 208000 230000 N 29-Jul-08 189500 O 16-Mar-09 186000 R 30-Mar-09 194500 O 7-Jun-10 165000 183000 N
230000
183000
N
ORO
N
158500
178500
198500
218500
238500
258500
8-Sep-07
8-Nov-07
8-Jan-
08
8-Mar-0
8
8-May-08
8-Jul-08
8-Sep-08
8-Nov-0
8
8-Jan-0
9
8-Mar-09
8-May-
09
8-Jul-09
8-Sep-09
8-Nov-09
8-Jan-10
8-Mar-10
8-May-
10
8-Jul-1
0
Closing Price Target Price Initiation/Assumption Rating
W
O=Outperform; N=Neutral; U=Underperform; R=Restricted; NR=Not Rated; NC=Not Covered
3-Year Price, Target Price and Rating Change History Chart for 053000.KS 053000.KS Closing
Price Target
Price
Initiation/ Date (W) (W) Rating Assumption 14-Feb-08 17650 23000 11-Apr-08 19250 21000 N 29-Sep-08 11850 13000 U 20-Oct-08 10050 11200 12-Dec-08 6630 6000 8-May-09 11400 7800 18-Jun-09 10250 9000 18-Aug-09 13550 12000 19-Nov-09 16700 17000 N 8-Apr-10 16000 R X 9-Apr-10 16650 N 14-Apr-10 X 15-Jun-10 X 11-Aug-10 14150 16000
23000
21000
1300011200
60007800
9000
12000
1700016000
8-Apr-1014-Apr-1015-Jun-10
NRN
U
N
5050
7050
9050
11050
13050
15050
17050
19050
21050
8-Sep-07
8-Nov-07
8-Jan-
08
8-Mar-0
8
8-May-08
8-Jul-08
8-Sep-08
8-Nov-0
8
8-Jan-0
9
8-Mar-09
8-May-
09
8-Jul-09
8-Sep-09
8-Nov-09
8-Jan-10
8-Mar-10
8-May-
10
8-Jul-1
0
Closing Price Target Price Initiation/Assumption Rating
W
O=Outperform; N=Neutral; U=Underperform; R=Restricted; NR=Not Rated; NC=Not Covered
The analyst(s) responsible for preparing this research report received compensation that is based upon various factors including Credit Suisse's total revenues, a portion of which are generated by Credit Suisse's investment banking activities. Analysts� stock ratings are defined as follows: Outperform (O): The stock�s total return is expected to outperform the relevant benchmark* by at least 10-15% (or more, depending on perceived risk) over the next 12 months. Neutral (N): The stock�s total return is expected to be in line with the relevant benchmark* (range of ±10-15%) over the next 12 months. Underperform (U): The stock�s total return is expected to underperform the relevant benchmark* by 10-15% or more over the next 12 months. *Relevant benchmark by region: As of 29th May 2009, Australia, New Zealand, U.S. and Canadian ratings are based on (1) a stock�s absolute total return potential to its current share price and (2) the relative attractiveness of a stock�s total return potential within an analyst�s coverage universe**, with Outperforms representing the most attractive, Neutrals the less attractive, and Underperforms the least attractive investment opportunities.

07 September 2010
Samsung Card (029780.KS / 029780 KS) 34
Some U.S. and Canadian ratings may fall outside the absolute total return ranges defined above, depending on market conditions and industry factors. For Latin American, Japanese, and non-Japan Asia stocks, ratings are based on a stock�s total return relative to the average total return of the relevant country or regional benchmark; for European stocks, ratings are based on a stock�s total return relative to the analyst's coverage universe**. For Australian and New Zealand stocks a 22% and a 12% threshold replace the 10-15% level in the Outperform and Underperform stock rating definitions, respectively, subject to analysts� perceived risk. The 22% and 12% thresholds replace the +10-15% and -10-15% levels in the Neutral stock rating definition, respectively, subject to analysts� perceived risk. **An analyst's coverage universe consists of all companies covered by the analyst within the relevant sector. Restricted (R): In certain circumstances, Credit Suisse policy and/or applicable law and regulations preclude certain types of communications, including an investment recommendation, during the course of Credit Suisse's engagement in an investment banking transaction and in certain other circumstances. Volatility Indicator [V]: A stock is defined as volatile if the stock price has moved up or down by 20% or more in a month in at least 8 of the past 24 months or the analyst expects significant volatility going forward.
Analysts� coverage universe weightings are distinct from analysts� stock ratings and are based on the expected performance of an analyst�s coverage universe* versus the relevant broad market benchmark**: Overweight: Industry expected to outperform the relevant broad market benchmark over the next 12 months. Market Weight: Industry expected to perform in-line with the relevant broad market benchmark over the next 12 months. Underweight: Industry expected to underperform the relevant broad market benchmark over the next 12 months. *An analyst�s coverage universe consists of all companies covered by the analyst within the relevant sector. **The broad market benchmark is based on the expected return of the local market index (e.g., the S&P 500 in the U.S.) over the next 12 months. Credit Suisse�s distribution of stock ratings (and banking clients) is:
Global Ratings Distribution Outperform/Buy* 46% (61% banking clients) Neutral/Hold* 40% (60% banking clients) Underperform/Sell* 12% (52% banking clients) Restricted 2%
*For purposes of the NYSE and NASD ratings distribution disclosure requirements, our stock ratings of Outperform, Neutral, and Underperform most closely correspond to Buy, Hold, and Sell, respectively; however, the meanings are not the same, as our stock ratings are determined on a relative basis. (Please refer to definitions above.) An investor's decision to buy or sell a security should be based on investment objectives, current holdings, and other individual factors.
Credit Suisse�s policy is to update research reports as it deems appropriate, based on developments with the subject company, the sector or the market that may have a material impact on the research views or opinions stated herein. Credit Suisse's policy is only to publish investment research that is impartial, independent, clear, fair and not misleading. For more detail please refer to Credit Suisse's Policies for Managing Conflicts of Interest in connection with Investment Research: http://www.csfb.com/research-and-analytics/disclaimer/managing_conflicts_disclaimer.html Credit Suisse does not provide any tax advice. Any statement herein regarding any US federal tax is not intended or written to be used, and cannot be used, by any taxpayer for the purposes of avoiding any penalties. See the Companies Mentioned section for full company names. Price Target: (12 months) for (005280.KS) Method: Our target price of W14,500 for Busan Bank is based on 1.1x 2010E book value. We believe that the valuation upside of regional banks should be capped at the average multiple of nationwide banks for the time being, due to the characteristic of lagging regional economy. Risks: Risks to our target price for Busan Bank of W14,500 include 1) the possibility that asset quality deterioration may spill over to household loans and SME loans and 2) changes to profitability and leverage ratio from potential consolidations, and 3) unexpected regulation change. Price Target: (12 months) for (001300.KS) Method: We have set our target price of 91,000 based on 2011E Sum of the parts analysis using 5x EV/EBITDA on the fashion, chemical business and 10x EV/EBITDA on IT materials segment. Risks: Risks to our W91,000 target price for Cheil Industries include: 1) slower than expected execution in the IT materials business, 2) spike in feedstock (oil) price that could result in margin squeeze for chemical business. Price Target: (12 months) for (030000.KS) Method: Our W15,000 target price for Cheil Worldwide is based on forward P/E of 17x (based on average of the historical high and medium valuations), and the trading valuation we've applied before. Risks: Risks to our W15,000 target price for Cheil Worldwide include 1) sluggish economy recovery; 2) lower than expected overseas billing growth; 3) potential opportunities in foreign ad agencies/media palyers as to grow as a global operator. Price Target: (12 months) for (005270.KS) Method: Our target price of W17,000 for Daegu Bank is based on 1.1x 2010E book value. We believe that the valuation upside of regional banks should be capped at the average multiple of nationwide banks for the time being, due to the characteristic of lagging regional economy. Risks: Risks to our target price for Daegu Bank of W17,000 include 1) the possibility that asset quality deterioration may spill over to household loans and SME loans and 2) changes to profitability and leverage ratio from potential consolidations, and 3) unexpected regulation change. Price Target: (12 months) for (086790.KS) Method: Our target price of W44,000 for Hana Financial Group is based on 0.9x 2010E book value (based on the dividend discount model).

07 September 2010
Samsung Card (029780.KS / 029780 KS) 35
Risks: Risks to our target price for Hana Financial Group of W44,000 include 1) the possibility that asset quality deterioration may spill over to household loans and SME loans and 2) changes to profitability and leverage ratio from potential consolidations, and 3) unexpected regulation change. Price Target: (12 months) for (024110.KS) Method: Our target price of W20,000 for Industrial Bank of Korea is based on 1.3x target P/BV multiple, based on 13.5% ROE and 11.3% cost of euqity (based on the dividend discount model). Risks: Risks to our target price for IBK of W20,000 include 1) the possibility that asset quality deterioration may spill over to household loans and SME loans, 2) SG&A cost rebound from the low base, and 3) unexpected regulation change which might have adverse effect on the government owned bank. Price Target: (12 months) for (105560.KS) Method: Our target price of W62,000 for KB Financial Group is based on 1.1x 2010E book value (based on the dividend discount model). Risks: Risks to our target price for KB Financial Group of W62,000 include 1) the possibility that asset quality deterioration may spill over to household loans and SME loans, 2) changes to profitability and leverage ratio from potential consolidations, and 3) unexpected regulation change. Price Target: (12 months) for (012750.KS) Method: Our target price of KRW60,000 for S1 Corporation is based on 8x adjusted 2011E enterprise value/earnings before interest, tax, depreciation and amortisation, reflecting increased equity risk premium. Risks: The risks to our W60,000 target price on S1 Corp include that we expect further OP margin expansion from 18.9% in 2008 to 19.6% in 2010E on the back of economy of scale. Another potential risk would be a slowdown in the economy, which may also depress the growth of the company. If Korea's economy were to slow down at worse-than-expected, it would probably result in a reduction in the number of start-ups by new small to medium-sized enterprises (SME), and also in household consumption. While S1's commercial and residential subscriber growth is affected by both of these factors, a general slowdown in the economy is also a potential risk for S1. Price Target: (12 months) for (000830.KS) Method: We use an enterprise value-to-earnings before interest, taxes, depreciation, and amortisation (EV/EBITDA) multiple of 8.5x (2010E) and 20% discount on non-core investment holdings to generate our target price of W62,000 for Samsung C&T Corp. Risks: Risks to our target price for Samsung C&T Corp. of W62,000 include: 1) regulation changes in the construction sector and housing market trends, as the government plans to disclose the cost of land assets when it provides the land for apartment construction. This is confirmation of the announced government measures after the recent court ruling, which obligates the disclosure of land cost in the public sector. In addition, we believe that the company has to prove its turnaround in operating profitability in order to reduce the holding company discount, given its poor track record. Price Target: (12 months) for (029780.KS) Method: Our target price of W71,000 for Samsung Card (029780.KS) reflects the holding company value of its Everland stake. Our TP comprises: 1) the value of the credit card business (W45,000), 2) the value of investment assets (W11,000), and 3) the value of the Everland stake as a de-facto holding company (W15,000). Key risks include: 1) a possible funding cost increase driven by a interest rate hike and 2) an SG&A cost increase amid competition. Risks: Risks to our investment view and target price of W71,000 for Samsung Card (029780.KS) include 1) a possible funding cost increase driven by a interest rate hike and 2) an SG&A cost increase amid competition Price Target: (12 months) for (009150.KS) Method: Our 12-month target price for Samsung Electro-Mechanics of W141,500 per share is based on its historical peak P/B (price to book value) of 4.0x to average book value per share of FY10. Risks: Potential risks in reachnig our target price for Samsung Electro-Mechanics of W141,500 per share may stem from: 1) any unforeseen supply growth in its key products (e.g., multi-layer cermanic capacitor), 2) any delay in the planned execution of the company's cost reduction measures, and 3) any unforeseen changes in end demand for its key prodcuts (e.g., flip chip-ball grid array). Price Target: (12 months) for (005930.KS) Method: Our 12-month target price of W940,000 for Samsung Electronics is derived from using the average value per share which is calculated by applying the historical mid cycle 1.8x price-to-book to average FY10 and FY11 book value per share estimates. Risks: Potential risks to our 12-month target price of W940,000 for Samsung Electronics are: slowing consumption in developed countries, due to macro concerns and rising interest rates, as well as won appreciation. Rising competition from new entrants in the company's key business area, NAND flash, could increase pricing competition, and market dominance may also have a negative impact on our earnings estimates. Price Target: (12 months) for (028050.KS) Method: Our target price of W150,000 on Samsung Engineering is based on 9x 2011E enterprise value/earnings before interest, tax, depreciation and amortisation (EV/EBITDA). We believe that Samsung Engineering should trade at premium compared with the average target multiple of domestic E&C peers, given their zero exposure in difficult domestic housing market. Risks: The risks of our target price of W150,000 for Samsung Engineering include 1) further decrease in oil price and 2) continuous increase in construction material and labor costs, which would weaken the profitabilities in overseas projects. Increasing concern on global macro economy would also slow down the growth in their new order flow. Price Target: (12 months) for (000810.KS) Method: Our 12 month target price of 245,000 is based on the simple average 1.3x FY11 price/enterprise value (P/EV) and 15x FY11 P/E. At W245,000, the stock imples a FY11 P/B of 1.9x and FY11 P/E of 15.9x, which does not look stretched by historical standards particulary in light of the company's improved earnings outlook and rising interest rate outlook. Risks: The following risks could impede achievement of our W245,000 target price for Samsung F&M: 1) Relatively low investment yields and no active capital management. 2) Growing competition from new emerging channels. Price Target: (12 months) for (010140.KS)

07 September 2010
Samsung Card (029780.KS / 029780 KS) 36
Method: Our target price of W22,000 for Samsung Heavy Industries is based on 2010-11E price to book (P/B) multiple of 2.0x, which is resulted from the average multiple suggested by current year return on equity (ROE) vs. P/B analysis (implied upside) and long term residual income analysis (implied downside). Risks: Risks to our W22,000 target price for Samsung Heavy include the following: Worse than expected global order flow that can negatively impact the company's orderbook strength and stronger than expected input cost prices. Price Target: (12 months) for (032830.KS) Method: Our 12 month target price of 118,000 is based on the simple average 1.3x FY11 price/enterprise value (P/EV) and 2.0x FY11 P/B. At W118,000, the stock imples a FY11 P/B of 2.0x and FY11 P/E of 14.2x. Risks: The following risks could impede achievement of our W118,000 target price for Samsung F&M: 1) Protracted low interest rate environment, 2) a potential negative turn in IT cycle, and 3) potential selling pressure from Shinsegae and CJ group. Price Target: (12 months) for (006400.KS) Method: Our 12-month target price of W130,000 for Samsung SDI is based on 1) its core operation valued at its historical mid-to-trough P/B of 0.93x given lack of ROE profile (W99,300); 2) its equity holdings value in affiliate companies (W23,000); and 3) PV of its hybrid JV (W9,500) Risks: Potential risks in reaching our target price of W130,000 for Samsung SDI per share may stem from: 1) any delay in the planned execution of the company's cost reduction measures (especially in PDP module production), 2) any unforeseen supply and demand balance of the display devices, and 3) any unforeseen changes in competitive landscape in overall display devices (e.g., CRT, TFT-LCD and PDP). Price Target: (12 months) for (016360.KS) Method: We have set our 12-month forward target price for Samsung Securities of W47,000, based on 1.2x FY10E book value per share, equating to 14.2x FY10E earnings per share. Risks: Potential risks to our target price for Samsung Securities of W47,000 are: 1) lower-than-expected equity trading value; 2) growing competition in brokerage services, and 3) low chance to enjoy visible revenue growth from asset management in the near term. Price Target: (12 months) for (055550.KS) Method: Our target price of W62,000 for Shinhan Financial Group is based on 1.6x 2010E book value (based on the dividend discount model) with 14% ROE and 10.1% cost of equity. Risks: Risks to our target price for Shinhan Financial Group of W62,000 include 1) the possibility that asset quality deterioration may spill over to household loans and SME loans and 2) changes to profitability and leverage ratio from potential consolidations, and 3) unexpected regulation change. Price Target: (12 months) for (096770.KS) Method: We target price of W181,000 is equivalent to 1.7x price to book with 15% return on equity. It includes W16,000 per share value for the assets in Brazil. Risks: Risks for to our target price for SK Energy of W181,000 are: 1) The accelerated or delayed supply from the Middle East, India or China, 2) slowdown in global economy. Price Target: (12 months) for (017670.KS) Method: Our W183,000 target price for SK Telecom is based on 2011E PE target multiple of 9.5x, 25% discount to NJA telecom average. At W183,000, SK Telecom would trade at 10.3 times our 2010 earnings per share estimate, or at an enterprise value to earnings before interest, taxes, depreciation and amortization multiple of 4.2. Risks: The following risks could impede achievement of our W183,000 target price for SK Telecom: 1) higher than expected marketing cost although we have built-in aggressive assumptions, 2) aggressive pricing cut by the government 3) Slower-than-expected wireless data growth Price Target: (12 months) for (053000.KS) Method: Our target price of W16,000 for Woori Finance Holdings is based on 0.9x 2010E book value (based on the dividend discount model) with 9% ROE for 2010E and 13% for 2011E. Risks: Risks to our target price for Woori Finance Holdings of W16,000 include 1) the possibility that asset quality deterioration may spill over to household loans and SME loans and 2) changes to profitability and leverage ratio from potential consolidations, and 3) unexpected regulation change. Please refer to the firm's disclosure website at www.credit-suisse.com/researchdisclosures for the definitions of abbreviations typically used in the target price method and risk sections.
See the Companies Mentioned section for full company names. The subject company (005280.KS, 005270.KS, 086790.KS, 024110.KS, 105560.KS, 012750.KS, 000830.KS, 029780.KS, 009150.KS, 005930.KS, 028050.KS, 000810.KS, 010140.KS, 032830.KS, 006400.KS, 016360.KS, 055550.KS, 096770.KS, 017670.KS, 053000.KS) currently is, or was during the 12-month period preceding the date of distribution of this report, a client of Credit Suisse. Credit Suisse provided investment banking services to the subject company (086790.KS, 024110.KS, 105560.KS, 012750.KS, 000830.KS, 029780.KS, 009150.KS, 005930.KS, 028050.KS, 000810.KS, 010140.KS, 032830.KS, 006400.KS, 016360.KS, 055550.KS, 096770.KS, 017670.KS, 053000.KS) within the past 12 months. Credit Suisse provided non-investment banking services, which may include Sales and Trading services, to the subject company (005280.KS, 005270.KS, 086790.KS, 024110.KS, 105560.KS, 000830.KS, 000810.KS, 016360.KS, 055550.KS, 053000.KS) within the past 12 months. Credit Suisse has managed or co-managed a public offering of securities for the subject company (024110.KS, 053000.KS) within the past 12 months. Credit Suisse has received investment banking related compensation from the subject company (086790.KS, 024110.KS, 105560.KS, 055550.KS, 096770.KS, 017670.KS, 053000.KS) within the past 12 months.

07 September 2010
Samsung Card (029780.KS / 029780 KS) 37
Credit Suisse expects to receive or intends to seek investment banking related compensation from the subject company (001300.KS, 086790.KS, 024110.KS, 105560.KS, 012750.KS, 000830.KS, 029780.KS, 009150.KS, 005930.KS, 028050.KS, 000810.KS, 010140.KS, 032830.KS, 006400.KS, 016360.KS, 055550.KS, 096770.KS, 017670.KS, 053000.KS) within the next 3 months. Credit Suisse has received compensation for products and services other than investment banking services from the subject company (005280.KS, 005270.KS, 086790.KS, 024110.KS, 105560.KS, 000830.KS, 000810.KS, 016360.KS, 055550.KS, 053000.KS) within the past 12 months. As of the end of the preceding month, Credit Suisse beneficially owned 1% or more of a class of common equity securities of (016360.KS). This holding is calculated according to U.S. regulatory requirements which are based on Section 13(d) of the Securities and Exchange Act of 1934. Important Regional Disclosures Singapore recipients should contact a Singapore financial adviser for any matters arising from this research report. The analyst(s) involved in the preparation of this report have not visited the material operations of the subject company (005280.KS, 001300.KS, 030000.KS, 005270.KS, 086790.KS, 024110.KS, 105560.KS, 012750.KS, 000830.KS, 029780.KS, 009150.KS, 005930.KS, 028050.KS, 000810.KS, 010140.KS, 032830.KS, 006400.KS, 016360.KS, 055550.KS, 096770.KS, 017670.KS, 053000.KS) within the past 12 months. Restrictions on certain Canadian securities are indicated by the following abbreviations: NVS--Non-Voting shares; RVS--Restricted Voting Shares; SVS--Subordinate Voting Shares. Individuals receiving this report from a Canadian investment dealer that is not affiliated with Credit Suisse should be advised that this report may not contain regulatory disclosures the non-affiliated Canadian investment dealer would be required to make if this were its own report. For Credit Suisse Securities (Canada), Inc.'s policies and procedures regarding the dissemination of equity research, please visit http://www.csfb.com/legal_terms/canada_research_policy.shtml. As of the date of this report, Credit Suisse acts as a market maker or liquidity provider in the equities securities that are the subject of this report. Principal is not guaranteed in the case of equities because equity prices are variable. Commission is the commission rate or the amount agreed with a customer when setting up an account or at anytime after that. To the extent this is a report authored in whole or in part by a non-U.S. analyst and is made available in the U.S., the following are important disclosures regarding any non-U.S. analyst contributors: The non-U.S. research analysts listed below (if any) are not registered/qualified as research analysts with FINRA. The non-U.S. research analysts listed below may not be associated persons of CSSU and therefore may not be subject to the NASD Rule 2711 and NYSE Rule 472 restrictions on communications with a subject company, public appearances and trading securities held by a research analyst account. � Sokmo Yun, non-U.S. analyst, is a research analyst employed by Credit Suisse Securities (Europe) Limited, Seoul Branch. � Soyeon Hong, non-U.S. analyst, is a research analyst employed by Credit Suisse Securities (Europe) Limited, Seoul Branch. � Seok Yun, CFA, CA, non-U.S. analyst, is a research analyst employed by Credit Suisse Securities (Europe) Limited, Seoul Branch. For Credit Suisse disclosure information on other companies mentioned in this report, please visit the website at www.credit-suisse.com/researchdisclosures or call +1 (877) 291-2683. Disclaimers continue on next page.

07 September 2010Asia Pacific/South Korea
Equity Research
BK1142-new.doc
This report is not directed to, or intended for distribution to or use by, any person or entity who is a citizen or resident of or located in any locality, state, country or other jurisdiction where such distribution, publication, availability or use would be contrary to law or regulation or which would subject Credit Suisse AG, the Swiss bank, or its subsidiaries or its affiliates (�CS�) to any registration or licensing requirement within such jurisdiction. All material presented in this report, unless specifically indicated otherwise, is under copyright to CS. None of the material, nor its content, nor any copy of it, may be altered in any way, transmitted to, copied or distributed to any other party, without the prior express written permission of CS. All trademarks, service marks and logos used in this report are trademarks or service marks or registered trademarks or service marks of CS or its affiliates. The information, tools and material presented in this report are provided to you for information purposes only and are not to be used or considered as an offer or the solicitation of an offer to sell or to buy or subscribe for securities or other financial instruments. CS may not have taken any steps to ensure that the securities referred to in this report are suitable for any particular investor. CS will not treat recipients as its customers by virtue of their receiving the report. The investments or services contained or referred to in this report may not be suitable for you and it is recommended that you consult an independent investment advisor if you are in doubt about such investments or investment services. Nothing in this report constitutes investment, legal, accounting or tax advice or a representation that any investment or strategy is suitable or appropriate to your individual circumstances or otherwise constitutes a personal recommendation to you. CS does not offer advice on the tax consequences of investment and you are advised to contact an independent tax adviser. Please note in particular that the bases and levels of taxation may change. CS believes the information and opinions in the Disclosure Appendix of this report are accurate and complete. Information and opinions presented in the other sections of the report were obtained or derived from sources CS believes are reliable, but CS makes no representations as to their accuracy or completeness. Additional information is available upon request. CS accepts no liability for loss arising from the use of the material presented in this report, except that this exclusion of liability does not apply to the extent that liability arises under specific statutes or regulations applicable to CS. This report is not to be relied upon in substitution for the exercise of independent judgment. CS may have issued, and may in the future issue, a trading call regarding this security. Trading calls are short term trading opportunities based on market events and catalysts, while stock ratings reflect investment recommendations based on expected total return over a 12-month period as defined in the disclosure section. Because trading calls and stock ratings reflect different assumptions and analytical methods, trading calls may differ directionally from the stock rating. In addition, CS may have issued, and may in the future issue, other reports that are inconsistent with, and reach different conclusions from, the information presented in this report. Those reports reflect the different assumptions, views and analytical methods of the analysts who prepared them and CS is under no obligation to ensure that such other reports are brought to the attention of any recipient of this report. CS is involved in many businesses that relate to companies mentioned in this report. These businesses include specialized trading, risk arbitrage, market making, and other proprietary trading. Past performance should not be taken as an indication or guarantee of future performance, and no representation or warranty, express or implied, is made regarding future performance. Information, opinions and estimates contained in this report reflect a judgement at its original date of publication by CS and are subject to change without notice. The price, value of and income from any of the securities or financial instruments mentioned in this report can fall as well as rise. The value of securities and financial instruments is subject to exchange rate fluctuation that may have a positive or adverse effect on the price or income of such securities or financial instruments. Investors in securities such as ADR�s, the values of which are influenced by currency volatility, effectively assume this risk. Structured securities are complex instruments, typically involve a high degree of risk and are intended for sale only to sophisticated investors who are capable of understanding and assuming the risks involved. The market value of any structured security may be affected by changes in economic, financial and political factors (including, but not limited to, spot and forward interest and exchange rates), time to maturity, market conditions and volatility, and the credit quality of any issuer or reference issuer. Any investor interested in purchasing a structured product should conduct their own investigation and analysis of the product and consult with their own professional advisers as to the risks involved in making such a purchase. Some investments discussed in this report have a high level of volatility. High volatility investments may experience sudden and large falls in their value causing losses when that investment is realised. Those losses may equal your original investment. Indeed, in the case of some investments the potential losses may exceed the amount of initial investment, in such circumstances you may be required to pay more money to support those losses. Income yields from investments may fluctuate and, in consequence, initial capital paid to make the investment may be used as part of that income yield. Some investments may not be readily realisable and it may be difficult to sell or realise those investments, similarly it may prove difficult for you to obtain reliable information about the value, or risks, to which such an investment is exposed. This report may provide the addresses of, or contain hyperlinks to, websites. Except to the extent to which the report refers to website material of CS, CS has not reviewed the linked site and takes no responsibility for the content contained therein. Such address or hyperlink (including addresses or hyperlinks to CS�s own website material) is provided solely for your convenience and information and the content of the linked site does not in any way form part of this document. Accessing such website or following such link through this report or CS�s website shall be at your own risk. This report is issued and distributed in Europe (except Switzerland) by Credit Suisse Securities (Europe) Limited, One Cabot Square, London E14 4QJ, England, which is regulated in the United Kingdom by The Financial Services Authority (�FSA�). This report is being distributed in Germany by Credit Suisse Securities (Europe) Limited Niederlassung Frankfurt am Main regulated by the Bundesanstalt fuer Finanzdienstleistungsaufsicht ("BaFin"). This report is being distributed in the United States by Credit Suisse Securities (USA) LLC ; in Switzerland by Credit Suisse AG; in Canada by Credit Suisse Securities (Canada), Inc..; in Brazil by Banco de Investimentos Credit Suisse (Brasil) S.A.; in Mexico by Banco Credit Suisse (México), S.A. (transactions related to the securities mentioned in this report will only be effected in compliance with applicable regulation); in Japan by Credit Suisse Securities (Japan) Limited, Financial Instrument Firm, Director-General of Kanto Local Finance Bureau (Kinsho) No. 66, a member of Japan Securities Dealers Association, The Financial Futures Association of Japan, Japan Securities Investment Advisers Association; elsewhere in Asia/Pacific by whichever of the following is the appropriately authorised entity in the relevant jurisdiction: Credit Suisse (Hong Kong) Limited, Credit Suisse Equities (Australia) Limited , Credit Suisse Securities (Thailand) Limited, Credit Suisse Securities (Malaysia) Sdn Bhd, Credit Suisse AG, Singapore Branch, Credit Suisse Securities (India) Private Limited, Credit Suisse Securities (Europe) Limited, Seoul Branch, Credit Suisse AG, Taipei Securities Branch, PT Credit Suisse Securities Indonesia, and elsewhere in the world by the relevant authorised affiliate of the above. Research on Taiwanese securities produced by Credit Suisse AG, Taipei Securities Branch has been prepared by a registered Senior Business Person. Research provided to residents of Malaysia is authorised by the Head of Research for Credit Suisse Securities (Malaysia) Sdn. Bhd., to whom they should direct any queries on +603 2723 2020. In jurisdictions where CS is not already registered or licensed to trade in securities, transactions will only be effected in accordance with applicable securities legislation, which will vary from jurisdiction to jurisdiction and may require that the trade be made in accordance with applicable exemptions from registration or licensing requirements. Non-U.S. customers wishing to effect a transaction should contact a CS entity in their local jurisdiction unless governing law permits otherwise. U.S. customers wishing to effect a transaction should do so only by contacting a representative at Credit Suisse Securities (USA) LLC in the U.S. Please note that this report was originally prepared and issued by CS for distribution to their market professional and institutional investor customers. Recipients who are not market professional or institutional investor customers of CS should seek the advice of their independent financial advisor prior to taking any investment decision based on this report or for any necessary explanation of its contents. This research may relate to investments or services of a person outside of the UK or to other matters which are not regulated by the FSA or in respect of which the protections of the FSA for private customers and/or the UK compensation scheme may not be available, and further details as to where this may be the case are available upon request in respect of this report. Any Nielsen Media Research material contained in this report represents Nielsen Media Research's estimates and does not represent facts. NMR has neither reviewed nor approved this report and/or any of the statements made herein. If this report is being distributed by a financial institution other than Credit Suisse AG, or its affiliates, that financial institution is solely responsible for distribution. Clients of that institution should contact that institution to effect a transaction in the securities mentioned in this report or require further information. This report does not constitute investment advice by Credit Suisse to the clients of the distributing financial institution, and neither Credit Suisse AG, its affiliates, and their respective officers, directors and employees accept any liability whatsoever for any direct or consequential loss arising from their use of this report or its content. Copyright 2010 CREDIT SUISSE AG and/or its affiliates. All rights reserved.
CREDIT SUISSE (Hong Kong) Limited Asia/Pacific: +852 2101-6000