Same Problems Better Decisions - Portland State University May 2016... · Same Problems – Better...
37
page 1 Same Problems – Better Decisions Hans Nordby I CoStar Portfolio Strategy
Transcript of Same Problems Better Decisions - Portland State University May 2016... · Same Problems – Better...

page 1
Same Problems – Better Decisions Hans Nordby I CoStar Portfolio Strategy

page 2
• Old Big Data
• New Big Data
– Apartments
– Office
– Retail
– Industrial
Agenda

page 3
Big Data: It’s Here and In Use
Today – This Is Not 1999

page 4
Cap Rates, After Jackson Pollack
Institutional Grade Transaction Cap Rates
Portland
Source: CoStar Portfolio Strategy. Cap rates are shaded by distance from trailing average to identify trend.
Includes 2+ star-rated apartment assets selling for at least $5 million. As of May 2016
2%
3%
4%
5%
6%
7%
8%
9%
10%
11%
12%
00 01 02 03 04 05 06 07 08 09 10 11 12 13 14 15 16
Transaction Cap Rate
Apartment Transaction Cap Rate

page 5
Cap Rates, After Jackson Pollack
Institutional Grade Transaction Cap Rates
Portland
Source: CoStar Portfolio Strategy. Cap rates are shaded by distance from trailing average to identify trend.
Includes 2+ star-rated apartment assets selling for at least $5 million. As of May 2016
2%
3%
4%
5%
6%
7%
8%
9%
10%
11%
12%
00 01 02 03 04 05 06 07 08 09 10 11 12 13 14 15 16
Transaction Cap Rate Portland
Apartment Transaction Cap Rate

page 6
Cap Rates, After Jackson Pollack
Institutional Grade Transaction Cap Rates
Seattle
Source: CoStar Portfolio Strategy. Cap rates are shaded by distance from trailing average to identify trend.
Includes 2+ star-rated apartment assets selling for at least $5 million. As of May 2016
2%
3%
4%
5%
6%
7%
8%
9%
10%
11%
12%
00 01 02 03 04 05 06 07 08 09 10 11 12 13 14 15 16
Transaction Cap Rate Seattle
Apartment Transaction Cap Rate

page 7
Actionable Data

page 8
Retail

page 9
The Sum Of Many Sources
Buying Power Flows Into Shopping Center

page 10
Resident-Only Models Produce Uneven Results
Components Of Adjusted Buying Power
Sources: CoStar Portfolio Strategy; Census Bureau; Neustar As of 15Q4
$0
$500
$1,000
$1,500
$2,000
$2,500
World TradeCenter
San FranciscoCentre
RoyalHawaiian
Lenox Square The ForumShops AtCaesars
Mall ofAmerica
Residential
Adjusted Buying Power (Millions)

page 11
Accounting For Tourist Spending
Components Of Adjusted Buying Power
Sources: CoStar Portfolio Strategy; Census Bureau; Neustar As of 15Q4
$0
$500
$1,000
$1,500
$2,000
$2,500
World TradeCenter
San FranciscoCentre
RoyalHawaiian
Lenox Square The ForumShops AtCaesars
Mall ofAmerica
Residential Hotel
Adjusted Buying Power (Millions)

page 12
Daytime Population Contribution
Components Of Adjusted Buying Power
Sources: CoStar Portfolio Strategy; Census Bureau; Neustar As of 15Q4
$0
$500
$1,000
$1,500
$2,000
$2,500
World TradeCenter
San FranciscoCentre
RoyalHawaiian
Lenox Square The ForumShops AtCaesars
Mall ofAmerica
Residential Hotel Office
Adjusted Buying Power (Millions)

page 13
The Market Is Priced Efficiently
Adjusted Buying Power & Cap Rates
Source: CoStar Portfolio Strategy As of 15Q4
4.5%
5.0%
5.5%
6.0%
6.5%
7.0%
7.5%
8.0%
8.5%
0 100 200 400 600 800 1,000 1,500
Average Cap Rate (2014-15)
Adjusted Buying Power ($, M)

page 14
Better Retail Is More Highly Occupied
Adjusted Buying Power & Occupancy Rates
100,000,000 200,000,000 300,000,000 400,000,000 500,000,000 600,000,000 700,000,000 800,000,000 900,000,000
1,000,000,000 1,100,000,000 1,300,000,000 1,500,000,000
5,000,000,000
Source: CoStar Portfolio Strategy As of 15Q4
91%
92%
93%
94%
95%
96%
97%
98%
0 200 400 600 800 1,000 1,200 1,400 1,600
Adjusted Buying Power ($, M)
Occupancy Rate
page 15
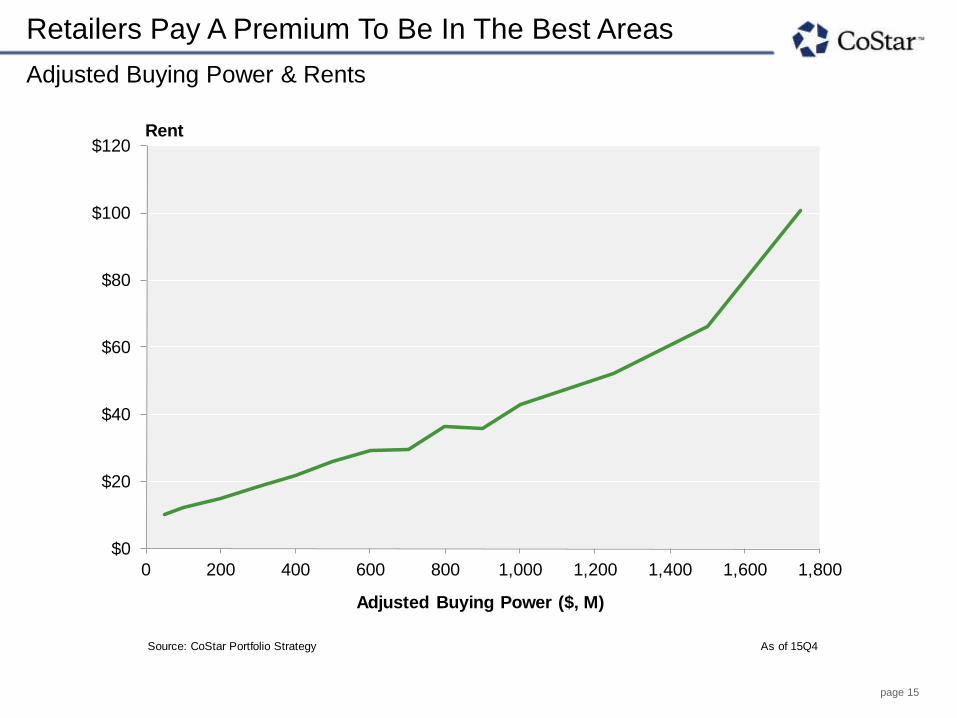
Retailers Pay A Premium To Be In The Best Areas
Adjusted Buying Power & Rents
050
100200300400500600700800900
1000125015001750
2,000,000,000
Source: CoStar Portfolio Strategy As of 15Q4
$0
$20
$40
$60
$80
$100
$120
0 200 400 600 800 1,000 1,200 1,400 1,600 1,800
Rent
Adjusted Buying Power ($, M)

page 16
Sources: Neustar; CoStar Portfolio Strategy As of 15Q1
0
50
100
150
200
250
300
350
400
0.0 0.5 1.0 1.5 2.0 2.5 3.0 3.5 4.0
JCPenney Sears Barnes Noble
Number of Stores
3-Mile Buying Power ($B)
Tenant Risk
Tenant Store Count by Local Trade Area Demographics

page 17
Search New Stores Since 2013 In the CoStar Product and derive buying power
1,459,629,228
Sources: Neustar; CoStar Portfolio Strategy As of 15Q3
0
20
40
60
80
100
120
0.0 0.5 1.0 1.5 2.0 2.5 3.0 3.5 4.0
Apple Nordstrom Rack H&M
Number of Stores
3-Mile Buying Power ($B)
H&M Median New Store 3-Mi. Buying Power:
Nordstrom Rack New Store3-Mi. Buying Power:
Apple New Store 3-Mi. Buying Power:
Tenant Risk
Tenant Store Count by Local Trade Area Demographics
page 18
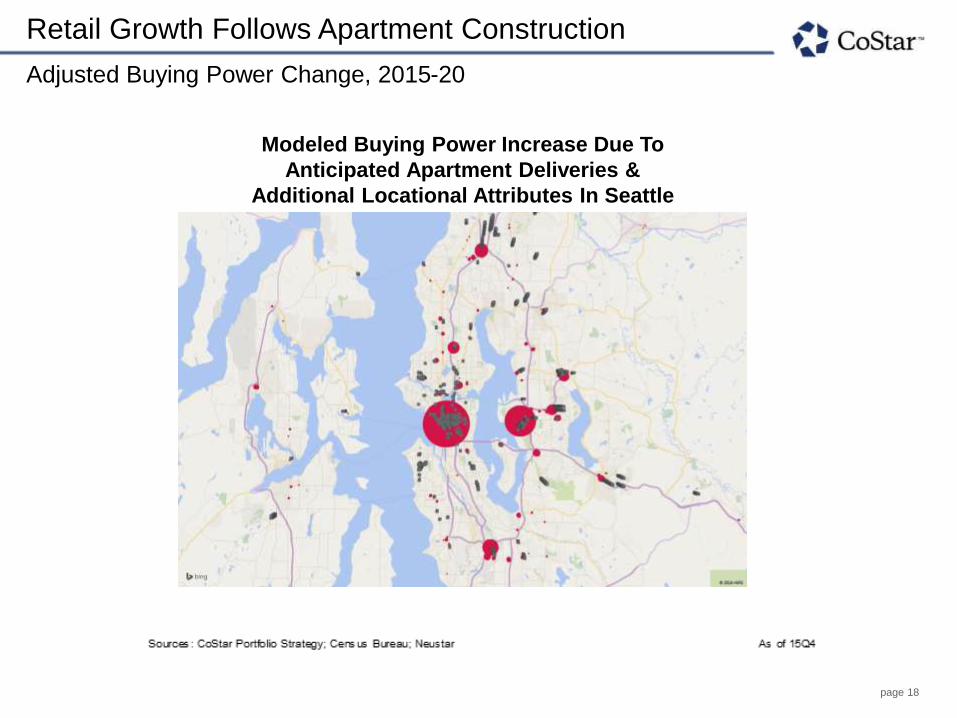
Retail Growth Follows Apartment Construction
Adjusted Buying Power Change, 2015-20
Modeled Buying Power Increase Due To
Anticipated Apartment Deliveries &
Additional Locational Attributes In Seattle

page 19
Office

page 20
Key Driver Of Your Retirement / Airplane Purchase Plan
Effective Office Vacancy By Block Size
Group Name
Northeast of
Portland
Portland
CBD
South/East of
Portland
West Suburban
Portland
San Francisco
CBD
Houston
CBD
Group Vacancy 6.7% 9.0% 6.0% 8.6% 7.5% 13.0%
SF < 10,000 6.4% 7.4% 5.6% 9.2% 7.5% 9.7%
10,000 -20,000 8.7% 10.8% 6.7% 6.8% 7.2% 10.0%
20,000- 50,000 5.6% 9.5% 7.4% 8.6% 7.9% 14.3%
50,000- 100,000 0.0% 0.0% 0.0% 3.9% 7.4% 15.5%
SF >= 100,000 6.6% 0.0% 0.0% 0.0% 0.0% 16.9%
% Group
Inventory Under
Construction
2.7% 2.4% 0.5% 1.5% 3.7%
2.7%
SF < 10,000 526 574 486 810 1,333 930
10,000 -20,000 100 404 79 171 811 656
20,000- 50,000 63 417 105 260 944 1,168
50,000- 100,000 0 0 0 53 633 712
SF >= 100,000 125 0 0 0 0 428
Source: CoStar Portfolio Strategy
Effective
Vacancy Rate
Space Vacant
(SF 000s)

page 21
U.S. Apartment Market Review

page 22
Pockets Of Heavy Building
Growth In Inventory By Metro Through 2017Q4 (15Q4-17Q4)
Rank1
2
3
4
5
6
7
8
9
10
11
12
13
14
15
16
17
18
19
20
21
22
23
24
25
Source: CoStar Portfolio Strategy As of 15Q4
0
5,000
10,000
15,000
20,000
25,000
30,000
35,000
40,000
45,000
50,000
South East Midwest West
New Supply (As % of Inventory)New Supply (Units)

page 23
Pockets Of Heavy Building
Growth In Inventory By Metro Through 2017Q4 (15Q4-17Q4)
Rank1
2
3
4
5
6
7
8
9
10
11
12
13
14
15
16
17
18
19
20
21
22
23
24
25
Source: CoStar Portfolio Strategy As of 15Q4
0
5,000
10,000
15,000
20,000
25,000
30,000
35,000
40,000
45,000
50,000N
ew
York
South East Midwest West
New Supply (As % of Inventory)New Supply (Units)

page 24
Pockets Of Heavy Building
Growth In Inventory By Metro Through 2017Q4 (15Q4-17Q4)
Rank1
2
3
4
5
6
7
8
9
10
11
12
13
14
15
16
17
18
19
20
21
22
23
24
25
Source: CoStar Portfolio Strategy As of 15Q4
0%
2%
4%
6%
8%
10%
12%
0
5,000
10,000
15,000
20,000
25,000
30,000
35,000
40,000
45,000
50,000N
ew
York
Completions As A % Of InventorySouth East Midwest West
New Supply (As % of Inventory)New Supply (Units)

page 25
Pockets Of Heavy Building
Growth In Inventory By Metro Through 2017Q4 (15Q4-17Q4)
Rank1
2
3
4
5
6
7
8
9
10
11
12
13
14
15
16
17
18
19
20
21
22
23
24
25
Source: CoStar Portfolio Strategy As of 15Q4
0%
2%
4%
6%
8%
10%
12%
0
5,000
10,000
15,000
20,000
25,000
30,000
35,000
40,000
45,000
50,000N
ew
York
Na
shvill
e
Completions As A % Of InventorySouth East Midwest West
New Supply (As % of Inventory)New Supply (Units)

page 26
Pockets Of Heavy Building
Growth In Inventory By Metro Through 2017Q4 (15Q4-17Q4)
Rank1
2
3
4
5
6
7
8
9
10
11
12
13
14
15
16
17
18
19
20
21
22
23
24
25
Source: CoStar Portfolio Strategy As of 15Q4
0%
2%
4%
6%
8%
10%
12%
0
5,000
10,000
15,000
20,000
25,000
30,000
35,000
40,000
45,000
50,000N
ew
York
Na
shvill
e
Completions As A % Of InventorySouth East Midwest West
New Supply (As % of Inventory)New Supply (Units)

page 27
Pockets Of Heavy Building
Growth In Inventory By Metro Through 2017Q4 (15Q4-17Q4)
Rank1
2
3
4
5
6
7
8
9
10
11
12
13
14
15
16
17
18
19
20
21
22
23
24
25
Source: CoStar Portfolio Strategy As of 15Q4
0%
2%
4%
6%
8%
10%
12%
0
5,000
10,000
15,000
20,000
25,000
30,000
35,000
40,000
45,000
50,000N
ew
York
Los A
ngele
s
Na
shvill
e
Completions As A % Of InventorySouth East Midwest West
New Supply (As % of Inventory)New Supply (Units)

page 28
Pockets Of Heavy Building
Growth In Inventory By Metro Through 2017Q4 (15Q4-17Q4)
Rank1
2
3
4
5
6
7
8
9
10
11
12
13
14
15
16
17
18
19
20
21
22
23
24
25
Source: CoStar Portfolio Strategy As of 15Q4
0%
2%
4%
6%
8%
10%
12%
0
5,000
10,000
15,000
20,000
25,000
30,000
35,000
40,000
45,000
50,000N
ew
York
Los A
ngele
s
Na
shvill
e
Completions As A % Of InventorySouth East Midwest West
New Supply (As % of Inventory)New Supply (Units)

page 29
Where’s The Risk?
page 30
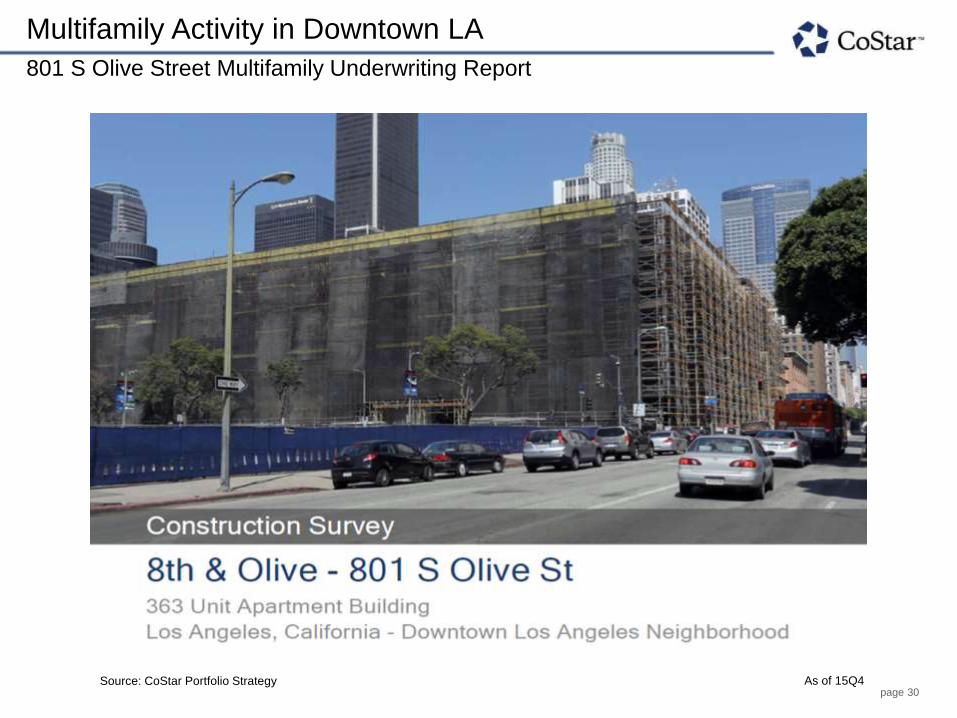
Multifamily Activity in Downtown LA
Source: CoStar Portfolio Strategy As of 15Q4
801 S Olive Street Multifamily Underwriting Report

page 31
Nearby Deliveries In Downtown LA
Source: CoStar Portfolio Strategy As of 15Q4
801 S Olive Street Multifamily Underwriting Report

page 32
The Construction Pipeline Is Hot
Source: CoStar Portfolio Strategy As of 15Q4
801 S Olive Street Multifamily Underwriting Report

page 33
Many Properties Nearing Completion
Source: CoStar Portfolio Strategy As of 15Q4
801 S Olive Street Multifamily Underwriting Report

page 34
Steady Activity Further Out In The Construction Pipeline
Source: CoStar Portfolio Strategy As of 15Q4
801 S Olive Street Multifamily Underwriting Report

page 35
Industrial

page 36
Dallas: Don’t Forget About The Smaller Tenants
Vacant, Available UC, & Spaces Taken In Last 10 Years
Source: CoStar Portfolio Strategy As of 16Q1
1.4
2.4
2.2
0.0
0.5
1.0
1.5
2.0
2.5
3.0
30
20
10
0
10
20
30
40
100-250K 250-500K 500-1500K
Years of Supply Blocks Of Space
# Blocks Under Construction & Available
# Vacant Existing Blocks (Buildings Built Since 2000)
# Blocks Taken
# Years of Supply
page 37
These Costar Portfolio Strategy Materials Contain Financial And Other Information From A Variety of public and proprietary
sources. CoStar Group, Inc. and its affiliates (collectively, “CoStar”) have assumed and relied upon, without independent
verification, the accuracy and completeness of such third party information in preparing these materials.
The modeling, calculations, forecasts, projections, evaluations, analyses, simulations, or other forward-looking information
prepared by CoStar and presented herein (the “Materials”) are based on various assumptions concerning future events
and circumstances, which are speculative, uncertain and subject to change without notice. You should not rely upon the
Materials as predictions of future results or events, as actual results and events may differ materially. All Materials speak
only as of the date referenced with respect to such data and may have materially changed since such date. CoStar has no
obligation to update any of the Materials included in this document. You should not construe any of the data provided
herein as investment, tax, accounting or legal advice.
CoStar does not represent, warrant or guaranty the accuracy or completeness of the information provided herein and shall
not be held responsible for any errors in such information. Any user of the information provided herein accepts the
information “AS IS” without any warranties whatsoever. To the maximum extent permitted by law, CoStar disclaims any
and all liability in the event any information provided herein proves to be inaccurate, incomplete or unreliable.
© 2016 CoStar Realty Information, Inc. No reproduction or distribution without permission.
Hans Nordby, Managing Director