Sales forecasting by brands academy
35
-
Upload
brands-academy -
Category
Business
-
view
324 -
download
4
description
Brand Academy provides details brand analysis, research, article and insights for free. Contact us : [email protected] https://www.facebook.com/1stbrandsacademy Sales Forecasting
At
Colgate Palmolive Pakistan Limited Introduction Colgate Palmolive Pakistan Limited is operated as a franchise of Colgate Palmolive Co. (US-based) by Lakson group companies. Its located at Lakson square building no. 2 office near zainab market karachi. It has been a major player in the health care sector through its valuable and innovative solutions particularly in the oral care, personal care, surface care and fabric care. Company offerings are quite successful in generating brand loyalty and demand for the products, as it has been able to generate the increase in the net revenue and gross profit by 22.7% and 8.6% respectively. Target increase in market share was clearly achieved in the YR2011 by attaining an increase of 1.42% in the net profit. Rs. 14,150 million was the annual net sales of YR11 with gross profit of Rs.4,161 million. Focus of Our Report Our report focuses mainly on the “Sales Forecasting”. Our analysis and findings are focused to Colgate GRF (great regular flavor) brand’s forecasting techniques and issues related to the scope of Sales manager. We have interviewed National, Regional & Area managers of Karachi, and some merchandisers in order attain trade insights and market norms regarding forecasting practices. Estimation of Industry sales Colgate GRF & its Competitors Top of mind brand in this category is Colgate GRF as being market leader with 59% share Whereas Medicam & Pepsodant are the direct competitor for Colgate GRF having 20% & 3% respectively The 18% share is with other competitors like forhans etc. Colgate GRF is a supreme profit generating factor and therefore termed as “Cash Cow” for CP Pakistan. Market potential Colgate tooth paste with all its brands like Herbal, Misvaak, Maxfresh, etc. that contains nearly 55% of the market share as of whole toothpaste category in YR2011. Sales in volume were not shared. Rs. 4161m(Sales of YR11) /0.55 (Colgates share in YR11)= Rs.7565m (Category sales in YR11) 20% of expected increase so expected total category sales would be Rs.7565 X 1.20 = Rs.9078m Rs.9078m is the market potential. Sales potential Colgate aims to grab 58% to 60% of the market share by the end of June YR13. For this some new brands are in pipeline of brand extension plan. The launch of Colgate Sensitive is part of launch and share boosting plan. Sales potential is Rs.5266m to Rs.5447m Annual Forecast table for Colgate GRF YR12 expected sales of 150gms tube are 15% due to 2-3 brush pack schemes. Stock keeping unit information Colgate GRF is available in 130 different stock keeping units (SKUs) which are 50grams for Rs.40 75grams for Rs.58 100grams for Rs.72 150grams for Rs.100 200grams for Rs.125 Distributor margin is 5.5% Retail Margin is 7%
Transcript of Sales forecasting by brands academy


Sales Forecasting At
Colgate Palmolive Pakistan Limited
________________________Submitted to_________________________Sir Saeed Ur Rehman
_____________________Submitted by_____________________
Saad Baadar Zakir M. Bilal Omer Bin Saleem Syed Wahaj Hussain Team Facilitator
Sunday August 19, 2012
Introduction • Colgate Palmolive Pakistan Limited is operated as a franchise of Colgate
Palmolive Co. (US-based) by Lakson group companies.• Its located at Lakson square building no. 2 office near zainab market karachi.
• It has been a major player in the health care sector through its valuable and innovative solutions particularly in the oral care, personal care, surface care and fabric care.
Oral Care Personal Care Surface Care Fabric CareToothpaste New Palmolive
NaturalsMax Bar Brite Maximum Power
Sparkle Azadi Carbolic Soap Azadi Dish Bar Brite AntibacterialToothbrushes Protex Max Scourers Express Power
Max liquid BonusMax
Antibacterial

• Company offerings are quite successful in generating brand loyalty and demand for the products, as it has been able to generate the increase in the net revenue and gross profit by 22.7% and 8.6% respectively.
• Target increase in market share was clearly achieved in the YR2011 by attaining an increase of 1.42% in the net profit. Rs. 14,150 million was the annual net sales of YR11 with gross profit of Rs.4,161 million.
Focus of Our Report
• Our report focuses mainly on the “Sales Forecasting”.
• Our analysis and findings are focused to Colgate GRF (great regular flavor) brand’s forecasting techniques and issues related to the scope of Sales manager.
• We have interviewed – National, Regional & Area managers of Karachi, – and some merchandisers in order attain trade insights
and market norms regarding forecasting practices.
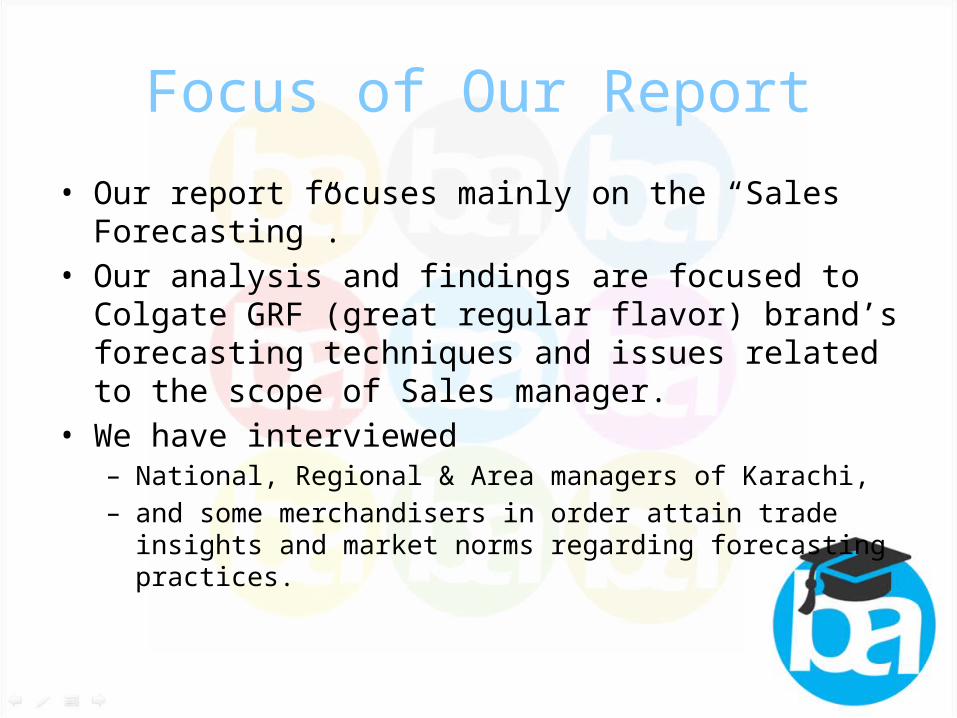
Estimation of Industry sales

Colgate GRF & its Competitors
• Top of mind brand in this category is Colgate GRF as being market leader with 59% share
• Whereas Medicam & Pepsodant are the direct competitor for Colgate GRF having 20% & 3% respectively
• The 18% share is with other competitors like forhans etc.
• Colgate GRF is a supreme profit generating factor and therefore termed as “Cash Cow” for CP Pakistan.

Market ShareYEAR 2012E 2011 2010
Colgate GRF 59.2% 59.0% 58.7%Medicam 19.0% 20.0% 21.2%
Pepsodant 2.8% 3.0% 3.0%Others 19.0% 18.0% 17.1%TOTAL 100.0% 100.0% 100.0%
Colgate GRF & its Competitors

Market potential
• Colgate tooth paste with all its brands like Herbal, Misvaak, Maxfresh, etc. that contains nearly 55% of the market share as of whole toothpaste category in YR2011.
• Sales in volume were not shared.– Rs. 4161m(Sales of YR11) /0.55 (Colgates share
in YR11)= Rs.7565m (Category sales in YR11)– 20% of expected increase so expected total
category sales would be Rs.7565 X 1.20 = Rs.9078m
• Rs.9078m is the market potential.

Sales potential
• Colgate aims to grab 58% to 60% of the market share by the end of June YR13.
• For this some new brands are in pipeline of brand extension plan. The launch of Colgate Sensitive is part of launch and share boosting plan.
• Sales potential is Rs.5266m to Rs.5447m

Annual Forecast table for Colgate GRFSKU wise Units (in cartons)
YEAR 30grams
50grams 75grams 100grams
150grams
200grams
TOTAL
2012E
N/S 1,448 2,263 3,439 1,358 543 9,051
2011 N/S 1,231 2,052 3,283 1,000 310 7,8762010 N/S 1,259 2,043 2,978 957 302 7,5392009 N/S 1,077 1,761 2,239 762 212 6,0512008 N/S 919 1,452 1,985 669 199 5,2242007 N/S 866 1,349 1,798 617 153 4,783
1 carton contains 72packsE=Expected/BudgetedN/S=Not supplied
30grams 50grams 75grams 100grams 150grams 200grams 0
5001000150020002500300035004000
SKU wise Units (in cartons)
2012E 2011 2010 2009 2008 2007

• YR12 expected sales of 150gms tube are 15% due to 2-3 brush pack schemes.
SKU wise forecast share in %YEAR 30grams 50grams 75grams 100grams 150grams 200gram
sTOTAL
2012E N/S 16.0% 25.0% 38.0% 15.0% 6.0% 100.0%
2011 N/S 16.0% 26.0% 41.0% 13.0% 4.0% 100.0%
2010 N/S 16.7% 27.1% 39.5% 12.7% 4.0% 100.0%
2009 N/S 17.8% 29.1% 37.0% 12.6% 3.5% 100.0%
2008 N/S 17.6% 27.8% 38.0% 12.8% 3.8% 100.0%
2007 N/S 18.1% 28.2% 37.6% 12.9% 3.2% 100.0%
2012E
2011
2010
2009
2008
2007
0 0.05 0.1 0.15 0.2 0.25 0.3 0.35 0.4 0.45
200grams
150grams
100grams
75grams
50grams
30grams

Stock keeping unit information
•Colgate GRF is available in 130 different stock keeping units (SKUs) which are- 50grams for Rs.40- 75grams for Rs.58- 100grams for Rs.72- 150grams for Rs.100- 200grams for Rs.125 •Distributor margin is 5.5%•Retail Margin is 7%

Growth Comparison
• Growth comparison is carried on the basis of comparing same periods of the current and last year.
• For example the comparison of March’12 will be done with March’11. And similarly the case is in quarterly and monthly comparison.
• This helps to keep a bird eye view on the progress of sales towards goal. If any deviation is observed timely action is taken to meet targets.

Forecasting methods
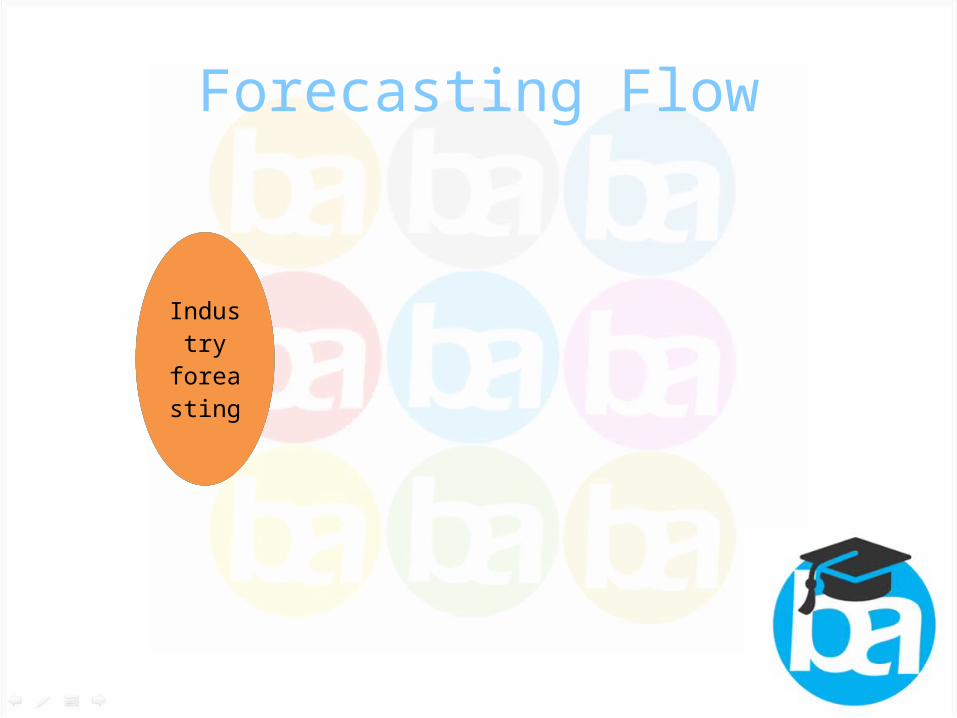
Forecasting Flow
Sku Wise
forecasting
Extension
Wise forecasting
Brand wise
forecasting
Category
forecasting
Industry
foreasting
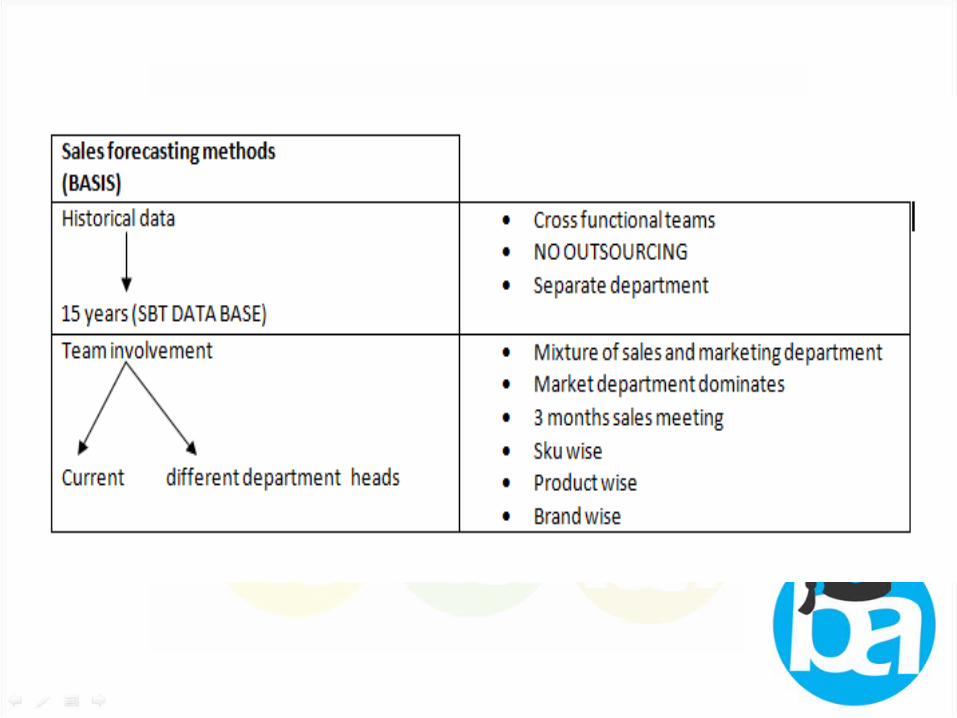
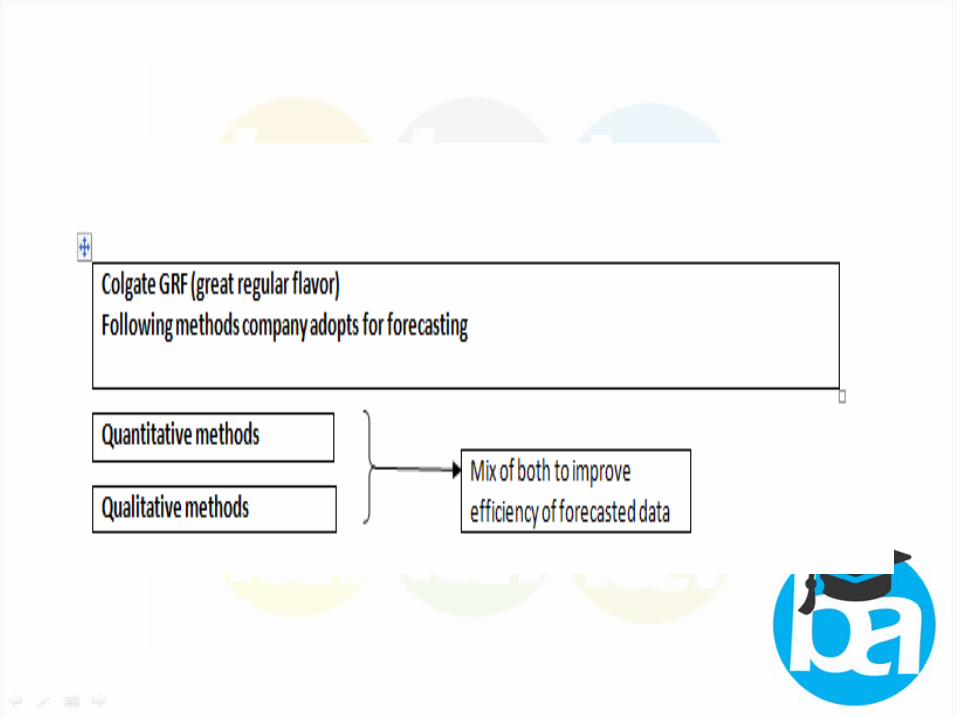

> Qualitative methods which they normally uses: - Jury of executive opinion - Sales force composite - Survey of buyers intention
> Quantitative method which they normally uses: - Continuity extrapolation - Time series analysis

Sale Forecasting Periods
• Colgate defines target for next period according to industry expected size.
• Forecasting periods are defined as short term, medium term and long term.
• Area manager defines his forecasting term in days as under:
Long term > 365 days /1 year
Medium term > 3 months / quarterly
Short term > 30 days /1 month

Sale Forecasting Periods
• If forecasted units sets out to be more than or less than the actual for more than two quarters, area manager is required to call a meeting with SBT- Sales & budgeting team to inquire the reasons for so much deviation in the forecasted volume.

Sales Forecasting Responsibility
Importance
• Most Critical activity
• Must be carried out with due diligence
• Failure to do so may result in inaccurate forecasts.
Consequences
• What if sales forecast is overstated ?
• What if sales forecast is understated ?
To further investigate the impact we asked the following questions;

• Who is responsible for making a sales forecast ?
Ans: Sales & Budgeting Team
• Which department makes most accurate contribution in the sales forecasting procedure?
Ans: Marketing Department

• In case of conflicting estimates, what strategy does the company adopts to reach to a conclusion?
Ans: Close IntegrationConsensus
Buffer

• In case of a conflict with in departmental estimates, which department’s estimates are given more weight?
Ans: Marketing DepartmentReason...
» Continuous Engagement in Mkt Research» Customer Oriented Approach

• How accurate are the forecasts made in comparison to actual sales activity?
Ans: 75-85%
• What is the acceptable level of deviation between actual sales and sales forecast?
Ans: 10-15 %

• What is the impact of differences in sales forecasts and actual sales activity?a. If forecast> actual
b. If forecast< actual
Forecasting Review
• After every 3months, a review is carried by each area sales manger to ensure his direction. This review meeting consists participation from zonal managers, SBT members and sales supervisors along with their area manager.
• Area mangers at IMTs are required a 3month
review report but the carry and maintain weekly reports to meet the accuracy in meeting their targets.
Sources
– http://investor.colgate.com/annual.cfm– http://www.brecorder.com/component/ne
ws/single/592/0/1211418/– http://www.zonebourse.com/COLGATE-P
ALMOLIVE-COMPANY-12089/pdf/232331/Colgate-Palmolive%20Company_SEC-Filing-10Q-1.pdf

Thanks