
SAI PARADISEenvironmentclearance.nic.in/.../290620164AI9QVO6SaiParadiseForms.pdfSai Paradise by M/s...
63
SAI PARADISE M/s ANUBANDANA INFRATECH PRIVATE LIMITED SURVEY NOS. 575, 576, 599, PERECHERLA, MEDIKONDURU MANDAL, GUNTUR DISTRICT, ANDHRA PRADESH 1. FORM I 2. FORM I A Submitted By M/s Anubandana Infratech Private Limited 5-87-32,Lakshmipuram main road Satyaakarsh, Guntur - 522007, Andhra Pradesh Studies & Documentation by M/s Team Labs and Consultants (An ISO Certified Organization) B-115 - 117 & 509, Annapurna Block, Aditya Enclave, Ameerpet, Hyderabad- 500 038 Phone: 91-040-23748555/616 Fax : 91-040-23748666 e-mail: [email protected] SUBMITTED TO STATE LEVEL ENVIRONMENT IMPACT ASSESSMENT AUTHORITY , ANDHRA PRADESH GOVERNMENT OF INDIA
Transcript of SAI PARADISEenvironmentclearance.nic.in/.../290620164AI9QVO6SaiParadiseForms.pdfSai Paradise by M/s...

SAI PARADISEM/s ANUBANDANA INFRATECH PRIVATE LIMITED
SURVEY NOS. 575, 576, 599, PERECHERLA,MEDIKONDURU MANDAL, GUNTUR DISTRICT,
ANDHRA PRADESH
1. FORM I
2. FORM I A
Submitted ByM/s Anubandana Infratech Private Limited5-87-32,Lakshmipuram main roadSatyaakarsh, Guntur - 522007,Andhra Pradesh
Studies & Documentation byM/s Team Labs and Consultants(An ISO Certified Organization)B-115 - 117 & 509, Annapurna Block,Aditya Enclave, Ameerpet,Hyderabad- 500 038Phone: 91-040-23748555/616Fax : 91-040-23748666e-mail: [email protected]
SUBMITTED TOSTATE LEVEL ENVIRONMENT IMPACT ASSESSMENT AUTHORITY,
ANDHRA PRADESHGOVERNMENT OF INDIA

F1 - 1
APPENDIX I
(See paragraph – 6) FORM 1
S.No Item Details1
Name of the Project/sSai Paradise by M/s Anubandana InfratechPrivate Limited.,
2 S.No. in the Schedule B category (Expected cost of the project 89.0crores)
3 Proposed capacity/area/length/tonnage to be handled/commandarea/lease area/number of wells to bedrilled
Annexure I
4 New/Expansion/Modernization New5 Existing Capacity/Area etc. NA6 Category of Project i.e 'A' or 'B' B category7 Does it attract the general condition?
If yes, please specifyNo
8 Does it attract the Specific condition?If yes, please specify.
No
9 LocationPlot/Survey/Khasra No. Survey nos. 575, 576, 599Village PerecherlaTehsil Guntur (M)District GunturState Andhra Pradesh
10 Nearest railway station/airport alongwith distance in kms. Perecherla Railway Station – 2.8 km.
11 Nearest Town, City, DistrictHeadquarters along with distance inkms.
Vijayawada and Guntur
12 Village Panchayats, Zilla Parishad,Municipal Corporation, Local body(complete postal address withtelephone nos. to be given)
Guntur Municipality
13 Name of the Applicant Sri. Kommalapati. Sai Sudhakar14 Registered Address M/s Anubandana Infratech Private Limited.,
5-87-32,Lakshmipuram main roadSatyaakarsh, Guntur,Andhra Pradesh, Pin code- 522007
15
Address for Correspondence:
M/s Anubandana Infratech Private Limited.,5-87-32,Lakshmipuram main roadSatyaakarsh, Guntur,Andhra Pradesh, Pin code- 522007
Name Sri. Kommalapati. Sai SudhakarDesignation(Owner/Partner/CEO) Executive DirectorAddress M/s Anubandana Infratech Private Limited.,

F1 - 2
S.No Item Details5-87-32,Lakshmipuram main roadSatyaakarsh, Guntur,Andhra Pradesh, Pin code- 522007
Pin Code 522007
[email protected],[email protected]
Telephone Number (M) - 91 9989226667Fax No. 0863-2355002
16 Details of alternative Sites examined,if any. Location of these sites shouldbe shown on a topo sheet.
Village-District-StateNA
17 Interlinked Projects No18 Whether separate application of
interlinked project has beensubmitted?
19 If yes, date of submission20 If no, reason21 Whether the proposal involves
approval/clearance under: if yes,details of the same and their status tobe given.(a) The Forest (Conservation) Act,1980? (b) The Wildlife(Protection) Act, 1972 ? (c)The C.R.Z Notification, 1991 ?
No
22 Whether there is any GovernmentOrder/Policy relevant/relating to thesite?
Yes
23 Forest land involved (hectares) No24 Whether there is any location pending
against the project and /or land inwhich the project is propose to be setup?(a) Name of the Court(b) Case No(c) Orders/directions of the Court, ifany and its relevance with theproposed project.
No

F1 - 3
(II) Activity
1. Construction, operation or decommissioning of the Project involving actions, which willcause physical changes in the locality (topography, land use, changes in water bodies, etc.)
S.No. Information/Checklist confirmation Yes/No
Details thereof (withapproximate quantities /rates,wherever possible) with sourceof information data
1.1 Permanent or temporary change inland use, land cover or topographyincluding increase in intensity ofland use (with respect to local landuse plan)
Yes The site area is located inVGTMUDA. The present landuse is Residential Apartmentsconstruction project. Presentlythe land barren, and is not usedfor any productive purpose. Theproposed project shall enhancethe land cover.
1.2 Clearance of existing land, vegetationand buildings?
No The land is barren containingmainly shrubs and bushes. Thesame shall be cleared.
1.3 Creation of new land uses? No The present land use isResidential Apartments.
1.4 Pre-construction investigations e.g.bore houses, soil testing?
No
1.5 Construction works? Yes The project is a constructionproject of ResidentialApartments.
1.6 Demolition works? No
1.7 Temporary sites used for constructionworks or housing of constructionworkers?
No
1.8 Above ground buildings, structures orearthworks including linear structures,cut and fill or excavations
Yes Built up Area: Annexure ICut and Fill quantity: Annexure II
1.9 Underground works including mining ortunneling?
No
1.10 Reclamation works? No
1.11 Dredging? No1.12 Offshore structures? No1.13 Production and manufacturing
processes?No Residential Apartments
construction project.1.14 Facilities for storage of goods or
materials?Yes Construction materials like
cement, steel, sand, paints,aggregate etc shall be stored onsite. The cement and paints arestored indoor, while the
F1 - 4
S.No. Information/Checklist confirmation Yes/No
Details thereof (withapproximate quantities /rates,wherever possible) with sourceof information dataremaining is stored out doors.
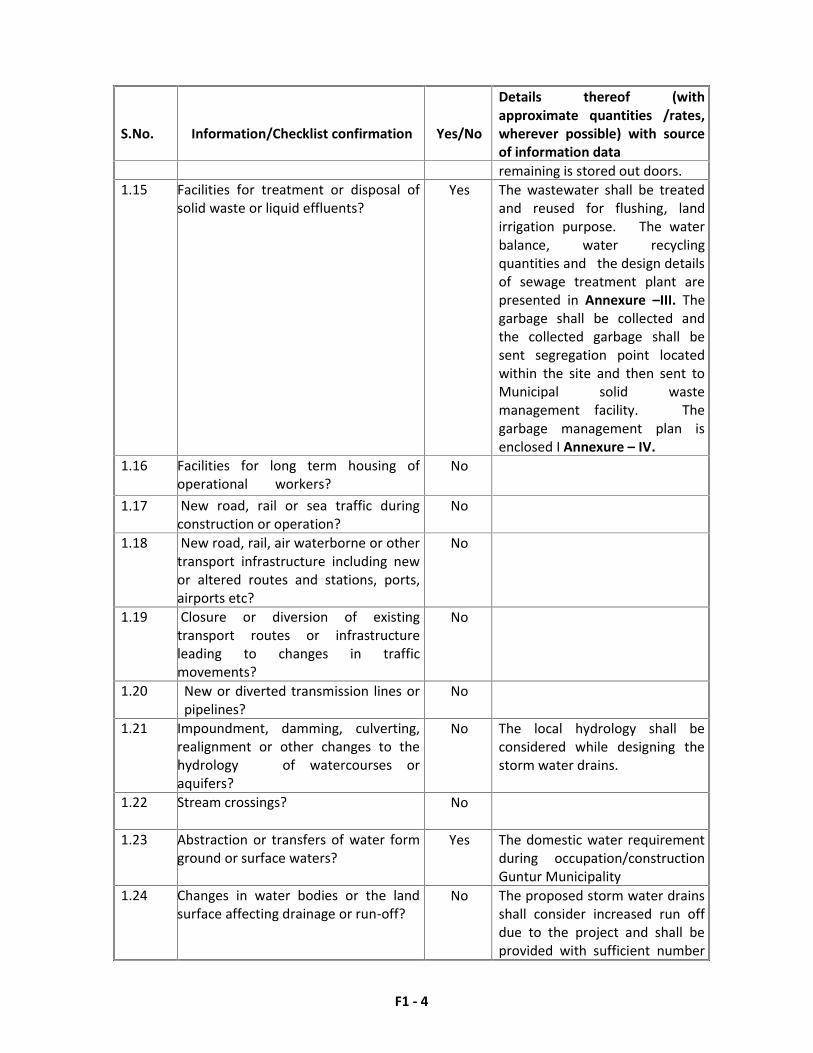
1.15 Facilities for treatment or disposal ofsolid waste or liquid effluents?
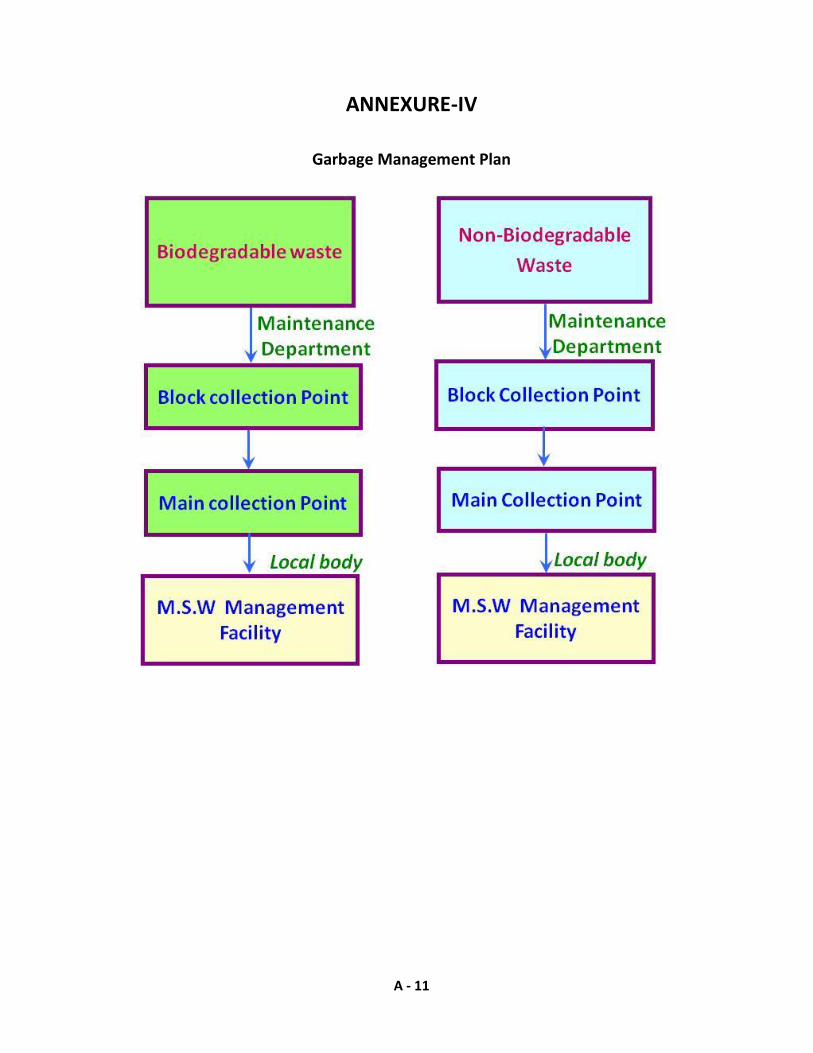
Yes The wastewater shall be treatedand reused for flushing, landirrigation purpose. The waterbalance, water recyclingquantities and the design detailsof sewage treatment plant arepresented in Annexure –III. Thegarbage shall be collected andthe collected garbage shall besent segregation point locatedwithin the site and then sent toMunicipal solid wastemanagement facility. Thegarbage management plan isenclosed I Annexure – IV.
1.16 Facilities for long term housing ofoperational workers?
No
1.17 New road, rail or sea traffic duringconstruction or operation?
No
1.18 New road, rail, air waterborne or othertransport infrastructure including newor altered routes and stations, ports,airports etc?
No
1.19 Closure or diversion of existingtransport routes or infrastructureleading to changes in trafficmovements?
No
1.20 New or diverted transmission lines orpipelines?
No
1.21 Impoundment, damming, culverting,realignment or other changes to thehydrology of watercourses oraquifers?
No The local hydrology shall beconsidered while designing thestorm water drains.
1.22 Stream crossings? No
1.23 Abstraction or transfers of water formground or surface waters?
Yes The domestic water requirementduring occupation/constructionGuntur Municipality
1.24 Changes in water bodies or the landsurface affecting drainage or run-off?
No The proposed storm water drainsshall consider increased run offdue to the project and shall beprovided with sufficient number

F1 - 5
S.No. Information/Checklist confirmation Yes/No
Details thereof (withapproximate quantities /rates,wherever possible) with sourceof information dataof collection sumps andrainwater harvesting structures.
1.25 Transport of personnel or materials forconstruction, operation ordecommissioning?
Yes Trucks shall be used fortransporting the materials.
1.26 Long-term dismantling ordecommissioning or restoration works?
No
1.27 Ongoing activity duringdecommissioning which could have animpact on the environment?
No
1.28 Influx of people to an area in eithertemporarily or permanently?
No The local area is developing at afaster pace due to thecommercial area development inthe surrounding areas.
1.29 Introduction of alien species? No
1.30 Loss of native species or geneticdiversity?
No
1.31 Any other actions? No

F1 - 6
2. Use of Natural resources for construction or operation of the Project (such as land, water,materials or energy, especially any resources which are non-renewable or in short supply):
S.No. Information/checklist confirmation Yes/No
Details thereof (with approximatequantities /rates, whereverpossible) with source of informationdata
2.1 Land especially undeveloped oragricultural land (ha)
Yes Undeveloped land belonging to theindustry spread over an area of 2.97hectares
2.2 Water (expected source &competing users) unit: KLD
Yes Tadepalli Municipality. Waterrequirement during occupation is417.1 KLD. During construction thewater requirement is 50 KLD.
2.3 Minerals (MT) No
2.4 Construction material – stone,aggregates, sand / soil (expectedsource – MT)
Yes Annexure – V: Lead distances ofconstruction materials. Annexure –VI: Quantity of construction materialrequirement.
2.5 Forests and timber (source – MT) Yes Local authorized Suppliers
2.6 Energy including electricity and fuels(source, competing users) Unit: fuel(MT), energy (MW)
Yes DG sets and construction equipmentshall be used during construction,which shall use mainly HSD as fuel.The energy requirement duringoccupation is presented in Annexure– VII. DG set (500 kVA x 2 Nos) shallbe used during occupation in theevent of power shut down byAPTRANSCO to provide power forlifts, street lighting, common lightingand sewage treatment plant.
2.7 Any other natural resources (useappropriate standard units)
No

F1 - 7
3. Use, storage, transport, handling or production of substances or materials, which couldbe harmful to human health or the environment or raise concerns about actual or perceivedrisks to human health.
S.No. Information/Checklist confirmation Yes/No
Details thereof (withapproximate quantities/rates,wherever possible) with sourceof information data
3.1 Use of substances or materials, whichare hazardous (as per MSIHC rules) tohuman health or the environment(flora, fauna, and water supplies)
No Hazardous materials used are:HSD, Paints etc.
3.2 Changes in occurrence of disease oraffect disease vectors (e.g. insect orwater borne diseases)
No
3.3 Affect the welfare of people e.g. bychanging living conditions?
Yes
3.4 Vulnerable groups of people who couldbe affected by the project e.g. hospitalpatients, children, the elderly etc.,
No
3.5 Any other causes No

F1 - 8
4. Production of solid wastes during construction or operation or decommissioning(MT/month)
S.No. Information/Checklist confirmation Yes/No
Details thereof (withapproximatequantities/rates,wherever possible) withsource of informationdata
4.1 Spoil, overburden or mine wastes No
4.2 Municipal waste (domestic and orcommercial wastes)
Yes 1846 kg/day duringoperation.
4.3 Hazardous wastes (as per Hazardous WasteManagement Rules)
Yes Used oil: 120 l/yearUsed Batteries: 6 nos./year
4.4 Other industrial process wastes No
4.5 Surplus product No
4.6 Sewage sludge or other sludge from effluenttreatment
Yes 20 kg/day sludge fromSTP shall be reused asmanure.
4.7 Construction or demolition wastes Yes
4.8 Redundant machinery or equipment No
4.9 Contaminated soils or other materials No
4.10 Agricultural wastes No
4.11 Other solid wastes No
F1 - 9
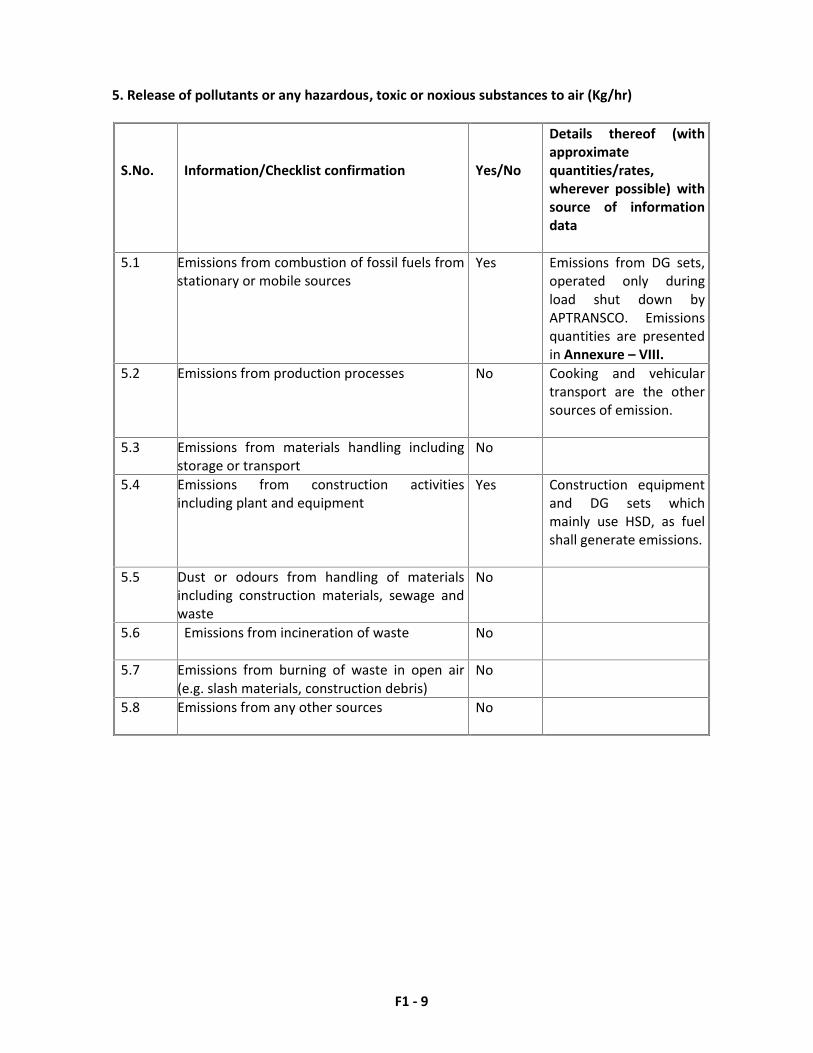
5. Release of pollutants or any hazardous, toxic or noxious substances to air (Kg/hr)
S.No. Information/Checklist confirmation Yes/No
Details thereof (withapproximatequantities/rates,wherever possible) withsource of informationdata
5.1 Emissions from combustion of fossil fuels fromstationary or mobile sources
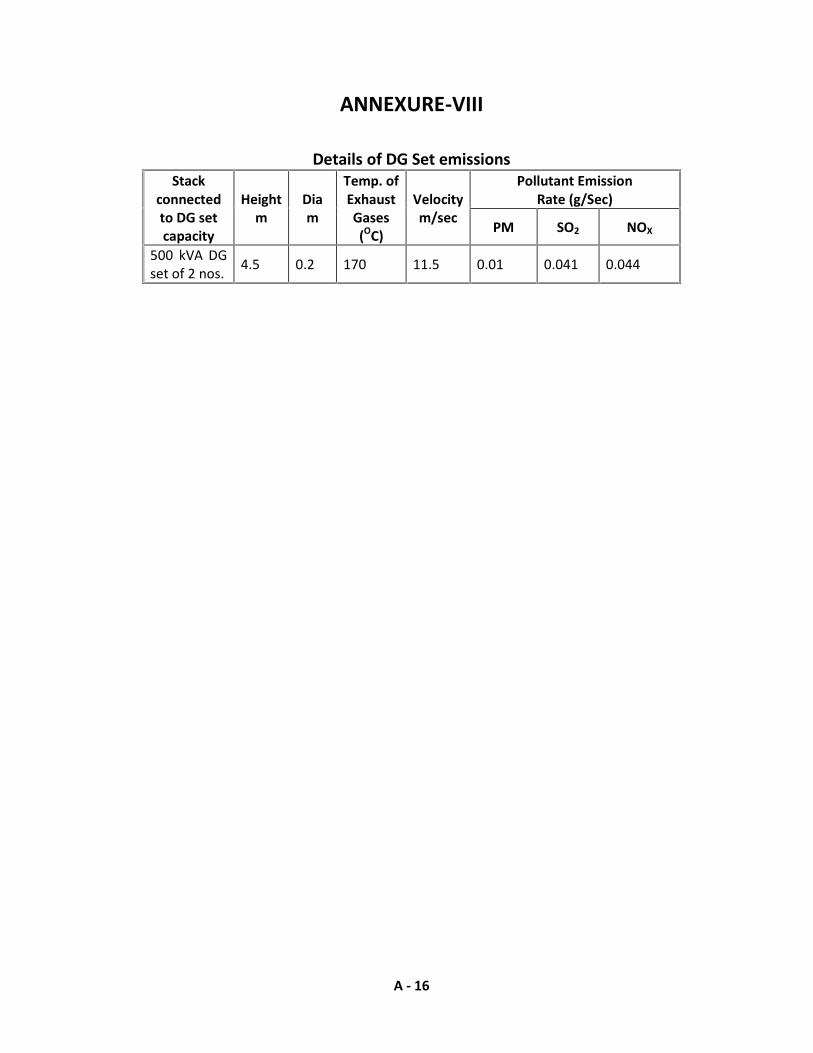
Yes Emissions from DG sets,operated only duringload shut down byAPTRANSCO. Emissionsquantities are presentedin Annexure – VIII.
5.2 Emissions from production processes No Cooking and vehiculartransport are the othersources of emission.
5.3 Emissions from materials handling includingstorage or transport
No
5.4 Emissions from construction activitiesincluding plant and equipment
Yes Construction equipmentand DG sets whichmainly use HSD, as fuelshall generate emissions.
5.5 Dust or odours from handling of materialsincluding construction materials, sewage andwaste
No
5.6 Emissions from incineration of waste No
5.7 Emissions from burning of waste in open air(e.g. slash materials, construction debris)
No
5.8 Emissions from any other sources No

F1 - 10
6. Generation of Noise and Vibration, and Emissions of Light and Heat:
S.No. Information/Checklist confirmation
Yes/No
Details thereof (withapproximatequantities/rates, whereverpossible) with source ofinformation data withsource of information data
6.1 From operation of equipment e.g.engines, ventilation plant, crushers
Yes Construction activity andthe construction equipmentare the main sources ofnoise and vibration duringconstruction. While thereare no major sources ofnoise during occupationphase.
6.2 From industrial or similar processes No
6.3 From construction or demolition Yes
6.4 From blasting or piling No No blasting activityenvisaged.
6.5 From construction or operational traffic Yes There will be an increase inthe traffic density, whichshall increase the noiselevels of the area mainlyduring construction.
6.6 From lighting or cooling systems No
6.7 From any other sources No

F1 - 11
7. Risks of contamination of land or water from releases of pollutants into the ground orinto sewers, surface waters, groundwater, coastal waters or the sea:
S.No.Information/Checklist confirmation Yes/No
Details thereof (withapproximatequantities/rates, whereverpossible) with source ofinformation data
7.1 From handling, storage, use or spillage ofhazardous materials
No Used batteries and waste oilshall be stored separately andshall not lead tocontamination of land duringnormal operation.
7.2 From discharge of sewage or othereffluents to water or the land (expectedmode and place of discharge)
No The sewage shall be treatedto achieve the standardsprescribed by MoE&F duringoperation phase. While thedischarges from temporarytoilets during constructionshall be sent to septic tankfollowed by sewer lines.
7.3 By deposition of pollutants emitted to airinto the land or into water
No The project shall not emitsubstantial quantities ofpollutants to have an impacton the air quality.
7.4 From any other sources No
7.5 Is there a risk of long term build up ofpollutants in the environment from thesesources?
No

F1 - 12
8. Risk of accidents during construction or operation of the Project, which could affecthuman health or the environment
S.No. Information/Checklist confirmation Yes/No
Details thereof (withapproximatequantities/rates, whereverpossible) with source ofinformation data
8.1 From explosions, spillages, fires etc fromstorage, handling, use or production ofhazardous substances
NA
8.2 From any other causes No
8.3 Could the project be affected by naturaldisasters causing environmental damage(e.g. floods, earthquakes, landslides,cloudburst etc)?
No The site is located at ahigher elevation and theseismic zone for the projectarea is Zone III, which isconsidered safe.

F1 - 13
9. Factors which should be considered (such as consequential development) which could leadto environmental effects or the potential for cumulative impacts with other existing orplanned activities in the locality
S. No. Information/Checklist confirmation Yes/No
Details thereof (withapproximatequantities/rates, whereverpossible) with source ofinformation data
9.1 Lead to development of supporting.Lities, ancillary development or
developmentStimulated by the project which could
have impact on the environment e.g.:
• Supporting infrastructure (roads,power supply, waste or waste watertreatment, etc.)
• Housing development
• Extractive industries
• Supply industries
• Other
No
Yes
Yes
No
No
No
The project envisagesdevelopment of residentialarea in place of the existingresidential facilities providedto employees of the industrialunit.
9.2 Lead to after-use of the site, which couldhave an impact on the environment
No
9.3 Set a precedent for later developments Yes The surrounding areas shalldevelop as residential/commercial areas.
9.4 Have cumulative effects due to proximityto other existing or planned projects withsimilar effects
No

F1 - 14
(III) Environmental Sensitivity
S.No. Areas Name/Identity
Aerial distance (within15 km.)Proposed projectlocation boundary
1 Areas protected under internationalconventions, national or local legislation fortheir ecological, landscape, cultural or otherrelated value
No Kondavidu RF at adistance of 1.0 km fromproject site
2 Areas which are important or sensitive forecological reasons - Wetlands, watercoursesor other water bodies, coastal zone,biospheres, mountains, forests
No
3 Areas used by protected, important orsensitive species of flora or fauna forbreeding, nesting, foraging, resting, overwintering, migration
No
4 Inland, coastal, marine or undergroundwaters
No
5 State, National boundaries No6 Routes or facilities used by the public for
access to recreation or other tourist, pilgrimareas
No
7 Defense installations No8 Densely populated or built-up area Yes Nearest densely
populated area is Guntur& Vijayawada Town
9 Areas occupied by sensitive man-made landuses (hospitals, schools, places of worship,community facilities)
Yes Hospitals, Schools, Placesof worship and communityfacilities are located in theproject impact area.
10 Areas containing important, high quality orscarce resources(Ground water resources, surface resources,forestry, agriculture, fisheries, tourism,minerals)
No
11 Areas already subjected to pollution orenvironmental damage. (Those whereexisting legal environmental standards areexceeded)
No
12 Areas susceptible to natural hazard whichcould cause the project to presentenvironmental problems(Earthquakes, subsidence, landslides,
erosion, flooding or extreme or adverseclimatic conditions)
No
F1 - 15
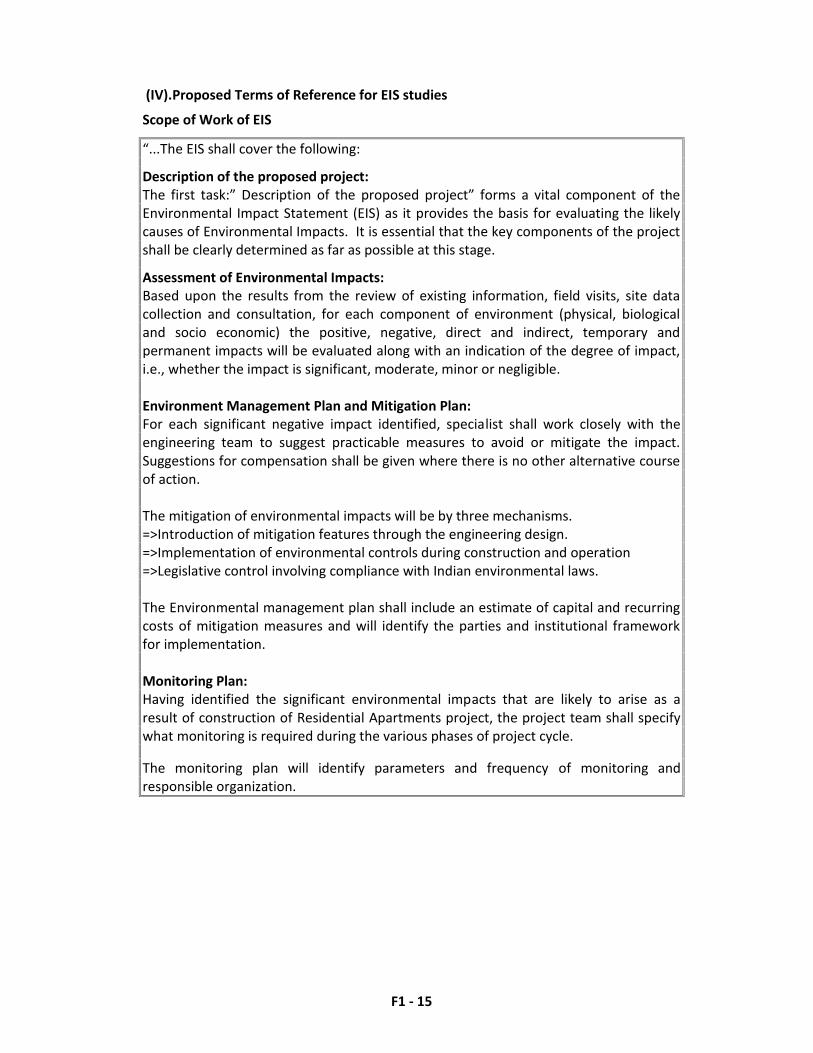
(IV).Proposed Terms of Reference for EIS studies
Scope of Work of EIS
“...The EIS shall cover the following:
Description of the proposed project:The first task:” Description of the proposed project” forms a vital component of theEnvironmental Impact Statement (EIS) as it provides the basis for evaluating the likelycauses of Environmental Impacts. It is essential that the key components of the projectshall be clearly determined as far as possible at this stage.
Assessment of Environmental Impacts:Based upon the results from the review of existing information, field visits, site datacollection and consultation, for each component of environment (physical, biologicaland socio economic) the positive, negative, direct and indirect, temporary andpermanent impacts will be evaluated along with an indication of the degree of impact,i.e., whether the impact is significant, moderate, minor or negligible.
Environment Management Plan and Mitigation Plan:For each significant negative impact identified, specialist shall work closely with theengineering team to suggest practicable measures to avoid or mitigate the impact.Suggestions for compensation shall be given where there is no other alternative courseof action.
The mitigation of environmental impacts will be by three mechanisms.=>Introduction of mitigation features through the engineering design.=>Implementation of environmental controls during construction and operation=>Legislative control involving compliance with Indian environmental laws.
The Environmental management plan shall include an estimate of capital and recurringcosts of mitigation measures and will identify the parties and institutional frameworkfor implementation.
Monitoring Plan:Having identified the significant environmental impacts that are likely to arise as aresult of construction of Residential Apartments project, the project team shall specifywhat monitoring is required during the various phases of project cycle.
The monitoring plan will identify parameters and frequency of monitoring andresponsible organization.

F1 - 16
A - 1
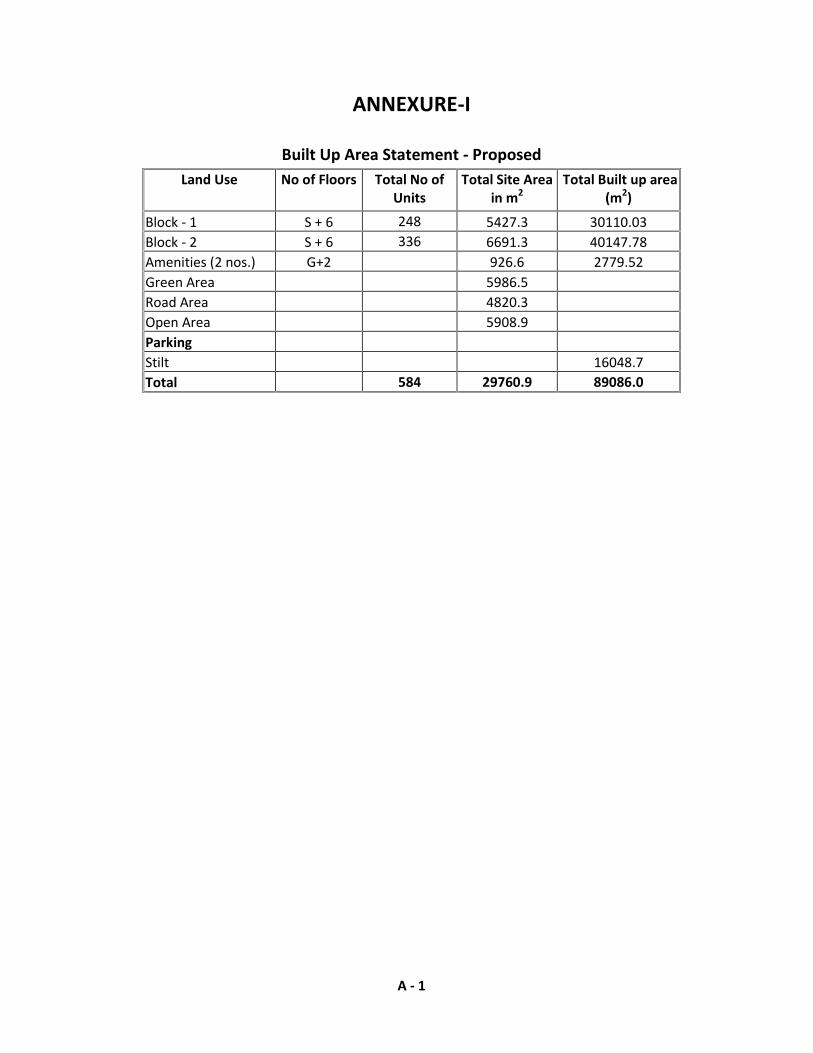
ANNEXURE-I
Built Up Area Statement - ProposedLand Use No of Floors Total No of
UnitsTotal Site Area
in m2Total Built up area
(m2)
Block - 1 S + 6 248 5427.3 30110.03Block - 2 S + 6 336 6691.3 40147.78Amenities (2 nos.) G+2 926.6 2779.52Green Area 5986.5Road Area 4820.3Open Area 5908.9ParkingStilt 16048.7Total 584 29760.9 89086.0

A - 2
ANNEXURE-II
Earth Work QuantitiesS.No Area Qty. of fill
(m3)Qty. of cut (m3) Surplus fill
(m3)Surplus cut
(m3)1 Site area 12839 12839 --- ---

A - 3
ANNEXURE-IIIWater Requirement of the Project
Land Use No. ofUnits
No. ofPersons/
unit
Waterrequirement per
person in l *
Total WaterRequirement
in KLDBlock 1 & 2 584 5 135 394.2Amenities 2 60 45 5.4Visitors 2 15 17.5TOTAL 417.1*Water requirement as per NBC
Water Savings Proposed
Land Use No. ofUnits
No. ofPersons/
unit
WaterRequirement/
KLD
Treated waterreuse/day Klpcd
Effective WaterRequirement in
KLDBlock 1 & 2 584 5 394.2 116.8 277.4Amenities 2 60 5.4 2.4 3.0Visitors 2 17.5 8.8 8.7TOTAL 417.1 128.0 289.1Note: Treated water reuse assumed @ 45l/head for Housing, and @ 20 l/head in
amenities.
Approximately 128 Kl/day water will be saved by adopting recycling of treated water inthe toilet flush. The effective water consumption is reduced by 128 Kl/day and therequirement will be in the order of 289.1 Kl/day.
Water Balance during occupation stageInput KLD Output KLDDomestic water fromGuntur Municipality 289.1
Excess treated water will besent to open drains 190.7
Recycled water 128.0 Recycled water 128.0Water requirement for greenbelt during non monsoon 15.0Losses approx 20% 83.4
Total 417.1 Total 417.1
The water used in the order of 417.1 KL/day would generate 333.7 KL/day ofwastewater, which has to be treated for reuse and or disposal.
SEWAGE TREATMENT PLANTIt is proposed to provide a sewage treatment plant with a capacity of 400 KLD. The unitoperations of the treatment system are presented below: Sewage treatment plantbased on Fluidized Aerobic Bio Reactor (FAB) technology
A - 4
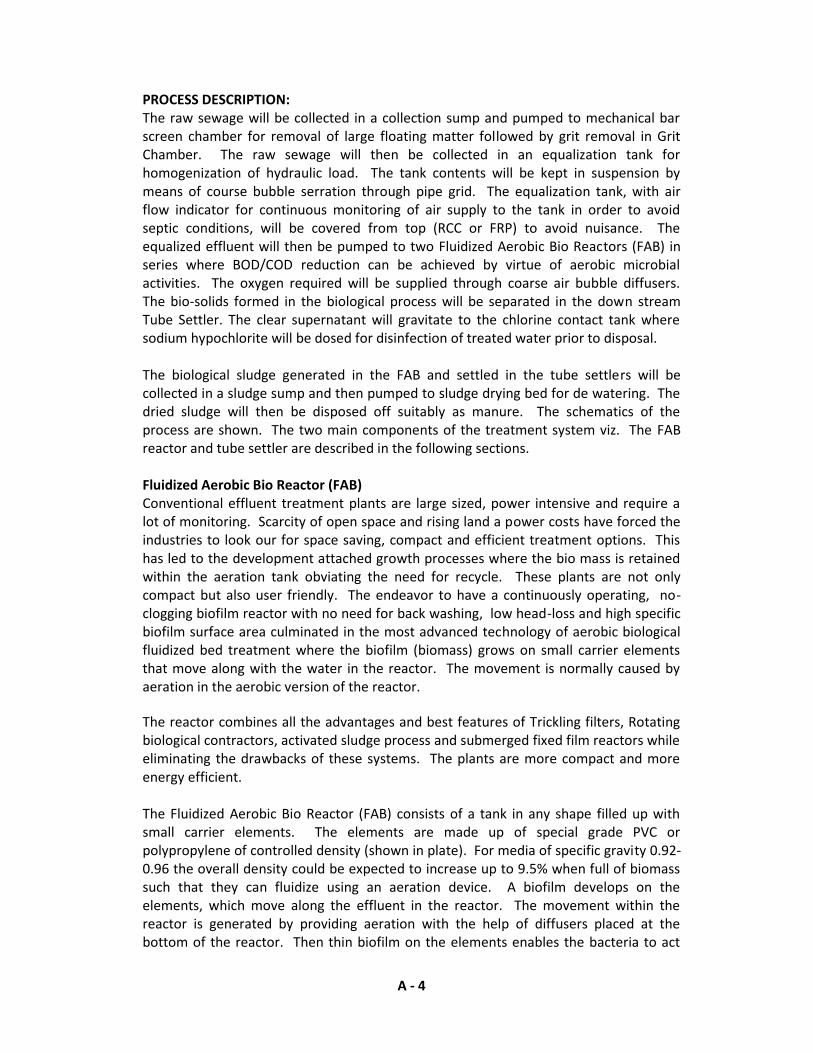
PROCESS DESCRIPTION:The raw sewage will be collected in a collection sump and pumped to mechanical barscreen chamber for removal of large floating matter followed by grit removal in GritChamber. The raw sewage will then be collected in an equalization tank forhomogenization of hydraulic load. The tank contents will be kept in suspension bymeans of course bubble serration through pipe grid. The equalization tank, with airflow indicator for continuous monitoring of air supply to the tank in order to avoidseptic conditions, will be covered from top (RCC or FRP) to avoid nuisance. Theequalized effluent will then be pumped to two Fluidized Aerobic Bio Reactors (FAB) inseries where BOD/COD reduction can be achieved by virtue of aerobic microbialactivities. The oxygen required will be supplied through coarse air bubble diffusers.The bio-solids formed in the biological process will be separated in the down streamTube Settler. The clear supernatant will gravitate to the chlorine contact tank wheresodium hypochlorite will be dosed for disinfection of treated water prior to disposal.
The biological sludge generated in the FAB and settled in the tube settlers will becollected in a sludge sump and then pumped to sludge drying bed for de watering. Thedried sludge will then be disposed off suitably as manure. The schematics of theprocess are shown. The two main components of the treatment system viz. The FABreactor and tube settler are described in the following sections.
Fluidized Aerobic Bio Reactor (FAB)Conventional effluent treatment plants are large sized, power intensive and require alot of monitoring. Scarcity of open space and rising land a power costs have forced theindustries to look our for space saving, compact and efficient treatment options. Thishas led to the development attached growth processes where the bio mass is retainedwithin the aeration tank obviating the need for recycle. These plants are not onlycompact but also user friendly. The endeavor to have a continuously operating, no-clogging biofilm reactor with no need for back washing, low head-loss and high specificbiofilm surface area culminated in the most advanced technology of aerobic biologicalfluidized bed treatment where the biofilm (biomass) grows on small carrier elementsthat move along with the water in the reactor. The movement is normally caused byaeration in the aerobic version of the reactor.
The reactor combines all the advantages and best features of Trickling filters, Rotatingbiological contractors, activated sludge process and submerged fixed film reactors whileeliminating the drawbacks of these systems. The plants are more compact and moreenergy efficient.
The Fluidized Aerobic Bio Reactor (FAB) consists of a tank in any shape filled up withsmall carrier elements. The elements are made up of special grade PVC orpolypropylene of controlled density (shown in plate). For media of specific gravity 0.92-0.96 the overall density could be expected to increase up to 9.5% when full of biomasssuch that they can fluidize using an aeration device. A biofilm develops on theelements, which move along the effluent in the reactor. The movement within thereactor is generated by providing aeration with the help of diffusers placed at thebottom of the reactor. Then thin biofilm on the elements enables the bacteria to act

A - 5
upon the biodegradable matter in the effluent and reduce the BOD/COD content in thepresence of oxygen available from the air that is used for fluidization.
Characteristics of Waste waterParameter Quantity in mg/l
PH 6 – 7Total Suspended Solids 200 – 400BOD 200 – 300COD 350 – 450
Design of the unitBasic dataFlow : 333 KLDCapacity : 400 m3
Peak factor : 3.5Peak flow Q peak : 1575 m3/dayInfluent BOD : 200 mg/litInfluent Suspended Solids : 200 mg/litInfluent COD : 350 mg/litEffluent BOD : 30 mg/litEffluent COD : 200 mg/litEffluent Suspended Solids : 100 mg/lit
1. Bar Screen ChamberAverage flow : 0.0052 m3/secPeak factor : 3.5Peak flow : 0.018 m3/secVelocity at peak flow : 0.75 m/SecEffective area of screen RequiredAt average flow : 0.017 m2
At Peak flow : 0.024 m2
Provide Effective area of screen : 0.024 m2
Considering the bar of dia. 10 mm(w) and clear spacing of 20 mm (b)Overall area required : 0.036 m2
Considering screen depth as : 0.5 mNumber of clear spacing : 1.8Number of bars : 2 Consider 4 Nos.Hence Provide 5 barsProvide a screen of 0.5 m X 0.5 m at an inclination of sin 600. In a screen channel of onemeter (1 m) length.

A - 6
2. Grit Chamber :The flow from the bar screen chamber is let into the Grit Chamber of minimum 2 hourscapacity. This tank is provided to even out the flow variation, and to provide acontinuous feed into the secondary biological treatment units.Peak flow Q : 0.018 m3/secProviding a flow through velocity of 0.30 m/secCross sectional area of Channel (0.018/0.3) : 0.06 m2
Surface area of channel (0.018/0.013) : 1.3 m2
Assuming depth d : 0.2 mWidth of channel (0.06/0.2) : 0.3 m (say 0.3m)Length of channel (1.3/0.3) : 4.3 m (say 4.3 m)Provide two channels each of 0.2 m wide and 4.3 m long with depth of waste water 0.2 m.
3. Equalization tank:The flow from the bar screen chamber is let into the equalization tank of minimum2hours capacity. This tank is provided to even out the flow variation, and to provide acontinuous feed into the secondary biological treatment units.Average flow : 18.75 m3/hrPeak factor : 3.5Peak flow : 65.6 m3/hrHydraulic retention tank = 2 hrs at Peak flowHence required volume of the tank : 131.25 m3
Provide tank of : 131.25 m3 CapacityAssuming depth : 5 mArea : 26.25 m2
Assuming length to width ratio (1:1) ; l=blength of the tank : 5.1 mwidth of the tank : 5.1 mAir required for agitation : 0.01 m3/ m2 minTotal air required : 78.75 m3/hrAir blower required : 100 m3/hr @ 3.8 mwcEffluent transfer pump : 18.75 m3/hr @ 8 mwc
4. Fluidized Aerobic Bio Reactor (FAB):The polypropylene media have been provided with a specific surface area of 350 – 520m2 /m3. This allows micro-organisms to get attached and biomass concentration canbe increased to four folds as compared to Activated Sludge Process. This enables toconsider higher Organic loading rates.
The micro-organisms attached to media are kept in a fluid state thereby maintainingthe CSTR (continuous Stirrer tank reactor) regime as well as two tanks are provided in

A - 7
series making the plug – flow system. This will enhance the efficiencies and have themerits of both CSTR and plug-flow regimes.Organic loading rate : 3.2 kg BOD/ m3 dOrganic load : 90 kg/dayVolume of the tank : 28.12 m3
Assume the depth : 5 mNo. of tanks in series : 2Size of the tank : 2.6 m dia. x 5.0 SWDSpecific gravity of media : 0.92 to 0.96Specific surface area of media : 350 – 520 m2 /m3
Media filling : 30 – 50 % of tank volumeOxygen required : 2 kg / kg BODOxygen in air : 23%Specific gravity of air @ 30 deg. : 1.65Aeration : Coarse bubbleOxygen transfer efficiency : 12%Air required : 116.6 m3/hrAir blower required : 150 m3/hr @ 6.5 m wc
5.Tube settlerSurface loading rate : 48 m2 /m3 dSurface area required : 9.37 m2
Tank size :3.0 m x 6.0 m x 2.7 m SWD With55 deg. hopper bottom
Tube Modules : 3.0m x 6.0 m x 0.6 m ht.Tube inclination : 60 deg.Settling area for 60 deg slope : 11 m2 /m3
Cross sectional area of tubes : 120 mm x 44 mm HexagonalHydraulic radius : 1/61 cm (1.5 cm)Shape factor : 0.6 – 0.7 for media settleable solids
6. Pre Filtration tankThe flow from the each individual settling tank i.e., the supernatant liquid is let into therespective Pre-Filtration Tank, which has a minimum 1.5 hours holding capacity. Thistank is provided to hold the treated effluent and give an even flow to the pressure sandfilter.Average flow : 18.75 m3/hrPeak factor : 2 m3/hrPeak flow : 37.5 m3/hrProvide min 1.5 hours holding capacity.Hence required volume of the tank : 56.25 m3

A - 8
7. Pressure Sand Filter:Vertical down flow type with graded/sand bed under drain plate with polysterenestrains.Flow : 400 m3/dayRate of filtration assumed as : 10 m3/m2/hrRequirement of treated water for usage in 20 hrs : 22.5 m3/hrDia. of filter of 1 nos. : 1692 mmProvide pressure sand filter of 1700 mm dia. and 2100 mm HOS with sand as medialayer, under drain pipe, laterals face piping etc for each stream.
8. Activated Carbon Filter:Vertical down flow type with graded/sand bed under drain plate with polysterenestrains.Flow : 400 m3/dayRate of filtration assumed as : 10 m3/m2/hrRequirement of treated water for usage in 20 hrs : 22.5 m3/hrDia of filter of 1 nos. : 1692 mmProvide Activated Carbon filter of 1700 mm dia with granular Activated carbon asmedia and 2100 mm HOS with sand as media layer, under drain pipe, laterals facepiping etc for each stream.
9.Ultraviolet Disinfection:UV applied to low turbidity water is a highly effective means of disinfection. UV is notharmful to aquatic organisms in the receiving water. UV light kills viruses, Vegetative-and spore-forming bacteria, algae and yeasts. No chemicals are added to thewastewater to change the pH, conductivity, odor or taste to create possible toxiccompounds. UV treatment has a few moving parts to adjust or wear out.
10.Final Treated Water Holding TankIt is always preferred to provide one final holding tank of minimum one day holdingcapacity, so that the treated effluents can be stored and used back for gardening orother tertiary purposes.Capacity: 400 m3
11. Sludge Filter Press:The biomass in the aeration tank stabilizes BOD in wastewater by consuming theorganic matter in the wastewater. The metabolic activity results in growth of thebiomass population in the Fluidized Aerobic Bio Reactor (FAB). Sludge holding tank hasbeen provided with filter press for dewatering sludge. The filtrate drains off throughthe media, which is again let into equalization tank.The dewatered sludge is collected in trays, which can be used as manure in the garden.

A - 9
No. of plates : 24Size of plates : 600 mm X 600 mmPlate moc (material of construction) : PP (poly propline)Type of operation : HydraulicPower pack capacity : 2 HP
The biomass in the aeration tank stabilizes BOD in wastewater by consuming theorganic matter in the wastewater. The metabolic activity results in growth of thebiomass population in the Fluidized Aerobic Bio Reactor (FAB).
Sludge holding tank has been provided with filter press for dewatering sludge. Thefiltrate drains off through the media, which is again let into equalization tank.The dewatered sludge is collected in trays, which can be used as manure in the garden.
Characteristics of Treated Waste waterParameter Quantity in mg/l
pH 7 – 8Total Suspended Solids 100BOD 30COD 100
Disposal of Treated Waste Water: It is proposed to reuse the treated wastewater forgreen belt development and for toilet flushing. Excess treated water shall be utilizedfor development of greenery in the surrounding areas.

A - 10
Sewage Treatment Flow Diagram
SEW
AG
E TR
EATM
ENT
PLA
NT
FLU
IDIZ
ED A
ERO
BIC
BIO
REA
CTO
R TE
CHN
OLO
GY
(FA
B)
Slud
geD
ewat
erin
gSy
stem
EQT
TAN
K
ACF
BarS
cree
n/ G
ritCh
ambe
r
Raw
Sew
age
Ove
rflo
w
Filte
r Fee
dPu
mp
(1W
+1S)
Slud
geD
ispo
sal
SLU
DG
EH
OLD
ING
TAN
K
CLAR
IFIE
DW
ATER
TAN
K
FAB
REAC
TOR
(Pac
kage
uni
t)TU
BESe
ttle
rs
PSF
TREA
TED
WAT
ERTA
NKUV
To R
euse
Ope
n dr
ains
/Exc
ess t
reat
ed w
ater
shal
l be
utili
zed
for d
evel
opm
ent o
fgr
eene
ry in
the
surr
ound
ing
area
s
A - 11
ANNEXURE-IV
Garbage Management Plan

A - 12
ANNEXURE-V
Lead Distance for Construction MaterialsS.No Material Source Lead Distance
(Km)
1Sand ROBOSAND and or Krishna
river bed areas permitted byGovt. of Andhra Pradesh
30 – 45
2 Aggregate From quarries 20-303 Cement Manufacturing units 50 –1004 Reinforcement Steel SAIL/TATA godowns 55 Bricks Local Suppliers 10 -206 Plumbing Material Local suppliers 2 – 77 Electrical Material Local Suppliers 2 – 78 Sanitary Material Local suppliers 2 – 7
9 Flooring andPavement Tiles
Manufacturers 50 – 150
10 Paints Local Manufacturers 50 - 25011 Ready Mix Concrete Local Batching Plants 5 – 10

A - 13
ANNEXURE-VI
Material Consumption for Total Units
UnitsBUA perunit in(m2)
TotalReady MixConcrete
(m3)
TotalCement(bags)
TotalSand(m3)
TotalAggregate(m3)
TotalWater(m3)
TotalBricks(Nos) x1000
TotalReinforcement
Steel(MT)
Total BUA 89086 36525 82850 34744 3831 21559 10334 2049Total 89086 36525 82850 34744 3831 21559 10334 2049

A - 14
ANNEXURE-VIIElectricity Consumption Statement
S.No DescriptionNo. ofUnits Load in KW
TotalConnected
Load(KW)
TotalConnected
Load(kVA)
Total MaxDemand
(KVA)1 Block 1 & 2 584 4 2336.0 2920.0 2920.02 Street Lights 60 0.04 2.4 3.0 2.43 Amenities 178.2 222.7 178.24 STP 1 85 85.0 106.3 106.35 Lifts 8 15 120.0 150.0 150.0
TOTAL 2721.6 3402.0 3356.8Maximum demand in kw at 0.6 diversity factor 1632.9Consumption of power for 8 hours per day 13063.6Maximum demand in kw at 0.2 diversity factor 544.3Consumption of power for 16 hours per day 8709.0Total consumption of power per day 21772.6 KWTotal consumption of power per year 79.5 Lakh Units
Energy Saving by using Solar Water Heater
S.No Description No. ofUnits
Powerallocated inwatts / unit
Total powerrequired in
(KW)1 Block 230 2500 575
TOTAL 575Maximum demand in kw at 1 diversity factor 575Consumption of power for 2 hours per day 1150Maximum demand in kw at 0.4 diversity factor 230Consumption of power for 2 hours per day 460Total consumption of power per day 1610.0 KWTotal consumption of power per year 5.88 Lakh Units

A - 15
Energy saving by using Solar Street Lights
S.No Description No. ofUnits
Powerallocated inwatts / unit
Total powerrequired in
(KW)1 Street lights 20 40 0.8
TOTAL 0.8Maximum demand in kw at 0.6 diversity factor 0.5Consumption of power for 8 hours per day 4Maximum demand in kw at full load 0.8Consumption of power for 4 hours per day 3Total consumption of power per day 7.0 KWTotal consumption of power per year 0.03 Lakh Unitssaving with Solar Heater and Street Lighting 5.90 Lakh Units
Electrical Power savings using CFL for lighting
S.No Description Area inm2
Powerallocated inwatts / unit
Total powerrequired in
(KW)1 Residential 30110 8 2412 Common & Utilities 18828 1.5 28
TOTAL 269Maximum demand in kw at 0.9 diversity factor 242Consumption of power for 12 hours per day 2907Total consumption of power per day 2906.5 KWTotal consumption of power per year 10.61 Lakh UnitsSavings in power using CFL 3.18 Lakh Units
Savings in Electrical Power Consumption - SUMMARY
S.No Description WithCFL
With SolarHeater and
StreetLighting
TotalConsumption
Lakh unitsTotal Saving
1 Savings in lakhkwh units
3.18 5.9079.47
9.08
2 Savings inpercentage (%)
4.00 7.43 11.4
A - 16
ANNEXURE-VIII
Details of DG Set emissionsStack
connectedto DG setcapacity
Heightm
Diam
Temp. ofExhaustGases(OC)
Velocitym/sec
Pollutant EmissionRate (g/Sec)
PM SO2 NOX
500 kVA DGset of 2 nos. 4.5 0.2 170 11.5 0.01 0.041 0.044

F IA - 1
APPENDIX II
(See paragraph 6)
FORM-1 A (only for construction projects listed under item 8 of the Schedule)
CHECK LIST OF ENVIRONMENTAL IMPACTS
(Project proponents are required to provide full information and wherever necessaryattach explanatory notes with the Form and submit along with proposedenvironmental management plan & monitoring programme)
1. LAND ENVIRONMENT
(Attach panoramic view of the project site and the vicinity): Location Plan enclosed.
1.1. Will the existing land use get significantly altered from the project that is notconsistent with the surroundings? (Proposed land use must conform to the approvedMaster Plan / Development Plan of the area. Change of land use if any and thestatutory approval from the competent authority are submitted). Attach Maps of (i)site location, (ii) surrounding features of the proposed site (within 500 meters).
The site area is located in Vijayawada Guntur Tenali Urban development Authority(VGTUDA)/ Tadepalli Municipality. The present land use is Residential Apartmentsconstruction project. The location plan is enclosed.
1.2. List out all the major project requirements in terms of the land area, built up area,water consumption, power requirement, connectivity, community facilities, parkingneeds etc.
LAND ALLOCATION:Built Up Area Statement - Proposed
Land Use No of Floors Total No ofUnits
Total Site Areain m2
Total Built up area(m2)
Block - 1 S + 6 248 5427.3 30110.03Block - 2 S + 6 336 6691.3 40147.78Amenities (2 nos.) G+2 926.6 2779.52Green Area 5986.5Road Area 4820.3Open Area 5908.9ParkingStilt 16048.7Total 584 29760.9 89086.0

F IA - 2
COMMUNITY FACILITIES:
Amenities ProposedAmenity Nos. or descriptionGreen Area 5986.5 m2
DG Sets 500 kVA X 2 nos.Sewage Treatment Plant 1Garbage segregation point 1
PARKING NEEDS:Parking Space Provision of the Project
Floor 4 – Wheeler 2 - WheelerStilt 641 280Total 641 280
POWER REQUIREMENT:Electricity Consumption Statement
ELECTRICITY CONSUMPTION STATEMENT
S.No DescriptionNo. ofUnits Load in KW
TotalConnected
Load(KW)
TotalConnected
Load(kVA)
Total MaxDemand
(KVA)1 Block 1 & 2 584 4 2336.0 2920.0 2920.02 Street Lights 60 0.04 2.4 3.0 2.43 Amenities 178.2 222.7 178.24 STP 1 85 85.0 106.3 106.35 Lifts 8 15 120.0 150.0 150.0
TOTAL 2721.6 3402.0 3356.8Maximum demand in kw at 0.6 diversity factor 1632.9Consumption of power for 8 hours per day 13063.6Maximum demand in kw at 0.2 diversity factor 544.3Consumption of power for 16 hours per day 8709.0Total consumption of power per day 21772.6 KWTotal consumption of power per year 79.5 Lakh Units
Energy Saving by using Solar Water Heater
S.No Description No. ofUnits
Powerallocated inwatts / unit
Total powerrequired in
(KW)1 Block 230 2500 575
TOTAL 575Maximum demand in kw at 1 diversity factor 575

F IA - 3
Consumption of power for 2 hours per day 1150Maximum demand in kw at 0.4 diversity factor 230Consumption of power for 2 hours per day 460Total consumption of power per day 1610.0 KWTotal consumption of power per year 5.88 Lakh Units

F IA - 4
Energy saving by using Solar Street Lights
S.No Description No. ofUnits
Powerallocated inwatts / unit
Total powerrequired in
(KW)1 Street lights 20 40 0.8
TOTAL 0.8Maximum demand in kw at 0.6 diversity factor 0.5Consumption of power for 8 hours per day 4Maximum demand in kw at full load 0.8Consumption of power for 4 hours per day 3Total consumption of power per day 7.0 KWTotal consumption of power per year 0.03 Lakh Unitssaving with Solar Heater and Street Lighting 5.90 Lakh Units
Electrical Power savings using CFL for lighting
S.No Description Area inm2
Powerallocated inwatts / unit
Total powerrequired in
(KW)1 Residential 30110 8 2412 Common & Utilities 18828 1.5 28
TOTAL 269Maximum demand in kw at 0.9 diversity factor 242Consumption of power for 12 hours per day 2907Total consumption of power per day 2906.5 KWTotal consumption of power per year 10.61 Lakh UnitsSavings in power using CFL 3.18 Lakh Units
Savings in Electrical Power Consumption - SUMMARY
S.No Description WithCFL
With SolarHeater and
StreetLighting
TotalConsumption
Lakh unitsTotal Saving
1 Savings in lakhkwh units
3.18 5.9079.47
9.08
2 Savings inpercentage (%)
4.00 7.43 11.4

F IA - 5
WATER CONSUMPTION:Water Requirement of the Project
Land Use No. ofUnits
No. ofPersons/
unit
Waterrequirement per
person in l *
Total WaterRequirement
in KLDBlock 1 & 2 584 5 135 394.2Amenities 2 60 45 5.4Visitors 2 15 17.5TOTAL 417.1*Water requirement as per NBC
Water Savings Proposed
Land Use No. ofUnits
No. ofPersons/
unit
WaterRequirement/
KLD
Treated waterreuse/day Klpcd
Effective WaterRequirement in
KLDBlock 1 & 2 584 5 394.2 116.8 277.4Amenities 2 60 5.4 2.4 3.0Visitors 2 17.5 8.8 8.7TOTAL 417.1 128.0 289.1Note: Treated water reuse assumed @ 45l/head for Housing, and @ 20 l/head in
amenities.
Approximately 128 Kl/day water will be saved by adopting recycling of treated water inthe toilet flush. The effective water consumption is reduced by 128 Kl/day and therequirement will be in the order of 289.1 Kl/day.
Water Balance during occupation stageInput KLD Output KLDDomestic water fromGuntur Municipality 289.1
Excess treated water will besent to open drains 190.7
Recycled water 128.0 Recycled water 128.0Water requirement for greenbelt during non monsoon 15.0Losses approx 20% 83.4
Total 417.1 Total 417.1
The water used in the order of 417.1 KL/day would generate 333.7 KL/day ofwastewater, which has to be treated for reuse and or disposal.
1.3. What are the likely impacts of the proposed activity on the existing facilitiesadjacent to the proposed site? (Such as open spaces, community facilities, details ofthe existing land use and disturbance to the local ecology).
The local area is developed as residential plots. No major impact on the local ecology isanticipated.
F IA - 6
1.4. Will there are any significant land disturbance resulting in erosion, subsidence &instability? (Details of soil type, slope analysis, vulnerability to subsidence, Seismicityetc may be given).
a. Soil type: Sandy loam
b. Slope analysis: 15 meter slope towards the South direction.
c. Vulnerability to Subsidence: No subsidence is anticipated in plain terrain areas.
d. Seismicity: The site area is classified as Zone III as per the IMD.
1.5. Will the proposal involve alteration of natural drainage systems? (Give details ona contour map showing the natural drainage near the proposed project site)
No, the site area is 1.28 hectares only, and forms part of Guntur drainage system.
1.6. What are the quantities of earthwork involved in the construction activity cutting,filling, reclamation etc. (Give details of the quantities of earthwork involved, transportof fill materials from outside the site etc.)
Earth Work Quantities
S No AreaQty of fill
(m3) Qty of cut (m3)SurplusFill(m3) Surplus Cut(m3)
1 Site 12839 12839 --- ---
1.7 Give details regarding water supply, waste handling etc during the constructionperiod.
The water requirement during construction will be provided by the MangalagiriMunicipality. The water requirement of the project during occupation stage is in theorder of 417.1 KLD.
Construction debris like cement, sand, RCC, Aggregate, steel etc. are the wastegeneration during construction and these waste materials are used for roaddevelopment.
1.8. Will the low lying areas & wetlands get altered? (Provide details of how low lyingand wetlands are getting modified from the proposed activity)
-NO-
1.9. Whether construction debris & waste during construction cause health hazard?(Give quantities of various types of wastes generated during construction includingthe construction labour and the means of disposal).
Construction Debris
The construction debris consists of various types of materials. The construction debriswill be in both hazardous and non-hazardous categories. The hazardous debris consistsempty containers of adhesives, thinners, paints, and petroleum products. These emptycontainers will be sold to authorize recycling agencies. The non hazardous wastescontain recyclable debris like iron and other metal, glass, plastics, cartons of paper,wood etc. These wastes will be sent for reuse/recycle. The waste percentage will be

F IA - 7
in the order of 2%. Construction debris containing bricks, demolished RCC will be usedfor land filling in the place of sub grade.
2. WATER ENVIRONMENT
2.1. Give the total quantity of water requirement for the proposed project with thebreakup of requirements for various uses. How will the water requirement met? Statethe sources & quantities and furnish a water balance statement.
Water Requirement of the Project
Land Use No. ofUnits
No. ofPersons/
unit
Waterrequirement per
person in l *
Total WaterRequirement
in KLDBlock 1 & 2 584 5 135 394.2Amenities 2 60 45 5.4Visitors 2 15 17.5TOTAL 417.1*Water requirement as per NBC
Water Savings Proposed
Land Use No. ofUnits
No. ofPersons/
unit
WaterRequirement/
KLD
Treated waterreuse/day Klpcd
Effective WaterRequirement in
KLDBlock 1 & 2 584 5 394.2 116.8 277.4Amenities 2 60 5.4 2.4 3.0Visitors 2 17.5 8.8 8.7TOTAL 417.1 128.0 289.1Note: Treated water reuse assumed @ 45l/head for Housing, and @ 20 l/head in
amenities.
Approximately 128 Kl/day water will be saved by adopting recycling of treated water inthe toilet flush. The effective water consumption is reduced by 128 Kl/day and therequirement will be in the order of 289.1 Kl/day.
Water Balance during occupation stageInput KLD Output KLDDomestic water fromGuntur Municipality 289.1
Excess treated water will besent to open drains 190.7
Recycled water 128.0 Recycled water 128.0Water requirement for greenbelt during non monsoon 15.0Losses approx 20% 83.4
Total 417.1 Total 417.1
The water used in the order of 417.1 KL/day would generate 333.7 KL/day ofwastewater, which has to be treated for reuse and or disposal.

F IA - 8
2.2What is the capacity (dependable flow or yield) of the proposed source of water?
-NA-
2.3 What is the quality of water required, in case, the supply is not from a municipalsource? (Provide physical, chemical, biological characteristics with class of waterquality)
Water shall be drawn from the Tadepalli Municipality.
2.4 How much of the water requirement can be met from the recycling of treatedwastewater? (Give the details of quantities, sources and usage)
Water Savings Proposed
Land Use No. ofUnits
No. ofPersons/
unit
WaterRequirement/
KLD
Treated waterreuse/day Klpcd
Effective WaterRequirement in
KLDBlock 1 & 2 584 5 394.2 116.8 277.4Amenities 2 60 5.4 2.4 3.0Visitors 2 17.5 8.8 8.7TOTAL 417.1 128.0 289.1Note: Treated water reuse assumed @ 45l/head for Housing, and @ 20 l/head in
amenities.
Approximately 128 Kl/day water will be saved by adopting recycling of treated water inthe toilet flush. The effective water consumption is reduced by 128 Kl/day and therequirement will be in the order of 289.1 Kl/day.
2.5. Will there be diversion of water from other users? (Please assess the impacts ofthe project on other existing uses and quantities of consumption)
NO, the required water shall be drawn from Medikonduru Municipality .
2.6 What is the incremental pollution load from wastewater generated from theproposed activity? (Give details of the quantities and composition of wastewatergenerated from the proposed activity)
Characteristics of Waste waterParameter Quantity in mg/l
PH 6 – 7Total Suspended Solids 400 – 600BOD 200 – 300COD 450 – 500
2.7. Give details of the water requirements met from water harvesting? Furnishdetails of the facilities created.

F IA - 9
Storm watermanagementinvolves harvestingthrough rain waterharvestingstructures andstorage in stormwater storageponds. The waterfrom these sumpswill be reused afterprimary treatmenti.e., filtration fordomestic andgardeningrespectively. Theexcess water isdiverted to thestorm water drains.The rainwaterharvesting structureis presented below.
Rainwater Harvesting Structures
2.8. What would be the impact of the land use changes occurring due to the proposedproject on the runoff characteristics (quantitative as well as qualitative) of the area inthe post construction phase on a long term basis? Would it aggravate the problems offlooding or water logging in any way?
The impact of project on physiography is a function of the terrain of the area. It is mostdrastically altered in case of hilly terrain or where extensive cut-and-fill operations areinvolved. The project area has plain terrain and the design stage deliberations haveensured that the major contours are not disturbed. However the physiography impactwill be significant and non-reversible, as the contours of the area will be disturbed. Thecut and fill operations may cause air pollution, clogging of drains and solid waste fordisposal. The design stage has optimized the cut and fills operations and the excess cutmaterial is minimum and the same shall be reused for the construction purposes.
The project will have a positive impact on the soils and soil quality as housing projectwill have landscaping and the soils will be protected due to conservation.
During the occupation stage, compaction will not occur, and the compaction if any willbe restricted to road ROW. And the road ROW compaction cannot be said to be animpact of the operation stage as the pavement itself is a function of compacted baseand sub base.

F IA - 10
During the occupation stage, soil pollution due to garbage dumping at unauthorizedlocations may have temporary negative impact leading contamination of soil. Theaccidental spills or leaks are also a low probability incident.
The other major impact will be due to the increased run off and may have negativeimpact on the receiving body if the same is not properly managed. Impacts due tosurface runoff include increased soil erosion and local flooding or water logging. Hencethe project will be designed with adequate storm water drains and cross drainagestructures
2.9. What are the impacts of the proposal on the ground water? (Will there be tappingof ground water; give the details of ground water table, recharging capacity, andapprovals obtained from competent authority, if any)NA
2.10. What precautions/measures are taken to prevent the run-off from constructionactivities polluting land & aquifers? (Give details of quantities and the measures takento avoid the adverse impacts)
Construction activity is taken up only during non-monsoon season. There are no majordrains in the site. All material dumps shall be located away from the natural drains.Storm water drains shall be constructed before the construction of the buildings.
2.11. How is the storm water from within the site managed?(State the provisionsmade to avoid flooding of the area, details of the drainage facilities provided alongwith a site layout indication contour levels)Storm water drains will be provided all over the site to meet the expected increase inthe runoff during rainy seasons due to the impervious nature of the paved areas. Thesite is plain sloping towards east and it is proposed to maintain the levels as much aspossible.
Based on the catchment area, potential inflows and rainfall intensity determine thedrain size so as to minimize damage resulting from high intensity storms. Energydissipaters such as drop structures will be provided along the channel where runoffvelocities may become excessive.
Storm water drains:Conservation of water resource is most important aspect of the project duringconstruction and occupation phases. Storm water drainage planning, domestic waterplanning and sewerage transfer and sewage treatment planning are critical aspects ofconstruction and occupation stages of housing projects.
Storm water drains will be provided all over the site to meet the expected increase inthe runoff during rainy seasons due to the impervious nature of the paved areas. Thesite is uneven and it is proposed to maintain the levels as much as possible, hencestorm water outlets from the site are anticipated. The expected runoff is calculated forthe design of the storm water drains and presented in following table.

F IA - 11
CALCULATION FOR STORM WATER DRAIN:(a) With out project:Area of Catchment, ‘A’ : 2.9761 HaRun off Coefficient, ‘C’ : 0.6Maximum intensity of rainfall, ‘I’ : 40 mm/hrTherefore Q : 0.198 m3/sec
(b) With project: :Area for catchment for roof and road : 1.787 Ha
Area of Catchment, ‘A’ : 1.787 HaRun off Coefficient, ‘C’ : 0.9Maximum intensity of rainfall, ‘I’ : 40 mm/hrTherefore Q = : 0.179 m3/sec
Area for catchment for open areas : 1.190 HaRun off Coefficient, ‘C’ : 0.6Maximum intensity of rainfall, ‘I’ : 40 mm/hrTherefore Q = : 0.079 m3/secTotal Discharge : 0.258 m3/secBut, Discharge, Q = A/V :Where, :A= Area of the Drain, :V= Max. Permissible Velocity : 6 m/sec for concrete drain
Area of drain, ‘A’ = Q/V : 0.043 m2
Taking depth of drain as 0.6 m at the startingpoint : 0.6Width of drain = Area/depth = 0.072 m 72 mm
Width of the drain is to taken 35 mm and depth varies according to the slope of ground.
Storm water Management
Land Use Area inHectares
Vol./hr(KL) after
development C=0.8
Vol./hr(KL)
beforedevelopment C=0.6
Difference in
Discharges
Remarks
Roof Area 0.61 193.9 145.4 48.5Harvested in 2 nos. of
Storm water storage sumpsof capacity 30 m3 each.
Road Area 0.27 85.7 64.3 21.4 24 nos. of RWH pits areprovided of size
1.5m x 1.5m x 2.0 mOpen Area 0.41 48.9 97.8 -48.9TOTAL 1.28 21.0

F IA - 12
2.12. Will the deployment of construction laborers particularly in the peak period leadto unsanitary conditions around the project site (Justify with proper explanation)No, Temporary toilet facilities shall be provided and the same shall be connected toseptic tank followed by sewer lines.
2.13 What on-site facilities are provided for the collection, treatment & safe disposalof sewage? (Give details of the quantities of wastewater generation, treatmentcapacities with technology & facilities for recycling and disposal)
SEWAGE TREATMENT PLANTIt is proposed to provide a sewage treatment plant with a capacity of 400 KLD. The unitoperations of the treatment system are presented below: Sewage treatment plantbased on Fluidized Aerobic Bio Reactor (FAB) technology
PROCESS DESCRIPTION:The raw sewage will be collected in a collection sump and pumped to mechanical barscreen chamber for removal of large floating matter followed by grit removal in GritChamber. The raw sewage will then be collected in an equalization tank forhomogenization of hydraulic load. The tank contents will be kept in suspension bymeans of course bubble serration through pipe grid. The equalization tank, with airflow indicator for continuous monitoring of air supply to the tank in order to avoidseptic conditions, will be covered from top (RCC or FRP) to avoid nuisance. Theequalized effluent will then be pumped to two Fluidized Aerobic Bio Reactors (FAB) inseries where BOD/COD reduction can be achieved by virtue of aerobic microbialactivities. The oxygen required will be supplied through coarse air bubble diffusers.The bio-solids formed in the biological process will be separated in the down streamTube Settler. The clear supernatant will gravitate to the chlorine contact tank wheresodium hypochlorite will be dosed for disinfection of treated water prior to disposal.
The biological sludge generated in the FAB and settled in the tube settlers will becollected in a sludge sump and then pumped to sludge drying bed for de watering. Thedried sludge will then be disposed off suitably as manure. The schematics of theprocess are shown. The two main components of the treatment system viz. The FABreactor and tube settler are described in the following sections.
Fluidized Aerobic Bio Reactor (FAB)Conventional effluent treatment plants are large sized, power intensive and require alot of monitoring. Scarcity of open space and rising land a power costs have forced theindustries to look our for space saving, compact and efficient treatment options. Thishas led to the development attached growth processes where the bio mass is retainedwithin the aeration tank obviating the need for recycle. These plants are not onlycompact but also user friendly. The endeavor to have a continuously operating, no-clogging biofilm reactor with no need for back washing, low head-loss and high specificbiofilm surface area culminated in the most advanced technology of aerobic biologicalfluidized bed treatment where the biofilm (biomass) grows on small carrier elementsthat move along with the water in the reactor. The movement is normally caused byaeration in the aerobic version of the reactor.

F IA - 13
The reactor combines all the advantages and best features of Trickling filters, Rotatingbiological contractors, activated sludge process and submerged fixed film reactors whileeliminating the drawbacks of these systems. The plants are more compact and moreenergy efficient.
The Fluidized Aerobic Bio Reactor (FAB) consists of a tank in any shape filled up withsmall carrier elements. The elements are made up of special grade PVC orpolypropylene of controlled density (shown in plate). For media of specific gravity 0.92-0.96 the overall density could be expected to increase up to 9.5% when full of biomasssuch that they can fluidize using an aeration device. A biofilm develops on theelements, which move along the effluent in the reactor. The movement within thereactor is generated by providing aeration with the help of diffusers placed at thebottom of the reactor. Then thin biofilm on the elements enables the bacteria to actupon the biodegradable matter in the effluent and reduce the BOD/COD content in thepresence of oxygen available from the air that is used for fluidization.
Characteristics of Waste waterParameter Quantity in mg/l
PH 6 – 7Total Suspended Solids 200 – 400BOD 200 – 300COD 350 – 450
Design of the unitBasic dataFlow : 333 KLDCapacity : 400 m3
Peak factor : 3.5Peak flow Q peak : 1575 m3/dayInfluent BOD : 200 mg/litInfluent Suspended Solids : 200 mg/litInfluent COD : 350 mg/litEffluent BOD : 30 mg/litEffluent COD : 200 mg/litEffluent Suspended Solids : 100 mg/lit
1. Bar Screen ChamberAverage flow : 0.0052 m3/secPeak factor : 3.5Peak flow : 0.018 m3/secVelocity at peak flow : 0.75 m/SecEffective area of screen RequiredAt average flow : 0.017 m2
At Peak flow : 0.024 m2

F IA - 14
Provide Effective area of screen : 0.024 m2
Considering the bar of dia. 10 mm(w) and clear spacing of 20 mm (b)Overall area required : 0.036 m2
Considering screen depth as : 0.5 mNumber of clear spacing : 1.8Number of bars : 2 Consider 4 Nos.Hence Provide 5 barsProvide a screen of 0.5 m X 0.5 m at an inclination of sin 600. In a screen channel of onemeter (1 m) length.
2. Grit Chamber :The flow from the bar screen chamber is let into the Grit Chamber of minimum 2 hourscapacity. This tank is provided to even out the flow variation, and to provide acontinuous feed into the secondary biological treatment units.Peak flow Q : 0.018 m3/secProviding a flow through velocity of 0.30 m/secCross sectional area of Channel (0.018/0.3) : 0.06 m2
Surface area of channel (0.018/0.013) : 1.3 m2
Assuming depth d : 0.2 mWidth of channel (0.06/0.2) : 0.3 m (say 0.3m)Length of channel (1.3/0.3) : 4.3 m (say 4.3 m)Provide two channels each of 0.2 m wide and 4.3 m long with depth of waste water 0.2m.
3. Equalization tank:The flow from the bar screen chamber is let into the equalization tank of minimum2hours capacity. This tank is provided to even out the flow variation, and to provide acontinuous feed into the secondary biological treatment units.Average flow : 18.75 m3/hrPeak factor : 3.5Peak flow : 65.6 m3/hrHydraulic retention tank = 2 hrs at Peak flowHence required volume of the tank : 131.25 m3
Provide tank of : 131.25 m3 CapacityAssuming depth : 5 mArea : 26.25 m2
Assuming length to width ratio (1:1) ; l=blength of the tank : 5.1 mwidth of the tank : 5.1 mAir required for agitation : 0.01 m3/ m2 minTotal air required : 78.75 m3/hrAir blower required : 100 m3/hr @ 3.8 mwc

F IA - 15
Effluent transfer pump : 18.75 m3/hr @ 8 mwc
4. Fluidized Aerobic Bio Reactor (FAB):The polypropylene media have been provided with a specific surface area of 350 – 520m2 /m3. This allows micro-organisms to get attached and biomass concentration canbe increased to four folds as compared to Activated Sludge Process. This enables toconsider higher Organic loading rates.
The micro-organisms attached to media are kept in a fluid state thereby maintainingthe CSTR (continuous Stirrer tank reactor) regime as well as two tanks are provided inseries making the plug – flow system. This will enhance the efficiencies and have themerits of both CSTR and plug-flow regimes.Organic loading rate : 3.2 kg BOD/ m3 dOrganic load : 90 kg/dayVolume of the tank : 28.12 m3
Assume the depth : 5 mNo. of tanks in series : 2Size of the tank : 2.6 m dia. x 5.0 SWDSpecific gravity of media : 0.92 to 0.96Specific surface area of media : 350 – 520 m2 /m3
Media filling : 30 – 50 % of tank volumeOxygen required : 2 kg / kg BODOxygen in air : 23%Specific gravity of air @ 30 deg. : 1.65Aeration : Coarse bubbleOxygen transfer efficiency : 12%Air required : 116.6 m3/hrAir blower required : 150 m3/hr @ 6.5 m wc
5.Tube settlerSurface loading rate : 48 m2 /m3 dSurface area required : 9.37 m2
Tank size :3.0 m x 6.0 m x 2.7 m SWD With55 deg. hopper bottom
Tube Modules : 3.0m x 6.0 m x 0.6 m ht.Tube inclination : 60 deg.Settling area for 60 deg slope : 11 m2 /m3
Cross sectional area of tubes : 120 mm x 44 mm HexagonalHydraulic radius : 1/61 cm (1.5 cm)Shape factor
:0.6 – 0.7 for media settleablesolids

F IA - 16
6. Pre Filtration tankThe flow from the each individual settling tank i.e., the supernatant liquid is let into therespective Pre-Filtration Tank, which has a minimum 1.5 hours holding capacity. Thistank is provided to hold the treated effluent and give an even flow to the pressure sandfilter.Average flow : 18.75 m3/hrPeak factor : 2 m3/hrPeak flow : 37.5 m3/hrProvide min 1.5 hours holding capacity.Hence required volume of the tank : 56.25 m3
7. Pressure Sand Filter:Vertical down flow type with graded/sand bed under drain plate with polysterenestrains.Flow : 400 m3/dayRate of filtration assumed as : 10 m3/m2/hrRequirement of treated water for usage in 20hrs : 22.5 m3/hrDia. of filter of 1 nos. : 1692 mmProvide pressure sand filter of 1700 mm dia. and 2100 mm HOS with sand as medialayer, under drain pipe, laterals face piping etc for each stream.
8. Activated Carbon Filter:Vertical down flow type with graded/sand bed under drain plate with polysterenestrains.Flow : 400 m3/dayRate of filtration assumed as : 10 m3/m2/hrRequirement of treated water for usage in 20hrs : 22.5 m3/hrDia of filter of 1 nos. : 1692 mmProvide Activated Carbon filter of 1700 mm dia with granular Activated carbon asmedia and 2100 mm HOS with sand as media layer, under drain pipe, laterals facepiping etc for each stream.
9.Ultraviolet Disinfection:UV applied to low turbidity water is a highly effective means of disinfection. UV is notharmful to aquatic organisms in the receiving water. UV light kills viruses, Vegetative-and spore-forming bacteria, algae and yeasts. No chemicals are added to thewastewater to change the pH, conductivity, odor or taste to create possible toxiccompounds. UV treatment has a few moving parts to adjust or wear out.
10.Final Treated Water Holding TankIt is always preferred to provide one final holding tank of minimum one day holding
F IA - 17
capacity, so that the treated effluents can be stored and used back for gardening orother tertiary purposes.Capacity: 400 m3
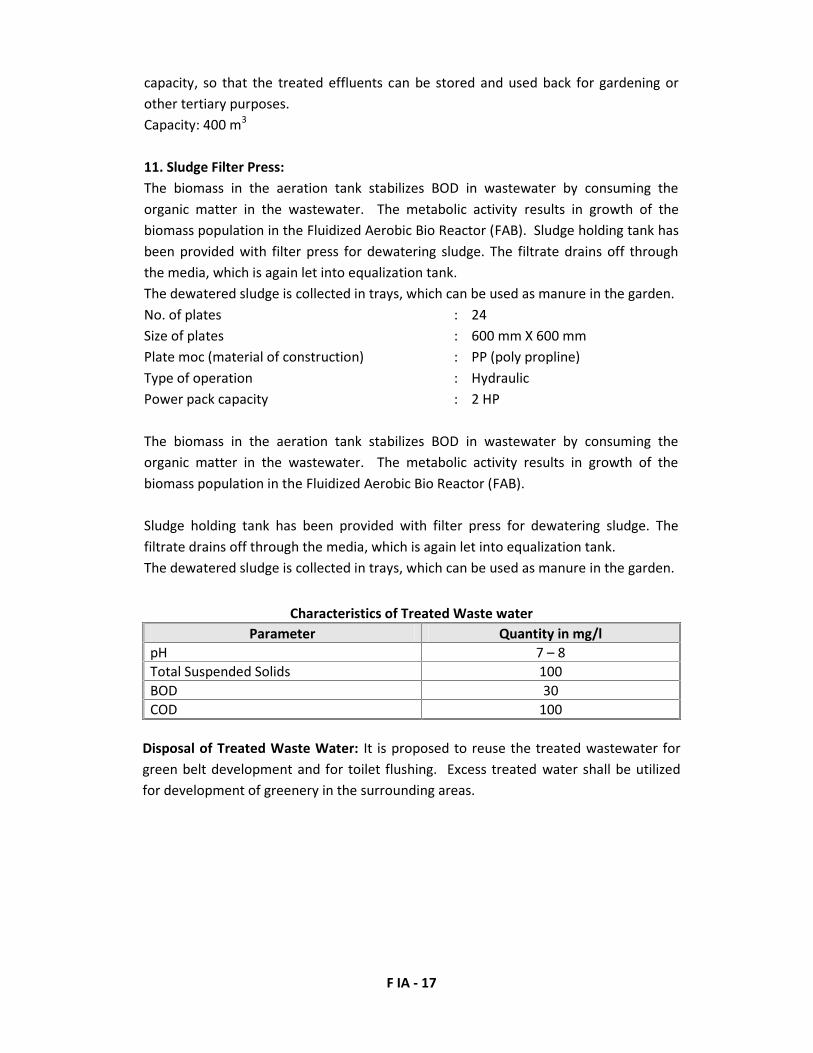
11. Sludge Filter Press:The biomass in the aeration tank stabilizes BOD in wastewater by consuming theorganic matter in the wastewater. The metabolic activity results in growth of thebiomass population in the Fluidized Aerobic Bio Reactor (FAB). Sludge holding tank hasbeen provided with filter press for dewatering sludge. The filtrate drains off throughthe media, which is again let into equalization tank.The dewatered sludge is collected in trays, which can be used as manure in the garden.No. of plates : 24Size of plates : 600 mm X 600 mmPlate moc (material of construction) : PP (poly propline)Type of operation : HydraulicPower pack capacity : 2 HP
The biomass in the aeration tank stabilizes BOD in wastewater by consuming theorganic matter in the wastewater. The metabolic activity results in growth of thebiomass population in the Fluidized Aerobic Bio Reactor (FAB).
Sludge holding tank has been provided with filter press for dewatering sludge. Thefiltrate drains off through the media, which is again let into equalization tank.The dewatered sludge is collected in trays, which can be used as manure in the garden.
Characteristics of Treated Waste waterParameter Quantity in mg/l
pH 7 – 8Total Suspended Solids 100BOD 30COD 100
Disposal of Treated Waste Water: It is proposed to reuse the treated wastewater forgreen belt development and for toilet flushing. Excess treated water shall be utilizedfor development of greenery in the surrounding areas.

F IA - 18
Sewage Treatment Flow Diagram
SEW
AG
E TR
EATM
ENT
PLA
NT
FLU
IDIZ
ED A
ERO
BIC
BIO
REA
CTO
R TE
CHN
OLO
GY
(FA
B)
Slud
geD
ewat
erin
gSy
stem
EQT
TAN
K
ACF
BarS
cree
n/ G
rit
Cham
ber
Raw
Sew
age
Ove
rflo
w
Filte
r Fee
dPu
mp
(1W
+1S)
Slud
geD
ispo
sal
SLU
DG
EH
OLD
ING
TA
NK
CLA
RIFI
EDW
ATER
TAN
K
FAB
REA
CTO
R(P
acka
ge u
nit)
TUBE
Sett
lers
19
PSF
TREA
TED
WAT
ERTA
NKUV
To R
euse
Exce
ss d
isch
arge
dto
ext
erna
l dra
ins

F IA - 19
2.14. Give details of dual plumbing system if treated waste used is used for flushing oftoilets or any other use.Dual plumbing system is used for toilet flushing. Separate tank is provided to store thetreated water; the tank shall be 1 foot below the over head tank. Separate pipe systemis provided to pump the treated water for flushing. All the treated water pipelines shallbe colored blue.
3. VEGETATION
3.1. Is there any threat of the project to the biodiversity? (Give a description of thelocal ecosystem with its unique features, if any)
No, the local biodiversity will improve as development of green area is part of theproposal.
3.2. Will the construction involve extensive clearing or modification of vegetation?(Provide a detailed account of the trees & vegetation affected by the project)
No, the site area has no major trees and is covered mainly with shrubs.
3.3. What are the measures proposed to be taken to minimize the likely impacts onimportant site features (Give details of proposal for tree plantation, landscaping,creation of water bodies etc along with a layout plan to an appropriate scale).
The landscape area is 5986.5 m2. The plantation list is presented in the following table
S. No Names of trees1 Filicum Decipiens2 Mimusops Elengi3 Filicum Decipiens4 Cassia Fistula5 Delonix Regia6 Alstonia Scholaris7 Ficus Benjamina8 Kigelia Pinnata9 Tabebuia Rosea
10 Anthocephalus Chinensis11 Ficus panda12 Tabernaemontana coronaria
4. FAUNA
4.1. Is there likely to be any displacement of fauna- both terrestrial and aquatic orcreation of barriers for their movement? Provide the details.
-NO-
4.2. Any direct or indirect impacts on the avifauna of the area? Provide details.
-No major impact envisaged. However the proposed plantaion shall help in providingnesting space for the avifauna.
F IA - 20
4.3. Prescribe measures such as corridors, fish ladders etc to mitigate adverse impactson fauna.
-NA-
5. AIR ENVIRONMENT
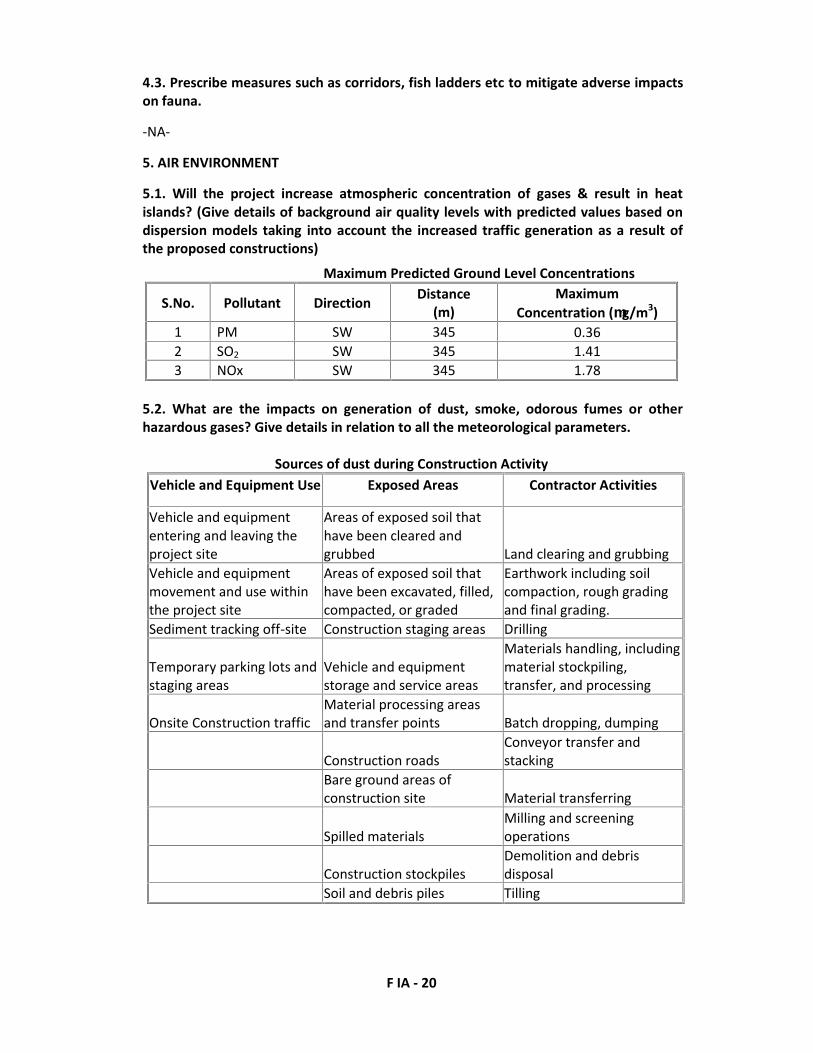
5.1. Will the project increase atmospheric concentration of gases & result in heatislands? (Give details of background air quality levels with predicted values based ondispersion models taking into account the increased traffic generation as a result ofthe proposed constructions)
Maximum Predicted Ground Level Concentrations
S.No. Pollutant Direction Distance(m)
MaximumConcentration (g/m3)
1 PM SW 345 0.362 SO2 SW 345 1.413 NOx SW 345 1.78
5.2. What are the impacts on generation of dust, smoke, odorous fumes or otherhazardous gases? Give details in relation to all the meteorological parameters.
Sources of dust during Construction ActivityVehicle and Equipment Use Exposed Areas Contractor Activities
Vehicle and equipmententering and leaving theproject site
Areas of exposed soil thathave been cleared andgrubbed Land clearing and grubbing
Vehicle and equipmentmovement and use withinthe project site
Areas of exposed soil thathave been excavated, filled,compacted, or graded
Earthwork including soilcompaction, rough gradingand final grading.
Sediment tracking off-site Construction staging areas Drilling
Temporary parking lots andstaging areas
Vehicle and equipmentstorage and service areas
Materials handling, includingmaterial stockpiling,transfer, and processing
Onsite Construction trafficMaterial processing areasand transfer points Batch dropping, dumping
Construction roadsConveyor transfer andstacking
Bare ground areas ofconstruction site Material transferring
Spilled materialsMilling and screeningoperations
Construction stockpilesDemolition and debrisdisposal
Soil and debris piles Tilling
F IA - 21
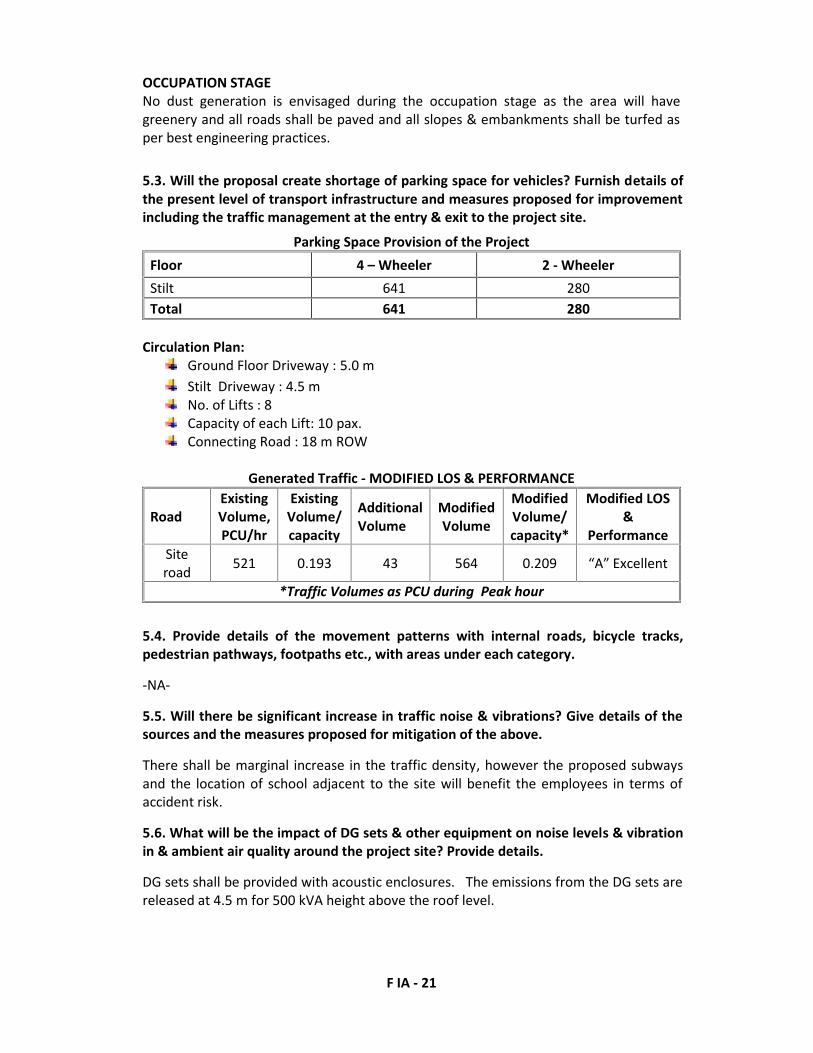
OCCUPATION STAGENo dust generation is envisaged during the occupation stage as the area will havegreenery and all roads shall be paved and all slopes & embankments shall be turfed asper best engineering practices.
5.3. Will the proposal create shortage of parking space for vehicles? Furnish details ofthe present level of transport infrastructure and measures proposed for improvementincluding the traffic management at the entry & exit to the project site.
Parking Space Provision of the ProjectFloor 4 – Wheeler 2 - WheelerStilt 641 280Total 641 280
Circulation Plan:Ground Floor Driveway : 5.0 mStilt Driveway : 4.5 mNo. of Lifts : 8Capacity of each Lift: 10 pax.Connecting Road : 18 m ROW
Generated Traffic - MODIFIED LOS & PERFORMANCE
RoadExistingVolume,PCU/hr
ExistingVolume/capacity
AdditionalVolume
ModifiedVolume
ModifiedVolume/capacity*
Modified LOS&
PerformanceSiteroad 521 0.193 43 564 0.209 “A” Excellent
*Traffic Volumes as PCU during Peak hour
5.4. Provide details of the movement patterns with internal roads, bicycle tracks,pedestrian pathways, footpaths etc., with areas under each category.
-NA-
5.5. Will there be significant increase in traffic noise & vibrations? Give details of thesources and the measures proposed for mitigation of the above.
There shall be marginal increase in the traffic density, however the proposed subwaysand the location of school adjacent to the site will benefit the employees in terms ofaccident risk.
5.6. What will be the impact of DG sets & other equipment on noise levels & vibrationin & ambient air quality around the project site? Provide details.
DG sets shall be provided with acoustic enclosures. The emissions from the DG sets arereleased at 4.5 m for 500 kVA height above the roof level.

F IA - 22
6. AESTHETICS
6.1. Will the proposed constructions in any way result in the obstruction of a view,scenic amenity or landscapes? Are these considerations taken into account by theproponents?
-NO-, the proposal includes a noise berm along the highway adjacent to the site whichshall be planted with trees to act as an aesthetic amenity in addition to mitigation ofnoise levels.
6.2. Will there be any adverse impacts from new constructions on the existingstructures? What are the considerations taken into account?
-No adverse impacts are anticipated-
6.3. Whether there are any local considerations of urban form & urban designinfluencing the design criteria? They may be explicitly spelt out.
The layout plan is on the basis of Development rules prescribed VGTUDA
6.4. Are there any anthropological or archaeological sites or artefacts nearby? State ifany other significant features in the vicinity of the proposed site have beenconsidered.
-NO-
7. SOCIO-ECONOMIC ASPECTS
7.1. Will the proposal result in any changes to the demographic structure of localpopulation? Provide the details.
-NO-
7.2 Give details of the existing social infrastructure around the proposed project.
School: 2.0 Km from site
Community Centers: with in 1 km from site
Bus Stops: 1.0 km from site
Railway station: 2.7 Km from site
Temples/church/mosque: a number of them within 1.5 km radius of the site.
7.3. Will the project cause adverse effects on local communities, disturbance to sacredsites or other cultural values? What are the safeguards proposed?
-NO-

F IA - 23
8. BUILDING MATERIALS
8.1. May involve the use of building materials with high-embodied energy. Are theconstruction materials produced with energy efficient processes? (Give details ofenergy conservation measures in the selection of building materials and their energyefficiency)
Material Consumption for Total Units
UnitsBUA perunit in(m2)
TotalReady MixConcrete
(m3)
TotalCement(bags)
TotalSand(m3)
TotalAggregate(m3)
TotalWater(m3)
TotalBricks(Nos) x1000
TotalReinforcement
Steel(MT)
Total BUA 89086 36525 82850 34744 3831 21559 10334 2049Total 89086 36525 82850 34744 3831 21559 10334 2049
8.2. Transport and handling of materials during construction may result in pollution,noise & public nuisance. What measures are taken to minimize the impacts?
All materials shall be transported during non peak hours. Sand and aggregate arecovered during transportation. Noise generating construction activity shall not be takenup during night times, adjacent to the residential area.
8.3. Are recycled materials used in roads and structures? State the extent of savingsachieved?
Excess cut material shall be reused for road construction.
8.4. Give details of the methods of collection, segregation & disposal of the garbagegenerated during the operation phases of the project.
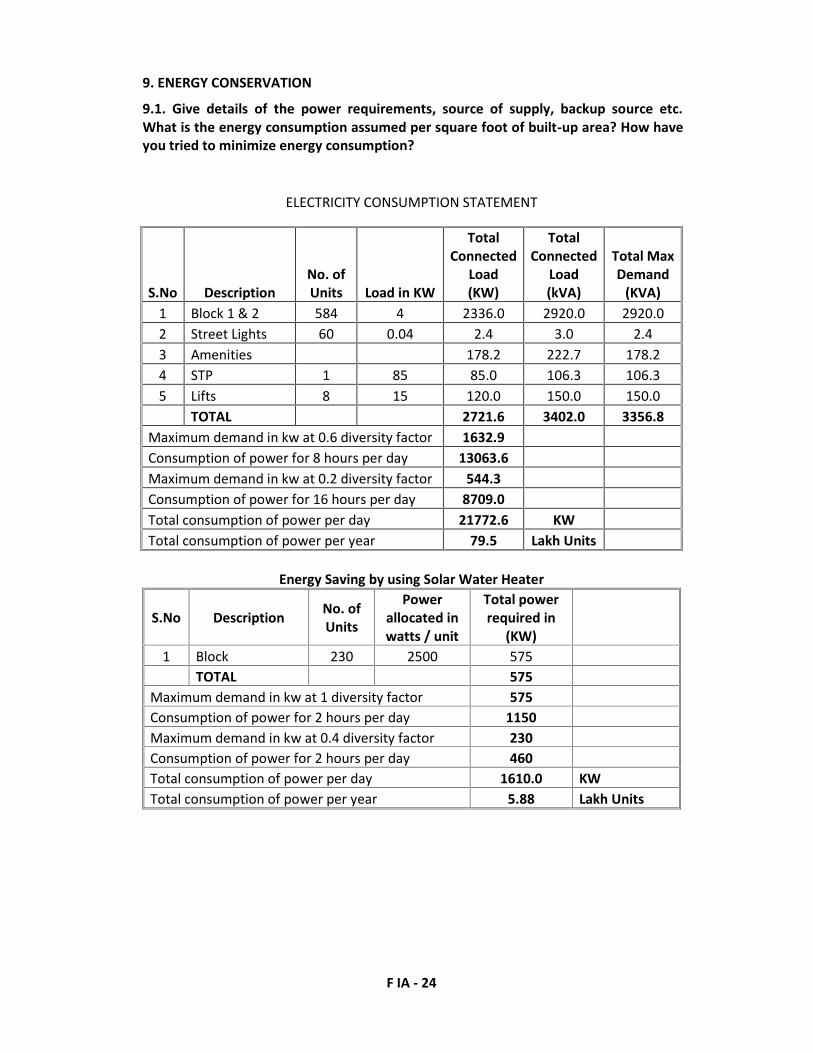
F IA - 24
9. ENERGY CONSERVATION
9.1. Give details of the power requirements, source of supply, backup source etc.What is the energy consumption assumed per square foot of built-up area? How haveyou tried to minimize energy consumption?
ELECTRICITY CONSUMPTION STATEMENT
S.No DescriptionNo. ofUnits Load in KW
TotalConnected
Load(KW)
TotalConnected
Load(kVA)
Total MaxDemand
(KVA)1 Block 1 & 2 584 4 2336.0 2920.0 2920.02 Street Lights 60 0.04 2.4 3.0 2.43 Amenities 178.2 222.7 178.24 STP 1 85 85.0 106.3 106.35 Lifts 8 15 120.0 150.0 150.0
TOTAL 2721.6 3402.0 3356.8Maximum demand in kw at 0.6 diversity factor 1632.9Consumption of power for 8 hours per day 13063.6Maximum demand in kw at 0.2 diversity factor 544.3Consumption of power for 16 hours per day 8709.0Total consumption of power per day 21772.6 KWTotal consumption of power per year 79.5 Lakh Units
Energy Saving by using Solar Water Heater
S.No Description No. ofUnits
Powerallocated inwatts / unit
Total powerrequired in
(KW)1 Block 230 2500 575
TOTAL 575Maximum demand in kw at 1 diversity factor 575Consumption of power for 2 hours per day 1150Maximum demand in kw at 0.4 diversity factor 230Consumption of power for 2 hours per day 460Total consumption of power per day 1610.0 KWTotal consumption of power per year 5.88 Lakh Units
MUNICIPALITY
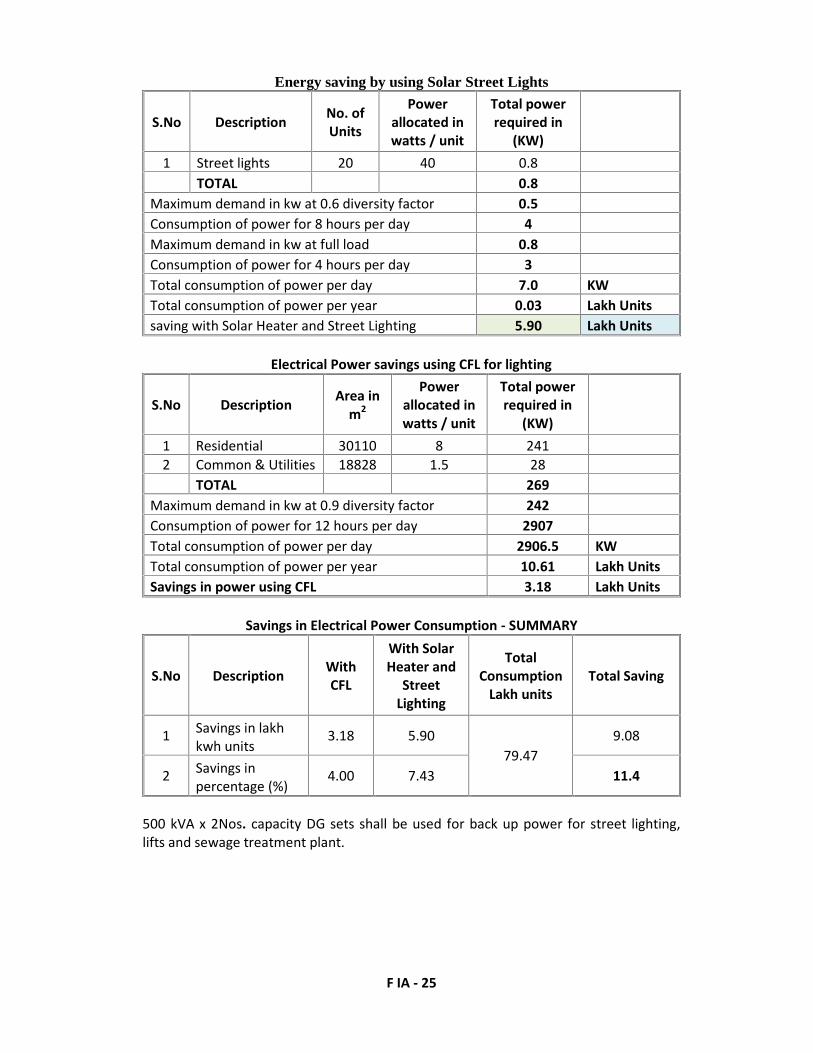
F IA - 25
Energy saving by using Solar Street Lights
S.No Description No. ofUnits
Powerallocated inwatts / unit
Total powerrequired in
(KW)1 Street lights 20 40 0.8
TOTAL 0.8Maximum demand in kw at 0.6 diversity factor 0.5Consumption of power for 8 hours per day 4Maximum demand in kw at full load 0.8Consumption of power for 4 hours per day 3Total consumption of power per day 7.0 KWTotal consumption of power per year 0.03 Lakh Unitssaving with Solar Heater and Street Lighting 5.90 Lakh Units
Electrical Power savings using CFL for lighting
S.No Description Area inm2
Powerallocated inwatts / unit
Total powerrequired in
(KW)1 Residential 30110 8 2412 Common & Utilities 18828 1.5 28
TOTAL 269Maximum demand in kw at 0.9 diversity factor 242Consumption of power for 12 hours per day 2907Total consumption of power per day 2906.5 KWTotal consumption of power per year 10.61 Lakh UnitsSavings in power using CFL 3.18 Lakh Units
Savings in Electrical Power Consumption - SUMMARY
S.No Description WithCFL
With SolarHeater and
StreetLighting
TotalConsumption
Lakh unitsTotal Saving
1 Savings in lakhkwh units
3.18 5.9079.47
9.08
2 Savings inpercentage (%)
4.00 7.43 11.4
500 kVA x 2Nos. capacity DG sets shall be used for back up power for street lighting,lifts and sewage treatment plant.

F IA - 26
9.2. What type of, and capacity of, power back-up to you plan to provide?
Details of DG Set emissionsStack
connectedto DG setcapacity
Heightm
Diam
Temp. ofExhaustGases(OC)
Velocitym/sec
Pollutant EmissionRate (g/Sec)
SPM SO2 NOX
500 kVA DGset of 2 nos. 4.5 0.2 170 11.5 0.02 0.041 0.044
9.3. What are the characteristics of the glass you plan to use? Provide specifications ofits characteristics related to both short wave and long wave radiation?
The façade is not made of glass, and the glass requirement is only for windows. Theglass characteristics are presented as follows;
Characteristics of Glass utilized.Normal Anti-firing type
See through(SE) Non-see-through(NS) SE NS
Nominal thickness 6 8 10 6 10 9.8 9.8
StructureOut glass FL3 FL4 FL5 G3 G5 PWN 6.8 GWN 6.8vacuum 0.2 0.2 0.2 0.2 0.2 0.2 0.2In glass Low-E 3 Low-E 4 Low-E 5 Low-E 3 Low-E 3 Low-E 3 Low-E 3
VisibleTL(%) 75.5 74.6 73.8 75.5 73.8 72.4 72.4RL(%) 15.9 15.8 15.6 15.9 15.6 16.8 16.8
SolarTS(%) 62.6 60.1 57.8 62.6 57.8 56.9 56.9RS(%) 14.1 13.6 13.2 14.1 13.2 14.2 14.2AS(%) 23.3 26.3 29.0 23.3 29.0 28.9 28.9
Solar heat gain 0.76 0.74 0.72 0.69 0.66 0.69 0.63Thermalinsulatio
n
(W/m2K)(kcal/m2hrC
)
1.5 1.5 1.5 1.5 1.5 1.5 1.5
1.3 1.3 1.3 1.3 1.3 1.3 1.3
Sound reduction(JIS grade) 30 30 30 30 30 35 35
Maximum size(mm)Minimum size(mm)
2,400 x 1,350350 x 200
1,800 x1,200350 x 200
L M350 x 200
9.4. What passive solar architectural features are being used in the building? Illustratethe applications made in the proposed project.
The width to height ratio between the apartment blocks is around 1:1.5 which isachieved as per the development control rules.
All window openings is provided with chajjas depth as specified by the designstandards (around 300mm)
The full height openings have been designed for better lighting in theapartments units. For climatic considerations, all these openings are placed next

F IA - 27
to a balcony/sit out space which acts as a buffer by eliminating the directlighting and thereby avoiding heat ingress.
Use of Large fenestration in buildings reduces the use of mechanical light energyduring daytime thereby reducing the energy consumption.
9.5. Does the layout of streets & buildings maximize the potential for solar energydevices? Have you considered the use of street lighting, emergency lighting and solarhot water systems for use in the building complex? Substantiate with details.
Solar power shall be used for the street lights and fencing.
9.6. Is shading effectively used to reduce cooling/heating loads? What principles havebeen used to maximize the shading of Walls on the East and the West and the Roof?How much energy saving has been effected?
Yes.
9.7. Do the structures use energy-efficient space conditioning, lighting and mechanicalsystems? Provide technical details. Provide details of the transformers and motorefficiencies, lighting intensity and air-conditioning load assumptions? Are you usingCFC and HCFC free chillers? Provide specifications.
Building Materials The building materials chosen for the landed and apartment units are as per the
recommendations of the climatic standards. To achieve the maximum energy value, a balance between the availability of
building materials locally and skilled labourers is achieved. Burnt brickwork with fly ash for the walling and plastering reduces the thermal
penetration by 20-30%. The RCC roof is covered with Brickbat concrete and terracotta weather tiles,
which reduces the heat penetration by 18%.
Colour of Facades The colour choice for the buildings uses a maximum of white surface (nearly
84%). This increases the solar reflectivity factor. Emittance factor for white surfaces is around 90% compared to coloured
surface (20-60%) 16% of wall area uses earthen colours and this space has longer thermal storage
in the walls. This creates a comfortable temperature at nights due to the thickerwalls designed.
Heat Absorbance of the brick used for building is around 50%. The roof of the units (if not covered with terrace garden) is painted white to
have a maximum reflectivity. The R-factor (resistance factor) for the roof with brickbats and white painted is
nearly 40% more as compared to the recommended standards.

F IA - 28
9.8. What are the likely effects of the building activity in altering the microclimates?Provide a self-assessment on the likely impacts of the proposed construction oncreation of heat island & inversion effects?
Green RoofsGreen roofs are an attractive roofing option that can reduce urban heat islands byproviding shade and through evapotranspiration, the release of water from plants tothe surrounding air. The benefits of green roofs include:
Reduce sewage system loads by assimilating large amounts of rainwater. Absorb air pollution, collect airborne particulates, and store carbon. Protect underlying roof material by eliminating exposure to the sun's ultraviolet
(UV) radiation and extreme daily temperature fluctuations. Serve as living environments that provide habitats for birds and other small
animals. Offer an attractive alternative to traditional roofs, addressing growing concerns
about urban quality of life. Reduce noise transfer from the outdoors. Insulate a building from extreme temperatures, mainly by keeping the building
interior cool in the summer.
9.9. What are the thermal characteristics of the building envelope? (a) Roof; (b)External walls; and (c) Fenestration? Give details of the material used and the U-values or the R-values of the individual components.
Building envelop thermal propertiesMax U factor( w/Sq.m-DegC) Min R factor Sq.m_DegC/W)
Roof 0.261 R 3.5Opaque Wall 0.44 R 2.1
Vertical Fenestration Max U factor( w/Sq.m-DegC)
Max SHGC for WWR less than orequal to 40%
3.3 0.25Min VLT 0.2 for WWR upto 40%
9.10. What precautions & safety measures are proposed against fire hazards? Furnishdetails of emergency plans.
-NA-
9.11. If you are using glass as wall material provides details and specificationsincluding emissivity and thermal characteristics.
-No-
9.12. What is the rate of air infiltration into the building? Provide details of how youare mitigating the effects of infiltration.
4 A changes = 4.
F IA - 29
9.13. To what extent the non-conventional energy technologies are utilized in theoverall energy consumption? Provide details of the renewable energy technologiesused.
-Nil-
10. ENVIRONMENT MANAGEMENT PLAN
The Environment Management Plan would consist of all mitigation measures for eachitem wise activity to be undertaken during the construction, operation and the entirelife cycle to minimize adverse environmental impacts as a result of the activities of theproject. It would also delineate the environmental monitoring plan for compliance ofvarious environmental regulations. It will state the steps to be taken in case ofemergency such as accidents at the site including fire.
Furnished in EIS/EMP report.

SAI PARADISEM/s ANUBANDANA INFRATECH PRIVATE LIMITED
SURVEY NOS. 575, 576, 599, PERECHERLA,MEDIKONDURU MANDAL, GUNTUR DISTRICT,
ANDHRA PRADESH
Studies and Documentation by:Team Labs and Consultants(An ISO Certified Organization)B-115 – 117 & 509, Annapurna Block,Aditya Enclave, Ameerpet,Hyderabad- 500 038Phone: 91-040-23748555/23748616Fax : 91-040-23748666e-mail: [email protected]