
SAFA: Semi-automated footprinting analysis software for high … · 2015-06-16 · METHOD SAFA:...
12
10.1261/rna.7214405 Access the most recent version at doi: 2005 11: 344-354 RNA RHIJU DAS, ALAIN LAEDERACH, SAMUEL M. PEARLMAN, et al. experiments high-throughput quantification of nucleic acid footprinting SAFA: Semi-automated footprinting analysis software for References http://rnajournal.cshlp.org/content/11/3/344.full.html#related-urls Article cited in: http://rnajournal.cshlp.org/content/11/3/344.full.html#ref-list-1 This article cites 38 articles, 12 of which can be accessed free at: service Email alerting click here top right corner of the article or Receive free email alerts when new articles cite this article - sign up in the box at the http://rnajournal.cshlp.org/subscriptions go to: RNA To subscribe to Copyright 2005 by RNA Society Cold Spring Harbor Laboratory Press on January 24, 2011 - Published by rnajournal.cshlp.org Downloaded from
Transcript of SAFA: Semi-automated footprinting analysis software for high … · 2015-06-16 · METHOD SAFA:...

10.1261/rna.7214405Access the most recent version at doi: 2005 11: 344-354RNA
RHIJU DAS, ALAIN LAEDERACH, SAMUEL M. PEARLMAN, et al. experimentshigh-throughput quantification of nucleic acid footprinting SAFA: Semi-automated footprinting analysis software for
References
http://rnajournal.cshlp.org/content/11/3/344.full.html#related-urlsArticle cited in:
http://rnajournal.cshlp.org/content/11/3/344.full.html#ref-list-1This article cites 38 articles, 12 of which can be accessed free at:
serviceEmail alerting
click heretop right corner of the article orReceive free email alerts when new articles cite this article - sign up in the box at the
http://rnajournal.cshlp.org/subscriptions go to: RNATo subscribe to
Copyright 2005 by RNA Society
Cold Spring Harbor Laboratory Press on January 24, 2011 - Published by rnajournal.cshlp.orgDownloaded from

METHOD
SAFA: Semi-automated footprinting analysis software forhigh-throughput quantification of nucleic acidfootprinting experiments
RHIJU DAS,1,2,4, ALAIN LAEDERACH3,4 SAMUEL M. PEARLMAN,4 DANIEL HERSCHLAG,2 andRUSS B. ALTMAN3
1Department of Physics, 2Department of Biochemistry, 3Department of Genetics, and 4Department of Computer Science, Stanford University,Stanford, California 94305, USA
ABSTRACT
Footprinting is a powerful and widely used tool for characterizing the structure, thermodynamics, and kinetics of nucleic acidfolding and ligand binding reactions. However, quantitative analysis of the gel images produced by footprinting experiments istedious and time-consuming, due to the absence of informatics tools specifically designed for footprinting analysis. We havedeveloped SAFA, a semi-automated footprinting analysis software package that achieves accurate gel quantification whilereducing the time to analyze a gel from several hours to 15 min or less. The increase in analysis speed is achieved through agraphical user interface that implements a novel methodology for lane and band assignment, called “gel rectification,” and anoptimized band deconvolution algorithm. The SAFA software yields results that are consistent with published methodologies andreduces the investigator-dependent variability compared to less automated methods. These software developments simplify theanalysis procedure for a footprinting gel and can therefore facilitate the use of quantitative footprinting techniques in nucleicacid laboratories that otherwise might not have considered their use. Further, the increased throughput provided by SAFA mayallow a more comprehensive understanding of molecular interactions. The software and documentation are freely available fordownload at http://safa.stanford.edu.
Keywords: electrophoresis; footprinting; gel; hydroxyl radical; RNA folding; software
INTRODUCTION
‘Footprinting’ describes a family of techniques that utilizeprotection of DNA and RNA from cleavage or modificationto report on structure and ligand binding with as fine assingle-nucleotide resolution. Footprinting studies have pro-vided a wealth of structural and functional information onnucleic acid behavior, and continue to be widely used inboth qualitative and quantitative investigations. Among thenumerous applications of footprinting approaches thatprobe secondary and tertiary structure are the mapping ofDNA structure (Sun et al. 1999; Guo and Tullius 2003),thermodynamic dissection of fundamental DNA-protein
interactions (Ramesh and Nagaraja 1996; Gross et al.1998a,b; Brenowitz et al. 2002), portraits of RNA foldingpathways at millisecond time resolution (Sclavi et al. 1997,1998a,b; Deras et al. 2000; Brenowitz et al. 2002; Uchida etal. 2003), and high-resolution structural pictures of RNA-protein interactions in the ribosome (Heilek et al. 1995;Wilson and Noller 1998; Joseph et al. 2000).
The typical readouts of nucleic acid footprinting experi-ments are images of end-labeled nucleic acid fragmentssorted electrophoretically by length using polyacrylamidegels. While visual inspection is frequently sufficient for aqualitative analysis, quantification of the relative propor-tions of the reaction products is essential for quantitativestructural, thermodynamic, and kinetic studies. For gels im-aged by methods with linear response (e.g., phosphor stor-age imaging for 32P-labeled RNA), quantified gel band in-tensities corresponding to each nucleotide are extracted fora probed molecule and can be used to determine the mid-points and cooperativity of thermodynamic titrations(Johnson et al. 1979; Ackers et al. 1982; Celander and Cech1990, 1991), the timescales for folding events (Sclavi et al.
4These authors contributed equally.Reprint requests to: Russ B. Altman, Department of Genetics, 300
Pasteur Drive, Stanford University, Stanford, CA 94305,USA; e-mail:[email protected]; fax: (650) 725-3863; or Daniel Herschlag, De-partment of Biochemistry, Beckman Center B400, 279 W. Campus Drive,Stanford University, Stanford, CA 94305, USA; e-mail: [email protected]; fax: (650) 723-6783.
Article and publication are at http://www.rnajournal.org/cgi/doi/10.1261/rna.7214405.
RNA (2005), 11:344–354. Published by Cold Spring Harbor Laboratory Press. Copyright © 2005 RNA Society.344
Cold Spring Harbor Laboratory Press on January 24, 2011 - Published by rnajournal.cshlp.orgDownloaded from
1997, 1998a,b), and the changes in solvent accessibilityupon folding or binding (Latham and Cech 1989; Felden etal. 1994, 1996; Loizos 2004). Footprinting probes such asthe hydroxyl radical (Shadle et al. 1997) coupled to gelelectrophoresis report information for every nucleotidewithin a molecule with up to many hundreds of residues inlength. Thus, even a single gel can generate thousands ofdata points. A typical quantitative study requires the acqui-sition of tens of gels, potentially overwhelming the investi-gator with data to analyze. Footprinting can thereforegreatly benefit from high-throughput methods for quanti-fying gel electrophoretograms. Efficient software for basecalling, along with improvements in electrophoretic tech-nology, has significantly contributed to the throughput ofDNA sequencing (Ewing and Green 1998; Ewing et al. 1998;Dolnik 1999). In an analogous manner, software specializedfor the analysis of footprinting electrophoretograms has thepotential to increase the throughput of footprinting tech-niques.
Historically, quantitative footprinting studies were devel-oped using a quantification method termed ‘boxing’ inwhich an investigator manually draws rectangles or poly-gons surrounding a band or group of bands whose intensityis then integrated (Brenowitz et al. 1986a,b). In addition tobeing tedious, this method is susceptible to variability indifferent researchers’ boxing choices and neglects the over-lap of neighboring bands. While valuable when large groupsof bands are integrated (such as in DNase I footprint titra-tions of protein binding), boxing is a poor choice for theindividual analysis of a plethora of single bands.
An alternative approach is to generate lane profiles thatreport the changes in band intensity in the direction ofelectrophoresis (Shadle et al. 1997). These lane profiles canbe viewed as ‘footprinting spectra’ composed of overlappingpeaks. The development of band shape models allow thedeconvolution of band overlap, provided proper initialguesses for the band centers and widths are given (Strahsand Brenowitz 1994; Shadle et al. 1997; Pastor et al. 2000;Takamoto et al. 2004a,b). These advances, along with theintroduction of a well defined normalization procedure(Takamoto et al. 2004a), have significantly contributed tothe accuracy, speed, and reproducibility of the analysis offootprinting gels, but the procedures have not becomewidespread, possibly due to their complexity. An experi-enced user still needs an hour or longer to assign bandcenters, and several more hours of computational time toapply the deconvolution procedure to a typical gel. Indeed,the time required for these computational steps is largerthan the typical time spent in preparing the samples andcarrying out gel electrophoresis. To access the full potentialof footprinting as a high-throughput technique, an auto-mated, rapid, and straightforward procedure for the analy-sis of gels is needed.
To accomplish this goal, we developed software specifi-cally designed to accelerate single band fitting analysis while
preserving or enhancing accuracy and precision in thequantification. The software package SAFA (Semi-Auto-mated Footprinting Analysis) allows a footprinting gel to beexhaustively quantified in as little as 15 min. Four elementscontribute to SAFA’s speed and accuracy. First, a graphicaluser interface guides the user sequentially through theanalysis (Fig. 1), from cropping the gel image to generatingthe numerical output of the band intensities. The naturalprogression of operations (see buttons in Fig. 1) allowsresearchers to quickly become proficient with SAFA. Key-board shortcuts make it possible for experienced users tofurther accelerate their analysis. Second, all of the stepsinvolved in gel analysis (such as lane definition) have beenautomated; the user immediately visualizes the result of theautomated procedure at each step and is always given theoption to manually override software missteps. These stepsinclude the automated correction of geometric distortionsin the gel, a widespread practical problem. Third, peak-fitting algorithms have been streamlined and accelerated.Fourth, a standard file format is implemented that storeseach step of the gel analysis so that users can easily exchangefootprinting data, revise the quantification procedure inlater sessions, and utilize the resolved band intensities. Inaddition, a normalization routine developed by Takamotoet al. (2004a) was implemented within this software packagefor convenience and to minimize processing time. Testingof the SAFA software in our and several other laboratorieshas demonstrated the ability of this program to achieve thegoals of speed, accuracy, and precision. It is our hope thatthe ease with which inexperienced researchers can use SAFAwill stimulate laboratories that use footprinting as a quali-tative tool to pursue the quantitative information that isinherent to properly designed footprinting experiments.
METHOD
Footprinting experiments result in gels with several lanesthat contain hundreds of bands, many of which displaysignificant overlap with neighboring bands directly aboveand below (see Fig. 2A; for the purposes of this report, therunning direction of the gel is presented as vertically down-ward, as this is the most common alignment in the bio-chemical literature). Analysis of such gels can be dividedinto two parts: a procedure that assigns each band of a gelwith a lane number and a residue number (numbers in Fig.2A), and a quantification procedure that integrates thecounts in each band, deconvolving any overlap betweenneighboring bands. The following sections describe the al-gorithms implemented for each of these procedures andfollow the data flow in SAFA.
Lane and band assignment by “gel rectification”
The first step in gel analysis is the assignment of the thou-sands of bands within the gel image. This poses the major
Semi-automated footprinting analysis software
www.rnajournal.org 345
Cold Spring Harbor Laboratory Press on January 24, 2011 - Published by rnajournal.cshlp.orgDownloaded from
bottleneck for the quantification procedure. In particular,the boundaries between such bands are not straight hori-zontal and vertical lines but are often curved due to imper-fect wells or well loading, to lane widening, and to variationof band mobilities across the gel (Fig. 2A). In principle theseeffects can be minimized by careful attention to gel loadingand by minimizing salt and temperature inhomogeneities.In practice, however, most gels have some imperfections,and much time and data would be lost if imperfect lanes orgels were not quantified. The accurate assignment of eachcomplex boundary line for a gel image can be a time-con-suming task for researchers and a complicated task for anautomated software algorithm.
The central innovation of SAFA is a simple, semi-auto-mated procedure for band assignment. After assignment ofa few of the lane and band boundaries by the researcher, thesoftware fills in guesses for the remaining assignments thatcan, in turn, be further refined by the researcher. To helpthe researcher visualize the progress of the band assignmentat each step, the two-dimensional gel image is updated by atransformation that maps each (curved) lane or bandboundary onto a vertical or horizontal line, respectively. At
the end of this gel image “rectification,” the researcher seesa straightened gel image that represents the hypotheticalresult of an ideal gel electrophoresis experiment, with per-fectly straight lanes and horizontal rows of product bands(Fig. 2B). The image transformation bears similarities to the“spatial warping” procedure designed for comparing pro-tein two-dimensional gel images (Lemkin 1997, 1999;Lemkin and Thornwall 1999), but the SAFA rectification isoptimized for footprinting gels and preserves the number ofcounts on the gel to allow accurate quantification. Althoughthe rectification procedure may appear to distort the rawdata, we emphasize that the mapping transformation ismathematically reversible, so that the act of defining of eachstraight line on the rectified image is completely equivalentto drawing of a curved lane or band boundary on the origi-nal, untransformed image. Further actions on the rectifiedgel, including the band deconvolution algorithm, can besimilarly mapped back to equivalent actions on the originalimage. The gel rectification technique implemented inSAFA is therefore similar to previous methods (Takamotoet al. 2004a), but requires less user input and time as manyof the steps have been automated and are easier to visualize.
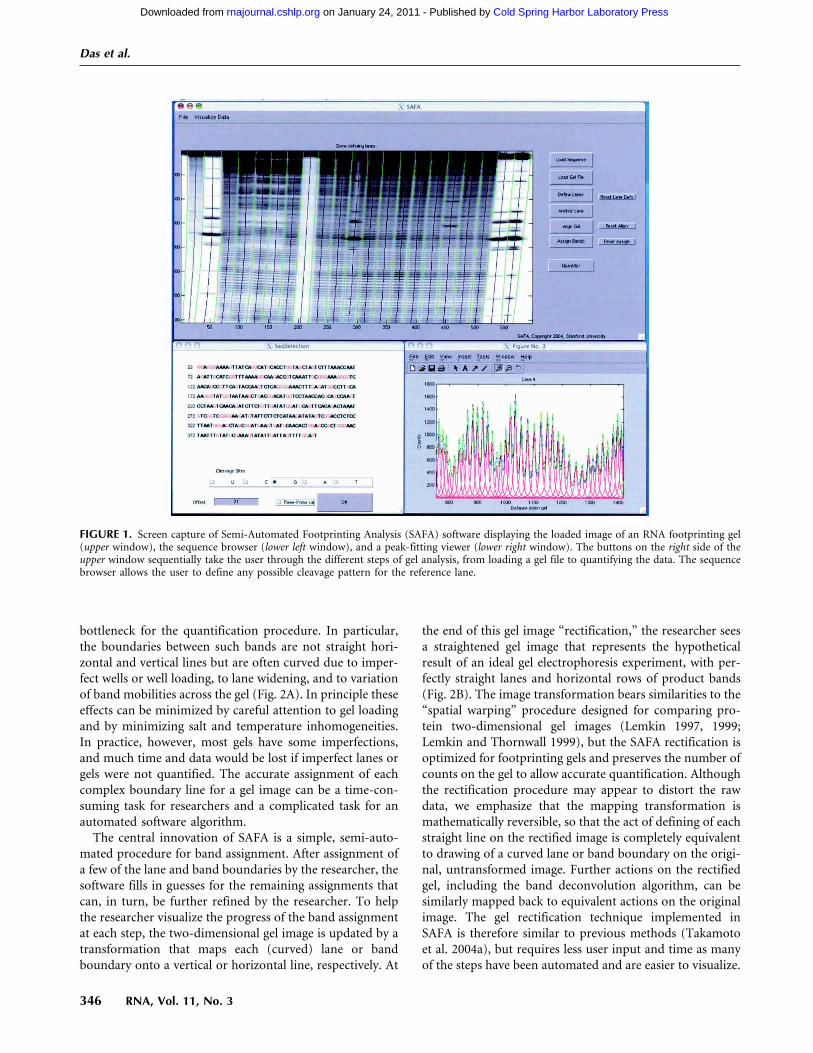
FIGURE 1. Screen capture of Semi-Automated Footprinting Analysis (SAFA) software displaying the loaded image of an RNA footprinting gel(upper window), the sequence browser (lower left window), and a peak-fitting viewer (lower right window). The buttons on the right side of theupper window sequentially take the user through the different steps of gel analysis, from loading a gel file to quantifying the data. The sequencebrowser allows the user to define any possible cleavage pattern for the reference lane.
Das et al.
346 RNA, Vol. 11, No. 3
Cold Spring Harbor Laboratory Press on January 24, 2011 - Published by rnajournal.cshlp.orgDownloaded from
The rectification procedure is separated into three se-quential steps: (1) lane definition, (2) horizontal gel align-ment, and (3) assignment of residue numbers to bands.
(1) Lane definition
In the previous methodology of Takamoto et al., definitionof lanes along the vertical axis was accomplished by manu-ally drawing lines down the center of each lane (Takamotoet al. 2004a). The previous procedure was difficult to auto-mate since lane centers do not necessarily correspond tomaxima in the horizontal direction. Generally, however,boundaries between lanes are easily defined as regularlyspaced continuous minima in the gel image. In SAFA, initialestimates for the curves that delineate the boundaries be-tween lanes are guessed by the software and optionally re-fined by the user (Fig. 3A). After lane boundaries are drawn,the pixel intensities within each of the lanes are binned so asto map to a rectangle with a user-defined number of col-umns (default of 10 columns per lane). The resulting trans-formation rectifies the gel image vertically by aligning alllane boundaries to the vertical axis (straight lines in Fig.3B).
(2) Horizontal gel alignment
After the lane definition, the gel image typically still appearsdistorted because the gel “smiles” or “frowns”, i.e., bands
that correspond to the same nucleic acid product in differ-ent lanes do not run at exactly the same vertical position.The next alignment procedure accounts for these residualdistortions. The researcher draws several “anchor lines”across the gel image connecting corresponding bands in thegel, e.g., across the uncleaved major band in each lane of ahydroxyl radical footprinting gel and well defined bands atthe bottom of the gel (Fig. 3C). A transformation of theimage is carried out to map the anchor lines to straighthorizontal lines (Fig. 3D). The regions between anchor linesare mapped by linear interpolation, with intensities scaledto preserve the total number of counts in these regions.Further lines can be added or erased by the researcher untilthe gel is completely aligned.
(3) Assignment of residue number
A procedure for annotation of band numbers on the recti-fied gel is the final semi-automated step of SAFA. Assign-ment of residue numbers for bands in each lane is carriedout by comparison to a known band pattern in a referencelane. For example, an enzymatic digest by ribonuclease T1at guanosine sites is typically used in RNA footprintingexperiments to generate a cleavage ladder that allows clearresidue assignments. A sequence browser (lower left win-dow in Fig. 1) allows the researcher to specify the residue
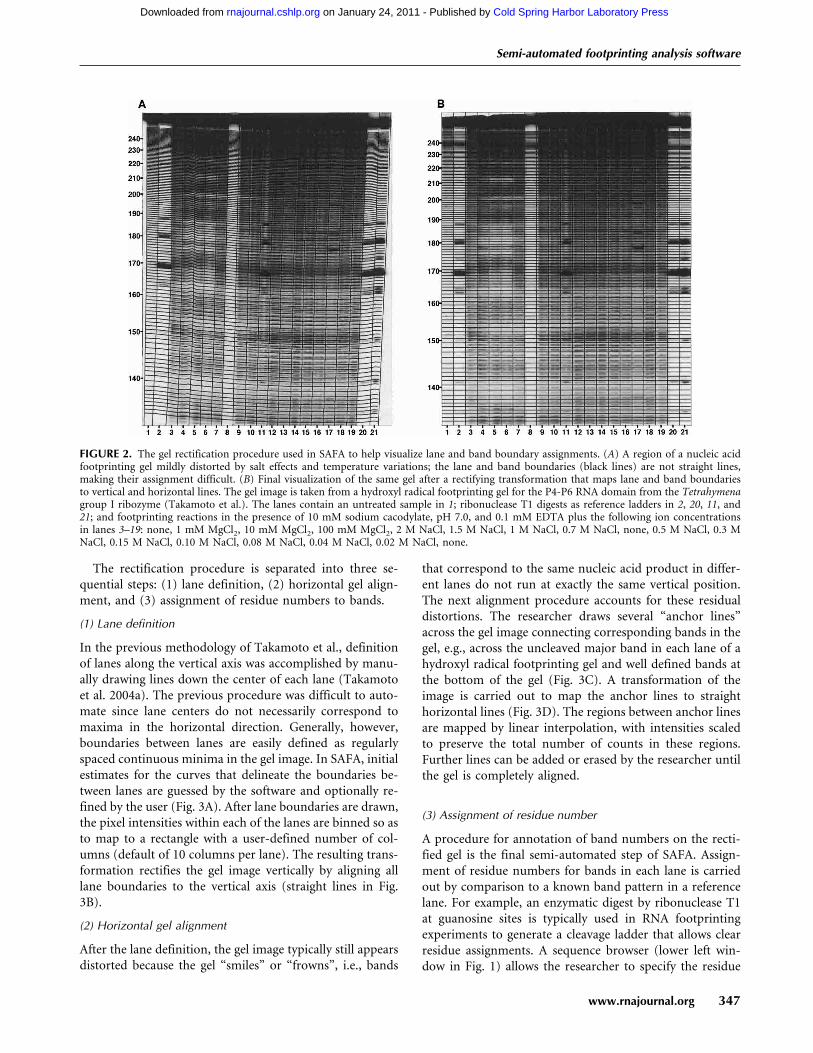
FIGURE 2. The gel rectification procedure used in SAFA to help visualize lane and band boundary assignments. (A) A region of a nucleic acidfootprinting gel mildly distorted by salt effects and temperature variations; the lane and band boundaries (black lines) are not straight lines,making their assignment difficult. (B) Final visualization of the same gel after a rectifying transformation that maps lane and band boundariesto vertical and horizontal lines. The gel image is taken from a hydroxyl radical footprinting gel for the P4-P6 RNA domain from the Tetrahymenagroup I ribozyme (Takamoto et al.). The lanes contain an untreated sample in 1; ribonuclease T1 digests as reference ladders in 2, 20, 11, and21; and footprinting reactions in the presence of 10 mM sodium cacodylate, pH 7.0, and 0.1 mM EDTA plus the following ion concentrationsin lanes 3–19: none, 1 mM MgCl2, 10 mM MgCl2, 100 mM MgCl2, 2 M NaCl, 1.5 M NaCl, 1 M NaCl, 0.7 M NaCl, none, 0.5 M NaCl, 0.3 MNaCl, 0.15 M NaCl, 0.10 M NaCl, 0.08 M NaCl, 0.04 M NaCl, 0.02 M NaCl, none.
Semi-automated footprinting analysis software
www.rnajournal.org 347
Cold Spring Harbor Laboratory Press on January 24, 2011 - Published by rnajournal.cshlp.orgDownloaded from
numbering scheme and the cleavage pattern used in thereference lane. The researcher then identifies the referencebands in the reference lane (e.g., for each guanosine for aribonuclease T1 ladder) by clicking on the gel image. Thepositions of all bands between reference bands in the gel areautomatically interpolated and can be refined by the re-searcher (Fig. 3E). The band positions are used as initialestimates in the fitting procedure (yi
start; see below).Following gel rectification and band assignment, the pixel
intensities along the horizontal direction of each rectangu-lar lane are integrated to generate a profile of counts downeach lane (Fig. 4A,B, dark curves). Each well resolved bandin the gel appears as a peak in a lane profile. The bandassignments (Fig. 3E) are stored and passed to the fittingalgorithm as starting estimates for a least-squares optimi-zation, described next. The entire gel rectification and bandassignment procedure is scalable in the sense that large gelsmay be analyzed with little additional user input. Finally,given that the user may always override the automatedguesses, even gels with major imperfections can be analyzedwith SAFA.
Band deconvolution
Once the gel rectification is complete and the band posi-tions defined, the quantification of band intensities is au-tomated and rapid. The quantification procedure in SAFAfits each lane profile P(y) (y is the vertical position down thelane) to a model profile Ppred(y) that is a sum of Lorentzianpeaks Li(y):
ppred�y� = �i
Li�y�
Li�y� =Ai
4�y − yi
Wi�2
+ 1
(1)
This functional form has been shown empirically to providea good description of band shapes (Shadle et al. 1997; Taka-moto et al. 2004a). There are three parameters to describeeach peak: the amplitude Ai, the full width at half-maxi-mum Wi, and center yi. The number of counts in each bandis given by the Lorentzian peak area (�/2)AiWi.
As described in a previous study by Takamoto et al.(2004a), a fit that allows each of these parameters to varyindependently generally leads to nonphysical results; somepeaks are assigned unusually large areas and widths at theexpense of neighboring peak areas, especially in regionswith significantly overlap between bands. To prevent suchartifacts, the peak width Wi is constrained to vary smoothly,by forcing it to be linearly dependent on the average dis-tance to the two adjacent peaks:
Wi = W0 +�
2�yi−1 − yi+1� (2)
In this peak width model with two parameters W0 and �,bands of lower mobility (and smaller separation betweenadjacent bands) have smaller widths, asymptotically ap-proaching a minimum width W0. The constraint equation(2) is slightly different from the empirical equation used inthe methodology of Takamoto et al. (2004a), which asymp-totically approaches a zero width for bands of lowest mo-bility.
As a final condition, SAFA requires that the peaks havepositive amplitudes (AI > 0). This constraint prevents non-physical solutions with negative peak areas occasionally ob-served in lanes where the relative intensity of two adjacentbands is different by an order of magnitude (e.g., in ribo-nuclease T1 footprinting).
Given an experimental profile (obtained by integratingintensity across a lane as described above), fitting of themodel described in equations 1 and 2 involves finding thepeak centers (yi), amplitudes (Ai), and the width model pa-rameters W0 and � such that the square of the differencesbetween the predicted profile P(y) and experimental profilePpred(y) is minimized. A standard Levenberg-Marquardt al-gorithm is used for the least-squares minimization (Teu-kolsky et al. 1992), and the algorithm’s progress can bemonitored in real time by the researcher (lower right win-dow in Fig. 1). Starting values for the peak centers yi are theband positions yi
start assigned by the user; for the amplitudesAi are P(yi
start); and for the W0 and � parameters are 3 pixelwidths and 0.1, respectively. The Levenberg-Marquardt fit-ting algorithm converged to identical solutions with initialvalues of the peak centers varied by ±40% of the peakwidths. Variation of twofold in the initial values of Ai, W0,and � led to the same converged solution (data not shown).
Software implementation
We used the MATLAB programming environment (TheMathWorks, http://www.mathworks.com) for the develop-ment of SAFA. The software includes a straightforwardgraphical user interface and requires no knowledge ofMATLAB command syntax. The SAFA analysis procedure isgreatly facilitated by tools for zooming into the gel, togglingbetween grayscale and pseudocolor representations of theimage, adjusting the image contrast, and undoing and re-fining user-chosen lane boundaries and band assignments.The software has been tested on several platforms (Macin-tosh, Windows, Linux), allowing widespread use. The mostcurrent SAFA executable and source code may be down-loaded free of charge from http://safa.stanford.edu.
As input, SAFA accepts an 8-bit or 16-bit TIFF or a .gelfile produced by the standard scanner software from Mo-lecular Dynamics and readable in ImageQuant. The outputof quantified peak areas is a text file that can be furtheranalyzed in general data visualization/fitting applicationslike Excel (Microsoft) and Kaleidagraph (Synergy Software),in addition to MATLAB.
Das et al.
348 RNA, Vol. 11, No. 3
Cold Spring Harbor Laboratory Press on January 24, 2011 - Published by rnajournal.cshlp.orgDownloaded from
For thermodynamic titrations and ki-netic timecourses, the standardizationand normalization procedures of Taka-moto et al. (2004a) are particularly use-ful steps to correct for differences inloading amounts in the quantified foot-printing data. An automated utility tocarry out these steps is included in theSAFA package.
Software testing
Prior to publication, two SAFA releaseswere distributed to several laboratoriesthat routinely carry out nucleic acidfootprinting experiments. Aside fromidentifying bugs in the program, thepre-release testing of the softwarehelped to identify the features necessaryfor making the software generally appli-cable to a wide range of nucleic acidmolecules and footprinting protocols.For example, in the second pre-release, asequence browser was added that allowsthe user to define arbitrary sequencenumbering and reference lane cleavagepatterns.
The software has been tested on titra-tion and structure mapping data forover 150 gels for RNAs including theTetrahymena group I ribozyme and mu-tants (Latham and Cech 1989; Celanderand Cech 1991), the P4-P6 and P5abcsubdomains of the Tetrahymena ribo-zyme (Cech 1990; Doherty and Doudna2000), the Azoarcus ribozyme (Adams etal. 2004), and several model hairpin sys-tems (R. Das. and D. Herschlag, un-publ.). To assess user-introduced vari-ability, a hydroxyl radical footprintinggel for the P4-P6 RNA (Fig. 2) was in-dependently analyzed by each of the fiveauthors of the present study. The stan-dard deviations of the quantified peakareas were compared to those obtainedfrom repeated independent quantifica-tions of the same gel by the band-boxingprocedure (ImageQuant, Molecular Dynamics) and by the methodology of Taka-moto et al. (2004a) (three analyses each).
RESULTS
The new methodology presented hereinallows rapid quantification of nucleic
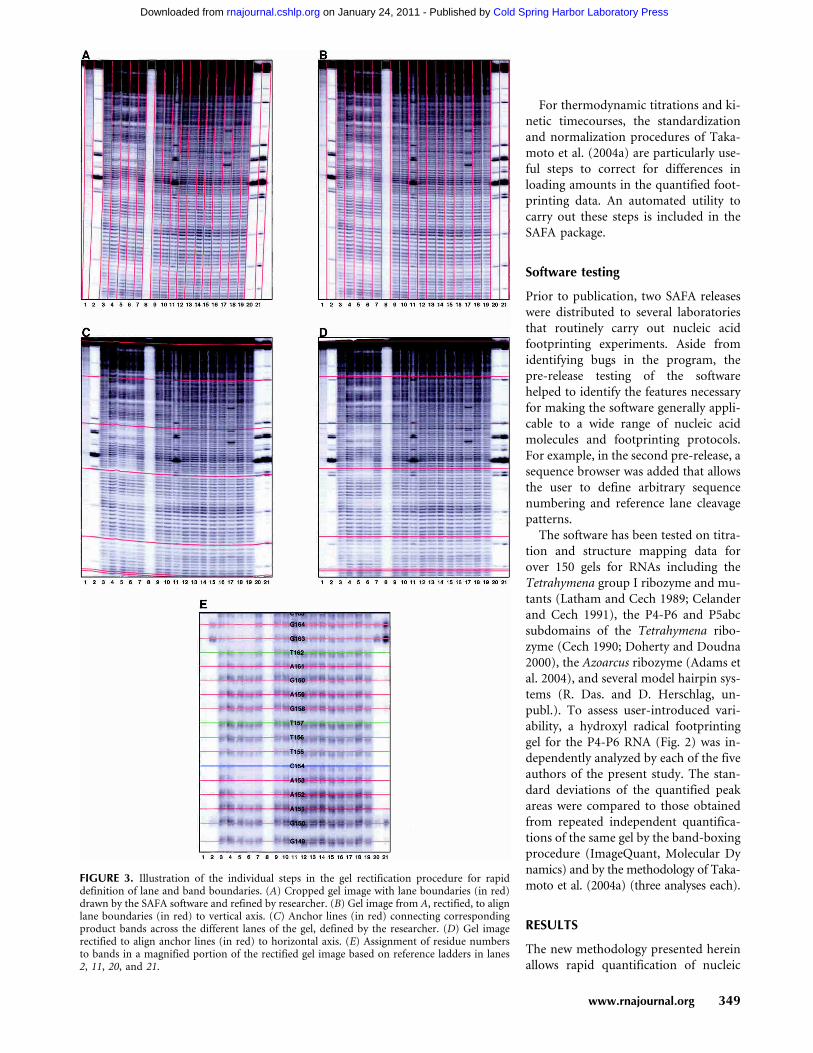
FIGURE 3. Illustration of the individual steps in the gel rectification procedure for rapiddefinition of lane and band boundaries. (A) Cropped gel image with lane boundaries (in red)drawn by the SAFA software and refined by researcher. (B) Gel image from A, rectified, to alignlane boundaries (in red) to vertical axis. (C) Anchor lines (in red) connecting correspondingproduct bands across the different lanes of the gel, defined by the researcher. (D) Gel imagerectified to align anchor lines (in red) to horizontal axis. (E) Assignment of residue numbersto bands in a magnified portion of the rectified gel image based on reference ladders in lanes2, 11, 20, and 21.
www.rnajournal.org 349
Cold Spring Harbor Laboratory Press on January 24, 2011 - Published by rnajournal.cshlp.orgDownloaded from

acid footprinting gels by improved two-dimensional imagemanipulation and nonlinear fitting algorithms. Throughoutthe development of the SAFA software, we have kept inmind that a state-of-the-art software package must mini-mally satisfy three basic criteria: (1) The software shouldyield results that quantitatively agree with previous welltested methodologies; (2) as the software is not fully auto-mated, uncertainties in the quantification due to user-in-troduced variability must be significantly smaller than un-certainties from other sources of experimental error; and(3) the software should be easier and faster to use thanprevious methodologies. SAFA satisfies all three criteria, asis described below.
Quantitative comparison to previous methodologies
The most basic test of a new software package is consistencywith previous, well tested algorithms. The quantificationresults of SAFA have therefore been compared to two pre-vious methodologies, the traditional band-boxing proce-dure and the previous single-band peak-fitting methodol-ogy of Takamoto et al. (2004a). Figure 5 illustrates two ofthese comparisons, for hydroxyl radical footprinting pat-terns of the P4-P6 RNA from the Tetrahymena group Iintron in unfolded and Mg2+-folded states. All three pro-cedures give similar results for overall band intensities andidentify regions protected upon Mg2+-induced folding. Theband areas computed using the band-boxing methodology(gray bars in Fig. 5) show a systematic bias towards in-creased peak areas at the higher residue numbers that cor-respond to bands with greater overlap. However, the twopeak-fitting methodologies (the method of Takamoto et al.and SAFA, white and black bars, respectively) show excel-lent agreement with each other (5% and 4% root meansquared deviation between methods for the two lanes ana-lyzed in Fig. 5), despite the differences in the lane definitionprocedure and peak-width model.
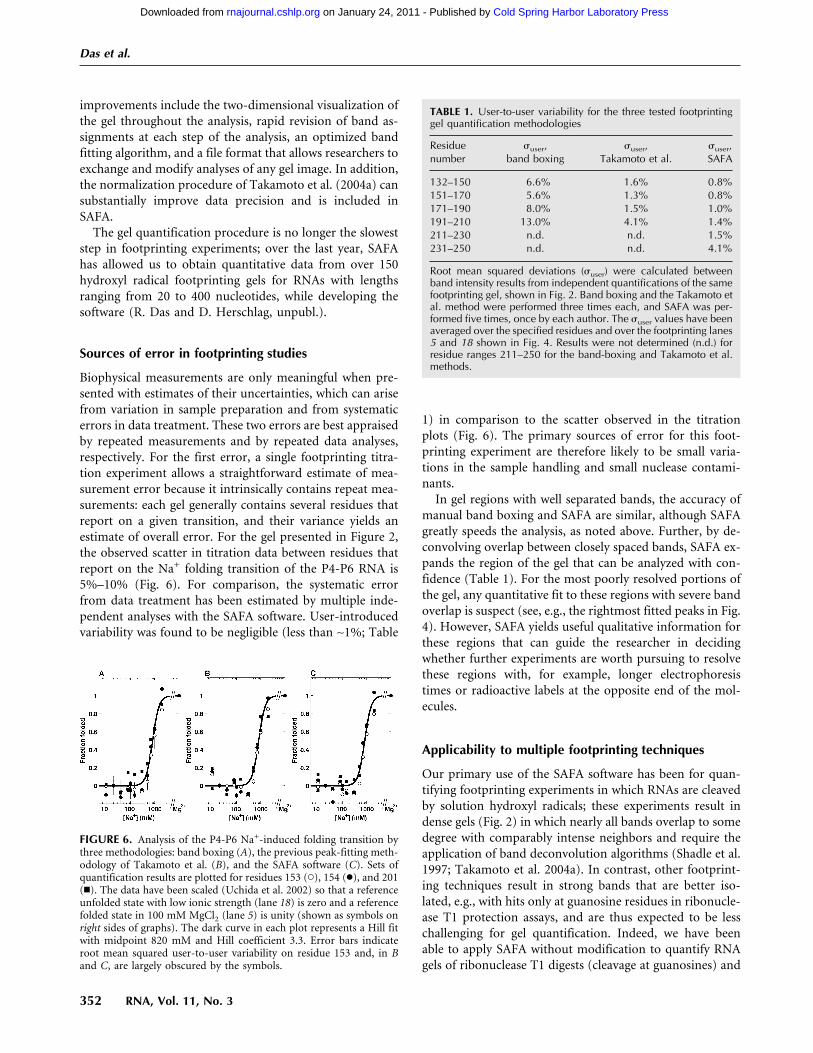
For many footprinting experiments, the absolute bandintensities for each lane are less important than the ratios ofband intensities in different lanes. For example, the data fora residue whose hydroxyl radical reactivity changes during afolding transition is usually plotted relative to the bandintensity of a low-salt reference state (Deras et al. 2000;Brenowitz et al. 2002; Uchida et al. 2002). Such normaliza-tion can remove systematic errors from the quantificationprocedure that affect each band similarly in all lanes, e.g.,the incorrect deconvolution of overlapping bands in theband-boxing procedure or background cleavage. To assessthe residual errors on such ratios, the three quantificationmethodologies (SAFA, Takamoto et al., and band boxing)were applied to 13 lanes that correspond to a Na+ titrationof the P4-P6 RNA (Uchida et al. 2002). To correct forlane-to-lane loading variation, the data were normalized toinvariant band intensities (Takamoto et al. 2004a; the nor-malization methodology is included in the SAFA software
package). All three quantification methodologies showed asimilar scatter of fraction-folded values at each Na+ con-centration (Fig. 6A–C). Standard fits to the Hill relation(Uchida et al. 2002) gave indistinguishable thermodynamicparameters for the band-boxing, Takamoto et al., and SAFAmethodologies: midpoints of 820±40 mM, 840±40 mM,and 820±40 mM, respectively, and apparent Hill coeffi-cients of 3.1±0.5, 3.1±0.5, and 3.3±0.5, respectively, witherrors estimated from the scatter in the data by bootstrap-ping (Efron and Tibshirani 1994).
Assessment of user-introduced variability
A fully automated procedure for gel analysis would, by defi-nition, result in zero user-introduced variability. All avail-able quantification procedures are, however, semi-auto-mated, requiring researcher input at several steps. We haveassessed the user-introduced variability of the band-boxingprocedure, the method of Takamoto et al., and SAFA bycarrying out multiple independent analyses of the same gelwith each method (Table 1).
The root mean squared deviation between different users’results of the band-boxing procedure is ∼6% for well re-solved regions. In comparison to the band-boxing proce-dure, the user-introduced variability of the peak-fittingmethodologies is significantly smaller in the well resolvedportion of the gel (∼1% for both the Takamoto et al. andSAFA procedures; Table 1). These user-to-user variabilitiesare also shown as error bars on the titration data of Figure6A–C; for the peak-fitting methodologies, they are mostlyobscured by the symbols and are significantly smaller thanthe scatter of the data points. The primary source of un-
FIGURE 4. The band deconvolution procedure fits the count profilesof the P4-P6 RNA in unfolded (A) and Mg2+-folded (B) states to asum of Lorentzian peak shapes and returns the fitted peak areas for therespective lane profiles. The unfolded and folded profiles correspondto lanes 18 and 5, respectively, in Figure 2. Lane profiles of data in Aand B are shown as solid black lines, the fitted profile as a solid grayline (indistinguishable from data over region of fit), and Lorentziancomponents of the fit as gray peak shapes. The gel running directionis from right to left in these depictions.
Das et al.
350 RNA, Vol. 11, No. 3
Cold Spring Harbor Laboratory Press on January 24, 2011 - Published by rnajournal.cshlp.orgDownloaded from

certainty in the presented titration data therefore does notappear to be variability introduced by the researcher incarrying out the peak-fitting procedure. Rather, the 5%–10% scatter seen in the titration plots are likely due tosources of experimental error outside the software, such asweak nuclease contaminants and variability in sample han-dling (pipetting the Fenton reagent, quenching, precipita-tion, and gel loading) that are not corrected by the normal-ization procedure.
Time demand of quantification
In addition to maintaining the precision of gel quantifica-tion, the SAFA software has been designed to reduce thetime demand of gel quantification relative to the traditionalband-boxing procedure and to the recently developed
single-band peak-fitting methodology ofTakamoto et al. As a benchmark, carefulband-boxing with ImageQuant softwaretakes the researcher ∼10 to 15 min perlane, resulting in an overall time de-mand of 3–5 h to analyze a gel with 20lanes (Fig. 2). For the same gel, the moreaccurate and precise peak-fitting meth-odology of Takamoto et al. requires theresearcher to spend 1–3 h to define lanesand to assign initial peak centers and thepeak width model. In general, excellentquality gels will require less time to ana-lyze. Further computational time of5–10 min per lane (Takamoto et al.2004a) is required to carry out peak fitsin the Origin v6.1 software on a currentprocessor (e.g., 1.5 GHz Pentium 4),leading to an overall time of 2.5–6 h forquantification.
The SAFA software accelerates boththe band assignment procedure and thepeak-fitting algorithm. For an experi-enced user, the time spent on SAFA’slane assignment, gel rectification, andband assignment procedure for the en-tire gel image ranges from 5 to 10 min,depending on the quality of the gel. Thepeak-fitting algorithm requires 5 to 10sec per lane on current processors. Thisspeed increase, relative to the commer-cial routine in the Takamoto et al. pro-cedure, is likely due to the incorporationof the analytic partial derivatives ofequation 1 with respect to the fitting pa-rameters. The overall fitting process isfurther accelerated because the param-eters of the peak width model (equation2) are fitted simultaneously with the
peak centers and amplitudes, rather than adjusted by theresearcher in multiple iterations (Takamoto et al. 2004a).The overall time demand for the SAFA procedure is 10–15min for the gel shown in Figure 2.
DISCUSSION
Accelerating the slowest step infootprinting experiments
The SAFA software package speeds the quantification andnormalization of footprinting gels, from a time demand ofa few hours to a few minutes, without sacrificing precisionor accuracy (Figs. 5, 6; Table 1). The major time-savingstep, relative to the previous single-band peak-fitting meth-odology of Takamoto et al. (2004a), is the new gel rectifi-cation procedure for lane and band assignment. Further
FIGURE 5. Comparison of SAFA analysis (black bars) to the traditional band-boxing proce-dure (gray bars) and the previous peak-fitting methodology of Takamoto et al. (white bars). Toavoid clutter, residues 132–170 are plotted in A and B, and residues 171–210 in C and D. Toaid visual comparison, the counts have been normalized to the mean value at residues 147–150for each methodology. The quantified band intensities in (A,C) and (B,D) correspond to thesame footprinting lanes, 18 and 5, respectively, as shown in Figure 4 for the unfolded andfolded states of the P4-P6 RNA.
Semi-automated footprinting analysis software
www.rnajournal.org 351
Cold Spring Harbor Laboratory Press on January 24, 2011 - Published by rnajournal.cshlp.orgDownloaded from
improvements include the two-dimensional visualization ofthe gel throughout the analysis, rapid revision of band as-signments at each step of the analysis, an optimized bandfitting algorithm, and a file format that allows researchers toexchange and modify analyses of any gel image. In addition,the normalization procedure of Takamoto et al. (2004a) cansubstantially improve data precision and is included inSAFA.
The gel quantification procedure is no longer the sloweststep in footprinting experiments; over the last year, SAFAhas allowed us to obtain quantitative data from over 150hydroxyl radical footprinting gels for RNAs with lengthsranging from 20 to 400 nucleotides, while developing thesoftware (R. Das and D. Herschlag, unpubl.).
Sources of error in footprinting studies
Biophysical measurements are only meaningful when pre-sented with estimates of their uncertainties, which can arisefrom variation in sample preparation and from systematicerrors in data treatment. These two errors are best appraisedby repeated measurements and by repeated data analyses,respectively. For the first error, a single footprinting titra-tion experiment allows a straightforward estimate of mea-surement error because it intrinsically contains repeat mea-surements: each gel generally contains several residues thatreport on a given transition, and their variance yields anestimate of overall error. For the gel presented in Figure 2,the observed scatter in titration data between residues thatreport on the Na+ folding transition of the P4-P6 RNA is5%–10% (Fig. 6). For comparison, the systematic errorfrom data treatment has been estimated by multiple inde-pendent analyses with the SAFA software. User-introducedvariability was found to be negligible (less than ∼1%; Table
1) in comparison to the scatter observed in the titrationplots (Fig. 6). The primary sources of error for this foot-printing experiment are therefore likely to be small varia-tions in the sample handling and small nuclease contami-nants.
In gel regions with well separated bands, the accuracy ofmanual band boxing and SAFA are similar, although SAFAgreatly speeds the analysis, as noted above. Further, by de-convolving overlap between closely spaced bands, SAFA ex-pands the region of the gel that can be analyzed with con-fidence (Table 1). For the most poorly resolved portions ofthe gel, any quantitative fit to these regions with severe bandoverlap is suspect (see, e.g., the rightmost fitted peaks in Fig.4). However, SAFA yields useful qualitative information forthese regions that can guide the researcher in decidingwhether further experiments are worth pursuing to resolvethese regions with, for example, longer electrophoresistimes or radioactive labels at the opposite end of the mol-ecules.
Applicability to multiple footprinting techniques
Our primary use of the SAFA software has been for quan-tifying footprinting experiments in which RNAs are cleavedby solution hydroxyl radicals; these experiments result indense gels (Fig. 2) in which nearly all bands overlap to somedegree with comparably intense neighbors and require theapplication of band deconvolution algorithms (Shadle et al.1997; Takamoto et al. 2004a). In contrast, other footprint-ing techniques result in strong bands that are better iso-lated, e.g., with hits only at guanosine residues in ribonucle-ase T1 protection assays, and are thus expected to be lesschallenging for gel quantification. Indeed, we have beenable to apply SAFA without modification to quantify RNAgels of ribonuclease T1 digests (cleavage at guanosines) and
TABLE 1. User-to-user variability for the three tested footprintinggel quantification methodologies
Residuenumber
�user,band boxing
�user,Takamoto et al.
�user,SAFA
132–150 6.6% 1.6% 0.8%151–170 5.6% 1.3% 0.8%171–190 8.0% 1.5% 1.0%191–210 13.0% 4.1% 1.4%211–230 n.d. n.d. 1.5%231–250 n.d. n.d. 4.1%
Root mean squared deviations (�user) were calculated betweenband intensity results from independent quantifications of the samefootprinting gel, shown in Fig. 2. Band boxing and the Takamoto etal. method were performed three times each, and SAFA was per-formed five times, once by each author. The �user values have beenaveraged over the specified residues and over the footprinting lanes5 and 18 shown in Fig. 4. Results were not determined (n.d.) forresidue ranges 211–250 for the band-boxing and Takamoto et al.methods.
FIGURE 6. Analysis of the P4-P6 Na+-induced folding transition bythree methodologies: band boxing (A), the previous peak-fitting meth-odology of Takamoto et al. (B), and the SAFA software (C). Sets ofquantification results are plotted for residues 153 (�), 154 (●), and 201(�). The data have been scaled (Uchida et al. 2002) so that a referenceunfolded state with low ionic strength (lane 18) is zero and a referencefolded state in 100 mM MgCl2 (lane 5) is unity (shown as symbols onright sides of graphs). The dark curve in each plot represents a Hill fitwith midpoint 820 mM and Hill coefficient 3.3. Error bars indicateroot mean squared user-to-user variability on residue 153 and, in Band C, are largely obscured by the symbols.
Das et al.
352 RNA, Vol. 11, No. 3
Cold Spring Harbor Laboratory Press on January 24, 2011 - Published by rnajournal.cshlp.orgDownloaded from

DNA gels of reverse transcriptase products from dimethyl-sulfate-modified RNAs (modification at adenosines and cy-tosines) (R. Das and D. Herschlag, unpubl.). In addition,the SAFA software was recently used to quantify gels fromtethered radical cleavage experiments (R. Das and D.Herschag, unpubl.) that result in strong cleavage intensitiesat clusters of nucleotides that are well separated from eachother in primary sequence (Joseph et al. 2000). SAFA isexpected to have general utility in improving and acceler-ating the analysis of gel images from a wide variety of foot-printing techniques.
ACKNOWLEDGMENTS
We give special thanks to M. Brenowitz and K. Takamoto for theirassistance during the entire process of software development andfor comments on the manuscript, and to K. Takamoto for sharinga gel image and reanalyzing it multiple times for our user vari-ability comparisons. We thank J. Frederiksen, S. Mitra, R. Russell,I. Scherbakova, K. Travers, K. Weeks, and K. Wilkinson for testingearly releases of the SAFA software. This work was supported byNIH program project grant P01-GM-66275. We thank an AbbottLaboratory Stanford Graduate Fellowship (R.D.), a National Sci-ence Foundation fellowship (R.D.), and a Damon Runyan Post-doctoral Fellowship (A.L.) for additional funding.
Received October 20, 2004; accepted December 7, 2004.
REFERENCES
Ackers, G.K., Johnson, A.D., and Shea, M.A. 1982. Quantitative modelfor gene regulation by � phage repressor. Proc. Natl. Acad. Sci.79: 1129–1133.
Adams, P.L., Stahley, M.R., Kosek, A.B., Wang, J., and Strobel, S.A.2004. Crystal structure of a self-splicing group I intron with bothexons. Nature 430: 45–50.
Brenowitz, M., Senear, D.F., Shea, M.A., and Ackers, G.K. 1986a.“Footprint” titrations yield valid thermodynamic isotherms. Proc.Natl. Acad. Sci. 83: 8462–8466.
———. 1986b. Quantitative DNase footprint titration: A method forstudying protein-DNA interactions. Methods Enzymol. 130: 132–181.
Brenowitz, M., Chance, M.R., Dhavan, G., and Takamoto, K. 2002.Probing the structural dynamics of nucleic acids by quantitativetime-resolved and equilibrium hydroxyl radical “footprinting.”Curr. Opin. Struct. Biol. 12: 648–653.
Cech, T.R. 1990. Self-splicing of group I introns. Annu. Rev. BioChem.59: 543–568.
Celander, D.W. and Cech, T.R. 1990. Iron(II)-ethylenediaminetetra-acetic acid catalyzed cleavage of RNA and DNA oligonucleotides:Similar reactivity toward single- and double-stranded forms. Bio-chemistry 29: 1355–1361.
———. 1991. Visualizing the higher order folding of a catalytic RNAmolecule. Science 251: 401–407.
Deras, M.L., Brenowitz, M., Ralston, C.Y., Chance, M.R., and Wood-son, S.A. 2000. Folding mechanism of the Tetrahymena ribozymeP4-P6 domain. Biochemistry 39: 10975–10985.
Doherty, E.A. and Doudna, J.A. 2000. Ribozyme structures andmechanisms. Annu. Rev. BioChem. 69: 597–615.
Dolnik, V. 1999. DNA sequencing by capillary electrophoresis (re-view). J. Biochem. Biophys. Methods 41: 103–119.
Efron, B. and Tibshirani, R.J. 1994. An introduction to the bootstrap.Chapman and Hall, New York.
Ewing, B. and Green, P. 1998. Base-calling of automated sequencertraces using phred. II. Error probabilities. Genome Res. 8: 186–194.
Ewing, B., Hillier, L., Wendl, M.C., and Green, P. 1998. Base-calling ofautomated sequencer traces using phred. I. Accuracy assessment.Genome Res. 8: 175–185.
Felden, B., Florentz, C., Giege, R., and Westhof, E. 1994. Solutionstructure of the 3�-end of brome mosaic virus genomic RNAs.Conformational mimicry with canonical tRNAs. J. Mol. Biol.235: 508–531.
Felden, B., Florentz, C., Westhof, E., and Giege, R. 1996. Usefulness offunctional and structural solution data for the modeling of tRNA-like structures. Pharm. Acta Helv. 71: 3–9.
Gross, P., Arrowsmith, C.H., and Macgregor Jr., R.B. 1998a. Hydroxylradical footprinting of DNA complexes of the ets domain of PU.1and its comparison to the crystal structure. Biochemistry 37: 5129–5135.
Gross, P., Yee, A.A., Arrowsmith, C.H., and Macgregor, R.B, Jr. 1998b.Quantitative hydroxyl radical footprinting reveals cooperative in-teractions between DNA-binding subdomains of PU.1 and IRF4.Biochemistry 37: 9802–9811.
Guo, H. and Tullius, T.D. 2003. Gapped DNA is anisotropically bent.Proc. Natl. Acad. Sci. 100: 3743–3747.
Heilek, G.M., Marusak, R., Meares, C.F., and Noller, H.F. 1995.Directed hydroxyl radical probing of 16S rRNA using Fe(II) teth-ered to ribosomal protein S4. Proc. Natl. Acad. Sci. 92: 1113–1116.
Johnson, A.D., Meyer, B.J., and Ptashne, M. 1979. Interactions be-tween DNA-bound repressors govern regulation by the � phagerepressor. Proc. Natl. Acad. Sci. 76: 5061–5065.
Joseph, S., Whirl, M.L., Kondo, D., Noller, H.F., and Altman, R.B.2000. Calculation of the relative geometry of tRNAs in the ribo-some from directed hydroxyl-radical probing data. RNA 6: 220–232.
Latham, J.A. and Cech, T.R. 1989. Defining the inside and outside ofa catalytic RNA molecule. Science 245: 276–282.
Lemkin, P.F. 1997. Comparing two-dimensional electrophoretic gelimages across the Internet. Electrophoresis 18: 461–470.
Lemkin, P.F. and Thornwall, G. 1999. Comparing 2-D electrophoreticgels across Internet databases. Methods Mol. Biol. 112: 393–410.
———. 1999. Flicker image comparison of 2-D gel images for putativeprotein identification using the 2DWG meta-database. Mol. Bio-technol. 12: 159–172.
Loizos, N. 2004. Mapping protein-ligand interactions by hydroxyl-radical protein footprinting. Methods Mol. Biol. 261: 199–210.
Pastor, N., Weinstein, H., Jamison, E., and Brenowitz, M. 2000. Adetailed interpretation of OH radical footprints in a TBP-DNAcomplex reveals the role of dynamics in the mechanism of se-quence-specific binding. J. Mol. Biol. 304: 55–68.
Ramesh, V. and Nagaraja, V. 1996. Sequence-specific DNA binding ofthe phage Mu C protein: Footprinting analysis reveals altered DNAconformation upon protein binding. J. Mol. Biol. 260: 22–33.
Sclavi, B., Woodson, S., Sullivan, M., Chance, M.R., and Brenowitz, M.1997. Time-resolved synchrotron X-ray “footprinting,” a new ap-proach to the study of nucleic acid structure and function: Appli-cation to protein-DNA interactions and RNA folding. J. Mol. Biol.266: 144–159.
Sclavi, B., Sullivan, M., Chance, M.R., Brenowitz, M., and Woodson,S.A. 1998a. RNA folding at millisecond intervals by synchrotronhydroxyl radical footprinting. Science 279: 1940–1943.
Sclavi, B., Woodson, S., Sullivan, M., Chance, M., and Brenowitz, M.1998b. Following the folding of RNA with time-resolved synchro-tron X-ray footprinting. Methods Enzymol. 295: 379–402.
Shadle, S.E., Allen, D.F., Guo, H., Pogozelski, W.K., Bashkin, J.S., andTullius, T.D. 1997. Quantitative analysis of electrophoresis data:Novel curve fitting methodology and its application to the deter-mination of a protein-DNA binding constant. Nucleic Acids Res.25: 850–860.
Semi-automated footprinting analysis software
www.rnajournal.org 353
Cold Spring Harbor Laboratory Press on January 24, 2011 - Published by rnajournal.cshlp.orgDownloaded from

Strahs, D. and Brenowitz, M. 1994. DNA conformational changesassociated with the cooperative binding of cI-repressor of bacte-riophage � to OR. J. Mol. Biol. 244: 494–510.
Sun, W., Mao, C., Iwasaki, H., Kemper, B., and Seeman, N.C. 1999.No braiding of Holliday junctions in positively supercoiled DNAmolecules. J. Mol. Biol. 294: 683–699.
Takamoto, K., Chance, M.R., and Brenowitz, M. 2004a. Semi-auto-mated, single-band peak-fitting analysis of hydroxyl radical nucleicacid footprint autoradiograms for the quantitative analysis of tran-sitions. Nucleic Acids Res. 32(15): E119.
Takamoto, K., Das, R., He, Q., Doniach, S., Brenowitz, M., Herschlag,D., Chance, M.R. 2004b. Principles of RNA compaction: Insightsfrom the equilibrium folding pathway of the P4-P6 RNA domainin monovalent cations. J. Mol. Biol. 343(5): 1195–1206.
Teukolsky, S.A., Vetterling, W.T., and Flannery, B.P. 1992. Numericalrecipes in C: The art of scientific computing. Cambridge UniversityPress, United Kingdom.
Uchida, T., He, Q., Ralston, C.Y., Brenowitz, M., and Chance, M.R.2002. Linkage of monovalent and divalent ion binding in the fold-ing of the P4-P6 domain of the Tetrahymena ribozyme. Biochem-istry 41: 5799–5806.
Uchida, T., Takamoto, K., He, Q., Chance, M.R., and Brenowitz, M.2003. Multiple monovalent ion-dependent pathways for the fold-ing of the L-21 Tetrahymena thermophila ribozyme. J. Mol. Biol.328: 463–478.
Wilson, K.S. and Noller, H.F. 1998. Mapping the position of transla-tional elongation factor EF-G in the ribosome by directed hydroxylradical probing. Cell 92: 131–139.
Das et al.
354 RNA, Vol. 11, No. 3
Cold Spring Harbor Laboratory Press on January 24, 2011 - Published by rnajournal.cshlp.orgDownloaded from