
SACRAMENTO MSA | MULTIFAMILY | Q3 2019 REPORT › data.abimultifamily.com › ...% Change (y-o-y)...
9
© ABI GEONEWS: SACRAMENTO MSA - SELECT NEWS CONTINUED ON PAGE 05 POPULATION COSTAR 2,371,109 UNDER CONSTRUCTION COSTAR TOTAL INVENTORY AS OF SEP 2019 - COSTAR 3,074 Units (50+) 181,838 Units (5+) 1.8% UNEMPLOYMENT Q-O-Q AS OF SEP 2019 - BLS 3.0% EMPLOYMENT GROWTH Y-O-Y AS OF SEP 2019 - BLS MEDIAN HH INCOME COSTAR $74,403 $33,548 PER CAPITA INCOME CENSUS SAC Adopts Rent Control, Just Cause Eviction Ordinance River One Proposal Planned as Riverfront Destination, Housing Virginia Firm Enters Sacramento Market with $26.8 Million Apartment Buy A V E R A G E 5+ UNIT PROPERTIES Total Sales Volume Price/Unit Price/SF Year Built Units Delivered Average Rent Q3 2019 $536M $190,447 $229.76 1966 0 $1,392 95.6% Q3 2018 $445M $160,671 $203.92 1967 142 $1,339 95.6% Occupancy Rate INCREASE/DECREASE +0.4% -100.0% NO CHANGE +4.0% -1 Yr +12.7% +18.5% +20.5% SACRAMENTO MSA OVERVIEW 01 SACRAMENTO MSA - PER COUNTY ANALYSIS 02 MULTIFAMILY PROPERTY ANALYSIS: 50 + & 5-49 UNITS 03 COMPLETED CONSTRUCTION & PLANNED PROJECTS 04 ABI GEONEWS: SACRAMENTO - SELECT NEWS 05 AB Insight ® SACRAMENTO MSA: BUSY TIMES. WHERE TO START? 06-07 ABI COMPARATIVE MARKET REVIEW: Q3 2019 08 SACRAMENTO MSA | MULTIFAMILY | Q3 2019 REPORT ABIMultifamily.com Sacramento Office: 2251 Douglas Boulevard, Suite 115, Roseville, CA 95661 Tel: 916.330.4040
Transcript of SACRAMENTO MSA | MULTIFAMILY | Q3 2019 REPORT › data.abimultifamily.com › ...% Change (y-o-y)...
©
ABI GEONEWS: SACRAMENTO MSA - SELECT NEWS CONTINUED ON PAGE 05
POPULATIONCOSTAR
2,371,109
UNDER CONSTRUCTIONCOSTAR
TOTAL INVENTORYAS OF SEP 2019 - COSTAR
3,074Units (50+)
181,838Units (5+)
1.8%
UNEMPLOYMENTQ-O-Q AS OF SEP 2019 - BLS
3.0%
EMPLOYMENT GROWTHY-O-Y AS OF SEP 2019 - BLS
MEDIAN HH INCOMECOSTAR
$74,403 $33,548
PER CAPITA INCOMECENSUS
SAC Adopts Rent Control, Just Cause Eviction Ordinance
River One Proposal Planned as Riverfront Destination, Housing
Virginia Firm Enters Sacramento Market with $26.8 Million Apartment Buy
AV
ER
AG
E
5+ UNIT PROPERTIES
Total Sales Volume
Price/Unit
Price/SF
Year Built
Units Delivered
Average Rent
Q3 2019
$536M
$190,447
$229.76
1966
0
$1,392
95.6%
Q3 2018
$445M
$160,671
$203.92
1967
142
$1,339
95.6% Occupancy Rate
INCREASE/DECREASE
+0.4%
-100.0%
NO CHANGE
+4.0%
-1 Yr
+12.7%
+18.5%
+20.5%
SACRAMENTO MSA OVERVIEW 01
SACRAMENTO MSA - PER COUNTY ANALYSIS 02
MULTIFAMILY PROPERTY ANALYSIS: 50+ & 5-49 UNITS 03
COMPLETED CONSTRUCTION & PLANNED PROJECTS 04
ABI GEONEWS: SACRAMENTO - SELECT NEWS 05
AB Insight ® SACRAMENTO MSA: BUSY TIMES. WHERE TO START? 06-07
ABI COMPARATIVE MARKET REVIEW: Q3 2019 08
SACRAMENTO MSA | MULTIFAMILY | Q3 2019 REPORT
ABIMultifamily.com Sacramento Office: 2251 Douglas Boulevard, Suite 115, Roseville, CA 95661 Tel: 916.330.4040

SACRAMENTO MSA - PER COUNTY ANALYSIS
Sacramento Placer Yolo El Dorado
Average Rent (Q3 2019) $1,259 $1,366 $1,249 $1,405
% Change (y-o-y) +4.0% +1.3% +6.6% +3.3%
Occupancy Rate (Q3 2019) 96.3% 86.7% 96.0% 95.6%
% Change (y-o-y) 0.0% -10.9% -0.3% +0.5%
Units Delivered (Q3 2019, 50+) 876 486 -- --
Total Sales Volume (Q3 2019, 50+) $319,665,000 $14,000,000 $165,650,000 $0
Total Sales Volume (Q3 2018, 50+) $312,944,910 $0 $59,450,000 $15,350,000
% Change (y-o-y) +2.1% -- +178.6% --
Avg P/U (Q3 2019, 50+) $170,125 $233,333 $260,047 $0
Avg P/U (Q3 2018, 50+) $159,992 $0 $193,019 $163,298
% Change (y-o-y) +6.3% -- +34.7% --
Total Sales Volume (Q3 2019, 5-49) $36,412,357 $0 $0 $0
Total Sales Volume (Q3 2018, 5-49) $35,433,000 $0 $10,400,000 $0
% Change (y-o-y) +2.8% -- -- --
Avg P/U (Q3 2019, 5-49) $153,639 $0 $0 $0
Avg P/U (Q3 2018, 5-49) $137,872 $0 $101,961 $0
% Change (y-o-y) +11.4% -- -- --
Sacramento MSA
Sacramento
Placer
Yolo
El Dorado
$74,403
$63,045
$73,747
$61,621
$72,586
$33,548
$31,449
$35,711
$30,900
$38,385
3,074
1,844
383
597
250
147,242
106,771
18,124
17,507
4,850
UNEMPLOYMENT RATE MEDIAN HH INCOME PER CAPITA INCOME UNDER CONSTRUCTIONTOTAL INVENTORY
50+
3.0%
3.2%
2.7%
3.4%
3.1%
RENT
& O
CCUP
ANCY
STAT
SSA
LES D
ATA
(50+
)SA
LES D
ATA
(5-4
9)
SACRAMENTO MSA QUICK STATS
SACRAMENTO MSA - PER COUNTY ANALYSIS
* Total inventory numbers may vary due to zip/city overlap
ABIMultifamily.com02 Sacramento MSA Q3 2019 Report

50+ UNIT MULTIFAMILY PROPERTY ANALYSIS
5 - 49 UNIT MULTIFAMILY PROPERTY ANALYSIS
Q3 2019 Transactions by Year Built# of Transactions Avg Price/Unit Avg Price/SF
2010+
2000-09
1990-99
1980-89
Pre-1980
-- -- --
2 $231K $224
-- -- --
6 $201K $233
4 $170K $223
Total Sales Volume
Price/Unit
Price/SF
Year Built
$499M
$193,833
$230.07
1983
Q3 2019 Q3 2018INCREASE/DECREASE
TOP 3 TRANSACTIONS BY PRICE/UNIT (50+)
Sycamore TerraceSacramento, 244 Units | $68,450,000$280,533/Unit | $269.51/SF | Built 2007
Shore Park at RiverlakeSacramento, 393 Units | $97,200,000$247,328/Unit | $261.02/SF | Built 1989
Promenade ParkRoseville, 60 Units | $14,000,000$233,333/Unit | $300.94/SF | Built 1981
Q3 2019 Transactions by Year Built# of Transactions Avg Price/Unit Avg Price/SF
2010+
2000-09
1990-99
1980-89
Pre-1980
-- -- --
-- -- --
-- -- --
1 $148K $196
16 $154K $230
Total Sales Volume
Price/Unit
Price/SF
Year Built
$36M
$153,639
$225.60
1954
$46M
$127,669
$178.06
1959
$399M
$165,592
$207.39
1978
Q3 2019 Q3 2018
AV
ER
AG
EA
VE
RA
GE
INCREASE/DECREASE
TOP 3 TRANSACTIONS BY PRICE/UNIT (5-49)
The KensingtonSacramento, 8 Units | $2,600,000$325,000/Unit | $438.60/SF | Built 1895
2819 E StreetSacramento, 9 Units | $2,175,000$241,667/Unit | $388.39/SF | Built 1975
The PalmsSacramento, 13 Units | $2,885,000$221,923/Unit | $401.53/SF | Built 1954
NUMBER OF TRANSACTIONS BY YEAR BUILT
NUMBER OF TRANSACTIONS BY YEAR BUILT
+25.2%
+17.1%
+10.9%
+5 Yrs
-20.6%
+20.3%
+26.7%
-5 Yrs
11980-89
2
2000-09
6
1980-89
4PRE-1
980
16PRE-1980
ABIMultifamily.com 03Sacramento MSA Q3 2019 Report

2278
3155
27002866
4160
3967
2624 2585
15061664
1150
821
10711029
728
276
1096
582655
1,3671,488*
0
500
1000
1500
2000
2500
3000
3500
4000
4500
20 Year Average: 1,888
©
COMPLETED CONSTRUCTION
SACRAMENTO MULTIFAMILY CONSTRUCTION PIPELINEQ3 2019
* Project Units Delivered. Project units delivered is based on when the total project is completed, not as individual buildings/units are delivered
Recently Completed(2019 YTD)
Total # of Units: 1,488
Total # of Properties: 10
1. 623 Vernon Street | 58 Units
2. 1907 Q Street | 68 Units
3. Hub Apartments | 80 Units
4. Academy65 | 90 Units
5. Bow Street Apartments | 98 Units
6. Bidwell Pointe | 140 Units
7. 19J Apartments | 175 Units
8. Campus Oaks | 186 Units
9. Talavera | 293 Units
10. Harvest at Fiddyment Ranch | 300 Units
T O T A L U N I T I N V E N T O R Y
5 + U N I T P R O P E R T I E S : 1 8 1 , 8 3 8
5 0 + U N I T P R O P E R T I E S : 1 4 7 , 2 4 2
A V E R A G E A B S O R P T I O N
89 U n i t s
Under ConstructionTotal # of Units: 3,074
Total # of Properties: 17
PlannedTotal # of Units: 7,144
Total # of Properties: 35
ABIMultifamily.com 04Sacramento MSA Q3 2019 Report
ABI GEONEWS: SACRAMENTO MSA - SELECT NEWS
CLICK NEWS ARTICLES BELOW TO READ
12
11
Regional
9
Regional
7
6
Regional
Regional
Regional
2
1
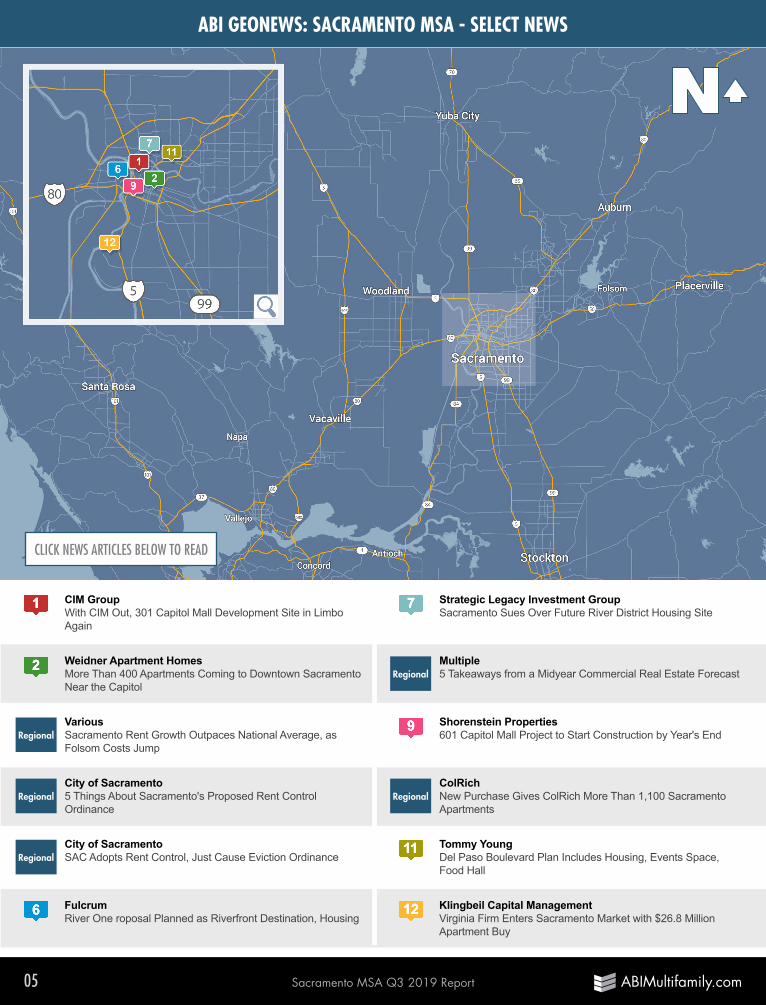
Tommy YoungDel Paso Boulevard Plan Includes Housing, Events Space, Food Hall
City of Sacramento SAC Adopts Rent Control, Just Cause Eviction Ordinance
ColRichNew Purchase Gives ColRich More Than 1,100 Sacramento Apartments
City of Sacramento 5 Things About Sacramento's Proposed Rent Control Ordinance
Shorenstein Properties601 Capitol Mall Project to Start Construction by Year's End
Various Sacramento Rent Growth Outpaces National Average, as Folsom Costs Jump
Multiple5 Takeaways from a Midyear Commercial Real Estate Forecast
Weidner Apartment HomesMore Than 400 Apartments Coming to Downtown Sacramento Near the Capitol
Strategic Legacy Investment Group Sacramento Sues Over Future River District Housing Site
CIM GroupWith CIM Out, 301 Capitol Mall Development Site in Limbo Again
Klingbeil Capital ManagementVirginia Firm Enters Sacramento Market with $26.8 Million Apartment Buy
FulcrumRiver One roposal Planned as Riverfront Destination, Housing
ABIMultifamily.com05 Sacramento MSA Q3 2019 Report

As a reporter and an analyst, you are always on the lookout for things like riots, fires and mudslides because they’re riveting to report and write about.
As someone who actually cares about the areas you cover, you want things to be slow, incremental and even placid.
Q3 gave a fair amount of both and, unusually, did it in all the markets we cover. Following is a quick look at many of the happenings we’ve been following.
National RentsIn major markets across the U.S., rent growth has slowed or retreated slightly. While we tend to make a point of trying to ignore analysts who look at nine weeks of data and pretend that’s a broad enough set to predict a trend, it does merit discussion.
While certainly not saturating, Class A vacancies have begun to inch up over the last two years in major markets like New York, LA, Washington (D.C.) and Seattle. An interesting quote in the “Emerging Trends in Real Estate® 2020” report noted, “It has largely to do with the finite limits of that more price-elastic group that can tolerate pass-along costs in their monthly rents, versus a far-larger and much faster-growing universe of people whose household incomes set lower rent tolerance levels.”
More people are moving out of their parents’ basements and moving into their own place, but even people who can afford it are looking at other-than-top-tier properties. As we have noted here repeatedly, that’s putting more pressure on availability in Class B and even Class C properties.
In still hot markets like Arizona in general and Phoenix in particular, that’s going to have continuing impacts on affordability and continue fueling the drive toward value-add renovations, particularly in the face of labor shortages and land costs in highly desirable submarkets, compared to completing and pressing new unit deliveries into the markets.
What’s Up with California?California is exceptionally fortunate that it has an economy larger than most developed nations to absorb the scope and breadth of its policy practices, even though it’s anyone’s guess how long that will remain the case if it continues its business-hostile ways from the past three-plus decades.
Most recently, the state has passed and scheduled a rent control process that has investors worried about what to do next. Short version: Rent growth is capped at 5% per year for properties older than 15 years. That’s likely going to gut the renovation and value-add market.
Combined with a slew of 18 new laws intended to create tax exemptions during construction, ease permitting, simplify zoning and remove other barriers to creating new and affordable housing, rent control could, potentially, fuel new development, particularly given the rent control statute’s exemption for properties newer than 15 years.
However, no amount of legislation is going to overcome the three harshest realities slowing development in California and around the country: 30 years of shunning trade skill training across the U.S. has created a horrifying lack of workers to execute projects; land prices are continuing to increase, and everything from concrete to rebar to drywall to nails is getting more expensive.
On the California upside, however, a 9/27 GlobeSt discussion with David Harrington of Matthews Real Estate Investment Services noted an interesting possibility as a result of the new state regulation: California properties, even those that haven’t traditionally raised rents on a year-over-year basis, could now start implementing 5% bumps every year like clockwork. For properties with secure and stable debt, that’s not the worst potential ROI outcome.
Oregon and New York also passed rent control measures this year, and many experts are concerned this could be the beginning
BY: ROLAND MURPHY, DIRECTOR OF RESEARCH
ABInsight ® SACRAMENTO MSA Q3 2019: BUSY TIMES. WHERE TO START?
ABIMultifamily.com 06Sacramento MSA Q3 2019 Report
of a national trend that could hamper the industry across the board.
The field of Democratic Party 2020 presidential candidates is still huge, and candidates are reaching far and wide to issue proposals that will get them noticed. Toward that end, a couple of the more prominent aspirants have floated the trial balloon of federal-level rent control. Details have been scant, but the idea could be appealing to younger voters starting their careers and having trouble affording the $1,189 national average for a two-bedroom.
Industry opinions on the idea have ranged from denial and dismissal to amusement to abject terror.
Sacramento Market Metrics:By the Numbers
While rent growth is slowing nationwide, Sacramento saw healthy, if not astounding, increases, and as a result the transaction interest was mixed.
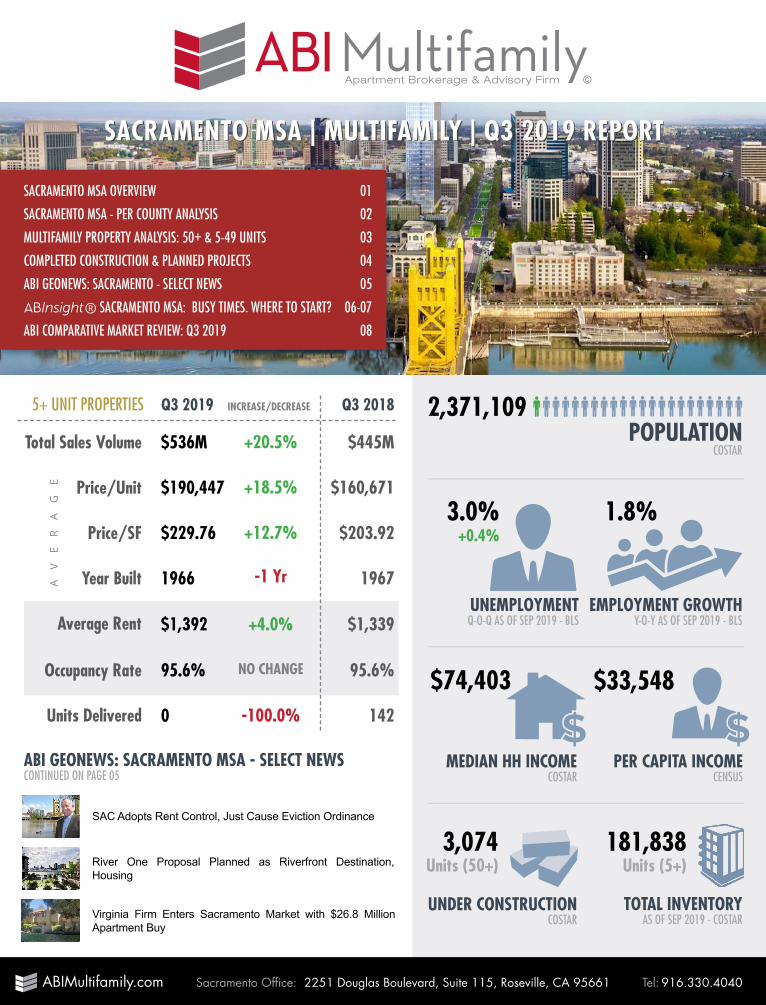
For 5-49 unit properties, Q3 saw a transaction volume of more than $36 Million, which represented a 20.6% Year-over-Year decrease from Q3 2018. In the 50+ unit category, Q3 brought in $499.3 Million, up 25.2% from the Q3 2018 volume.
Average Price-Per-Unit amounts were down in the 5-49 segment, falling 20.3% YoY to $153,639, and up 17.1% to $193,833 for 50+. These translated to an Average Price/SF of $225.60 in 5-49 (up 26.7%) and $230.07 (up 10.9%) in 50+.
Inventory age remained relatively consistent Year-over-Year, with Average Year Built for 5-49 being 1954, versus 1959 for the same quarter last year. Average Year Built in 50+ was 1983, compared to 1978 in 2018.
The market’s occupancy rate remained high. Q3 occupancy for 5+ units was 95.6%, unchanged Y-o-Y. Average rent was $1,392 up 4% ($53) from Q3 2018.
Sacramento MSA demographics continued their solid trends. The CoStar estimate of total population was 2,371,109. The unemployment rate finished the quarter at 3.0%, according to Bureau of Labor Statistics numbers.
Median Household Income was $74,403 and Per Capita Income came in at $33,548.
In the realm of new construction for 50+ unit properties, 1,488 units have been delivered at 10 projects so far in 2019.
An estimated 7,144 units are in the Planning stages across 35 properties. A total of 3,047 units were listed as Under Construction in 17 properties.
The average absorption rate, according to CoStar, is 89 units.
Total Unit Inventory for 5+ properties was 181,838, and 50+ came in at 147,242.
What’s in Store for California?Most experts at a recent conference in Los Angeles said they aren’t particularly worried about California’s 5% cap. However, if that turns out to be the beginning of the more sweeping changes some experts anticipate, and they have the effect of driving down transaction volume, it will likely turn up the heat for investment in Arizona as more investors look for new outlets.
California is seeing a significant out-migration as both companies and their workers look for less restrictive and more hospitable environments. While California’s economy remains robust, the dilution or outright loss of productive companies and the erosion of the population base are not sustainable.
At a recent business conference, Arizona Governor Doug Ducey said former California Governor Jerry Brown was the best friend he ever had, referring to the number of businesses and skilled employees who have shifted from California to Arizona. Current California Gavin Newsom is continuing many-to-most of Brown’s policies, so the trend can be expected to continue.
Negatives and hindrances aside, California’s cumulative wealth and commercial/industrial diversity are not going away anytime soon. While the rent control measure may be ill-advised in (nearly) every aspect, it is not as draconian as many initially feared it would be. That, combined with the 15-year asset age exemption and development-encouraging measures recently enacted, could, and likely will, serve as a bulwark against at least some of the damage the state’s policies, practices and general direction could have inflicted.
AB Insight ®
LIKE THIS ARTICLE?
REGISTER TODAY TO RECEIVE UPCOMING ABINSIGHT ARTICLES
BY EMAIL:
ABIMultifamily.com/Registration
ABInsight ® SACRAMENTO MSA Q3 2019: BUSY TIMES. WHERE TO START?
ABIMultifamily.com07 Sacramento MSA Q3 2019 Report

ABI COMPARATIVE MARKET REVIEW: Q3 2019RE
NT/O
CC/C
ONST
(50+
)DE
MOGR
APHI
CSSA
LES (
50+)
SACRAMENTO SAN DIEGO PHOENIX TUCSON
Total Population 2,371,109 3,370,979 4,737,270 1,026,099
Unemployment Rate (as of Sep 2019) 3.0% 2.7% 3.8% 4.1%
Employment Growth (y-o-y) 1.4% 1.8% 2.4% 3.1%
Median HH Income $74,403 $82,786 $57,935 $48,676
Per Capita Income $33,548 $34,350 $29,542 $27,323
Rent (Q3 2019) $1,392 $1,840 $1,176 $918
% Increase/Decrease +4.0% +3.0% +7.2% +8.1%
Occupancy (Q3 2019) 95.6% 95.5% 95.3% 94.5%
% Increase/Decrease NO CHANGE NO CHANGE +0.1% NO CHANGE
Total Inventory (50+) 147,242 231,916 307,928 67,053
Total Under Construction (50+) 3,074 7,810 14,728 1,156
Units Delivered (50+, Q3 2019) 0 549 1,895 154
Total Sales Volume (Q3 2019) $499M $313M $2.03B $193M
y-o-y % Increase/Decrease +25.2% +34.6% +11.1% -37.4%
Average P/U (Q3 2019) $193,833 $224,284 $171,381 $111,993
y-o-y % Increase/Decrease +17.1% +34.5% +21.3% -3.6%
ABIMultifamily.com 08Sacramento MSA Q3 2019 Report

©
LEADING MULTIFAMILY BROKERAGE TEAM IN THE WESTERN US200+ YEARS OF COMBINED MULTIFAMILY BROKERAGE EXPERIENCE
SEASONED ADVISORS WITH REGIONAL INSIGHTCOLLABORATION & COOPERATION
APARTMENT BROKERAGE & ADVISORY FIRMABI Multifamily is a brokerage and advisory services firm that focuses exclusively on apartment investment transactions.
The experienced advisors at ABI Multifamily have completed billions of dollars in sales and thousands of individual multifamily transactions.
SACRAMENTO ADVISORS
DAVID C. JUSTESEN SENIOR VICE PRESIDENT
CA DRE Broker #00853627
TYLER JUSTESENVICE PRESIDENT
CA DRE Broker #02044409
TUCSON
PHOENIXSANDIEGO
SACRAMENTO
SAN DIEGO OFFICE 1012 2nd Street, Suite 100 Encinitas, CA 92024
858.256.7690CA Lic #02015648
PHOENIX HEADQUARTERS5227 North 7th Street Phoenix, AZ 85014
602.714.1400
SACRAMENTO OFFICE2251 Douglas Blvd, Suite 115 Roseville, CA 95661
916.330.4040CA Lic #02015648
TUCSON OFFICE1650 North Kolb Road, Suite 230 Tucson, AZ 85715
520.265.1945
DISCLAIMER © 2019 ABI Multifamily | The information and details contained herein have been obtained from third-party sources believed to be reliable; however, ABI Multifamily has not independently verified its accuracy. ABI Multifamily makes no representations, guarantees, or express or implied warranties of any kind regarding the accuracy or completeness of the information and details provided herein, including but not limited to the implied warranty of suitability and fitness for a particular purpose. Interested parties should perform their own due diligence regarding the accuracy of the information. SOURCES: ABI Research / Bureau of Labor Statistics / Census Bureau / CoStar / Vizzda / US Chamber of Commerce / RED Comps / ARMLS
ABIMultifamily.com Sacramento Office: 2251 Douglas Boulevard, Suite 115, Roseville, CA 95661 Tel: 916.330.4040