RYANAIR’S FULL YEAR PROFIT RISES 204% TO €319M …€¦ · · 2015-11-10one-off dividend of...
19
Ryanair, Europe’s largest low fare airline today (June 1) announced full year Profits of €319m after tax, an increase of 204% over last years €105m profit. The airline also proposes to pay a one-off dividend of €500m (€0.34 per share) in October, subject to shareholder approval at its September AGM. Summary Table of Results (IFRS) - in euro Full Year Results Mar 31, 2009 Mar 31, 2010 % Change Passengers 58.6m 66.5m +14% Revenue €2,942m €2,988m +2% Adjusted Profit/(Loss) after Tax (Note 1) €105m €319m +204% Adjusted Basic EPS(euro cent)(Note 1) 7.10 21.59 +204% Announcing these results Ryanair’s CEO, Michael O’Leary, said: “The principal highlights of the past year include:- • Profits trebled to €319m. • Traffic growth of 14% to 67m. • 51 net new aircraft (y/e fleet 232xB737-800’s). • 8 new bases Bari, Brindisi, Faro, Leeds, Oslo Rygge, Pescara, Porto, Trapani (total 42). • 284 new routes (total 940). • Passenger service statistics further improved (No 1 on time major airline). • A dividend of €500m proposed (€846m returned to shareholders over the past 3 years). Results We can be proud of delivering a 200% increase in profits and traffic growth during a global recession when many of our competitors have announced losses or cutbacks, while more have gone bankrupt including, Bluewings (Ger), Globespan (UK), My Air (Italy), Segal Air and Sky Europe (Slovakia). Revenues rose 2% to €2,988m as air fares fell 13% while traffic grew 14% to 67m. Unit costs fell 19% due to lower fuel and rigorous cost control. Ancillary sales grew 11% to €664m slightly slower than traffic growth, and amounted to 22% of total revenues. Fuel costs declined 29% to €894m as oil prices fell from $104 to $62 pbl. We extended our hedging program to 90% for FY11 (at $730 per tonne), 50% of Q1 FY12 (at $750 per tonne) and 20% of Q2 FY12 (at $750 per tonne). Excluding fuel other unit costs fell by 3%. Capacity cuts by many European flag and non flag carriers caused traffic to fall at many major European airports. We are inundated with offers from large and small airports competing with lower costs and efficient facilities to win Ryanair’s growth. Our airport and handling unit costs fell by 9% despite steep increases at Dublin and Stansted. New routes and bases launched this year will ensure that despite a scandalous (up to) 40% increase in charges at Dublin airport, our airport and handling unit costs will decline again in FY11. The balance sheet has strengthened as cash has risen by €535m to €2.8bln. We took advantage of recent historically low rates to lock in many of our 2009/2010 deliveries at an all inclusive long term interest cost of under 4% pa. We are fully financed for the remaining 34 deliveries out to RYANAIR’S FULL YEAR PROFIT RISES 204% TO €319M FARES FALL 13% AS TRAFFIC GROWS 14% TO 67M PASSENGERS RYANAIR TO PAY DIVIDEND OF €500M IN OCTOBER.
Transcript of RYANAIR’S FULL YEAR PROFIT RISES 204% TO €319M …€¦ · · 2015-11-10one-off dividend of...
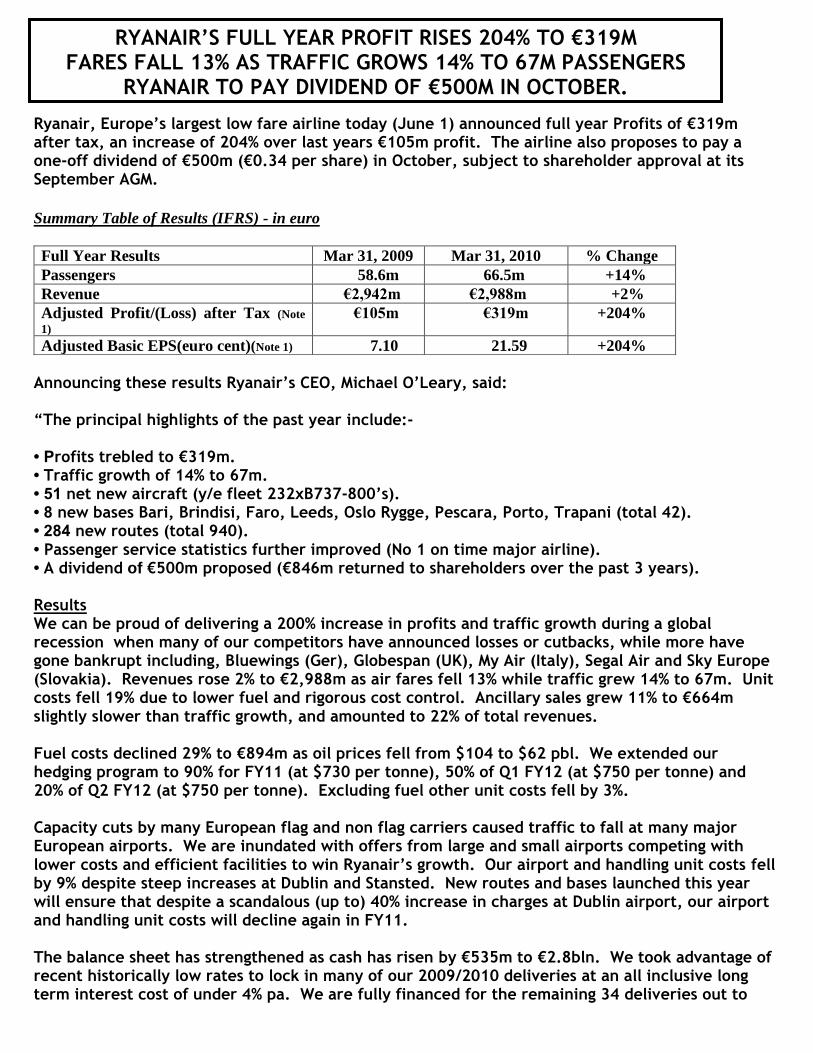
Ryanair, Europe’s largest low fare airline today (June 1) announced full year Profits of €319m after tax, an increase of 204% over last years €105m profit. The airline also proposes to pay a one-off dividend of €500m (€0.34 per share) in October, subject to shareholder approval at its September AGM.
Summary Table of Results (IFRS) - in euro
Full Year Results Mar 31, 2009 Mar 31, 2010 % Change
Passengers 58.6m 66.5m +14%
Revenue €2,942m €2,988m +2%
Adjusted Profit/(Loss) after Tax (Note
1) €105m €319m +204%
Adjusted Basic EPS(euro cent)(Note 1) 7.10 21.59 +204%
Announcing these results Ryanair’s CEO, Michael O’Leary, said: “The principal highlights of the past year include:- • Profits trebled to €319m. • Traffic growth of 14% to 67m. • 51 net new aircraft (y/e fleet 232xB737-800’s). • 8 new bases Bari, Brindisi, Faro, Leeds, Oslo Rygge, Pescara, Porto, Trapani (total 42). • 284 new routes (total 940). • Passenger service statistics further improved (No 1 on time major airline). • A dividend of €500m proposed (€846m returned to shareholders over the past 3 years). Results We can be proud of delivering a 200% increase in profits and traffic growth during a global recession when many of our competitors have announced losses or cutbacks, while more have gone bankrupt including, Bluewings (Ger), Globespan (UK), My Air (Italy), Segal Air and Sky Europe (Slovakia). Revenues rose 2% to €2,988m as air fares fell 13% while traffic grew 14% to 67m. Unit costs fell 19% due to lower fuel and rigorous cost control. Ancillary sales grew 11% to €664m slightly slower than traffic growth, and amounted to 22% of total revenues. Fuel costs declined 29% to €894m as oil prices fell from $104 to $62 pbl. We extended our hedging program to 90% for FY11 (at $730 per tonne), 50% of Q1 FY12 (at $750 per tonne) and 20% of Q2 FY12 (at $750 per tonne). Excluding fuel other unit costs fell by 3%. Capacity cuts by many European flag and non flag carriers caused traffic to fall at many major European airports. We are inundated with offers from large and small airports competing with lower costs and efficient facilities to win Ryanair’s growth. Our airport and handling unit costs fell by 9% despite steep increases at Dublin and Stansted. New routes and bases launched this year will ensure that despite a scandalous (up to) 40% increase in charges at Dublin airport, our airport and handling unit costs will decline again in FY11. The balance sheet has strengthened as cash has risen by €535m to €2.8bln. We took advantage of recent historically low rates to lock in many of our 2009/2010 deliveries at an all inclusive long term interest cost of under 4% pa. We are fully financed for the remaining 34 deliveries out to
RYANAIR’S FULL YEAR PROFIT RISES 204% TO €319M FARES FALL 13% AS TRAFFIC GROWS 14% TO 67M PASSENGERS
RYANAIR TO PAY DIVIDEND OF €500M IN OCTOBER.
2
January 2011. Our long term dollar hedging strategy for capex, which extends to the end of 2011, means that we will be purchasing aircraft in 2010/2011 at exceptionally low euro prices with a €/$ exchange rate of 1.46, significantly better than current rates. Current Issues. As we predicted Ireland’s tourism industry collapsed in 2009. Traffic at Dublin fell by over 3m (-13%) in a year when Ryanair’s traffic grew by 8m. Traffic at Dublin in 2010 to date has fallen by a further 14%. Ireland’s damaging €10 tourist tax and the govt. imposed (up to) 40% cost increases at Dublin airport will lead to a second year of government inspired tourism collapses. The opening of the DAA’s €1.2bln T2 in November is unnecessary as capacity at T1 has reached 30m pa while Dublin’s traffic will fall to under 18m in 2010. The DAA should mothball T2 which will reduce their operating costs, slash their high fees, and the government must scrap this damaging €10 tourist tax if Ireland is to return to being a competitive destination and reverse this 2 year tourism collapse. The Icelandic volcanic ash “monitoring” led to repeated, unnecessary, closures of large swathes of European airspace over 18 days from the 15th of April. These closures have caused the cancellation of 9,400 Ryanair flights, and the loss of 1.5m passengers up to the 18th of May. The full cost of these cancellations will not be known for some time and will depend on the claims we receive under the unfair and disproportionate EU261 regulations. We estimate the cumulative exceptional cost of these unnecessary cancellations is approx. €50m and we will continue to up-date shareholders quarterly on the likely final outcome. The recent revisions of the VAAC charts for guesstimating the position of non-existent volcanic ash “clouds” highlights the mismanagement of these eruptions by EU governments and regulatory agencies, who repeatedly and unnecessarily closed European air space. EU 261 is a manifestly unfair, disproportionate and discriminatory regulation which requires airlines to reimburse expenses of disrupted passengers even in force majeure cases. While volcanic ash airspace closures disrupted 1.5m Ryanair passengers over a period of 18 days we believe that airlines should not be exposed to such unlimited liability when the cause of these cancellations were clearly beyond the airlines control. Other competing transport providers such as coaches and ferries are not obliged under EU 261 to meet the cost of care during force majeure events. EU 261 needs to be amended to include a force majeure clause to relieve EU airlines of the “duty to care” obligations in such cases. The EU 261 legislation is also disproportionate as there is no cap on either the quantum or the period that air passengers can claim for. This discriminates against airlines because coaches and ferries have their liability limited to the ticket price paid which caps their exposure. The airlines’ liability to compensation and right to care reimbursements should also be limited to the ticket price paid. This would restore proportionality to the regulation since air passengers who have chosen to pay lower fares, and have benefited from significant savings, cannot and should not expect to receive unlimited compensation or reimbursements. Proposed €500m Dividend. In December 2009 we ended our discussions for a 200 new Boeing aircraft order. Since we don’t anticipate a new deal with Boeing for the foreseeable future, our gross capex will fall substantially over the next 3 years. We expect to generate up to €1bn in surplus cash by the end of FY13. We now propose to return €500m of this cash in a one off dividend in October 2010 subject to shareholder approval at our September AGM. We also anticipate that there may be a further
3
€500m (absent any new aircraft orders or other capex) available for return to shareholders either via share buy backs or another one off dividend by the end of FY13. This €500m dividend if approved in September will bring to €846m the amount of funds returned to shareholders by Ryanair in share buy backs and dividends over the past 3 years. Outlook. We expect to grow traffic in FY11 by 11% to 73.5m (subject to volcanic ash disruptions). Fuel costs will increase by €300m. However, subject to no further air space closures and an early return to normal bookings, we expect airfares (which fell 13% last year) to rise by between 5% to 10% due to the positive impact of our new routes and bases. Some of these, such as Faro and Malaga, are already producing higher fares during the summer although they will lead to a 10% increase in sector length. Q1 will be adversely impacted by weaker yields in May and June due to the volcanic ash disruptions, and the inclusion of part of Easter revenues in the prior period, as a result Q1 Net Profits are expected to be slightly lower than last year. Overall we expect costs per passenger to rise by 4% in 2010/11 (sector length adjusted they will fall by 6%). If as we expect, higher yields offset increased fuel and other operating costs, then profits (excluding exceptional costs from the recent volcanic ash disruptions) for the coming year should rise by between 10% to 15% to a range of approx. €350m to €375m”. ENDS.
Note 1 – March 2010 excludes an exceptional item of €13.5m for the impairment of our investment in Aer Lingus. The comparable year end March 2009 excludes exceptional items of i) accelerated depreciation of €51.6m on aircraft disposals in financial years ended 31 March, 2009 and 2010 and ii) a further €222.5m impairment of our investment in Aer Lingus to a year end value of €93.2m.
For further information Howard Millar Pauline McAlester
please contact: Ryanair Holdings plc Murray Consultants
www.ryanair.com Tel: 353-1-8121212 Tel: 353-1-4980300
Certain of the information included in this release is forward looking and is subject to important risks and uncertainties that could cause actual results to differ materially. It is not reasonably possible to itemise all of the many factors and specific events that could affect the outlook and results of an airline operating in the European economy. Among the factors that are subject to change and could significantly impact Ryanair’s expected results are the airline pricing environment, fuel costs, competition from new and existing carriers, market prices for the replacement aircraft, costs associated with environmental, safety and security measures, actions of the Irish, U.K., European Union (“EU”) and other governments and their respective regulatory agencies, fluctuations in currency exchange rates and interest rates, airport access and charges, labour relations, the economic environment of the airline industry, the general economic environment in Ireland, the UK and Continental Europe, the general willingness of passengers to travel and other economics, social and political factors.
Ryanair is the World’s favourite airline with 42 bases and 1100+ low fare routes across 26 countries, connecting 155 destinations. Ryanair operates a fleet of 247 new Boeing 737-800 aircraft with firm orders for a further 75 new aircraft (before taking account of planned disposals), which will be delivered over the next 2 years. Ryanair currently has a team of more than 7,000 people and expects traffic to grow to 73.5 million passengers in the current fiscal
4
year.
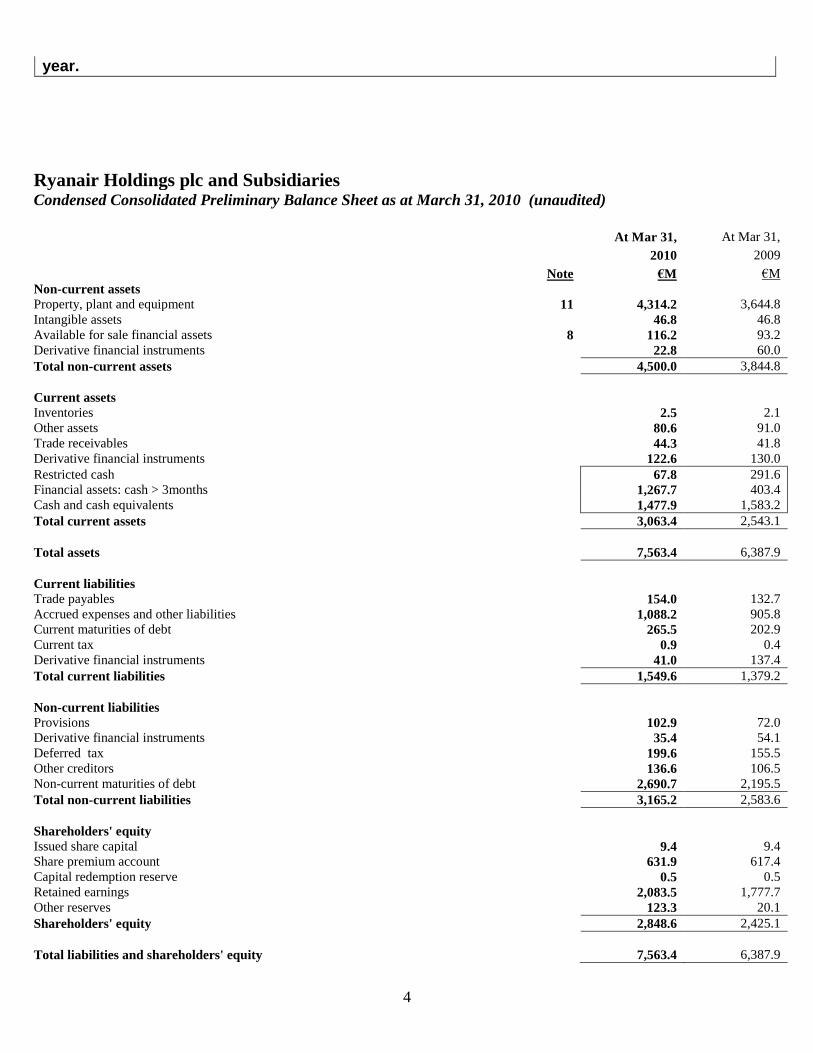
Ryanair Holdings plc and Subsidiaries Condensed Consolidated Preliminary Balance Sheet as at March 31, 2010 (unaudited)
At Mar 31, At Mar 31,
2010 2009
Note €M €M
Non-current assets
Property, plant and equipment 11 4,314.2 3,644.8
Intangible assets 46.8 46.8
Available for sale financial assets 8 116.2 93.2
Derivative financial instruments 22.8 60.0
Total non-current assets 4,500.0 3,844.8
Current assets
Inventories 2.5 2.1
Other assets 80.6 91.0
Trade receivables 44.3 41.8
Derivative financial instruments 122.6 130.0
Restricted cash 67.8 291.6
Financial assets: cash > 3months 1,267.7 403.4
Cash and cash equivalents 1,477.9 1,583.2
Total current assets 3,063.4 2,543.1
Total assets 7,563.4 6,387.9
Current liabilities
Trade payables 154.0 132.7
Accrued expenses and other liabilities 1,088.2 905.8
Current maturities of debt 265.5 202.9
Current tax 0.9 0.4
Derivative financial instruments 41.0 137.4
Total current liabilities 1,549.6 1,379.2
Non-current liabilities
Provisions 102.9 72.0
Derivative financial instruments 35.4 54.1
Deferred tax 199.6 155.5
Other creditors 136.6 106.5
Non-current maturities of debt 2,690.7 2,195.5
Total non-current liabilities 3,165.2 2,583.6
Shareholders' equity
Issued share capital 9.4 9.4
Share premium account 631.9 617.4
Capital redemption reserve 0.5 0.5
Retained earnings 2,083.5 1,777.7
Other reserves 123.3 20.1
Shareholders' equity 2,848.6 2,425.1
Total liabilities and shareholders' equity 7,563.4 6,387.9

5
Ryanair Holdings plc and Subsidiaries Condensed Consolidated Preliminary Income Statement for the year ended March 31, 2010 (unaudited)
Pre
Exceptional
Exceptional
IFRS
Year
Pre
Exceptional
Exceptional
IFRS
Year
Results Items Ended Results Items Ended
Mar 31, Mar 31, Mar 31, Mar 31, Mar 31, Mar 31,
2010 2010 2010 2009 2009 2009
Note €M €M €M €M €M €M
Operating revenues 1,42.
Scheduled revenues 2,324.5 - 2,324.5 2,343.9 - 2,343.9
Ancillary revenues 663.6 - 663.6 598.1 - 598.1
Total operating revenues - continuing operations
2,988.1
-
2,988.1
2,942.0
-
2,942.0
Operating expenses
Staff costs 335.0 - 335.0 309.3 - 309.3
Depreciation 235.4 - 235.4 204.5 51.6 256.1
Fuel & oil 893.9 - 893.9 1,257.1 - 1,257.1
Maintenance, materials & repairs 86.0 - 86.0 66.8 - 66.8
Aircraft rentals 95.5 - 95.5 78.2 - 78.2
Route charges 336.3 - 336.3 286.6 - 286.6
Airport & handling charges 459.1 - 459.1 443.4 - 443.4
Marketing, distribution & other 144.8 - 144.8 151.9 - 151.9
Total operating expenses 2,586.0 - 2,586.0 2,797.8 51.6 2,849.4
Operating profit - continuing operations
402.1
-
402.1
144.2
(51.6)
92.6
Other income/(expenses)
Finance income 23.5 - 23.5 75.5 - 75.5
Finance expense (72.1) - (72.1) (130.5) - (130.5)
Foreign exchange (loss)/gain (1.0) - (1.0) 4.4 - 4.4
Loss on impairment of available for sale
financial asset
-
(13.5)
(13.5)
-
(222.5)
(222.5)
Gain on disposal of property, plant & equipment
2.0
-
2.0
-
-
-
Total other income/(expenses) (47.6) (13.5) (61.1) (50.6) (222.5) (273.1)
Profit/(loss) before tax 354.5 (13.5) 341.0 93.6 (274.1) (180.5)
Tax on profit/(loss) on ordinary activities (35.7) - (35.7) 11.3 - 11.3
Profit/(loss) for the year - all attributable to
equity holders of parent
318.8
(13.5)
305.3
104.9
(274.1)
(169.2)
Earnings/(losses) per ordinary share (in € cent)
Basic 10 21.59 20.68 7.10 (11.44)
Diluted 10 21.52 20.60 7.08 (11.44)
Weighted average no. of ordinary shares (in Ms)
Basic 10 1,476.4 1,476.4 1,478.5 1,478.5
Diluted 10 1,481.7 1,481.7 1,481.2 1,478.5
6
Ryanair Holdings plc and Subsidiaries
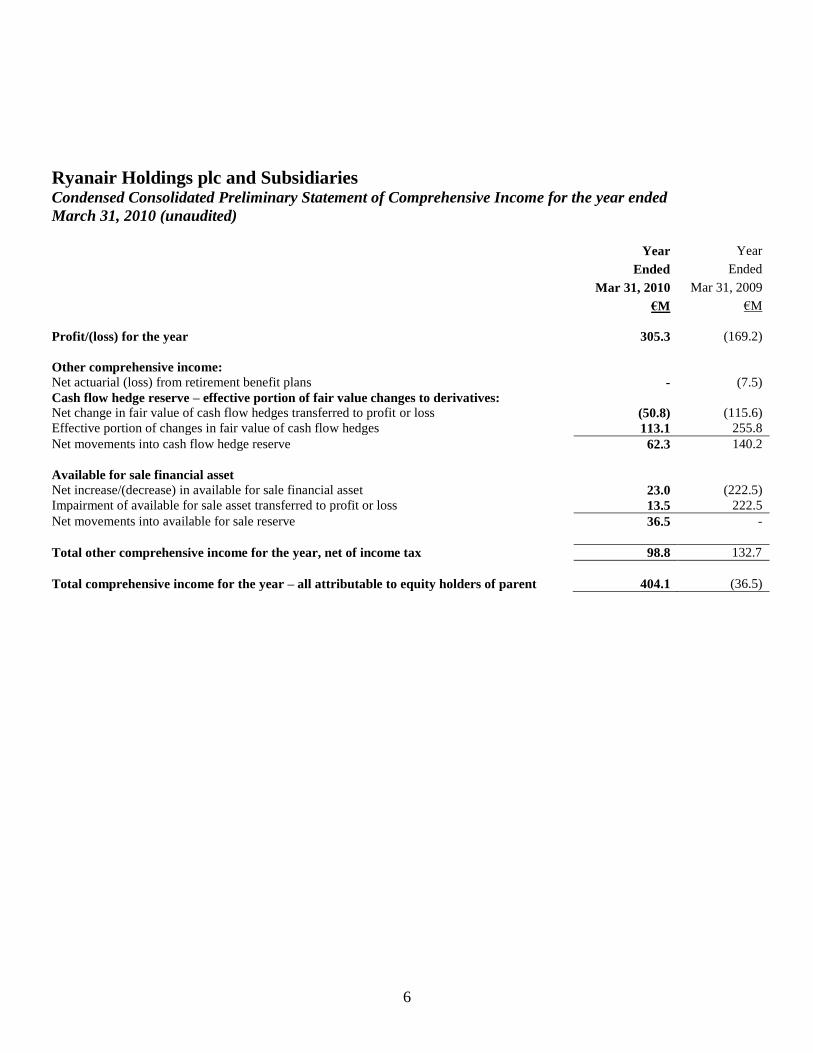
Condensed Consolidated Preliminary Statement of Comprehensive Income for the year ended
March 31, 2010 (unaudited)
Year Year
Ended Ended
Mar 31, 2010 Mar 31, 2009
€M €M
Profit/(loss) for the year 305.3 (169.2)
Other comprehensive income:
Net actuarial (loss) from retirement benefit plans
-
(7.5)
Cash flow hedge reserve – effective portion of fair value changes to derivatives:
Net change in fair value of cash flow hedges transferred to profit or loss (50.8) (115.6)
Effective portion of changes in fair value of cash flow hedges 113.1 255.8
Net movements into cash flow hedge reserve 62.3 140.2
Available for sale financial asset
Net increase/(decrease) in available for sale financial asset 23.0 (222.5)
Impairment of available for sale asset transferred to profit or loss 13.5 222.5
Net movements into available for sale reserve 36.5 -
Total other comprehensive income for the year, net of income tax 98.8 132.7
Total comprehensive income for the year – all attributable to equity holders of parent 404.1 (36.5)
7
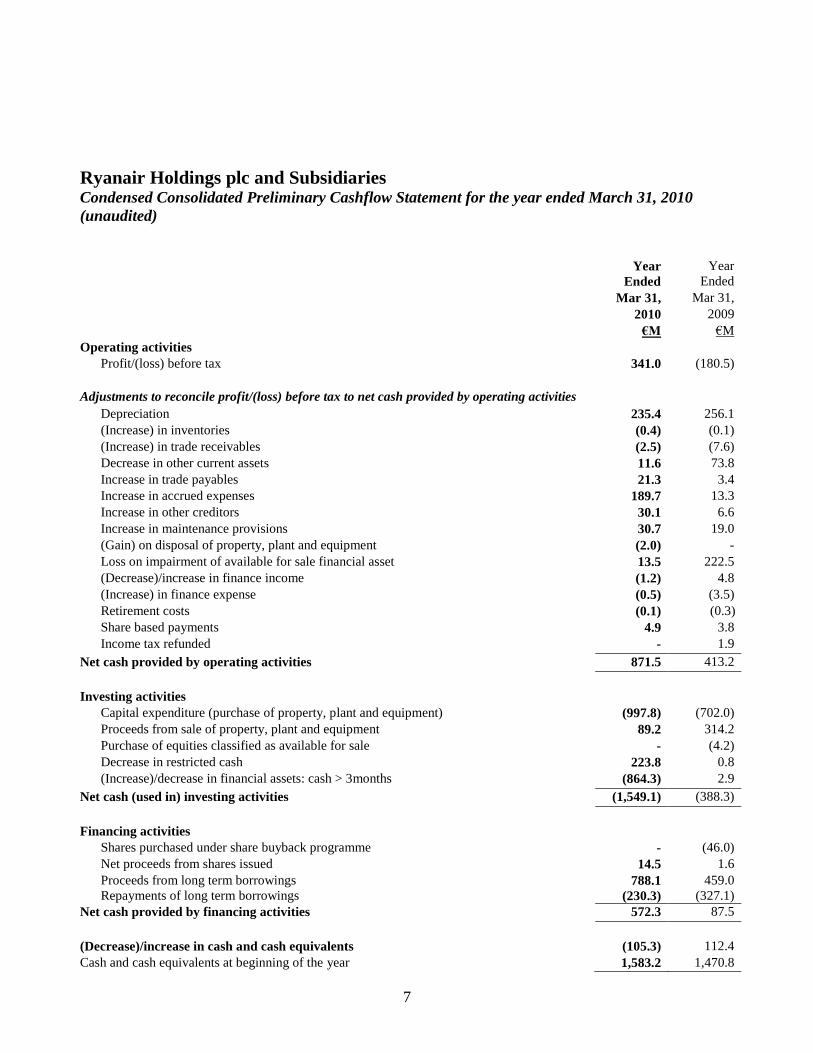
Ryanair Holdings plc and Subsidiaries Condensed Consolidated Preliminary Cashflow Statement for the year ended March 31, 2010
(unaudited)
Year
Year
Ended Ended
Mar 31, Mar 31,
2010 2009
€M €M
Operating activities
Profit/(loss) before tax 341.0 (180.5)
Adjustments to reconcile profit/(loss) before tax to net cash provided by operating activities
Depreciation 235.4 256.1
(Increase) in inventories (0.4) (0.1)
(Increase) in trade receivables (2.5) (7.6)
Decrease in other current assets 11.6 73.8
Increase in trade payables 21.3 3.4
Increase in accrued expenses 189.7 13.3
Increase in other creditors 30.1 6.6
Increase in maintenance provisions 30.7 19.0
(Gain) on disposal of property, plant and equipment (2.0) -
Loss on impairment of available for sale financial asset 13.5 222.5
(Decrease)/increase in finance income (1.2) 4.8
(Increase) in finance expense (0.5) (3.5)
Retirement costs (0.1) (0.3)
Share based payments 4.9 3.8
Income tax refunded - 1.9
Net cash provided by operating activities 871.5 413.2
Investing activities
Capital expenditure (purchase of property, plant and equipment) (997.8) (702.0)
Proceeds from sale of property, plant and equipment 89.2 314.2
Purchase of equities classified as available for sale - (4.2)
Decrease in restricted cash 223.8 0.8
(Increase)/decrease in financial assets: cash > 3months (864.3) 2.9
Net cash (used in) investing activities (1,549.1) (388.3)
Financing activities
Shares purchased under share buyback programme - (46.0)
Net proceeds from shares issued 14.5 1.6
Proceeds from long term borrowings
Repayments of long term borrowings 788.1
(230.3)
459.0
(327.1)
Net cash provided by financing activities 572.3 87.5
(Decrease)/increase in cash and cash equivalents (105.3) 112.4
Cash and cash equivalents at beginning of the year 1,583.2 1,470.8
8
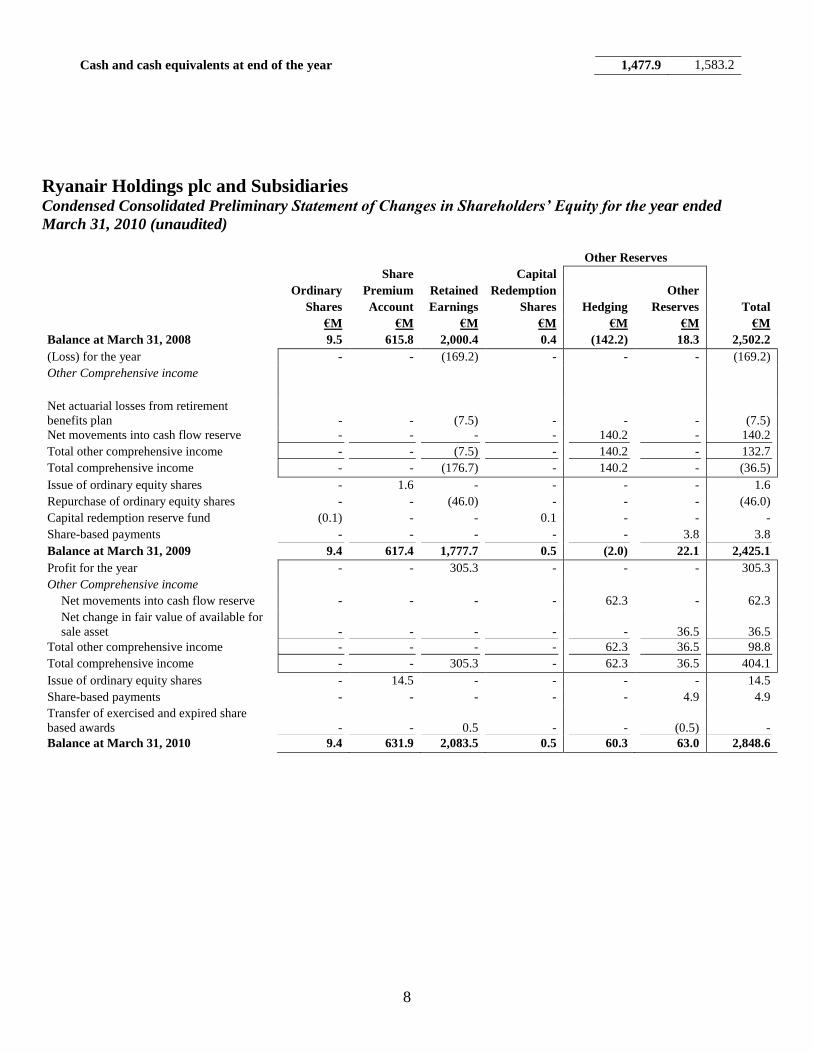
Cash and cash equivalents at end of the year 1,477.9 1,583.2
Ryanair Holdings plc and Subsidiaries Condensed Consolidated Preliminary Statement of Changes in Shareholders’ Equity for the year ended
March 31, 2010 (unaudited)
Share Capital
Ordinary Premium Retained Redemption Other
Shares Account Earnings Shares Hedging Reserves Total
€M €M €M €M €M €M €M
Balance at March 31, 2008 9.5 615.8 2,000.4 0.4 (142.2) 18.3 2,502.2
(Loss) for the year - - (169.2) - - - (169.2)
Other Comprehensive income
Net actuarial losses from retirement
benefits plan
-
-
(7.5)
-
-
-
(7.5)
Net movements into cash flow reserve - - - - 140.2 - 140.2
Total other comprehensive income - - (7.5) - 140.2 - 132.7
Total comprehensive income - - (176.7) - 140.2 - (36.5)
Issue of ordinary equity shares - 1.6 - - - - 1.6
Repurchase of ordinary equity shares - - (46.0) - - - (46.0)
Capital redemption reserve fund (0.1) - - 0.1 - - -
Share-based payments - - - - - 3.8 3.8
Balance at March 31, 2009 9.4 617.4 1,777.7 0.5 (2.0) 22.1 2,425.1
Profit for the year - - 305.3 - - - 305.3
Other Comprehensive income
Net movements into cash flow reserve - - - - 62.3 - 62.3
Net change in fair value of available for
sale asset
-
-
-
-
-
36.5
36.5
Total other comprehensive income - - - - 62.3 36.5 98.8
Total comprehensive income - - 305.3 - 62.3 36.5 404.1
Issue of ordinary equity shares - 14.5 - - - - 14.5
Share-based payments - - - - - 4.9 4.9
Transfer of exercised and expired share
based awards
-
-
0.5
-
-
(0.5)
-
Balance at March 31, 2010 9.4 631.9 2,083.5 0.5 60.3 63.0 2,848.6
Other Reserves
9
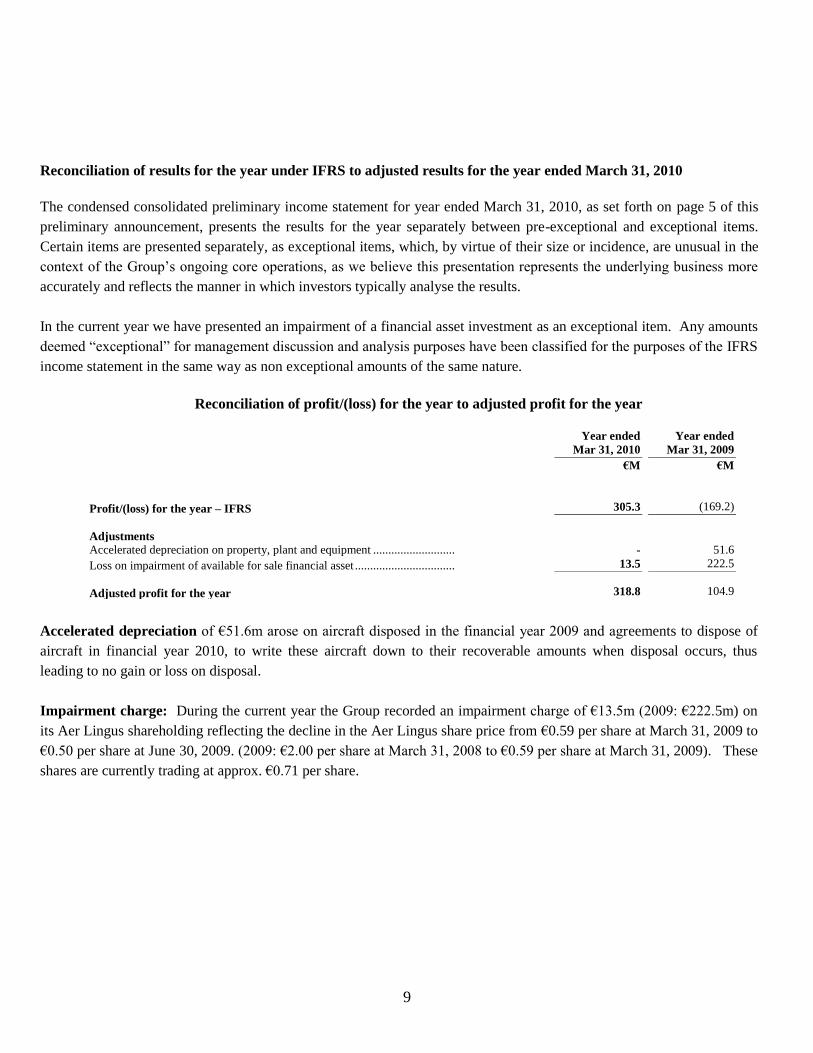
Reconciliation of results for the year under IFRS to adjusted results for the year ended March 31, 2010
The condensed consolidated preliminary income statement for year ended March 31, 2010, as set forth on page 5 of this
preliminary announcement, presents the results for the year separately between pre-exceptional and exceptional items.
Certain items are presented separately, as exceptional items, which, by virtue of their size or incidence, are unusual in the
context of the Group‟s ongoing core operations, as we believe this presentation represents the underlying business more
accurately and reflects the manner in which investors typically analyse the results.
In the current year we have presented an impairment of a financial asset investment as an exceptional item. Any amounts
deemed “exceptional” for management discussion and analysis purposes have been classified for the purposes of the IFRS
income statement in the same way as non exceptional amounts of the same nature.
Reconciliation of profit/(loss) for the year to adjusted profit for the year
Year ended
Mar 31, 2010
Year ended
Mar 31, 2009
€M €M
Profit/(loss) for the year – IFRS 305.3 (169.2)
Adjustments
Accelerated depreciation on property, plant and equipment ........................... - 51.6
Loss on impairment of available for sale financial asset ................................. 13.5 222.5
Adjusted profit for the year 318.8 104.9
Accelerated depreciation of €51.6m arose on aircraft disposed in the financial year 2009 and agreements to dispose of
aircraft in financial year 2010, to write these aircraft down to their recoverable amounts when disposal occurs, thus
leading to no gain or loss on disposal.
Impairment charge: During the current year the Group recorded an impairment charge of €13.5m (2009: €222.5m) on
its Aer Lingus shareholding reflecting the decline in the Aer Lingus share price from €0.59 per share at March 31, 2009 to
€0.50 per share at June 30, 2009. (2009: €2.00 per share at March 31, 2008 to €0.59 per share at March 31, 2009). These
shares are currently trading at approx. €0.71 per share.
10
Ryanair Holdings plc and Subsidiaries
Operating and Financial Overview
Introduction
For the purposes of the Management Discussion and Analysis (“MD&A”) all figures and comments are by reference to
the adjusted income statement excluding the exceptional items referred to below. A reconciliation of the results for the
year under IFRS to the adjusted results is provided on page 9.
Exceptional items in the year ended March 31, 2010 amounted to €13.5m reflecting an impairment of the Aer Lingus
shareholding recorded in the quarter to June 30, 2009. Exceptional items in the year ended March 31, 2009 amounted to
€274.1m consisting of an impairment of the Aer Lingus shareholding of €222.5m and an accelerated depreciation charge
of €51.6m on aircraft disposed in financial years 2009 and 2010.
Adjusted profit after tax excluding exceptional items increased by €213.9m to €318.8m. Including exceptional items the
profit after tax for the year amounted to €305.3m compared to a loss of €169.2m in the year ended March 31, 2009.
Summary year ended March 31, 2010
Adjusted profit after tax increased by €213.9m to €318.8m compared to €104.9m in the year ended March 31, 2009
primarily due to a 29% decrease in fuel costs, partially offset by a 13% decline in average fares. Total operating
revenues increased by 2% to €2,988.1m as average fares fell by 13% due to the recession, price promotions, and the
adverse impact of the movement in euro/sterling exchange rates. Ancillary revenues grew by 11% to €663.6m, lower than
the increase in passenger volumes, due to a decline in average spend per passenger primarily due to lower excess baggage
revenues, and the negative impact of the movement in euro/sterling exchange rates. Total revenue per passenger as a
result decreased by 11%, whilst the Load Factor increased by 1 point to 82% during the year.
Total operating expenses fell by 8% to €2,586.0m, primarily due to lower fuel prices, offset by the higher level of
activity and increased operating costs associated with the growth of the airline. Fuel, which represents 35% of total
operating costs compared to 45% in the prior year, decreased by 29% to €893.9m due to the fall in the price per gallon
paid offset by a 13% increase in the number of hours flown. Unit costs excluding fuel fell by 3% and including fuel they
fell by 19%. Operating margin increased by 8 points to 13% whilst operating profit increased by €257.9m to €402.1m.
Net margins increased to 11% from 4% at March 31, 2009 for the reasons outlined above.
Adjusted earnings per share for the year were 21.59 cent compared to 7.10 cent in the previous year ended March 31,
2009.
Balance sheet
Total cash and cash equivalents remained strong at €2,813.4m. The Group generated cash from operating activities of
€871.5m and a further €89.2m delivery proceeds on the sale of three Boeing 737-800 aircraft (and two spare engines)
which partially funded capital expenditure incurred during the year. Capital expenditure of €997.8m largely consisted of
advance aircraft payments for future aircraft deliveries and the delivery of 42 new Boeing 737-800 aircraft in the year.
Total debt, net of repayments, increased by €557.8m to €2,956.2m during the year. Net debt at year end was €142.8m.

11
Detailed Discussion and Analysis year ended March 31, 2010
Adjusted profit after tax, increased by €213.9m to €318.8m primarily due to lower fuel costs, partially offset by a 13%
decline in average fares. Total operating revenues increased by 2% to €2,988.1m as average fares fell by 13% due to the
recession, price promotions, the adverse impact of the movement in euro/sterling exchange rates and a 2% decline in
ancillary revenues per passenger, offset by a 14% increase in passenger numbers. Fuel, which represents 35% of total
operating costs compared to 45% in the prior year, decreased by 29% to €893.9m due to the fall in the price per gallon
paid offset by an increase in the number of hours flown. Unit costs excluding fuel fell by 3% and including fuel they fell
by 19%. Operating margin, as a result, increased by 8 points to 13%, whilst operating profit increased by €257.9m to
€402.1m.
Total operating revenues increased by 2% to €2,988.1m, as a 13% decline in average fares was offset by a 14% increase
in passenger traffic to 66.5m.
Total revenue per passenger decreased by 11% due to a 2% decline in ancillary revenues per passenger and a 13% fall
in average fares.
Scheduled passenger revenues decreased by 1% to €2,324.5m due to a 14% rise in passenger volumes offset by a 13%
decrease in average fares, due to the recession, price promotions, lower baggage penetration rates, and the adverse impact
of the movement in euro/sterling exchange rates. Load factor increased by 1 point to 82%, compared to the year ended
March 31, 2009.
Ancillary revenues increased by 11% to €663.6m, slower than the 14% increase in passenger volume, due to a 2%
decline in average spend per passenger primarily due to lower excess baggage revenues, and the adverse impact of the
movement in euro/sterling exchange rates.
Total operating expenses decreased by 8% to €2,586.0m due to the 29% decrease in fuel costs and 3% unit cost
reductions (excluding fuel) delivered in the year offset partially by the higher level of activity and costs associated with
the growth of the airline.
Staff costs increased by 8% to €335.0m. This reflects a 10% increase in average headcount to 7,032, offset by the impact
of, a company wide pay freeze, the higher portion of contract crew operating during the year, and the rise in cabin crew
numbers during the year who earn lower than the average salary.
Depreciation and amortisation increased by 15% to €235.4m. This reflects, net of disposals, an additional 39 lower cost
„owned‟ aircraft in the fleet this year compared to the year ended March 31, 2009.
Fuel costs decreased by 29% to €893.9m primarily due to the decline in fuel prices offset by an increase in the number of
hours flown.
Maintenance costs increased by 29% to €86.0m due to, a combination of, an increase in the average number of leased
aircraft from 40 to 50, additional costs arising from increased line maintenance activity at new bases, and handback
provisions for leased aircraft due to be returned in 2010 and 2011.
Aircraft rental costs increased by 22% to €95.5m, which is lower than the 25% increase in the average number of leased
aircraft from 40 to 50, reflecting the positive impact of lower lease rentals achieved.

12
Route charges rose by 17% to €336.3m due to an increase in the number of sectors flown and an increase in average unit
rates, offset by the positive impact of euro/sterling exchange rates.
Airport & handling charges increased by 4% to €459.1m due to a 14% increase in passenger volumes, offset by lower
costs at new airports and bases launched and savings achieved on handling costs.
Marketing, distribution and other expenses decreased by 5% to €144.8m, due to cost reductions achieved, and the
increased focus on internet based promotions.
Operating margin increased by 8 points to 13% due to the reasons outlined above and operating profits have increased
by €257.9m to €402.1m compared to the year ended March 31, 2009.
Finance income decreased by 69% to €23.5m primarily due to a combination of lower deposit interest rates and the
impact of the placement of funds with highly rated and guaranteed financial institutions which typically provide a lower
yield.
Finance expense decreased by 45% to €72.1m primarily due to the impact of lower interest rates offset by the drawdown
of additional debt to part finance the purchase of new aircraft.
Foreign exchange losses during the year of €1.0m are primarily due to the impact of movements in sterling against the
euro.
Balance sheet
Total cash and cash equivalents remained strong at €2,813.4m. The Group generated cash from operating activities of
€871.5m and a further €89.2m delivery proceeds on the sale of three Boeing 737-800 aircraft (and two spare engines)
which partially funded capital expenditure incurred during the year. Capital expenditure amounted to €997.8m and
largely consisted of advance aircraft payments for future aircraft deliveries and the delivery of 42 new Boeing 737-800
aircraft. Total debt, net of repayments, increased by €557.8m during the year to €2,956.2m. Net debt at year end was
€142.8m.
Shareholders’ equity at March 31, 2010 increased by €423.5m to €2,848.6m compared to March 31, 2009 due to the
impact of IFRS accounting treatment for derivatives and available for sale financial assets, stock option grants, a net profit
after tax of €305.3m in the year and the issue of new shares of €14.5m (as detailed on page 8).
13
Ryanair Holdings plc Notes forming Part of the Unaudited Condensed Consolidated
Preliminary Financial Statements
1. Basis of preparation and significant accounting policies
Ryanair Holdings plc (the “Company”) is a company domiciled in Ireland. The unaudited condensed consolidated
preliminary financial statements of the Company for the year ended March 31, 2010 comprise the Company and its
subsidiaries (together referred to as the “Group”).
The consolidated financial statements of the Group for the year ended March 31, 2009 are available at
www.ryanair.com.
The unaudited condensed consolidated financial information included in the preliminary announcement is prepared based
on accounting policies which are consistent with those accounting policies applied in the 2009 annual report. The
condensed consolidated financial information for the year ended March 31, 2010 is prepared in accordance with the
measurement principles of IFRS as adopted by the EU and in compliance with the measurement principles of IFRSs as
issued by the International Accounting Standards Board, which are effective at March 31, 2010.
The condensed consolidated financial information presented herein does not constitute the Company‟s statutory financial
statements for the years ended March 31, 2010 and 2009, within the meaning of the Companies (Amendment) Act, 1986.
The statutory financial statements for the year ended March 31, 2010 will be finalised on the basis of the financial
information presented by the directors in this preliminary results announcement and, together with the independent
auditor‟s report thereon, will be filed with the Irish Registrar of Companies following the Company‟s Annual General
Meeting and will also be available on the Company‟s website. The 2010 annual report and consolidated financial
statements will be circulated to shareholders shortly. Statutory financial statements for the year ended March 31, 2009
have been filed with the Irish Registrar of Companies. The independent auditor‟s report on those financial statements was
unqualified.
The Audit Committee, upon delegation of authority by the Board of Directors, approved the preliminary financial
statements for the year ended March 31, 2010 on May 27, 2010.
The following new standards and amendments to standards were adopted by the Group for the first time for the
financial year beginning April 1, 2009.
IFRS 8 - Operating Segments (“IFRS 8”). We adopted IFRS 8 which replaces IAS 14 - Segmental Reporting (“IAS
14”), during the year ended March 31, 2010. IFRS 8 requires a “management approach” under which segment
information is presented on the same basis as that used for internal reporting purposes. IAS 14 required identification
of two sets of segments — one based on business units and the other on geographical areas. IFRS 8 requires
additional disclosures around identifying segments and their products and services. Our operations are organised as a
single business unit, which is the provision of low-fares airline-related activities, including scheduled services, car
hire, internet income and related sales to third parties. There has been no change to the operating segment as a result
of the adoption of IFRS 8 and the reportable segment is consistent with that previously reported under the primary
business segment format of the segment reporting under IAS 14. The additional disclosures around identifying
segments and their products and services will be disclosed in the 2010 annual financial statements. Comparative
segment information will be represented, where necessary, in conformity with the requirements of IFRS 8. Since the
14
change in accounting policy only impacts the presentation and disclosure aspects, there is no impact on reported
results or earnings per share.
IAS 1 (revised) - Presentation of Financial Statements. The revised standard prohibits the presentation of items of
income and expenses (that is “non owner changes in equity”) within the statement of changes in equity, therefore
requiring “non owner changes in equity” to be presented separately from owner changes in equity. All “non owner
changes in equity” are required to be shown in a performance statement. Entities can choose whether to present one
performance statement (the statement of comprehensive income) or two statements (the income statement and the
statement of comprehensive income). We have elected to present two statements: an income statement and a
statement of comprehensive income. Also, the revised standard includes the statement of changes in shareholders‟
equity as a primary statement, rather than as a note to the financial statements. Since the change in accounting policy
only impacts the presentation and disclosure aspects, there is no impact on reported results or earnings per share.
Amendment to IFRS 7 “Improving Disclosures about Financial Instruments”. The relevant aspects of the
amendment will be addressed in the 2010 Annual Report disclosures.
We have considered all IFRS standards, amendments to these standards and IFRIC interpretations that have been issued,
but which are not yet effective, and have not been early adopted in these financial statements. The following revised and
new standards and interpretations will be adopted in future financial statements, where applicable. We do not anticipate
that the adoption of these new or revised standards and interpretations will have a material impact on our financial
position or results from operations.
IFRS 3 (revised 2008), “Business Combinations” (effective for new acquisitions occurring in financial years
beginning on or after July 1, 2009).
Amendment to IAS 27, “Consolidated and Separate Financial Statements” (effective for fiscal periods beginning on
or after July 1, 2009).
Amendments to IAS 39, “Financial Instruments: Recognition and Measurement: Eligible Hedged Items” (effective
for fiscal periods beginning on or after July 1, 2009).
IFRIC 17, “Distribution of Non-cash Assets to Owners”, (effective for fiscal periods beginning on or after 1 July
2009).
On April 16, 2009 the IASB published its second annual improvements project, “Improvements to International
Financial Reporting Standards 2009”. Effective dates are dealt with on a standard-by-standard basis.
Amendments to IFRS 2 “Share-based Payment – Group Cash-settled Share-based Payment Transactions” (effective
for fiscal periods beginning on or after January 1, 2010).
Amendment to IAS 32 “Financial Instruments: Presentation – Classification of Rights Issues” (effective for fiscal
periods beginning on or after February 1, 2010).
IFRIC 19 “Extinguishing Financial Liabilities with Equity Instruments” (effective for fiscal periods beginning on or
after July 1, 2010).
15
IAS 24 (revised 2009), “Related Party Disclosures”, (revised 2009) (effective for fiscal periods beginning on or after
January 1, 2011).
Amendments to IFRIC 14 “IAS 19 – The Limit on a Defined Benefit Assets, Minimum Funding Requirements and
their Interaction” (effective for fiscal periods beginning on or after January 1, 2011).
IFRS 9 “Financial Instruments” (effective for fiscal periods beginning on or after January 1, 2013).
On May 6, 2010 the IASB published its third annual improvements project, “Improvements to International Financial
Reporting Standards 2010”. Effective dates are dealt with on a standard-by-standard basis.
Exceptional items
The Company presents certain items separately, which are unusual, by virtue of their size and incidence, in the context of
our ongoing core operations, as we believe this presentation represents the underlying business more accurately and
reflects the manner in which investors typically analyse the results. In the current and prior period comparative we have
presented an impairment of a financial asset investment as an exceptional item. In the prior year comparative we have
presented accelerated depreciation related to aircraft disposals and the impairment of our investment in Aer Lingus
separately because of the unusual nature of these items. Any amounts deemed “exceptional” for management discussion
and analysis purposes have been classified for the purposes of the IFRS income statement in the same way as non
exceptional amounts of the same nature.
2. Estimates
The preparation of financial statements requires management to make judgements, estimates and assumptions that affect
the application of accounting policies and the reported amounts of assets and liabilities, income and expense. Actual
results may differ from these estimates.
In preparing these consolidated financial statements, the significant judgements made by management in applying the
Group‟s accounting policies and the key sources of estimation uncertainty were the same as those that applied in the most
recent published consolidated financial statements.
3. Seasonality of operations
The Group‟s results of operations have varied significantly from quarter to quarter, and management expects these
variations to continue. Among the factors causing these variations are the airline industry‟s sensitivity to general
economic conditions and the seasonal nature of air travel. Accordingly the first half-year typically results in substantially
higher revenues and results.
16
4. Income tax expense
The Group‟s consolidated effective tax rate in respect of operations for the year ended March 31, 2010 was 10.1% (2009:
negative 12.1%). The tax charge for the year ended March 31, 2010 of €35.7m (2009: tax credit €11.3m) primarily
comprises a deferred tax charge relating to temporary differences for property, plant and equipment recognised in the
income statement and the utilisation of previous trading losses.
5. Share based payments
The terms and conditions of the share option programme are disclosed in the most recent published consolidated financial
statements. The charge to the income statement in the year of approximately €4.9m (2009: €3.8m) is related to the fair
value of various share options granted in prior periods, which are being recognised within the income statement in
accordance with employee services rendered.
6. Contingencies
The Group is engaged in litigation arising in the ordinary course of its business. The Group does not believe that any such
litigation will individually or in aggregate have a material adverse effect on the financial condition of the Group. Should
the Group be unsuccessful in these litigation actions, management believes the possible liabilities then arising cannot be
determined but are not expected to materially adversely affect the Group‟s results of operations or financial position.
7. Capital commitments
At March 31, 2010 Ryanair had an operating fleet of 232 (2009: 181) Boeing 737-800 aircraft. It also had firm orders for
an additional 90 Boeing 737-800‟s. The delivery of these firm order aircraft will increase the fleet size (net of planned
disposals) to 299 aircraft by March 31, 2013.
8. Available for sale financial assets (Aer Lingus)
The movement on the available for sale financial asset from €93.2m at March 31, 2009 to €116.2m at March 31, 2010 is
comprised of an impairment charge of €13.5m on its shareholding in Aer Lingus, recognised in the income statement,
reflecting a further decline in the Aer Lingus share price from €0.59 per share at March 31, 2009 to €0.50 at June 30,
2009. This impairment charge is offset by a gain of €36.5m, recognised through other comprehensive income, reflecting
the subsequent increase in the share price to €0.73 per share at March 31, 2010. All impairment losses are required to be
recognised in the income statement and are not subsequently reversed, while gains are recognised through other
comprehensive income.
17
9. Analysis of operating segment
The Company is managed as a single business unit that provides low fares airline-related activities, including scheduled
services, car hire, internet income and related sales to third parties. The Company operates a single fleet of aircraft that is
deployed through a single route scheduling system.
As of April 1, 2009 the Company determines and presents operating segments based on the information that internally is
provided to the CEO, who is the Company‟s Chief Operating Decision Maker (CODM). When making resource
allocation decisions the CODM evaluates route revenue and yield data, however resource allocation decisions are made
based on the entire route network and the deployment of the entire aircraft fleet, which are uniform in type. The objective
in making resource allocation decisions is to maximise consolidated financial results, rather than individual routes within
the network.
The CODM assesses the performance of the business based on the consolidated adjusted profit/(loss) after tax of the
Company for the year. This measure excludes the effects of certain income and expense items, which are unusual, by
virtue of their size and incidence, in the context of the Company‟s ongoing core operations, such as the impairment of a
financial asset investment and accelerated depreciation related to aircraft disposals (see reconciliation on page 9).
All segment revenue is derived wholly from external customers and as the Company has a single reportable segment,
intersegment revenue is zero.
The Company‟s major revenue-generating asset comprises its aircraft fleet, which is flexibly employed across the
Company‟s integrated route network and is directly attributable to its reportable segment operations. In addition, as the
Company is managed as a single business unit, all other assets and liabilities have been allocated to the Company‟s single
reportable segment.
There have been no changes to the basis of segmentation or the measurement basis for the segment profit or loss since
March 31, 2009.
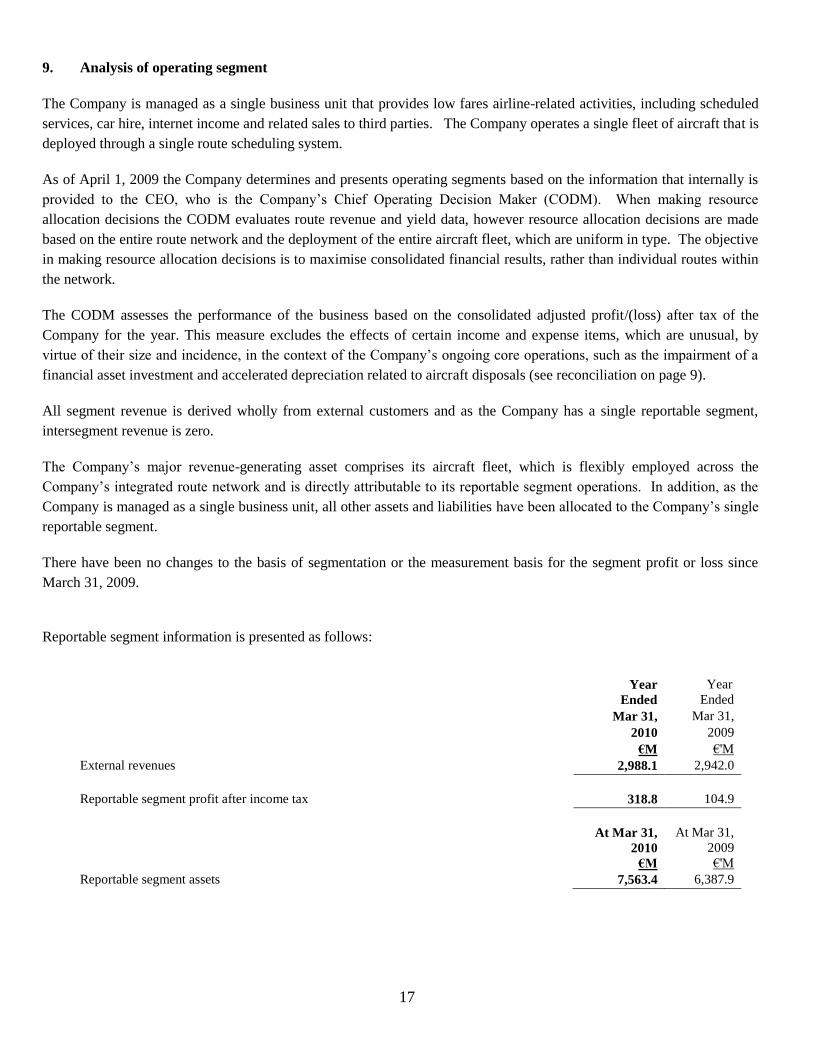
Reportable segment information is presented as follows:
Year
Year
Ended Ended
Mar 31, Mar 31,
2010 2009
€M €'M
External revenues 2,988.1 2,942.0
Reportable segment profit after income tax 318.8 104.9
At Mar 31,
2010
At Mar 31,
2009
€M €'M
Reportable segment assets 7,563.4 6,387.9

18
Reconciliation of reportable segment profit or loss to consolidated profit after income tax is as follows:
Year
Year
Ended Ended
Mar 31, Mar 31,
2010 2009
€M €'M
Total profit or loss for reportable segment 318.8 104.9
Other items of profit or loss
Loss on impairment of available for sale financial asset (13.5) (222.5)
Accelerated depreciation on property, plant and equipment - (51.6)
Consolidated profit/(loss) after income tax 305.3 (169.2)
10. Earnings/(losses) per share
Year Year
Ended Ended
Mar-31 Mar-31
2010 2009
Basic earnings/(losses) per ordinary share euro cent 20.68 (11.44)
Diluted earnings/(losses) per ordinary share euro cent 20.60 (11.44)
Weighted average number of ordinary shares (in M‟s) - basic 1,476.4 1,478.5
Weighted average number of ordinary shares (in M‟s) - diluted 1,481.7 1,478.5
Diluted earnings per share takes account solely of the potential future exercises of share options granted under the
Company‟s share option schemes and the weighted average number of shares includes weighted average share options
assumed to be converted of 5.3m (2009: Nil). For the year ended 31 March 2009 there were no differences in the
weighted-average number of ordinary shares used for basic and diluted net loss per ordinary share as the effect of all
potentially dilutive ordinary shares of 2.7m outstanding was anti-dilutive.
11. Property, plant and equipment
Acquisitions and disposals
During the year ended March 31, 2010, the Group acquired assets with a cost of €997.8m (March 31, 2009: €702.0m).
Three Boeing 737-800 aircraft and two spare engines were disposed of during the year, generating sales proceeds of
€89.2m.
19
12. Post balance sheet events
(i) A volcanic ash cloud covered most of Northern Europe between April 15, and April 22, 2010 which resulted in the
closure of airspace for almost all of this period. In addition, on various dates in May there were more airspace closures.
These closures resulted in the cancellation of 9,490 flights for 1.5M passengers. In addition, under EU 261/2004, the
Company is required to either refund passengers the cost of their cancelled flights or, in the case of passengers who had
already travelled, to reimburse them for reasonable receipted accommodation, meals and other expenses. The Company
expects to refund these monies and reimburse passengers reasonable expenses although it will take a substantial period of
time to complete this and management estimates that the approximate costs of this and the non recoverable fiscal costs
incurred during the cancellations will be in the order of €50M.
(ii) The directors, subject to shareholder approval at the Company‟s AGM in September 2010, have proposed a one off
dividend of €500m for the year ended March 31, 2010 to be paid in October 2010.
13. US GAAP Reconciliation
Following on from the issuance by the SEC of Rule 3235 “Acceptance from Foreign Private Issuers of Financial
Statements prepared in accordance with International Financial Reporting Standards without reconciliation to US GAAP”,
the Group has chosen to exclude a US GAAP Reconciliation from these preliminary financial statements.
14. Related party transactions
We have related party relationships with our subsidiaries, directors and senior key management personnel. All
transactions with subsidiaries eliminate on consolidation and are not disclosed.
There were no related party transactions in the year ended March 31, 2010 that materially affected the financial position or
the performance of the Company during that period and there were no changes in the related party transactions described
in the 2009 Annual Report that could have a material effect on the financial position or performance of the Company in
the same period.