Rural road safety – policy options
30
Published Project Report PPR200 Rural road safety – policy options D A Lynam
Transcript of Rural road safety – policy options

Published Project Report PPR200
Rural road safety – policy options
D A Lynam


TRL Limited
PUBLISHED PROJECT REPORT PPR 200
Rural road safety – policy options Version: Final
by D. A. Lynam (TRL Limited)
Prepared for:Project Record: T701A Ad Hoc Advice on Road Safety
Client: Road User Safety Division, Department for Transport (Paul Jackson)
Copyright TRL Limited February 2007 This report has been prepared for Department for Transport, Road User Safety Division. The views expressed are those of the author and not necessarily those of the Department.
Approvals
Project Manager
Quality Reviewed

This report has been produced by TRL Limited, under/as part of a Contract placed by Department for Transport. Any views expressed are not necessarily those of the Department. When purchased in hard copy, this publication is printed on paper that is FSC (Forest Stewardship Council) registered and TCF (Totally Chlorine Free) registered.

TRL Limited PPR 200
CONTENTS
Executive summary i
1 Introduction 1
1.1 Structure and function of the rural road network 1 1.1.1 Trunk roads 1 1.1.2 Non-Trunk roads 2
1.2 Future options 2 1.2.1 Current practice 2 1.2.2 Elements in an overall strategy 2
1.3 International context 3
2 Rural road casualties 4
2.1 Conclusions from earlier reports 4 2.1.1 Casualty patterns 4 2.1.2 Involvement of vulnerable road users 4 2.1.3 Contributory factors 5
2.2 Detailed analysis of non-trunk road data 7 2.3 Seat belt wearing in fatal accidents 10
3 Potential countermeasures for non-Trunk roads 11
3.1 Behavioural measures 11 3.2 Engineering measures 11 3.3 Other measures 13
4 Potential treatment for each road type 15
4.1 LA Dual carriageways 15 4.2 LA Major road single carriageways 15 4.3 LA Minor two lane roads 16 4.4 Trunk roads 16 4.5 Focus for behavioural measures 17
5 Potential casualty reductions and total investment 17
5.1 Estimates of potential casualty reductions by road type and policy 19 5.2 Estimates of costs and benefits 19
6 Future rural road policy 20
Acknowledgements 21
References 21

TRL Limited i PPR 200
Published Project Report Version: Final
Executive summary This report examines the data available on the distribution of rural road casualties and the factors contributing to their occurrence, and gives the author’s view of the potential policy options available for future improvement of rural road safety on non-Trunk roads.
The rural road safety problem is many faceted, with casualties occurring across road types, road user groups and speed limits. Various larger casualty groups have been identified for particular focus, but a wide range of policies need to be pursued.
Continuation or limited extension of traditional policies may only yield up to a 5% saving in the national KSI casualty total.
If this is all that is done, it is unlikely to overcome the key problems that for major roads, current usage is diverse and safety is often in conflict with mobility and accessibility, while for the very large network of minor roads, engineering and enforcement programmes are very expensive, and many drivers’ perception and use of these roads is inconsistent with their design and their usage by more vulnerable road users.
Some other countries, notably Sweden and the Netherlands, are giving greater attention to rural road safety, within their national strategies. They are doing this both through creating different visions of how safety on these roads should be considered, and also by trialling innovative measures developed to foster the principles underpinning these visions. These principles include clearer separation of road functions, more consistent and more easily recognisable designs for roads within each category, and the reduction of injury severity by ensuring that the protection provided by the road environment is consistent with the vehicle speeds allowed on them.
The situation on major rural roads can be improved to some extent by the commitment of greater resources to both engineering and enforcement. An unknown but potentially quite large number of fatalities on these roads are associated with non-wearing of seatbelts by vehicle occupants. A problem largely limited to dual carriageways is the incidence of shunt accidents resulting from unsafe close following. Initiatives to tackle both these issues should be considered. Future ITS measures could contribute to safer behaviour, particularly through seat-belt and alcohol interlocks.
But to make substantive savings in rural road casualties, four policy themes need to be pursued.
• Defining a network of major roads that will operate as high speed roads with more limited access
• Upgrading these to largely eliminate junction, head-on and run-off fatalities – introduce and enforce close following restrictions The effectiveness of these measures will be limited by the extent to which drivers continue to fail to use seatbelts or drive at excessive speeds, because the injury protection criteria will be set for those drivers conforming with the traffic regulations
• Increasing funding for low cost measures on the major roads which do not become part of this network, concentrating on similar accident types but also on improving pedestrian and cyclist facilities
• Defining a network of minor road zones with extensive publicity to encourage drivers to travel at speeds of 40mph over much of this network and to recognise the risks to varied road users and within settlements within these zones
Changes of this substance can only be made with strong national political support, with national investment and publicity programmes supporting implementation by local authorities.
A rural road demonstration project could usefully include within its objectives the clearer definition of functional networks for both major and minor roads, the creation of more distinctive design features for the different networks, the development and trialling of innovative measures to modify driver behaviour and improve injury protection on these networks, and the trialling of widespread local publicity to persuade drivers to modify their use of minor roads.

1TRL Limited 1 PPR 200
Published Project Report Version:
1 Introduction Two reports have been provided to DfT, describing the current casualty patterns on rural roads:
Stats19 analysis of rural road casualties from 2000-2004 (Walters, 2006)
Contributory factors in rural accidents (Broughton, 2006)
This report builds on the data in these reports, extending it to look in more detail at local authority rural roads, and discusses the potential countermeasures available to reduce casualties further on these roads, their likely cost effectiveness in different circumstances, and suggests the way in which DfT might develop future policy for these roads.
The report also draws heavily on a review of rural road safety carried out by Hamilton and Kennedy in 2005, for the Scottish Executive. Although the scope for application of measures is different on English roads, the general information on accident causation factors and reported effectiveness of measures is highly relevant.
1.1 Structure and function of the rural road network
Rural roads are defined as in Walters (2006). Previous analyses of rural road safety have defined rural roads as those with a speed limit greater than 40mph (Non Built-Up roads). Speed limits have been lowered on many rural roads in recent years and thus defining rural roads by their speed limit is not appropriate. The new GIS-based system implemented in 2002 reflects a wider range of speeds on rural roads. About 60% of traffic, 65% of fatalities, 48% of KSI injuries, and 39% of all casualties occur on these roads.
1.1.1 Trunk roads
Trunk roads have a clear function to facilitate strategic traffic movements throughout Britain. This objective needs to be achieved as safely as possible and with minimum environmental disturbance, but minimising congestion and maintaining higher traffic speed is a key part of the trunk road function. These roads should therefore be engineered to a quality where high speeds can be achieved safely. Improvement programmes for this network are developed and managed by the Highways Agency and the Scottish Executive, who have set their own strategic objectives. They will not therefore be considered in depth in this report.
Over recent years, the English trunk road network has been reduced in size (Table 1) with a substantial proportion of previous single carriageway trunk roads being handed back to local authority management. The Highways Agency has made considerable safety improvements to these roads during this transition period.
Highways Agency network
1999 network 2004 network
Motorway 2904 2896
Dual carriageway 3147 2628
Length (kms)
Single carriageway 3872 1616
Dual carriageway 3.68 3.43 Casualties per km
Single carriageway 2.27 2.47
Dual carriageway 27.6 24.3 Casualties per vehicle km Single carriageway 45.9 44.9

2TRL Limited 2 PPR 200
Published Project Report Version:
Table 1 Change in size and characteristics of the English trunk road network between 1999 and 2004
1.1.2 Non-Trunk roads
The functions of the non-trunk road network are much more diverse, ranging from regional distributors to local access roads. The dual carriageways and many of the more major single carriageways play a major role in carrying through traffic and this role has been increased with the transfer of part of the previous trunk road network. One of the most important needs therefore is to define clear categories of road within this overall network, each having a clear function. This is made difficult however by the very varied levels of development and landscape through which these roads pass. The challenge for the future is to bring a more ordered structure to this network which improves the safety of its use, whilst recognising this diversity.
Section 2.2 summarises the current state of this network in terms of road length, traffic, casualty type and casualty rate by road type and classification.
1.2 Future options
1.2.1 Current practice
For many years local authorities have implemented low cost local safety schemes on non-trunk local roads, both at individual sites and along more major routes. The level of intervention has varied between authorities, but a general reduction in casualty rate can be seen throughout the network.
In earlier periods these programmes often focussed on urban roads where the density of casualties was higher, but considerable attention has also been given to rural roads, particularly to accidents at bends and junctions, since 1990 (Barker et al, 1998). Specific programmes have also targeted major roads passing through villages (Wheeler and Taylor, 1999) and the development of Quiet Lanes (Kennedy and Wheeler, 2004).
For the last ten years, the desirability of a better rural road hierarchy on which to base a more consistent speed management process has been discussed. This has culminated in a revision of the Roads Circular on setting speed limits on single carriageway rural roads, with parallel advice being developed by the Highways Agency for speed management on their roads.
Speed camera enforcement programmes have also included sites on rural roads, although these are in the minority and mainly limited to major roads. Other publicity programmes – drink drive, speeding, seat-belt wearing – have covered all roads, but because of the large mileage involved, enforcement on more minor roads has a relatively low priority. In recent years, driver training programmes have also given more attention to the skills required for driving on higher speed rural roads.
1.2.2 Elements in an overall strategy
Future policy for rural roads needs to accept that the low density of casualties on rural roads other than those that are heavily trafficked means that in cost benefit terms the returns on engineering measures will be low. At the same time, if casualty numbers are to be reduced by significant proportions, ways must be found of changing the behaviour of drivers on these roads, and of mitigating the severity of injuries when accidents do occur.
It seems likely that a future strategy will need to include the following elements:
3TRL Limited 3 PPR 200
Published Project Report Version:
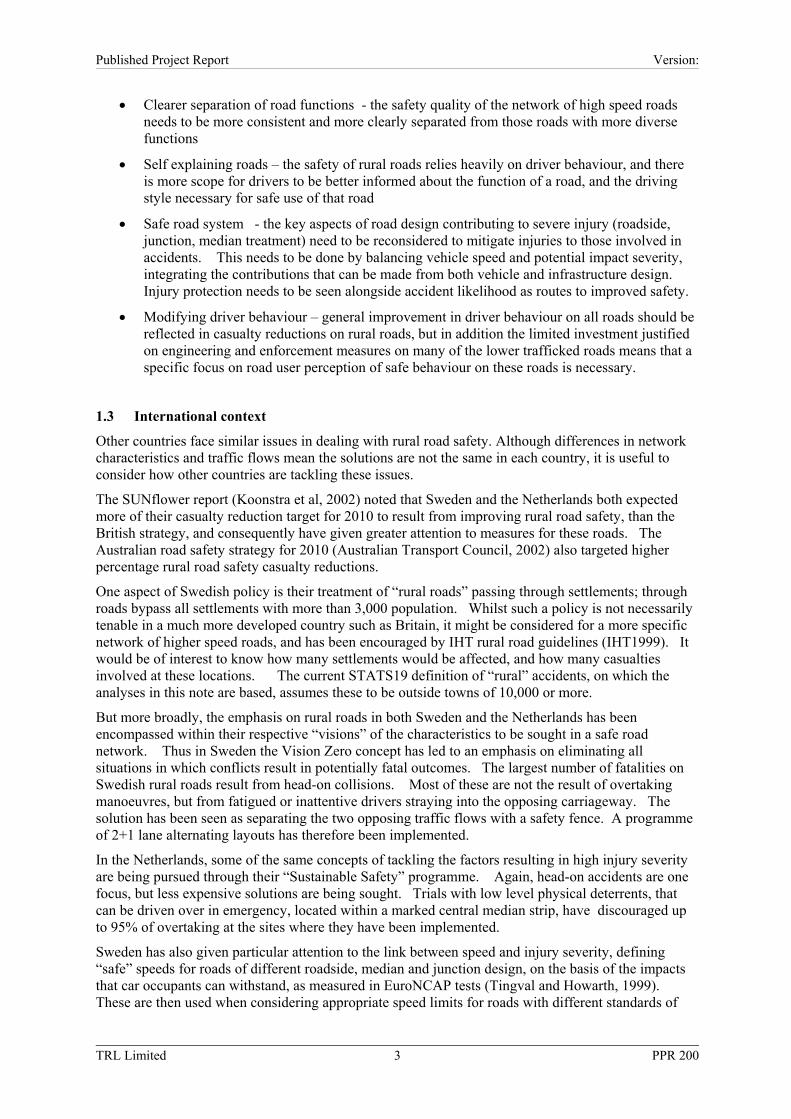
• Clearer separation of road functions - the safety quality of the network of high speed roads needs to be more consistent and more clearly separated from those roads with more diverse functions
• Self explaining roads – the safety of rural roads relies heavily on driver behaviour, and there is more scope for drivers to be better informed about the function of a road, and the driving style necessary for safe use of that road
• Safe road system - the key aspects of road design contributing to severe injury (roadside, junction, median treatment) need to be reconsidered to mitigate injuries to those involved in accidents. This needs to be done by balancing vehicle speed and potential impact severity, integrating the contributions that can be made from both vehicle and infrastructure design. Injury protection needs to be seen alongside accident likelihood as routes to improved safety.
• Modifying driver behaviour – general improvement in driver behaviour on all roads should be reflected in casualty reductions on rural roads, but in addition the limited investment justified on engineering and enforcement measures on many of the lower trafficked roads means that a specific focus on road user perception of safe behaviour on these roads is necessary.
1.3 International context
Other countries face similar issues in dealing with rural road safety. Although differences in network characteristics and traffic flows mean the solutions are not the same in each country, it is useful to consider how other countries are tackling these issues.
The SUNflower report (Koonstra et al, 2002) noted that Sweden and the Netherlands both expected more of their casualty reduction target for 2010 to result from improving rural road safety, than the British strategy, and consequently have given greater attention to measures for these roads. The Australian road safety strategy for 2010 (Australian Transport Council, 2002) also targeted higher percentage rural road safety casualty reductions.
One aspect of Swedish policy is their treatment of “rural roads” passing through settlements; through roads bypass all settlements with more than 3,000 population. Whilst such a policy is not necessarily tenable in a much more developed country such as Britain, it might be considered for a more specific network of higher speed roads, and has been encouraged by IHT rural road guidelines (IHT1999). It would be of interest to know how many settlements would be affected, and how many casualties involved at these locations. The current STATS19 definition of “rural” accidents, on which the analyses in this note are based, assumes these to be outside towns of 10,000 or more.
But more broadly, the emphasis on rural roads in both Sweden and the Netherlands has been encompassed within their respective “visions” of the characteristics to be sought in a safe road network. Thus in Sweden the Vision Zero concept has led to an emphasis on eliminating all situations in which conflicts result in potentially fatal outcomes. The largest number of fatalities on Swedish rural roads result from head-on collisions. Most of these are not the result of overtaking manoeuvres, but from fatigued or inattentive drivers straying into the opposing carriageway. The solution has been seen as separating the two opposing traffic flows with a safety fence. A programme of 2+1 lane alternating layouts has therefore been implemented.
In the Netherlands, some of the same concepts of tackling the factors resulting in high injury severity are being pursued through their “Sustainable Safety” programme. Again, head-on accidents are one focus, but less expensive solutions are being sought. Trials with low level physical deterrents, that can be driven over in emergency, located within a marked central median strip, have discouraged up to 95% of overtaking at the sites where they have been implemented.
Sweden has also given particular attention to the link between speed and injury severity, defining “safe” speeds for roads of different roadside, median and junction design, on the basis of the impacts that car occupants can withstand, as measured in EuroNCAP tests (Tingval and Howarth, 1999). These are then used when considering appropriate speed limits for roads with different standards of

4TRL Limited 4 PPR 200
Published Project Report Version:
safety design. The Netherlands is also considering a similar approach, and one of the principles of Sustainable Safety is avoiding situations in which conflicts occur between road users of different mass or travelling at different speeds.
2 Rural road casualties
2.1 Conclusions from earlier reports
These are largely based on Walter (2006), Broughton (2006), and Hamilton and Kennedy (2005).
2.1.1 Casualty patterns
• Rural roads accounted for 66% of fatalities and 49% of KSI in GB in 2004.
• The proportion of KSI casualties on rural roads decreased at a lower rate than on urban roads in recent years.
• Roads with high traffic flows have a higher density of casualties but a lower risk in terms of rate per vehicle km.
• For all casualty severities, the largest proportion occurs on single carriageway Class A roads, ranging from 48% of fatalities to 38% of all injury casualties.
• About 61% of fatalities and KSI casualties on rural roads are car occupants and 19% motorcyclists, About three-quarters of car occupant fatalities and two thirds of motorcycle fatalities occur on rural roads
• Single vehicle accidents account for over 30% of all rural non-motorway accidents and 37% of fatal accidents; they are most likely to occur on B or C class roads at night, on bends, and involve young drivers
2.1.2 Involvement of vulnerable road users
• Young drivers/passengers: Young drivers are over-represented in accidents in relation to their vehicle mileage on all types of road. Both Hughes and Amis (1996) and Barker at al (1998) noted that younger drivers, particularly males, were over represented in accidents involving the “faster” manoeuvres such as going ahead and overtaking, on rural single carriageways.
• Motorcyclists: Sexton (2004) found, for motorcyclist accidents on rural roads in Scotland, that these tended to be more often the fault of the motorcyclist, resulted from loss of control, involved sports bikes, and occurred on single carriageways with 60mph limits.
• Children: Christie at al (2002) found that a minority of accidents involving children occurred on non-built up roads and these tended to be child passengers and had a lower severity ratio than adult car occupants. There were also many fewer child pedestrian and child cyclist accidents than in built-up areas. The only issues highlighted were children walking with their back to traffic and child cyclists being vulnerable at private driveways.
• Pedestrians - 18% of KSI pedestrian casualties and 30% of pedestrian fatalities occur on rural roads
• Cyclists - 27% of KSI cyclist casualties and 48% of cyclist deaths occur on rural roads. Gardner and Gray (1998) found the rate of fatal cycling accidents per vehicle km is almost 3 times that on built up roads, and the severity of cycling accidents increase with speed limit.

5TRL Limited 5 PPR 200
Published Project Report Version:
• Tourists/visitors – Sharples and Fletcher (2001) examined whether tourists and visitors contributed disproportionately to casualties on rural roads in Scotland; while the increased traffic results in more accidents, it is difficult to establish higher levels of risk.
2.1.3 Contributory factors to accidents on rural roads
2.1.3.1 Behavioural factors
Speed - Identifying the role of speed in accidents through contributory factor studies is difficult as it depends on an assumption of appropriate speed for the location. Earlier contributory factor data (Broughton, 2005) has shown up to 30% of fatal accidents associated with excessive or inappropriate speed. More recently, Broughton (2006) noted about 15% of fatal accidents and 11% of serious accidents recorded as having excessive speed as a contributory factor. The proportions are slightly higher for lower Class (B to U) roads. He also showed this factor associated with about 40% of KSI casualties in single vehicle car accidents involving loss of control, and 30% of single vehicle motorcycle accidents involving loss of control.
The influence of speed on accidents has been identified through cross-sectional studies (Taylor et al, 2002) as resulting in between 4 and 7% extra accidents per 1mph above the average speed for the road, with the larger effects on lower quality roads.
Alcohol - Broughton (2006) showed similar proportions (about 5%) of fatal and serious accidents on rural roads were recorded with alcohol as a contributory factor, with no large variation between road types. The comparable percentages for urban roads are 8% of fatal and 6% of serious accidents.
Fatigue - Evidence of fatigue from contributory factor studies is very limited. It can be expected to be a larger factor on rural roads than on urban roads, and on lightly trafficked roads than heavily trafficked. (eg Reyner et al, 2001; Flatley et al, 2004). Incidence may be high (up to 30%) on high quality, high speed roads when flows are low, typically linked to night-time driving, young males and also to drivers in the course of work. However, involvement is likely to be low on lower class roads (references above suggest 3% for rural B roads), particularly those whose features are continually changing eg winding roads.
Distraction/inattention Broughton (2006) showed 7-8% of fatal and serious accidents on rural roads to be related to inattention, with the lowest proportions (5%) on unclassified roads. Mobile phone use is often cited as one cause of inattention, with even the use of hands free phones having a significant effect on concentration on the driving task (Burns et al 2002). Wallace (2003) failed to find any substantial effect from external distractions such as advertising boards.
Careless/Aggressive driving
Careless/thoughtless/reckless behaviour was recorded in about 9% of fatal and serious accidents (Broughton, 2006) with little variation between road types. Aggressive driving was recorded in another 2-3% of accidents.
Failure to judge
Failure to judge one’s own or another’s path or speed was noted as a contributory factor in 16% of both fatal and serious accidents on all rural roads on average, but only about 10% on lower class (B to U roads) .
Observational issues
Failure to look and failed to see were noted as factors in 7% of fatal accidents and 10% of serious accidents on rural roads.
Inexperience
Broughton (2006) showed this recorded in 9% of all loss of control accidents on rural roads, with the highest involvement on C and unclassified roads.

6TRL Limited 6 PPR 200
Published Project Report Version:
Seat belt use Wearing rates are generally higher on high speed rural roads. However a proportion of fatal and seriously injured casualties involve occupants not wearing seatbelts. The size of this group is not known accurately, but estimates of up to 50% of fatalities have been suggested in Sweden. Data for GB from the CCIS project indicate 25% of fatalities are unbelted with a further 15% unknown.
2.1.3.2 Engineering factors
The main sources of information for this section are Walmsley and Summersgill (1998), Hughes and Amis (1996), Barker et al (1998), Hamilton and Kennedy (2005) and Broughton 2006.
OECD 1999 states that about 80% of fatal accidents on rural roads are related to four accident types – accidents involving vulnerable road users, accidents associated with intersections, single vehicles running off the road, and head-on collisions. Further analyses, as part of EuroRAP (Lynam et al 2005) have shown how the proportions of each of these accident types vary in GB for different road types and different traffic flows.
Road width
Increased road width is generally associated with lower accident rates, although estimates of the size of the effect vary in different studies. Carriageway or lane narrowing potentially leads to lower speeds, but seemingly not enough to balance the increased risk of driving along the narrower roads.
Horizontal and vertical alignment
Walmsley and Summersgill found that bendiness and hilliness have only a small effect on accident risk on rural trunk roads, but these are engineered to fairly high standards. On non-trunk roads, Barker (1998) and Hughes and Amis (1996) both found increased bendiness led to increased accident risk. Taylor et al (2002) also showed that across a variety of non-trunk rural road types, more sharp bends per km were associated with higher accident risk.
Broughton (2006) showed about 10% of fatal and serious accidents involving loss of control to be at bends or on winding roads. He also showed this factor to be associated with a similar proportion of all single vehicle motorcycle accidents.
Roadside characteristics
The width of the safety zone (ie the area in which vehicles can recover or stop without serious impact) on the side of the road has a significant effect on casualty outcome. The influence of this area is also affected by the slope and nature of the ground and the presence of ditches. Carriageway edge treatments can help the driver avoid leaving the road.
Junctions and accesses
The influence of junctions depends on the number of conflicting movements allowed and the speed and angle at which these can take place. Additional major junctions (roundabouts and traffic signals) typically only increase accident rates by a small amount. Movements controlled by only give way markings, without the need for main road speeds to be reduced lead to potentially greater increase in risk. Significant proportions of accidents have been recorded at private accesses on single carriageway roads.
2.1.3.3 Other factors
Emergency medical response
Hamilton and Kennedy quote emergency service response time as an important issue in relation to casualty outcome in Scotland; similar situations may be found in the most rural areas in England and Wales.
Agricultural vehicles

7TRL Limited 7 PPR 200
Published Project Report Version:
Knight (2001) suggested that these vehicle drivers are less likely to be responsible for their accident involvements than other drivers but may pose a specific risk to motorcyclists on rural roads.
Wild animals
Collisions with these are not recorded in national road casualty statistics.
2.2 Detailed analysis of non-trunk road data
The aim of these tables is to provide the broad context for assessing the scope for interventions on non-trunk rural roads. All accident data relate to the period 2000 to 2005. More detailed assessments for each road type are given in section 4 below.
Of the 65% of fatal casualties occurring on rural roads in Great Britain (Table 2), the large majority (53%) are on non-trunk roads. A rather smaller proportion (48%) of KSI casualties occurs on rural roads, but again the majority of these (41%) occur on non-trunk roads. In relation to road length however the density of KSI casualties on rural non-trunk roads is only about a quarter that on trunk roads.
Rural Urban
Trunk Non-trunk Trunk Non-trunk
Killed 2524 (12%) 10705 (53%) 162 (1%) 6920 (34%)
KSI 16707 (7%) 91366 (41%) 1184 (1%) 116086 (52%)
Length 12119 234500 506 140550
KSI/km/yr 0.23 0.06 0.39 0.14
Table 2 Safety characteristics of the road network in Great Britain
Table 3 shows the distribution of the rural non-trunk road casualties in Great Britain between 2000 and 2005 by road type (excluding a small number with unknown road type). The density of KSI casualties varies from about 0.02 per km on B, C and U class roads to 0.6 per km on dual A class roads. Average rates per vehicle km are similar for both major and minor roads.
Road type K (2000-2005)
KSI (2000-2005)
Length (2004)
Km
Traffic (2004)
billion vehicle km
KSI per year per km
KSI per
billion vehicle km
M and Dual A
987 6295 1738 0.6
Single A 5682 42233 25,197
81.6 * 0.24
99.1
B 1952 17643 24,640 0.11
C 847 8731 73,363 0.02
U 1237 15833 109,561
65.9
0.02
106.7
* excludes Local Authority motorways
Table 3 Distribution of rural non-trunk road casualties in Great Britain

8TRL Limited 8 PPR 200
Published Project Report Version:
Table 4 shows the distribution of casualties at bends and junctions by road type for rural non-trunk roads. On average across all rural non-trunk roads, about 18% of casualties occur where there is both a bend and a junction close to the accident location.
Percentage of all Killed Percentage of all KSI
At bend At junction At bend At junction
M and Dual A
17.3 32.2 15.5 35.0
Single A 36.4 26.5 30.9 36.6
B 45.3 25.1 40.0 33.7
C 46.6 17.8 44.0 29.5
U 39.2 25.5 35.4 31.7
Table 4 Percentages of casualties at bends and junctions on rural non-trunk roads
Table 5 shows the distribution of fatal casualties on non- trunk rural roads by road type and road user type. 60% of fatalities are car occupants or motorcyclists on major (ie Class A or B) single carriageway roads.
Killed Casualty type
Road type Pedestrian Pedal cycle Motorcycle Car occupant
LGV or HGV occupant
Other
M and Dual A
1.6 0.4 1.2 5.5 0.4 0.1
Single A 4.7 1.2 11.0 33.7 2.0 0.5
B 1.6 0.6 4.5 11.1 0.4 0.2
C 0.8 0.3 1.5 5.2 0.1 0.1
U 1.7 0.7 2.6 6.2 0.2 0.2
All 10.4 3.2 20.8 61.7 3.1 1.1
Table 5 Percentages of fatalities by road type and road user group on non-trunk rural roads
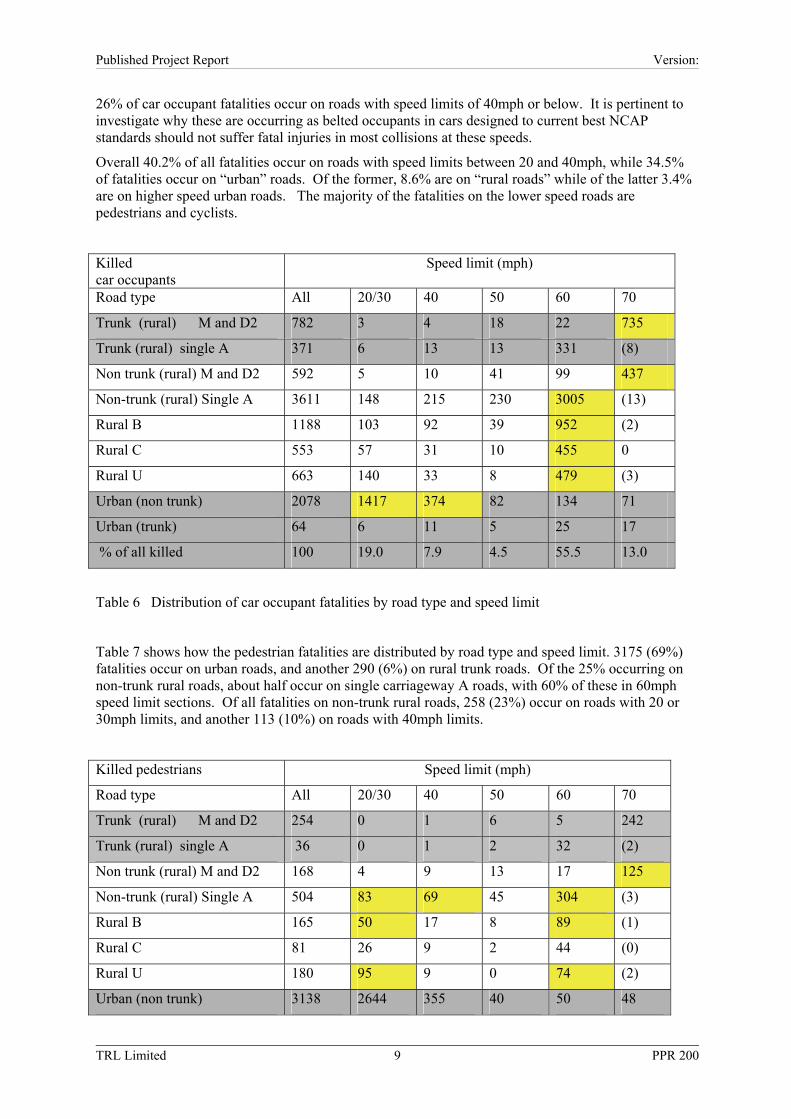
Table 6 shows the incidence of car occupant fatalities on roads with different speed limits.
9TRL Limited 9 PPR 200
Published Project Report Version:
26% of car occupant fatalities occur on roads with speed limits of 40mph or below. It is pertinent to investigate why these are occurring as belted occupants in cars designed to current best NCAP standards should not suffer fatal injuries in most collisions at these speeds.
Overall 40.2% of all fatalities occur on roads with speed limits between 20 and 40mph, while 34.5% of fatalities occur on “urban” roads. Of the former, 8.6% are on “rural roads” while of the latter 3.4% are on higher speed urban roads. The majority of the fatalities on the lower speed roads are pedestrians and cyclists.
Killed car occupants
Speed limit (mph)
Road type All 20/30 40 50 60 70
Trunk (rural) M and D2 782 3 4 18 22 735
Trunk (rural) single A 371 6 13 13 331 (8)
Non trunk (rural) M and D2 592 5 10 41 99 437
Non-trunk (rural) Single A 3611 148 215 230 3005 (13)
Rural B 1188 103 92 39 952 (2)
Rural C 553 57 31 10 455 0
Rural U 663 140 33 8 479 (3)
Urban (non trunk) 2078 1417 374 82 134 71
Urban (trunk) 64 6 11 5 25 17
% of all killed 100 19.0 7.9 4.5 55.5 13.0
Table 6 Distribution of car occupant fatalities by road type and speed limit
Table 7 shows how the pedestrian fatalities are distributed by road type and speed limit. 3175 (69%) fatalities occur on urban roads, and another 290 (6%) on rural trunk roads. Of the 25% occurring on non-trunk rural roads, about half occur on single carriageway A roads, with 60% of these in 60mph speed limit sections. Of all fatalities on non-trunk rural roads, 258 (23%) occur on roads with 20 or 30mph limits, and another 113 (10%) on roads with 40mph limits.
Killed pedestrians Speed limit (mph)
Road type All 20/30 40 50 60 70
Trunk (rural) M and D2 254 0 1 6 5 242
Trunk (rural) single A 36 0 1 2 32 (2)
Non trunk (rural) M and D2 168 4 9 13 17 125
Non-trunk (rural) Single A 504 83 69 45 304 (3)
Rural B 165 50 17 8 89 (1)
Rural C 81 26 9 2 44 (0)
Rural U 180 95 9 0 74 (2)
Urban (non trunk) 3138 2644 355 40 50 48

10TRL Limited 10 PPR 200
Published Project Report Version:
Urban (trunk) 37 4 7 2 3 21
% of all killed 100 63.7 10.5 2.6 13.5 9.7
Table 7 Distribution of pedestrian fatalities by road type and speed limit
Table 8 shows the equivalent picture for pedal cycle fatalities.
Killed cyclists Speed limit (mph)
Road type All 20/30 40 50 60 70
Trunk (rural) M and D2 34 3 31
Trunk (rural) single A 10 9 1
Non trunk (rural) M and D2 45 2 5 4 34
Non-trunk (rural) Single A 128 21 7 10 87 3
Rural B 60 9 9 2 38 2
Rural C 32 8 2 22
Rural U 71 25 3 43
Urban (non trunk) 391 309 54 6 15 7
Urban (trunk) 14 2 6 1 0 5
% of total 100 47.6 10.6 3.1 28.1 10.6
Table 8 Distribution of pedal cyclist fatalities by road type and speed limit
Casualties to occupants of Goods Vehicle only contribute a small proportion of total casualties, although these vehicles are involved in accidents in which other road user groups are killed or seriously injured.
Of the 318 fatalities of light goods vehicle occupants in the six years investigated, 290 were on rural roads. Of these, only 101 were on non-trunk rural roads; half occured on 60mph Class A roads and only 8 occured on lower class roads. Similarly, of 388 fatalities among heavy goods vehicle occupants, 333 occured on rural roads, of which 118 were on trunk roads. Of the remaining 215, the majority (142) were on single carriageway Class A roads, over 80% of them on 60mph sections; only 28 HGV occupants were killed on lower class roads, mostly in 60mph sections.
2.3 Seat belt wearing in fatal accidents
Data on fatal accidents collated by Broughton (2006b) suggest seatbelt wearing of drivers involved in fatal accidents varies by age and time of day. Male driver rates (for both urban and rural roads combined) averaged 80% across all ages during daytime but only 66% at night. Comparative figures for female drivers were 88% and 90%. Data from in-depth accident studies (Cuerden, 2006) suggest that seatbelts were not used in 25% of fatal accidents, with use uncertain in another 15% .

11TRL Limited 11 PPR 200
Published Project Report Version:
3 Potential countermeasures for non-Trunk roads
3.1 Behavioural measures
Education and Publicity
It has always proved difficult to establish the effectiveness of education and publicity in terms of casualty reduction, but these measures have the potential to reach a large audience if appropriate media are used. On the rural road network particularly, there appears to be a need to change driver perceptions and gain acceptance of a change in behaviour to meet the risks on these roads.
The philosophy behind the recent revision of advice on speed limits should be emphasised and drivers’ understanding of the sources of risk on major and minor roads improved. In particular, it should be recognised that the appropriate speed for major single carriageway rural roads should be 50mph, with 60mph only appropriate on those roads which have been engineered to allow safe driving at this speed. Drivers should be able to see and accept that speed management measures are implemented to help them choose appropriate speeds for the road, not as an artificial restriction. THINK campaigns have already focussed on some of the problems in driving too fast on rural roads; these campaigns should be continued and extended.
Drink drive publicity messages are probably best developed across all roads, as there seems to be little difference in the role of alcohol in contributory factor studies, and no evidence from the literature of greater effectiveness of measures in rural than in urban roads.
The likelihood of fatigue is much greater on major rural roads, where long journeys are being made, than on urban or minor rural roads. Encouragement to plan more time for journeys and to take adequate breaks appears the main focus for campaigns, but this is often in conflict with both work pressures and with private travel plans.
Driver training
Accident analysis suggests that inexperience is a greater factor in accidents on minor roads and the proportion of young drivers involved in fatalities on these roads is higher than on other roads. More attention is now given in driver training to vehicle control skills on higher speed roads. Increased emphasis should perhaps also be given to the unexpected risks occurring on lower class roads.
Enforcement
Both speed enforcement and drink drive enforcement are as important on major rural roads as on urban roads, to reinforce education and awareness campaigns. SARTRE surveys have suggested that the perception of the risk of being stopped for drink driving in Britain is higher than the real risk, so the numbers of drinking drivers are likely to increase unless these risks are brought in line by increasing the real risk of apprehension. It may be particularly difficult in rural areas to convince drivers of the risk, provide the perception of high levels of enforcement, and reach as many drinking drivers per officer hour, compared with on high flow urban roads. The introduction of evidential testing at the roadside should be particularly helpful in rural areas, and should be pursued as quickly as possible.
3.2 Engineering measures
Speed management
Many effective local speed management schemes have been introduced. These should be seen as an important part of the overall philosophy of helping drivers to choose appropriate speeds. One initiative worthy of more attention is the definition of lower speed (40mph) zones including all minor rural roads within an area, with the boundaries of the zone being publicised and clearly marked as with 20mph urban areas.
Vehicle Activated Speed Signs

12TRL Limited 12 PPR 200
Published Project Report Version:
Reductions in mean speeds of 3-6mph have been observed following the introduction of these signs on approaches to bends, junctions, or at speed limit changes, and substantial accident reductions have been recorded at these sites (Winnett and Wheeler, 2003). These signs can be recognised by drivers as providing useful information to help speed choice.
Markings and surfaces (good maintenance)
While good lane markings and edge markings clarify the delineation of the road, any potential casualty reduction from these better visual clues tends to be diluted by the likelihood of drivers increasing their speed, unless other measures are implemented in parallel which negate this effect. Some studies have suggested various forms of unusual marking or road surface, including intentional absence of central white lines, can encourage drivers to reduce speeds (Hamilton and Kennedy, 2005). Skid resistant surfacing may be warranted where conflicts may cause drivers to brake sharply.
Rumble devices
These are often used on the approach to hazardous situations, both to alert drivers to the hazard and to encourage reduced speed.
Bend specific
Chevron markings, marker posts and advance warning signs have traditionally been used to alert drivers to bends. The risk of head-on collisions can be reduced by the use of a hatched median area around the bend, although research suggests speeds may not necessarily be reduced by this device.
Junction specific
Fatalities are most likely to occur at junctions when there are steep angled impacts at high speeds between vehicles, or where vulnerable road users are in conflict with vehicles at speeds much above 20mph. The highest quality grade separated junctions only allow merging movements, while well designed at-grade roundabouts also limit vehicle conflicts to low speed merging movements, although these may still produce serious injuries in conflicts with two wheeled vehicles. More consideration should be given, on roads on which high speeds (60 or 70mph) are allowed, to limiting access at any sites which do not fulfil these characteristics. Such limitations are unlikely to be fully achievable at all such sites, but a review of the opportunities to do so could highlight considerable opportunity. A variety of signing and marking measures are available to highlight the hazards at those sites which do not comply with these principles.
Quiet Lanes
Narrow, single track country lanes can be marked and publicised as Quiet Lanes with the objective of presenting an environment to drivers in which they should expect shared use of the road space and therefore change their behaviour accordingly. Although useful conceptually to alter driver perceptions, there are very few casualties on such roads even before treatment.
Village treatment
The village gateway programmes of the early 1990s have been shown to produce both speed and accident reductions, although ideally the traffic calming measures would extend into the village itself (Wheeler and Taylor, 2000).
Roadside
The safest roadside is one clear of any aggressive obstacles for at least 10m. With the density of development and the hedge-lined roads found in Britain, this is seldom achieved unless specifically planned. The alternative is to limit the likelihood of impact with these objects by using a safety barrier, although unless this is designed for high containment it will still be breached by some larger vehicles or by smaller vehicles travelling in excess of 70mph. A further development being implemented by the Highways Agency is the use of passive structures so that impacts no longer produce serious injury.
A substantial number of fatalities can be saved if roadsides are treated to eliminate substantial impacts. This should be the aim for motorways, dual carriageways, and for single carriageways on

13TRL Limited 13 PPR 200
Published Project Report Version:
which high speeds are permitted. The extent to which this can be achieved is unclear but major programmes of treatment for selected roads should be considered. It is important to recognise however that if normal containment barriers are chosen as the preferred treatment, some fatalities will still occur unless driver behaviour is also improved. Safety barrier design also needs to consider potential injury to motorcyclists, particularly at sites where these are more likely to leave the road.
The likelihood of vehicles leaving the road following lapses in attention can be reduced by the use of one metre edge strips (Walmsley and Summersgill), which allow some scope for recovery, particularly where raised rib lines are used for this delineation.
Other countries, notably the Netherlands, have produced safer rural roads for cyclists and pedestrians by the use of segregated paths, alongside the road.
Median
Fatalities can be substantially reduced by separating opposing traffic flows sufficiently to avoid any head-on collisions. While this is common practice in Britain for dual carriageways, more extensive experimentation has been made in other countries with narrower and less substantial measures, on previously undivided roads (section 1.3). Some of these include 2+1 alternating lane layouts. Small sections of dualled carriageway on otherwise single carriageway routes have been common in Britain in the past. Where this becomes extensive, the single carriageway sections then become bottlenecks and result in driver frustration. More consideration might be given to innovative ways of producing low cost separation on British roads, building on the experience with median hatching, and rumble strips. Such treatments are mostly relevant to the major roads.
Psychological traffic calming
Recent work developing principles by which changes to the road environment might be used to influence driver behaviour, without major physical interventions, appear promising (Hamilton and Kennedy, 2005). This might be particularly relevant to the lower speed major roads or the higher flow minor roads.
Sign clutter and environmental issues
An important issue on rural roads is to limit the environmental intrusion of any physical changes to the road. Both engineering and psychological safety measures rely heavily on changing the drivers view of the road. Where containment is required, structures need to be sufficiently strong to restrain vehicles. It is considered necessary in many cases to provide clear signs to road users of the nature of the road or of hazards ahead. But there are opportunities to modify the appearance of structures and more consideration should be given to improving the environmental appearance of schemes and reducing the number or extent of signs, whilst still conveying appropriate information. Both the concept of more consistency in road type (self explaining roads) and the better understanding of the function of clearly defined groups of roads should help achieve this objective.
3.3 Other measures
Vehicle design changes
A continual reduction in fatal and serious injuries is being achieved for car occupants through the improvement in in-car protection. Thus a continued reduction in severe rural road casualties can be expected regardless of behavioural or engineering measures. However, most of these improvements are focussed on car to car collisions, at higher speeds. Benefits on minor roads are likely to be less obvious although the effectiveness of improved car front design in reducing pedestrian injuries is sustained down to fairly low speeds.
ITS
Between 2010 and 2020, it is expected that more vehicles will be fitted with active in-car safety devices. These are likely to be more relevant to and effective on major roads, and their influence on minor road driver behaviour will be limited. Even widespread introduction of speed limiters may not

14TRL Limited 14 PPR 200
Published Project Report Version:
have a great benefit on roads where inappropriate speed at particular sites may be more of a problem than excess speed above the limit. However if effective alcohol and seatbelt interlocks were developed and implemented during this period, they could result in a significant reduction in rural road fatalities.

15TRL Limited 15 PPR 200
Published Project Report Version:
4 Potential treatment for each road type Roads have been historically classified as A, B, C and Unclassified, depending on their perceived importance. As their usage has changed over time, some reclassification takes place but does not fully reflect the changes in function taking place. One of the most important indicators of function is the level of traffic flow, usually measured as annual average daily traffic (AADT). The higher flow roads, which typically serve more through movements, are also those where pressure to maintain higher speeds is greatest. As flow increases, the justification for major improvements, such as dualling or more segregated junction movements, becomes greater. For the purpose of this analysis, dual and single carriageways will be discussed separately, and single carriageways will be considered as major or minor. There are no clear criteria for defining the major/minor split – it can be done assuming major are all A and B roads, or all roads carrying more than a specified AADT. As part of their response to the revised Roads Circular on speed limits (DfT, 2006), highway authorities are required to review speed limits on single carriageway rural roads, and categorise these as major or minor.
The implementation of specific measures will depend on detailed route investigations, targeting the specific problems at sites along the route. This note is concerned only with discussing the general application and effectiveness of policies on different road types.
4.1 LA Dual carriageways
Including the small length of motorways managed by local highway authorities, only 7% of all rural road KSI casualties (3% of national KSI casualties) occur on these roads. However the density of these accidents, at 0.6/km/year, means that engineering measures are likely to be cost effective.
The largest behavioural issue on these roads is close following, coupled with high vehicle speeds, and up to a third of KSI casualties are likely to result from shunt impacts.
Almost half the KSI casualties in accidents on dual carriageways with at-grade junctions occur at these junctions, with most at priority controlled access points. Large reductions in these casualties can probably only be made by much greater limitations to the number of access points, although significant savings might be made by limiting the movements allowed at access points that were retained. Ideally, only merging movements, at similar speeds should be allowed.
Between 10 and 20% of KSI casualties result from single vehicle run-offs, most of which presumably will be related to fatigue or inattention. These could be tackled through increasing driver awareness, or through removing aggressive objects from the roadside. The Highways Agency is currently extending use of passive infrastructure but this will have little effect unless large-scale replacement programmes are pursued. On local authority roads, many objects other than those installed by the highway authority are likely to exacerbate the problem.
4.2 LA Major road single carriageways
This is the largest potential target group, involving two thirds of all rural KSI casualties (over a quarter of all national KSI casualties). The average density of KSI casualties on these roads (0.24 and 0.11 per year per km on A and B roads respectively) is still relatively high, and will be typically twice as high on the higher risk sections.
There has been considerable attention to speed management on rural single carriageways in recent years, but contributory factor data continue to show scope to reduce casualties through safer choice of speed by some drivers. Further awareness and enforcement campaigns supported by continuing implementation of low cost engineering, perhaps particularly through signing hazards and clarifying road function, are likely to be necessary. More consistent use of speed limits will play a part in this, although around 15% of the fatalities on these roads already occur on roads with 20-40mph limits.

16TRL Limited 16 PPR 200
Published Project Report Version:
Non-wearing of seatbelts may be a bigger problem on these roads than on dual carriageways, but only around 10% of KSI casualties on these roads are associated with shunt accidents. The largest KSI casualty group (about 40% on Class A roads) occurs in the vicinity of junctions. Some of these might be saved by low cost improvements, but large casualty savings are likely to require major programmes of junction improvement, with more focus on eliminating high speed steep angled conflicts.
Improvement of the roadside on these roads only affects 14% of the KSI casualties, and is likely to need to be well targeted to be cost effective. Again major programmes involving large lengths of road will be more cost-effective than piecemeal changes.
A major problem seen in other countries is the incidence of head-on accidents on these roads; this appears to be less of a problem in Britain, but still results in over 20% of the KSI casualties. Measures to discourage overtaking further or the provision of greater length of dedicated overtaking lanes (2+1 lanes, with and without central safety barriers) should be considered.
About 30% of KSI casualties on A roads and 40% on B roads occur at bends – these may occur in both run-off and head-on accidents. Effective signing and marking should continue to be developed to reduce these accidents. About 35% of KSI casualties occur at junctions on these roads; around half of these involve both bends and junctions. Interactive signing has proved effective at some of these junctions, but at others more major layout changes may be justified.
About 60% of pedestrian and cyclist KSI casualties on non-trunk rural roads occur on these roads, and 36% occur at speed limits of 60mph. It is unlikely that low speeds can be introduced over large parts of this network – DfT Circular 1/06 recommends 50 or 60 mph except where there is significant development. Therefore modification of the environment to give greater risk awareness to both drivers and vulnerable road users at key points where conflicts with higher speed vehicles occur appears the only low cost measure. Development of more segregated facilities should be investigated but is only likely to be cost-effective in limited situations.
4.3 LA Minor two lane roads
About 20% of all fatalities on non-trunk rural roads and 27% of KSI casualties occur on these roads. However the density of KSI casualties is low at 0.02/km/year making it unlikely that any general engineering treatment is justified. But 40% of fatalities on these roads occur on bends, and 30% at junctions, and there could be scope to make drivers more aware of the risks at these sites. The frequency of such sites on these roads suggests that a general change in driving style on these roads is needed.
The proportion of fatal and serious accidents with excessive speed on these roads is slightly higher than the average for all rural roads, and DfT Circular 1/06 recommends speeds of 40 or 50mph for minor rural roads. Half of the pedestrian fatalities on these roads, 35% of cyclist fatalities and 20% of car occupant fatalities occur on sections which already have speed limits no higher than 40mph.
Overall, about a quarter of all rural non-trunk road pedestrian fatalities, and a third of cyclist fatalities occur on these roads.
4.4 Trunk roads
Although the main focus on this paper is on non-trunk roads, it should be noted that about 15% of rural KSI casualties and 19% of rural road fatalities occur on the trunk road network. Engineering standards on these roads are already high, but the remaining high casualty density, averaging 0.23 per km per year, means that further measures to improve junctions, roadsides, and medians on these roads, similar to those recommended for local authority Class A roads are still likely to be cost-effective. Again, cost-effectiveness will be maximised by co-ordinated programmes of work rather than piecemeal improvements.

17TRL Limited 17 PPR 200
Published Project Report Version:
4.5 Focus for behavioural measures
The involvement of potential target groups, such as young male drivers, elderly drivers, and young and elderly pedestrians varies by road type. Table 9 shows the relative involvement of these groups on each road type.
Percentage of all Killed of this road user group on each road type
Percentage of all KSI of this road user group on each road type
Car Drivers Pedestrians Car Drivers Pedestrians
16-29 male
Over 60 0-15 Over 60 16-29 male
Over 60 0-15 Over 60
M and Dual A
26.5 20.8 10.1 17.3 23.8 14.6 12.8 15.6
Single A 29.4 21.3 7.8 31.5 26.7 15.4 23.8 21.9
B 35.1 18.3 9.1 33.9 29.7 14.1 31.2 21.7
C 35.8 19.9 11.1 33.3 30.7 12.2 33.6 18.3
U 41.4 15.4 19.4 38.3 33.0 12.8 41.5 19.7
All 31.9 20.0 9.7 31.0 28.6 14.4 31.0 20.5
Table 9 Percentage of driver and pedestrian casualties in different age groups on each road type.
16-29 year old male car drivers make up more than 40% of the car driver fatalities on Unclassified roads compared with 26% on motorway and dual carriageways, and 29% on single carriageway A roads. Elderly drivers contribute about 20% of the fatalities on most major roads but only 15% on minor Unclassified roads. The high risk to elderly drivers in emerging from junctions onto high speed roads is well documented. A similar but less pronounced variation can be seen in KSI casualties. Except for motorways and dual carriageways, over 30% of pedestrian fatalities involve pedestrians over age 60, with these making up 38% on Unclassified roads. About 10% of pedestrian fatalities are children, but this rises to almost 20% on Unclassified roads. This situation is even more marked for KSI casualties with over 40% of pedestrian fatalities on minor Unclassified roads being children.
5 Potential casualty reductions and total investment
Table 10 gives an illustration of the potential for casualty saving of a range of policies across the rural road network. Four different packages of policies, and their effect on the four road groups are considered.
The first package includes greater emphasis on behavioural measures (education and enforcement) to tackle speeding, drink driving, and lack of attention, accompanied where appropriate by low cost engineering measures.
The second package represents policies to tackle two behavioural issues which are currently not effectively targeted – increasing front seat belt wearing, and reducing unsafe close following behaviour. Each of these offers substantial potential for casualty reduction. Only relatively small gains have been assumed but even these would require major new initiatives.

TRL Lim
ited 18
PPR 200
Published Project Report
Version:
Measures
Package
Accident factors
TrunkTrunk
TrunkM
+dcM
ajor scM
inor scM
+dcM
ajor scM
inor scM
+dcM
ajor scM
inor scS
peeding0.15
0.150.2
0.30.3
0.30.3
0.34.5
4.56
91
Drink/drug driving
0.040.04
0.060.06
0.20.2
0.20.1
0.80.8
1.20.6
Fatigue/inattention0.15
0.120.08
0.050.1
0.10.1
0.11.5
1.20.8
0.5
2N
on-seat belt wearing
0.050.1
0.20.25
0.20.2
0.20.2
12
45
Shunt accidents
0.50.3
0.10.03
0.10.1
0.050.01
53
0.50.03
3P
artial injury protection0.66
0.650.55
0.470.50
0.500.20
0.0032.9
32.311.1
0.0
4Fuller injury protection
0.660.65
0.550.47
0.750.75
0.500.00
49.548.8
27.50.0
1+2+4Total %
saved in group62.3
60.340.0
15.1
Proportion G
B K
SI
0.080.03
0.270.11
Total saved5.0
1.710.7
1.6
Potential percentage casualties saved
Non-trunk
Non-trunk
Potential target K
SI casualties
Potential effectiveness of policies
Non-trunk
Table 10 A
n illustration of the potential casualty reduction that might be obtained from
various policy packages

TRL Limited 19 PPR 200
Published Project Report Version:
The third package represents greater investment in a co-ordinated programme of improvement of injury protection on major roads. A 20% saving in KSI casualties on single carriageway roads that would be affected by these measures is targeted, with greater implementation expected on higher quality roads. This programme would not benefit minor roads.
The fourth package would be similar but target a KSI casualty saving of 50% of the KSI casualties on single carriageway roads that might be affected. The proportion of casualties that can be targeted by both the third and fourth packages would be those which did not involve shunt accidents or occupants who were not wearing seatbelts, and had not already been assumed to be saved by the first package.
5.1 Estimates of potential casualty reductions by road type and policy
The figures for potential target KSI casualties in Table 10 represent the proportion of total casualties on each road type that might be influenced by each type of measure. For the first package of measures, the estimate of the potential target KSI casualty populations on each road type draw on the contributory factor information in 2.1.3. The estimate target KSI from non-seatbelt wearing is a conservative estimate based on the data in 2.3. The proportions of shunt accidents assumed reflect data from EuroRAP sources (eg Lynam and Lawson, 2005). The target populations for injury protection measures are the proportion of casualties remaining once those associated with speeding, drink driving, fatigue and on-seatbelt wearing have been removed. The scope for improved injury protection through road and vehicle design is limited to those accidents where driver behaviour is consistent with the standards underpinning those designs (for example vehicle occupant protection assumes seat belts are worn, and roadside infrastructure is designed to be effective within the speed limit for the road).
The figures for potential effectiveness of policies are estimates of the proportion of the target KSI casualties for each combination of road type and measure that might be saved. There is substantial uncertainty in most of these estimates as the detailed measures are not known but they reflect the level of influence typically seen in past policies of these types. The effect of making alternative assumptions of their effectiveness can readily be calculated. The aim of the Table is to show the general balance of potential savings from different approaches; this is unlikely to change substantially if different estimates of effectiveness, within reasonable bounds, are chosen.
The third set of columns, showing potential percentage casualties saved, is obtained by multiplying together the first two sets of information. The figures in third set of columns show the percentage of the KSI casualties on each road type that might be saved by the different policies. Summing the effects from the first, second, and third packages of measures gives an indication of the total savings that might be achieved on each road type, at the level of effectiveness assumed. This suggests a saving of some 60% of motorway and dual carriageway casualties and 40% of rural single carriageway casualties, but only 15% of rural minor road casualties. To make further reductions in casualties on minor rural roads, driver behaviour would need to be changed through a major change in road user perception of the appropriate use of these roads, probably through national education and awareness programmes.
5.2 Estimates of costs and benefits
Some indication of the investment that might be justified in these various policy areas can be given by valuing the estimate of the casualty reduction targeted. It would not be unreasonable to assume a 50% first year rate of return from these measures – current best estimates of benefits from low cost engineering measures appear still to be well above this. A value per KSI casualty saved of £525k might be assumed, based on a total valuation of all casualties (of all types) of £18,000 million and a total number of 34,351 KSI casualties (DfT, 2005).
The penultimate row of Table 10 shows the proportions of national KSI casualties on each road type, and the final row shows the resulting effect that all the policies together (with the higher penetration of package 4) might have on the national casualty total. Thus although over 60% of KSI casualties

TRL Limited 20 PPR 200
Published Project Report Version:
on motorways might be saved, there are only some 8% of national KSI casualties occurring on these roads, so this would only reduce national KSI casualties by 5%. It can be seen that by far the largest effect on national casualties would be from implementing the policies on major single carriageway roads.
Overall a saving of almost 20% of KSI casualties might be achieved. Assuming a 50% rate of return, this would justify an investment of about £7,000 million if these accidents were no longer occurring at all. Packages 3 and 4 are aimed at injury protection, with the intention of saving fatalities, but injuries classed as serious may still occur in these accidents. A conservative estimate might be that the target for these savings is to reduce casualty costs by the difference between fatality cost and serious injury cost, ie about £1.4m per fatality. Assuming a 50% rate of return, a 20% saving in fatalities would then justify an expenditure of £4,500 million.
6 Future rural road policy The rural road safety problem is many faceted, with casualties occurring across road types, road user groups and speed limits. Various larger casualty groups have been identified for particular focus, but a wide range of policies need to be pursued.
Continuation or limited extension of traditional policies may only yield up to a 5% saving in the national KSI casualty total.
If this is all that is done, it is unlikely to overcome the key problems that for major roads, current usage is diverse and safety is often in conflict with mobility and accessibility, while for the very large network of minor roads, engineering and enforcement programmes are very expensive, and many driver’s perception and use of these roads is inconsistent with their design and their usage by more vulnerable road users.
The situation on major rural roads can be improved to some extent by the commitment of greater resources to both engineering and enforcement. An unknown but potentially quite large number of fatalities on these roads are associated with non-wearing of seatbelts by vehicle occupants. A problem largely limited to dual carriageways is the incidence of shunt accidents resulting from unsafe close following. Initiatives to tackle both these issues should be considered. Future ITS measures could contribute to safer behaviour, particularly through seat-belt and alcohol interlocks.
But to make substantive savings in rural road casualties, four policy themes need to be pursued.
• Defining a network of major roads that will operate as high speed roads with more limited access.
• Upgrading these to largely eliminate junction, head-on and run-off fatalities – introduce and enforce close following restrictions The effectiveness of these measures will be limited by the extent to which drivers continue to fail to use seatbelts or drive at excessive speeds, because the injury protection criteria will be set for those drivers conforming with the traffic regulations.
• Increasing funding for low cost measures on the major roads which do not become part of this network, concentrating on similar accident types but also on improving pedestrian and cyclist facilities.
• Defining a network of minor road zones with extensive publicity to encourage drivers to travel at speeds of 40mph over much of this network and to recognise the risks from varied road users and within settlements within these zones.
Changes of this substance can only be made with strong national political support, with national investment and publicity programmes supporting implementation by local authorities.

TRL Limited 21 PPR 200
Published Project Report Version:
A rural road demonstration project could usefully include within its objectives the clearer definition of functional networks for both major and minor roads, the creation of more distinctive design features for the different networks, the development and trialling of innovative measures to modify driver behaviour and improve injury protection on these networks, and the trialling of widespread local publicity to persuade drivers to modify their use of minor roads.
Acknowledgements The work described in this report was carried out in the Safety Group of TRL Limited. The author is grateful to Dr J Broughton for quality review and auditing of the report.
References Australian Transport Council (2002) National Road Safety Strategy 2001-02010 www.dotrs.gov.au Barker J, Farmer S and M Taylor (1999) The development of accident remedial intervention levels for rural roads. TRL report TRL425.
Broughton, J (2005) Car Occupant and Motorcyclists Deaths 1994-2002. TRL Report TRL629. Transport Research Laboratory, Crowthorne. Broughton (2006) Contributory factors in rural accidents. Unpublished note to Department for Transport.
Broughton (2006b) Personal communication.
Burns PC, Parkes A, Burton S, Smith RK and D Burch (2002) How dangerous is driving with a mobile phone? Benchmarking the impairment to alcohol. TRL report TRL547
Christie N, Dale M, and Lowe C (2002) Child Road Safety in rural areas: literature review and commentary. Research report no 32. Department for Transport
Cuerden R (2006) Personal communication.
Department for Transport (2005) Road Casualties on Great Britain ,2004. Department for Transport, London
Department for Transport (2006) New Guidance on setting local speed limits. Circular 1/06
Flatley D, Reynor L, and J Horne (2004) Sleep related crashes in different sections of different road types in the UK (1995-2001). Research Report no 52 Department for Transport
Gardner G and S Gray (1998) A preliminary review of rural cycling. TRL Report 310
Hamilton K and J Kennedy (2005) Rural Road Safety: a literature Review. Transport Research Series. Scottish Executive Social Research
Hughes W and G Amiss (1996) Accidents on rural roads: Single carriageway A class roads. AA Foundation for Road Safety Research. Basingstoke
IHT (1999) Guidelines for rural safety management. Institution of Highways and Transportation
Kennedy J and A Wheeler (2004) Kent and Norfolk Quiet Lanes schemes TRL Reports 602, 603
Knight I (2001) A review of fatal accidents involving agricultural vehicles or other commercial vehicles not classified as goods vehicles, 1993 to 1995. TRL Report TRL598
Koornstra M, Lynam D, Nilsson G, Noordzij P, Petterson H-E, Wegman, F and P Wouters (2002). SUNflower: A comparative study of the development of road safety in Sweden, the United Kingdom, and the Netherlands. SWOV Institute for Road Safety Research, Liedschendam

TRL Limited 22 PPR 200
Published Project Report Version:
Lynam D and S Lawson (2005) Potential for risk reductions on British inter-urban major roads. Traffic Engineering and Control, vol 46, no 10 pp358-361 Lynam D, Nilsson G, Morsink P, Sexton B, Twisk D, Goldenbeld C and F Wegman (2005) SUNflower+6: an extended study of the development of road safety in Sweden, the United Kingdom and the Netherlands. OECD (1999) Safety Strategies for rural roads. Paris
Reyner L, Flatley D and J Horne (2001) Sleep related accidents on sections of selected trunk roads and motorways in UK (1995-1998) Research Report 22 Department for Transport
Sexton B, Fletcher J and K Hamilton (2004) Motorcycle accidents and casualties in Scotland 1992-2002 Scottish Executive Social Research
Sharples JM and J Fletcher (2001) Tourist accidents in Scotland. Scottish Executive Central Research Unit
Taylor M , Baruya B and J Kennedy (2002) The relationship between speed and accidents on rural single carriageway roads. TRL Report TRL 511
Tingvall, C. & Howarth, N. (1999) Vision Zero: an ethical approach to safety and mobility. The 6th Institute of Transport Engineers International Conference on Road Safety and Traffic Enforcement: Beyond 2000. Melbourne 1999. Wallace B (2003) External-to-vehicle driver distraction. Scottish Executive Social Reserach
Walmesley S and I Summersgill (1998) Accidents on modern rural single carriageway trunk roads TRL Report TRL 336.
Walters (2006) STATS19 analysis of rural road casualties from 2000-2004. Unpublished note to Department for Transport
Wheeler A and M Taylor (1999) Traffic calming on major roads TRL Report TRL 385
Wheeler A and M Taylor (2000) Changes in accident frequency following the introduction of traffic calming in villages. TRL Report TRL 452
Winnett M and A Wheeler (2003) Vehicle-activated signs – a large scale evaluation. TRL Report 548


TRL Crowthorne House, Nine Mile Ride Wokingham, Berkshire RG40 3GAUnited Kingdom
T: +44 (0) 1344 773131 F: +44 (0) 1344 770356E: [email protected] W: www.trl.co.uk
ISSN 0968-4093
Price code: 2X
Published by IHS Willoughby Road, Bracknell Berkshire RG12 8FB United Kingdom
T: +44 (0) 1344 328038 F: +44 (0) 1344 328005E: [email protected] W: http://emeastore.ihs.com PP
R2
00
Rural road safety – policy options
This report examines the data available on the distribution of rural road casualties and the factors contributing to their occurrence, and gives the author’s view of the potential policy options available for future improvement of rural road safety on non-Trunk roads. It discusses potential countermeasures, and resulting casualty reductions.
Other titles from this subject area
PPR096 The Heavy Vehicle Crash Injury Study (HVCIS) Project Report. I Knight, R Minton, P Massie, T Smith and R Gard. 2008
PPR213 Assessment of current bicycle helmets for the potential to cause rotational injury. V J M St Clair and B P Chinn. 2007
PPR214 SCOTSIM: An evaluation of the effectiveness of two truck simulators for professional driver training. N Reed, A M Parkes, C Peacock, B Lang and L Rehm. 2007
PPR223 New and improved accident reconstruction techniques for modern vehicles equipped with ESC systems. R F Lambourn, P W Jennings, I Knight and T Brightman. 2007
PPR241 Factors influencing pedestrian safety: a literature review. A Martin. 2007
PPR242 Reporting of road traffic accidents in London: Matching Police STATS19 with hospital accident and emergency data. Supplementary report for St. Thomas’ Hospital Central London. H Ward, S Robertson, K Townley and A Pedler. 2007
PPR247 Review of Road Safety Good Practice in English Local Authorities. J A Castle and G E Kamya-Lukoda. 2007
PPR248 Review of International Road Safety Good Practice. J A Castle and G E Kamya-Lukoda. 2007