Running the curve: a preliminary investigation into curved sprinting … · 2019-03-31 · Curved...
3
Curved sprinting during football match-play Running the curve: a preliminary investigation into curved sprinting during football match-play John F. Fitzpatrick 12 , Andy Linsley 3 , Craig Musham 1 1 Sports Science and Medical Department, Newcastle United Football Club, Newcastle-upon-Tyne, UK., 2 Department of Sport, Exercise and Rehabilitation, Northumbria University, Newcastle-upon-Tyne, UK., and 3 Department of Mathematics, Physics and Electrical Engineering, Northumbria University, Newcastle-upon-Tyne, UK. Sprinting | Curve | Match-play | Tracking Headline D uring football match-play sprinting is a crucial element of performance. Actions that prove to be key to the out- come of a match are often performed whilst sprinting, such as, sprinting through on goal, sprinting down the channel and sprinting to make a tackle (1). Research into high in- tensity running and sprinting during match-play has tended to focus on distances covered or number of efforts above a predetermined threshold (2, 3). Furthermore, when training and testing sprint ability, the focus will often be on linear actions. However, due to the open nature of football, the crit- ical actions previously mentioned will often be completed in a curvilinear manner. Previous research has shown that curved running is something that regularly occurs in football, with positional differences being evident and also an influence of contextual factors (4). A few studies have assessed the biome- chanical determinants of curved running in football players (5, 6). However, no research to date has looked to quantify the typical characteristics of curved sprinting, such as sprint angle during football match-play. Aim. The aim of this study was therefore to assess the char- acteristics of sprinting, such as sprint angle, and evaluate any positional differences using spatio-temporal data collected dur- ing football match-play in a group of elite youth players. Methods Athletes. Thirteen elite youth male football players (age: 17.5 ± 0.7, height: 177.2 ± 4.6, weight: 73.5 ± 6.6) (full back [FB] = 3, centre defence [CD] = 2, centre midfield [CM] = 4, wide midfield [WM] = 2, centre forward [CF] = 2) competing in the Under-18 Premier League agreed to participate in the present study. Before inclusion, players were examined by the club medical staff and were deemed to be free from illness and injury. Data were collected as part of the clubs monitoring procedures, which all conformed to the recommendations of the Declaration of Helsinki. Design. Observational case report Methodology. Spatio-temporal data were collected during six official matches via GPS technology (Catapult Innovations, Scoresby, VIC, Australia) and downloaded via the manufac- turer’s software (Catapult Sports Sprint 5.1.7). Raw latitude and longitude coordinates were collected from the GPS units, sampling at a frequency of 10 Hz (CV%; latitude = 1.19%, lon- gitude = 0.75%). These data were collected alongside smooth velocity and exported to R Studio (version 3.4.1) for further analysis. Latitude and longitude points were converted to XY coordinates (see Supplementary Material 1) and plotted when a player was running above a threshold of 24 km.h -1 . This allowed for the spatio-temporal pattern of sprint efforts to be assessed. To evaluate sprint angle the tangent-chord method was used. Firstly, the XY coordinates of the sprint were plot- ted. A chord line was then fit between the first and last point of the sprint. The gradient of the chord line was calculated as follows; m = y2 - y1 x2 - x1 From here the intercept of the chord line was calculated; y = mx + c y - mx = c Where y is the y coordinate of the first point of the sprint and m is the gradient as calculated above. A tangent line was Fig. 1. A visual example of how ‘sprint angle’ is calculated using the tangent-chord method. The black line represents the sprint (>24km.h -1 ), the red line represents the chord and the blue line represents the tangent. Fig. 2. Sprint angle ( ) data for five playing positions. Box plot represents the median and interquartile ranges, whiskers represent 10% and 90% quartiles and dots represent outliers <10% or >90% quartiles. sportperfsci.com 1 SPSR - 2019 | Mar | 55 | v1
Transcript of Running the curve: a preliminary investigation into curved sprinting … · 2019-03-31 · Curved...
Curved sprinting during football match-play
Running the curve: a preliminary investigationinto curved sprinting during football match-playJohn F. Fitzpatrick 1 2, Andy Linsley 3, Craig Musham 1
1Sports Science and Medical Department, Newcastle United Football Club, Newcastle-upon-Tyne, UK.,2Department of Sport, Exercise and Rehabilitation, Northumbria
University, Newcastle-upon-Tyne, UK., and 3Department of Mathematics, Physics and Electrical Engineering, Northumbria University, Newcastle-upon-Tyne, UK.
Sprinting | Curve | Match-play | Tracking
Headline
During football match-play sprinting is a crucial elementof performance. Actions that prove to be key to the out-
come of a match are often performed whilst sprinting, suchas, sprinting through on goal, sprinting down the channeland sprinting to make a tackle (1). Research into high in-tensity running and sprinting during match-play has tendedto focus on distances covered or number of efforts above apredetermined threshold (2, 3). Furthermore, when trainingand testing sprint ability, the focus will often be on linearactions. However, due to the open nature of football, the crit-ical actions previously mentioned will often be completed in acurvilinear manner. Previous research has shown that curvedrunning is something that regularly occurs in football, withpositional differences being evident and also an influence ofcontextual factors (4). A few studies have assessed the biome-chanical determinants of curved running in football players (5,6). However, no research to date has looked to quantify thetypical characteristics of curved sprinting, such as sprint angleduring football match-play.
Aim.The aim of this study was therefore to assess the char-acteristics of sprinting, such as sprint angle, and evaluate anypositional differences using spatio-temporal data collected dur-ing football match-play in a group of elite youth players.
MethodsAthletes. Thirteen elite youth male football players (age: 17.5± 0.7, height: 177.2 ± 4.6, weight: 73.5 ± 6.6) (full back[FB] = 3, centre defence [CD] = 2, centre midfield [CM] = 4,wide midfield [WM] = 2, centre forward [CF] = 2) competingin the Under-18 Premier League agreed to participate in thepresent study. Before inclusion, players were examined by theclub medical staff and were deemed to be free from illness andinjury. Data were collected as part of the clubs monitoringprocedures, which all conformed to the recommendations ofthe Declaration of Helsinki.
Design. Observational case report
Methodology. Spatio-temporal data were collected during sixofficial matches via GPS technology (Catapult Innovations,Scoresby, VIC, Australia) and downloaded via the manufac-turer’s software (Catapult Sports Sprint 5.1.7). Raw latitudeand longitude coordinates were collected from the GPS units,sampling at a frequency of 10 Hz (CV%; latitude = 1.19%, lon-gitude = 0.75%). These data were collected alongside smoothvelocity and exported to R Studio (version 3.4.1) for furtheranalysis. Latitude and longitude points were converted to XYcoordinates (see Supplementary Material 1) and plotted whena player was running above a threshold of 24 km.h−1. Thisallowed for the spatio-temporal pattern of sprint efforts to beassessed. To evaluate sprint angle the tangent-chord methodwas used. Firstly, the XY coordinates of the sprint were plot-
ted. A chord line was then fit between the first and last pointof the sprint. The gradient of the chord line was calculated asfollows;
m =y2 − y1x2 − x1
From here the intercept of the chord line was calculated;
y = mx+ c
y −mx = c
Where y is the y coordinate of the first point of the sprintand m is the gradient as calculated above. A tangent line was
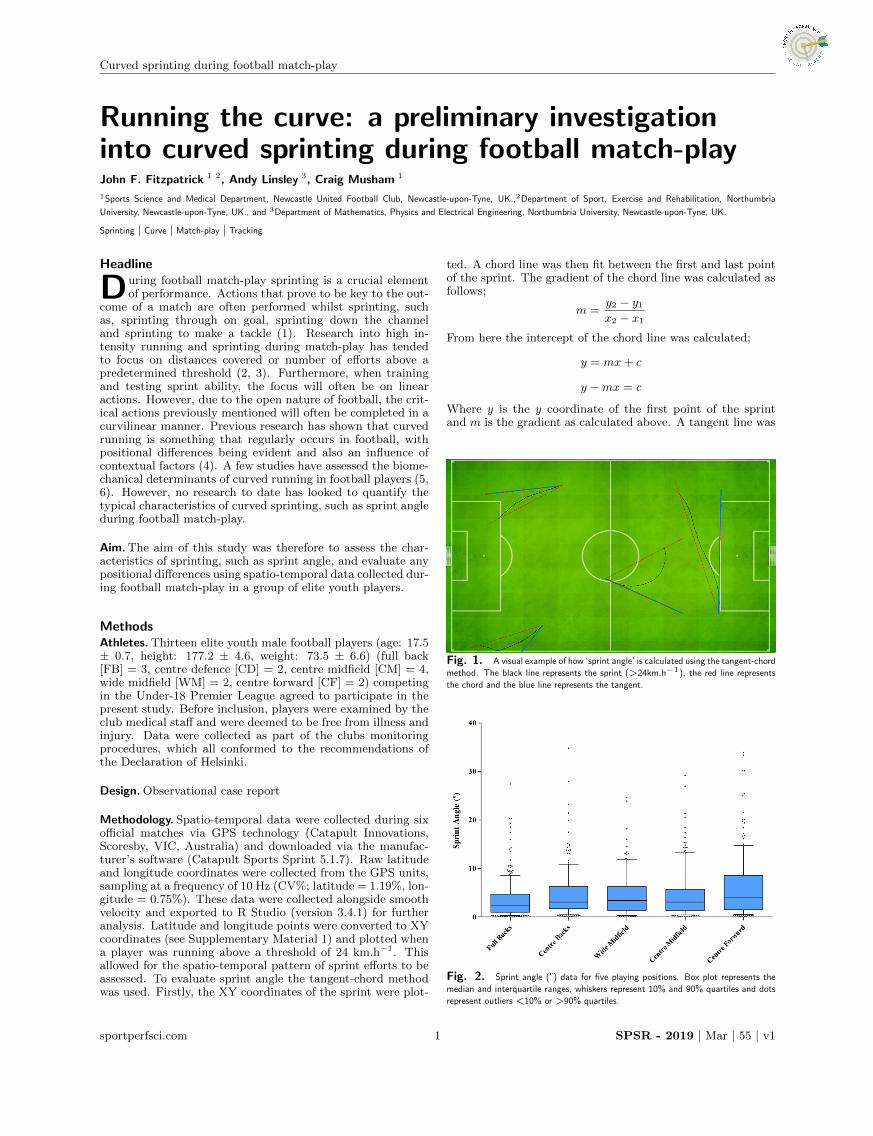
Fig. 1. A visual example of how ‘sprint angle’ is calculated using the tangent-chord
method. The black line represents the sprint (>24km.h−1), the red line represents
the chord and the blue line represents the tangent.
Fig. 2. Sprint angle (°) data for five playing positions. Box plot represents the
median and interquartile ranges, whiskers represent 10% and 90% quartiles and dots
represent outliers <10% or >90% quartiles.
sportperfsci.com 1 SPSR - 2019 | Mar | 55 | v1
Curved sprinting during football match-play
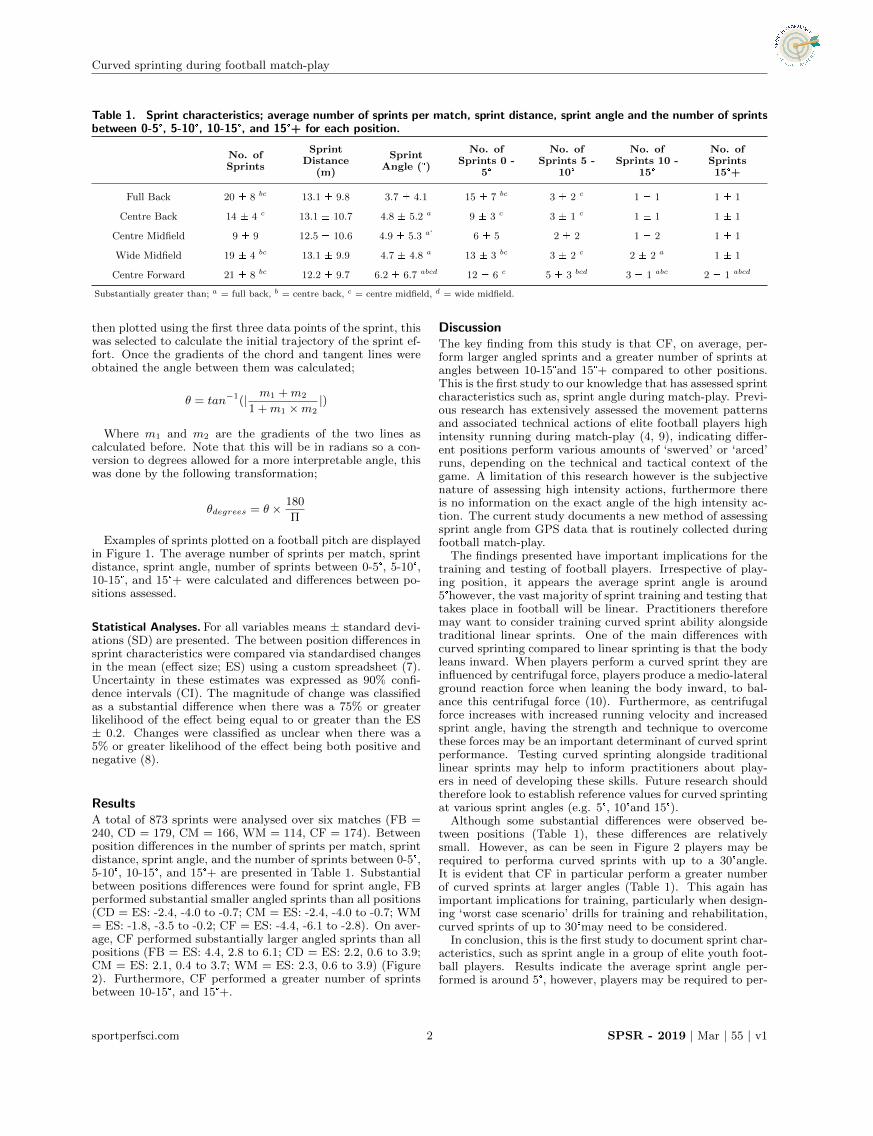
Table 1. Sprint characteristics; average number of sprints per match, sprint distance, sprint angle and the number of sprintsbetween 0-5°, 5-10°, 10-15°, and 15°+ for each position.
No. ofSprints
SprintDistance
(m)
SprintAngle (°)
No. ofSprints 0 -
5°
No. ofSprints 5 -
10°
No. ofSprints 10 -
15°
No. ofSprints15°+
Full Back 20 ± 8 bc 13.1 ± 9.8 3.7 ± 4.1 15 ± 7 bc 3 ± 2 c 1 ± 1 1 ± 1
Centre Back 14 ± 4 c 13.1 ± 10.7 4.8 ± 5.2 a 9 ± 3 c 3 ± 1 c 1 ± 1 1 ± 1
Centre Midfield 9 ± 9 12.5 ± 10.6 4.9 ± 5.3 a‘ 6 ± 5 2 ± 2 1 ± 2 1 ± 1
Wide Midfield 19 ± 4 bc 13.1 ± 9.9 4.7 ± 4.8 a 13 ± 3 bc 3 ± 2 c 2 ± 2 a 1 ± 1
Centre Forward 21 ± 8 bc 12.2 ± 9.7 6.2 ± 6.7 abcd 12 ± 6 c 5 ± 3 bcd 3 ± 1 abc 2 ± 1 abcd
Substantially greater than; a = full back, b = centre back, c = centre midfield, d = wide midfield.
then plotted using the first three data points of the sprint, thiswas selected to calculate the initial trajectory of the sprint ef-fort. Once the gradients of the chord and tangent lines wereobtained the angle between them was calculated;
θ = tan−1(| m1 +m2
1 +m1 ×m2|)
Where m1 and m2 are the gradients of the two lines ascalculated before. Note that this will be in radians so a con-version to degrees allowed for a more interpretable angle, thiswas done by the following transformation;
θdegrees = θ × 180
Π
Examples of sprints plotted on a football pitch are displayedin Figure 1. The average number of sprints per match, sprintdistance, sprint angle, number of sprints between 0-5°, 5-10°,10-15°, and 15°+ were calculated and differences between po-sitions assessed.
Statistical Analyses. For all variables means ± standard devi-ations (SD) are presented. The between position differences insprint characteristics were compared via standardised changesin the mean (effect size; ES) using a custom spreadsheet (7).Uncertainty in these estimates was expressed as 90% confi-dence intervals (CI). The magnitude of change was classifiedas a substantial difference when there was a 75% or greaterlikelihood of the effect being equal to or greater than the ES± 0.2. Changes were classified as unclear when there was a5% or greater likelihood of the effect being both positive andnegative (8).
ResultsA total of 873 sprints were analysed over six matches (FB =240, CD = 179, CM = 166, WM = 114, CF = 174). Betweenposition differences in the number of sprints per match, sprintdistance, sprint angle, and the number of sprints between 0-5°,5-10°, 10-15°, and 15°+ are presented in Table 1. Substantialbetween positions differences were found for sprint angle, FBperformed substantial smaller angled sprints than all positions(CD = ES: -2.4, -4.0 to -0.7; CM = ES: -2.4, -4.0 to -0.7; WM= ES: -1.8, -3.5 to -0.2; CF = ES: -4.4, -6.1 to -2.8). On aver-age, CF performed substantially larger angled sprints than allpositions (FB = ES: 4.4, 2.8 to 6.1; CD = ES: 2.2, 0.6 to 3.9;CM = ES: 2.1, 0.4 to 3.7; WM = ES: 2.3, 0.6 to 3.9) (Figure2). Furthermore, CF performed a greater number of sprintsbetween 10-15°, and 15°+.
DiscussionThe key finding from this study is that CF, on average, per-form larger angled sprints and a greater number of sprints atangles between 10-15°and 15°+ compared to other positions.This is the first study to our knowledge that has assessed sprintcharacteristics such as, sprint angle during match-play. Previ-ous research has extensively assessed the movement patternsand associated technical actions of elite football players highintensity running during match-play (4, 9), indicating differ-ent positions perform various amounts of ‘swerved’ or ‘arced’runs, depending on the technical and tactical context of thegame. A limitation of this research however is the subjectivenature of assessing high intensity actions, furthermore thereis no information on the exact angle of the high intensity ac-tion. The current study documents a new method of assessingsprint angle from GPS data that is routinely collected duringfootball match-play.
The findings presented have important implications for thetraining and testing of football players. Irrespective of play-ing position, it appears the average sprint angle is around5°however, the vast majority of sprint training and testing thattakes place in football will be linear. Practitioners thereforemay want to consider training curved sprint ability alongsidetraditional linear sprints. One of the main differences withcurved sprinting compared to linear sprinting is that the bodyleans inward. When players perform a curved sprint they areinfluenced by centrifugal force, players produce a medio-lateralground reaction force when leaning the body inward, to bal-ance this centrifugal force (10). Furthermore, as centrifugalforce increases with increased running velocity and increasedsprint angle, having the strength and technique to overcomethese forces may be an important determinant of curved sprintperformance. Testing curved sprinting alongside traditionallinear sprints may help to inform practitioners about play-ers in need of developing these skills. Future research shouldtherefore look to establish reference values for curved sprintingat various sprint angles (e.g. 5°, 10°and 15°).
Although some substantial differences were observed be-tween positions (Table 1), these differences are relativelysmall. However, as can be seen in Figure 2 players may berequired to performa curved sprints with up to a 30°angle.It is evident that CF in particular perform a greater numberof curved sprints at larger angles (Table 1). This again hasimportant implications for training, particularly when design-ing ‘worst case scenario’ drills for training and rehabilitation,curved sprints of up to 30°may need to be considered.
In conclusion, this is the first study to document sprint char-acteristics, such as sprint angle in a group of elite youth foot-ball players. Results indicate the average sprint angle per-formed is around 5°, however, players may be required to per-
sportperfsci.com 2 SPSR - 2019 | Mar | 55 | v1
Curved sprinting during football match-play
form curved sprints with an angle of up to 30°. Analysis ofdifferences between positions indicates CF, on average, per-form substantially larger angled sprints than all other posi-tions. Furthermore, CF perform a greater number of sprintsbetween 10-15°, and 15°+. These findings may have importantpractical implications for training and testing, with regards tocurved sprinting compared to traditional linear sprint work.
Practical Applications� A key finding of this study is that sprinting during football
match-play is very rarely linear. This means that practi-tioners should consider curved sprinting as a testing andtraining modality.
� Comparing a player’s performance in a linear versus acurved sprint of a standardised distance may provide valu-able information about a player’s ability to run at highvelocities at various curve angles.
� This study has documented that although the averagesprint angle is around 5°players may be required to performcurved sprints with an angle of up to 30°. This is impor-tant for practitioners and coaches to consider when design-ing training and rehabilitation drills that are designed toexpose players to the most extreme periods of match-play.
Limitations� A limitation of the present study is the single cohort design.
Although the sample of 873 sprints is large, this is from alimited number of players in each position, which may havetheir own individual sprint characteristics. Future researchmay look to replicate this method of assessing sprint anglewith a larger sample of players.
� It is noteworthy that a ‘sprint’ in the present study wasdefined as an action above 24 km.h−1, therefore sprint dis-tances and angles were calculate from data points abovethis threshold. Future research may look to utilise a lowerthreshold or assess sprint characteristics from the initiationof movement of the sprint effort.
DatasetData and R code available on SportPerfSci.com
Twitter: Follow John Fitzpatirck @ScienceInSoccer andCraig Musham @CMusham
References1. Stølen T, Chamari K, Castagna C, Wisløff U. Physiologyof soccer. Sports Med. 2005;35(6):501-36.2. Di Salvo V, Gregson W, Atkinson G, Tordoff P, Drust B.Analysis of high intensity activity in Premier League soccer.Int J Sports Med. 2009;30(03):205-12.3. Bradley PS, Di Mascio M, Peart D, Olsen P, Sheldon B.High-intensity activity profiles of elite soccer players at differ-ent performance levels. The journal of strength & conditioningresearch. 2010;24(9):2343-51.4. Ade J, Fitzpatrick J, Bradley PS. High-intensity effortsin elite soccer matches and associated movement patterns,technical skills and tactical actions. Information for position-specific training drills. J Sports Sci. 2016;34(24):2205-14.5. Brice P, Smith N, Dyson R. Body segment orientationsfor curved running in soccer players. Science and Football VI:Routledge; 2008. p. 44-9.6. Smith N, Dyson R, Hale T. Lower extremity muscularadaptations to curvilinear motion in soccer. Journal of Hu-man Movement Studies. 1997;33(4):139-53.7. Hopkins WG. Spreadsheets for analysis of controlled trials,crossovers and time series: Sportscience; 2017 [Available from:(sportsci.org/2017/wghxls.htm).8. Hopkins WG, Marshall S, Batterham A, Hanin J. Pro-gressive statistics for studies in sports medicine and exercisescience. Med Sci Sports Exerc. 2009;41(1):3.9. Bloomfield J, Polman R, O’Donoghue P. The ‘BloomfieldMovement Classification’: motion analysis of individual play-ers in dynamic movement sports. International Journal ofPerformance Analysis in Sport. 2004;4(2):20-31.10. Ishimura K, Sakurai S, editors. Comparison of insidecontact phase and outside contact phase in curved sprinting.ISBS-Conference Proceedings Archive; 2010.
Copyright: The articles published on Science Performance and Science
Reports are distributed under the terms of the Creative Commons Attribu-
tion 4.0 International License (http://creativecommons.org/licenses/by/4.0/),
which permits unrestricted use, distribution, and reproduction in any medium,
provided you give appropriate credit to the original author(s) and the
source, provide a link to the Creative Commons license, and indicate if
changes were made. The Creative Commons Public Domain Dedication
waiver (http://creativecommons.org/publicdomain/zero/1.0/) applies to the
data made available in this article, unless otherwise stated.
sportperfsci.com 3 SPSR - 2019 | Mar | 55 | v1