Round Robin - Cluster Analysis - ICDD
58
PPXRD ROUND ROBIN - RESULTS ANALYSIS AND CLUSTER ANALYSIS
Transcript of Round Robin - Cluster Analysis - ICDD

PPXRD ROUND ROBIN-RESULTS ANALYSIS ANDCLUSTER ANALYSIS

This document was presented at PPXRD -Pharmaceutical Powder X-ray Diffraction Symposium
Sponsored by The International Centre for Diffraction Data
This presentation is provided by the International Centre for Diffraction Data in cooperation with the authors and presenters of the PPXRD symposia for the express purpose of educating the scientific community.
All copyrights for the presentation are retained by the original authors.
The ICDD has received permission from the authors to post this material on our website and make the material available for viewing. Usage is restricted for the purposes of education and scientific research.
ICDD Website - www.icdd.comPPXRD Website – www.icdd.com/ppxrd

Many Thanks
Bruker-AXS PolySnapPANalytical – X’Pert HighScore Plus (Cluster Analysis)
Gordon BarrThomas Degan
Thomas DortmannMartijn FransenChris Gilmore
Arnt Kern

METHOD
Tested cluster analysis programs by using data from SRM 1976 alumina plate from ICDD grantees
(prepared plate – eliminates specimen preparation variables, tests instrument calibrations and resolution)Input and analyzed data sets from PPXRD round robin

Program Tests- SRM 1976
102 Data SetsCollected by ICDD grantees as proof of instrument calibration required with the submission of reference materials
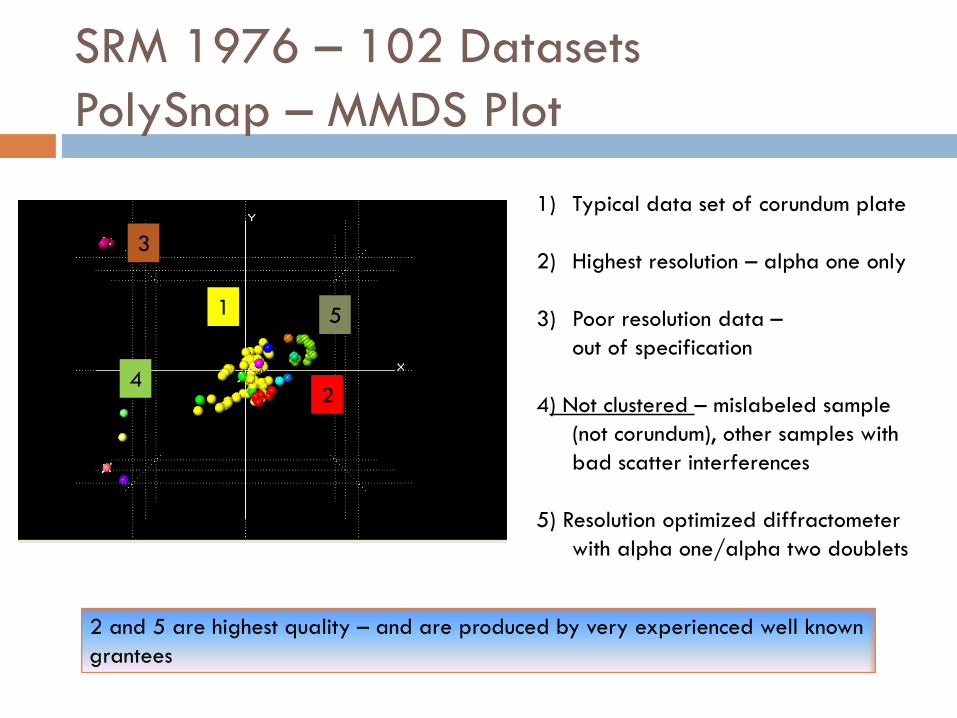
SRM 1976 – 102 DatasetsPolySnap – MMDS Plot
1
2
3
4
5
1) Typical data set of corundum plate
2) Highest resolution – alpha one only
3) Poor resolution data –out of specification
4) Not clustered – mislabeled sample(not corundum), other samples withbad scatter interferences
5) Resolution optimized diffractometerwith alpha one/alpha two doublets
2 and 5 are highest quality – and are produced by very experienced well knowngrantees
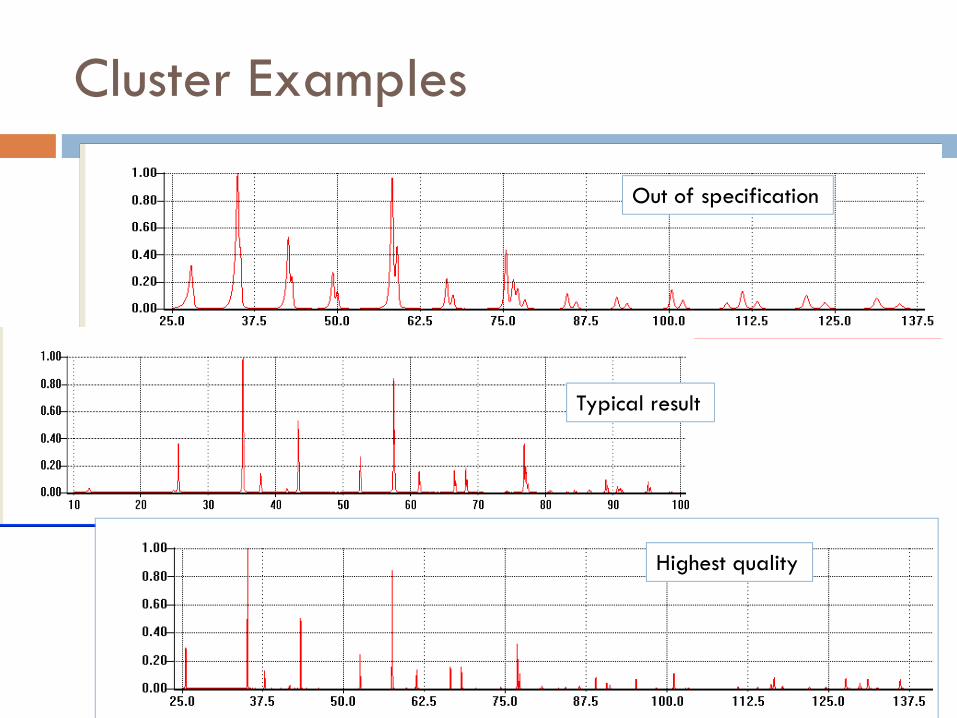
Cluster Examples
Out of specification
Typical result
Highest quality
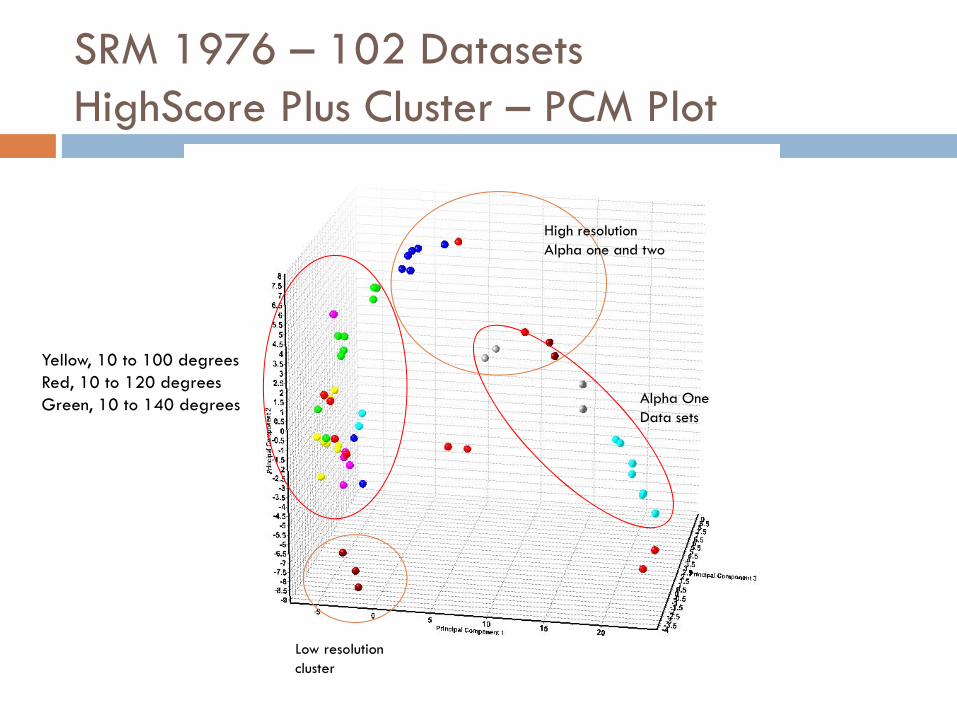
SRM 1976 – 102 DatasetsHighScore Plus Cluster – PCM Plot
Alpha OneData sets
Yellow, 10 to 100 degreesRed, 10 to 120 degreesGreen, 10 to 140 degrees
Low resolutioncluster
High resolutionAlpha one and two

Various ProfileResolutions

K beta
PPXRD Round Robin
16 Sample sets distributed
11 Laboratories supplied results, 9 with raw data
3 Samples were in each set
1g samples, vortex mixed
63 Data sets have been analyzed

Round Robin Specimens
Acetaminophen C8H9NO2Beta D-MannitolC6H14O6
NIST SRM_640C
Silicon Powder - line position andLine shape for powder diffraction

Mannitol Polymorphs-both powder and single crystal data
Alpha
Beta
Delta
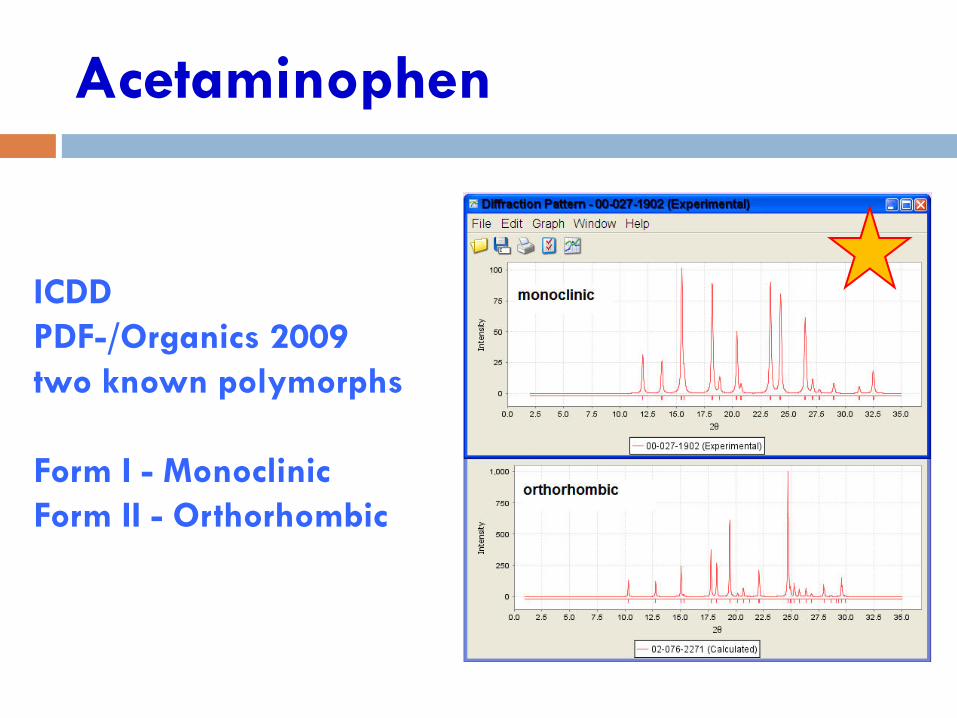
Acetaminophen
ICDDPDF-/Organics 2009two known polymorphs
Form I - MonoclinicForm II - Orthorhombic

Round Robin – Crystal Structures
β – D-Mannitol02-069-8458OrthorhombicA= 8.6940(70)b= 16.9020(80)C= 5.5490(60)P212121 (19)Z= 4.00V= 815.40
15 References
AcetaminophenPolymorph Form I02-063-1190MonoclinicA= 12.7630(60)B=9.2500(40)c=7.0820(20)β =115.52(3) P21/a (14) Z= 4.00V=754.51
12 References
SiliconCubicA = 5.431Fd-3mZ=8V=160.19
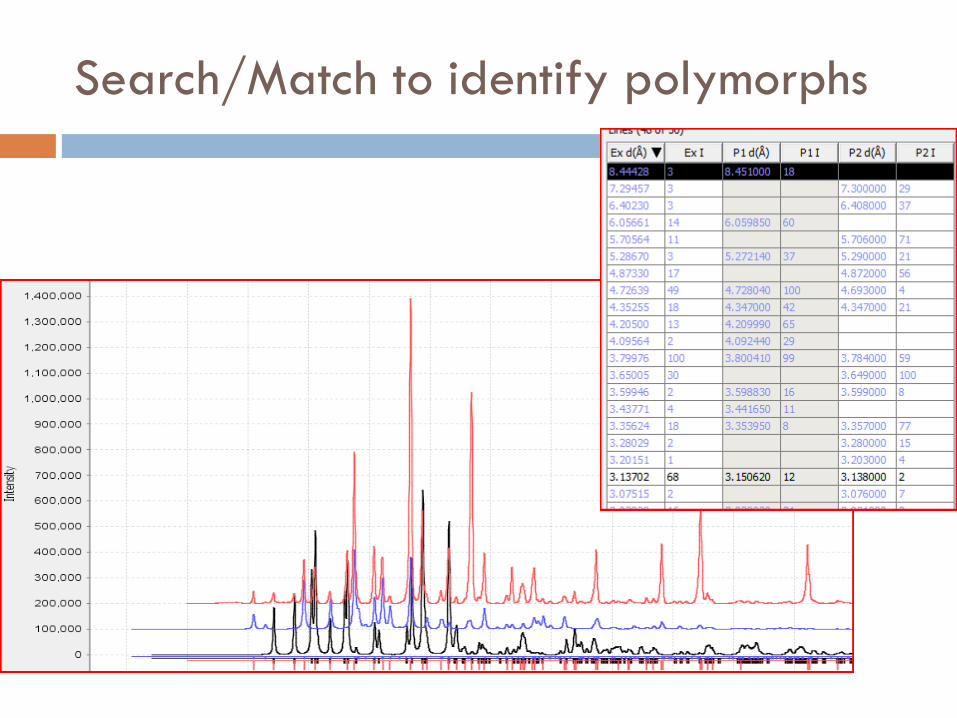
Search/Match to identify polymorphs

Top 4 best statistical fits – all form I

ROUND ROBIN - CRYSTALLITES
Mannitol
Acetaminophen
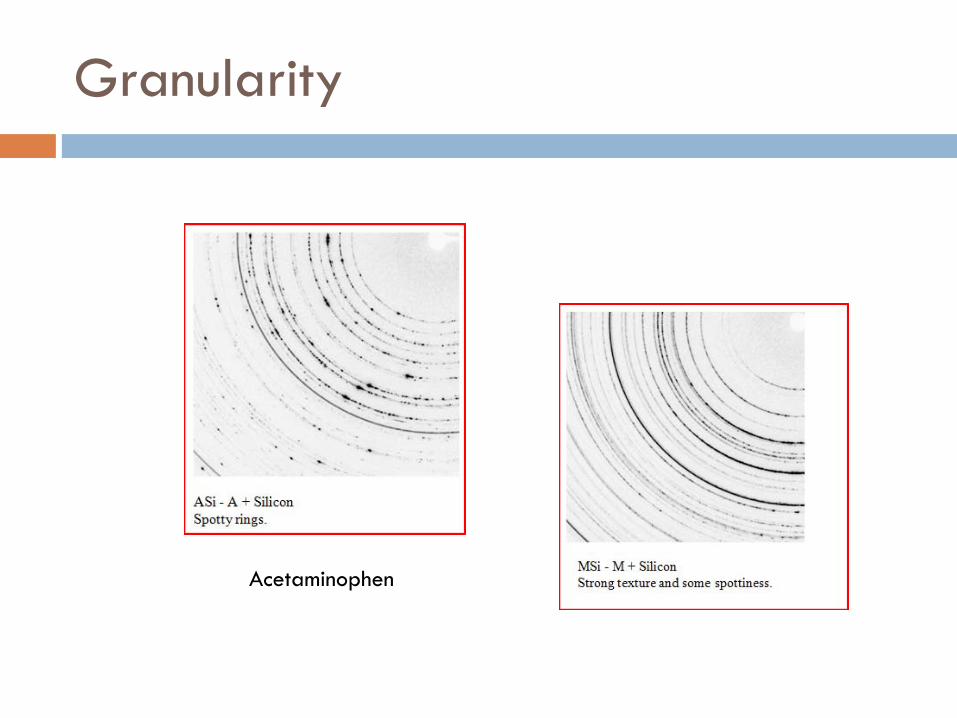
Granularity
Acetaminophen
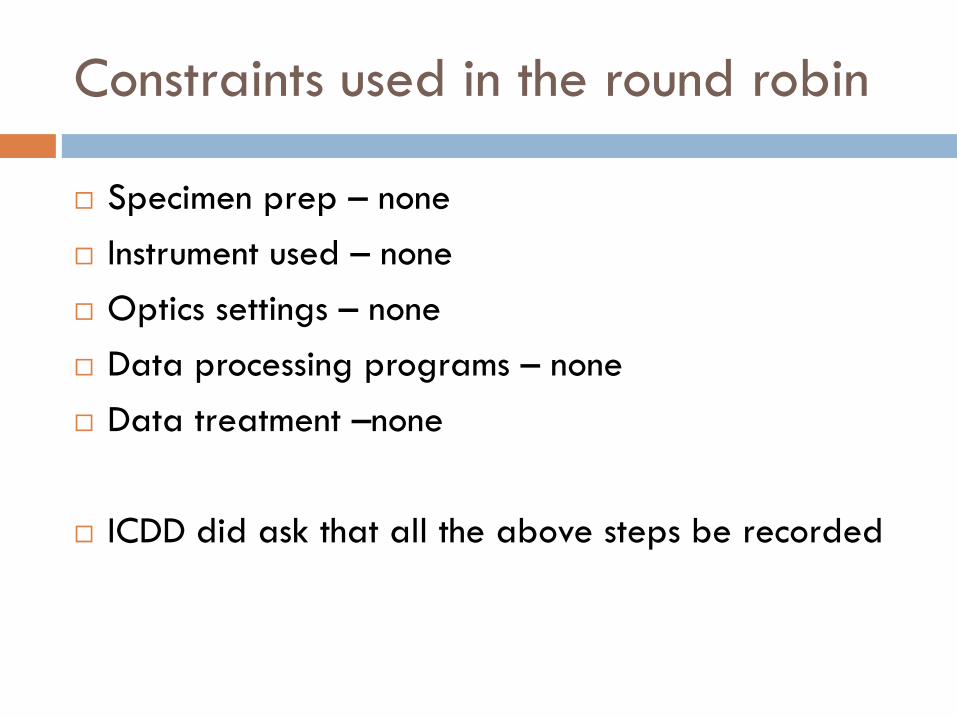
Constraints used in the round robin
Specimen prep – noneInstrument used – noneOptics settings – noneData processing programs – noneData treatment –none
ICDD did ask that all the above steps be recorded
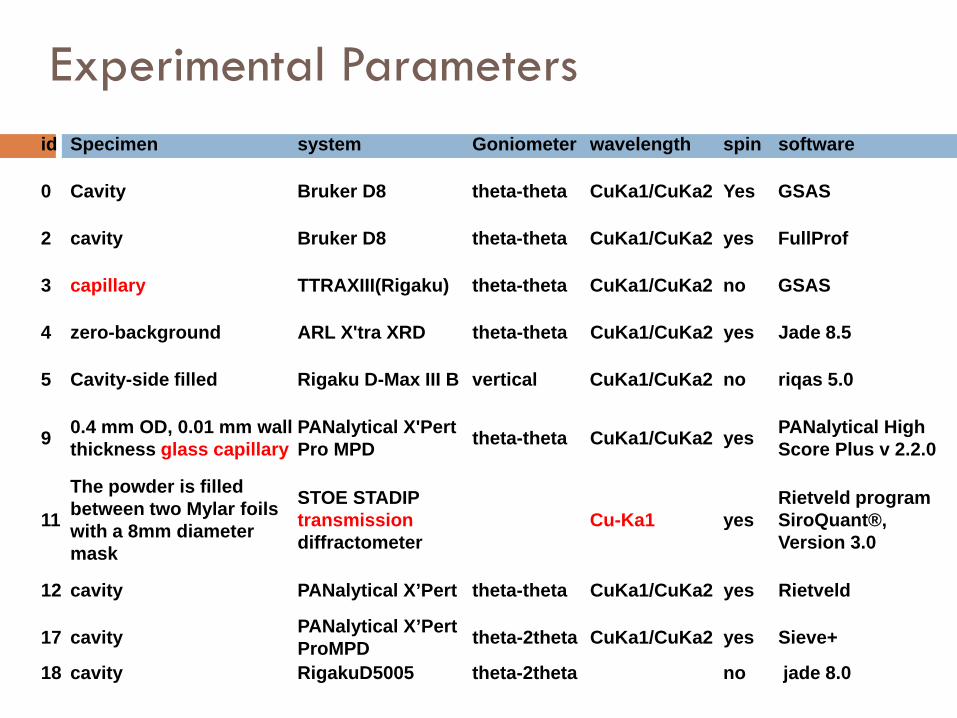
Experimental Parametersid Specimen system Goniometer wavelength spin software
0 Cavity Bruker D8 theta-theta CuKa1/CuKa2 Yes GSAS
2 cavity Bruker D8 theta-theta CuKa1/CuKa2 yes FullProf
3 capillary TTRAXIII(Rigaku) theta-theta CuKa1/CuKa2 no GSAS
4 zero-background ARL X'tra XRD theta-theta CuKa1/CuKa2 yes Jade 8.5
5 Cavity-side filled Rigaku D-Max III B vertical CuKa1/CuKa2 no riqas 5.0
9 0.4 mm OD, 0.01 mm wall thickness glass capillary
PANalytical X'Pert Pro MPD theta-theta CuKa1/CuKa2 yes PANalytical High
Score Plus v 2.2.0
11
The powder is filled between two Mylar foils with a 8mm diameter mask
STOE STADIP transmission diffractometer
Cu-Ka1 yesRietveld program SiroQuant®, Version 3.0
12 cavity PANalytical X’Pert theta-theta CuKa1/CuKa2 yes Rietveld
17 cavity PANalytical X’PertProMPD theta-2theta CuKa1/CuKa2 yes Sieve+
18 cavity RigakuD5005 theta-2theta no jade 8.0

Round Robin Data
Analysis Program ParticipantsPolySnap Labs 1, 4, 5, 9, 11, 17, 18X’Pert HighScore Plus Labs 1, 3, 4, 5, 9, 11, 17, 19
63 Total Data sets analyzed
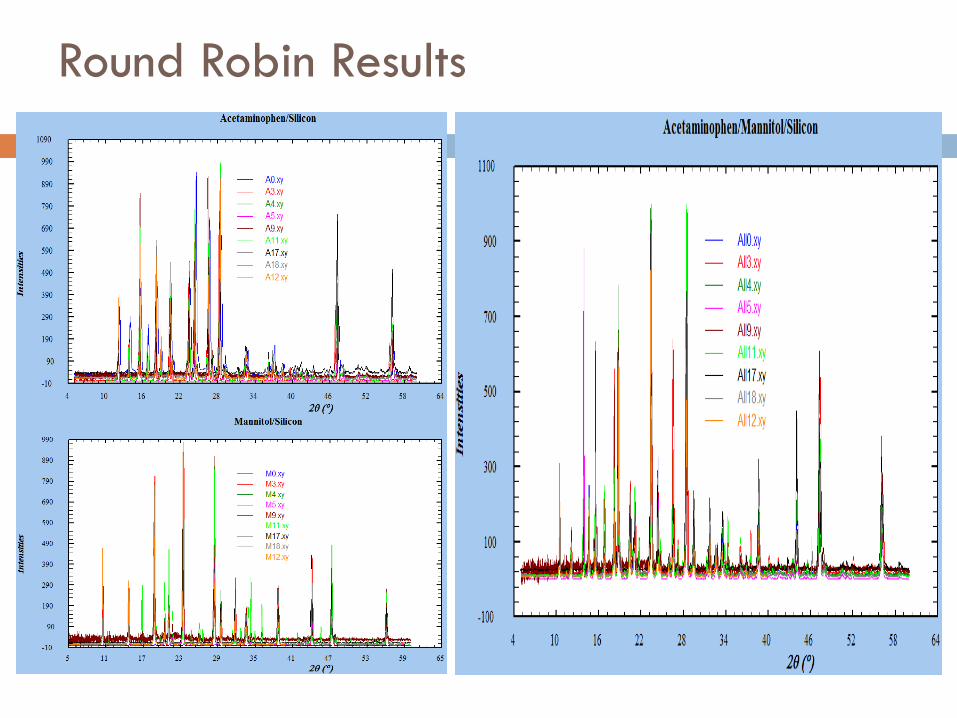
Round Robin Results

Variables
Specimen preparation
Data Processing
- Selection of references
- Selection of refinement variables

Cluster Analysis – 57/63 Data Sets
Synchrotronw/wo backgroundscatter
3 PhaseSamples
Very High Background
2 PhaseMannitol & Si
Nine Clusters
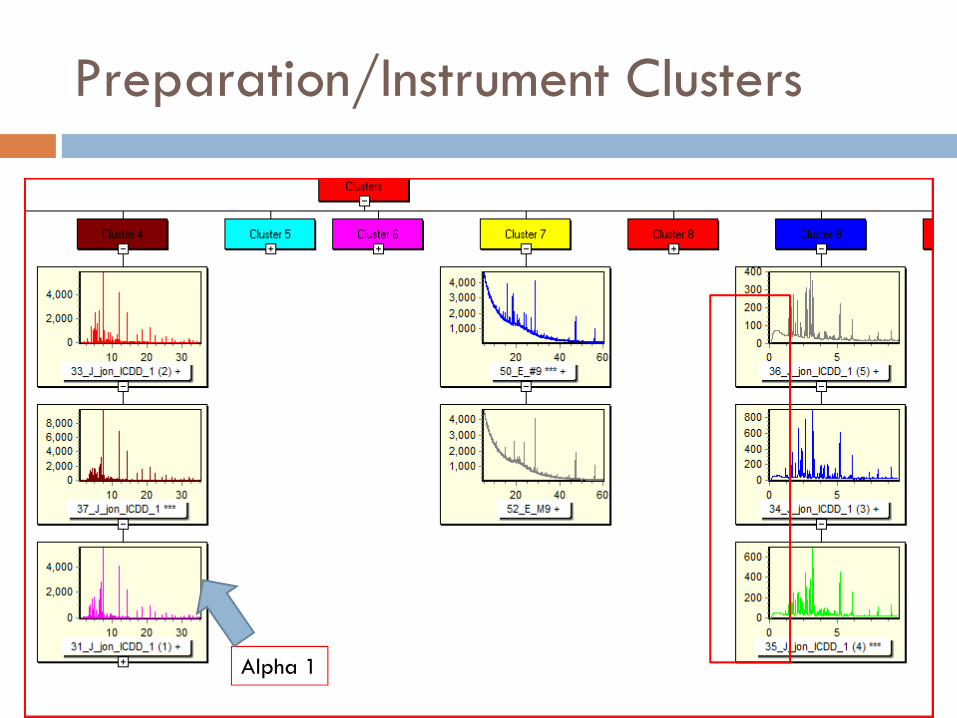
Preparation/Instrument Clusters
Alpha 1
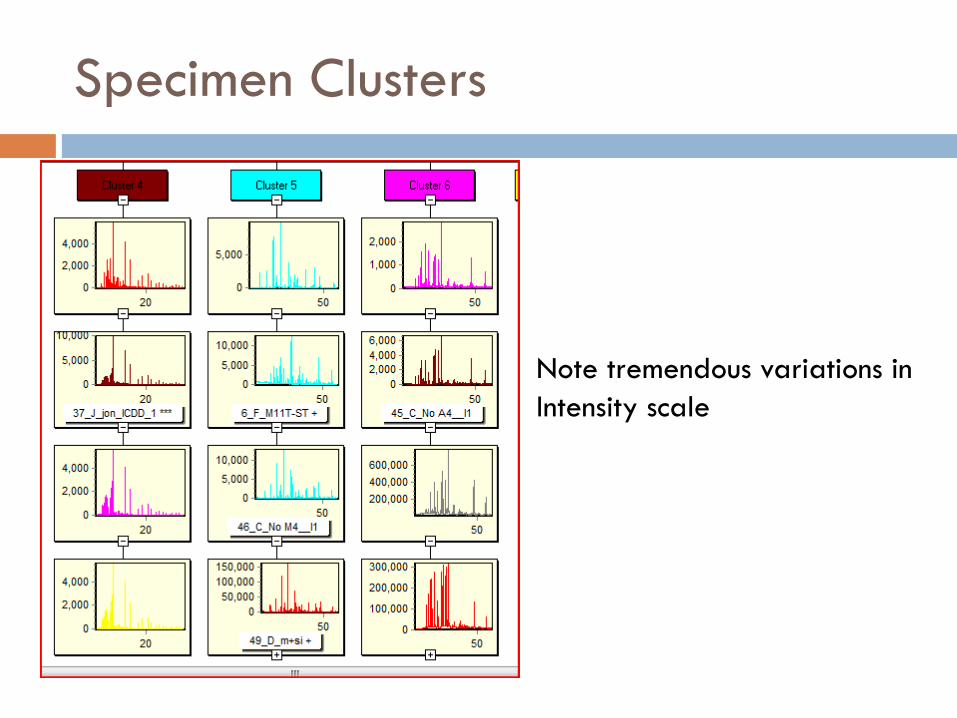
Specimen Clusters
Note tremendous variations inIntensity scale

Si 220 – Resolution
0.01 Units
Blue0.2 Units
Synchrotron
Silver0.1 Units
Mixed displacements, both low and high angle and low resolution
Blue data on left is probably a zero pointerror
High resolution

Specimen Displacement
Low resolution
Labs 1, 5, 11, 9
Frequent specimendisplacement – some of largemagnitude
Foil and cavity mounts

Large grains – capillary mount
Large grains for acetaminophen
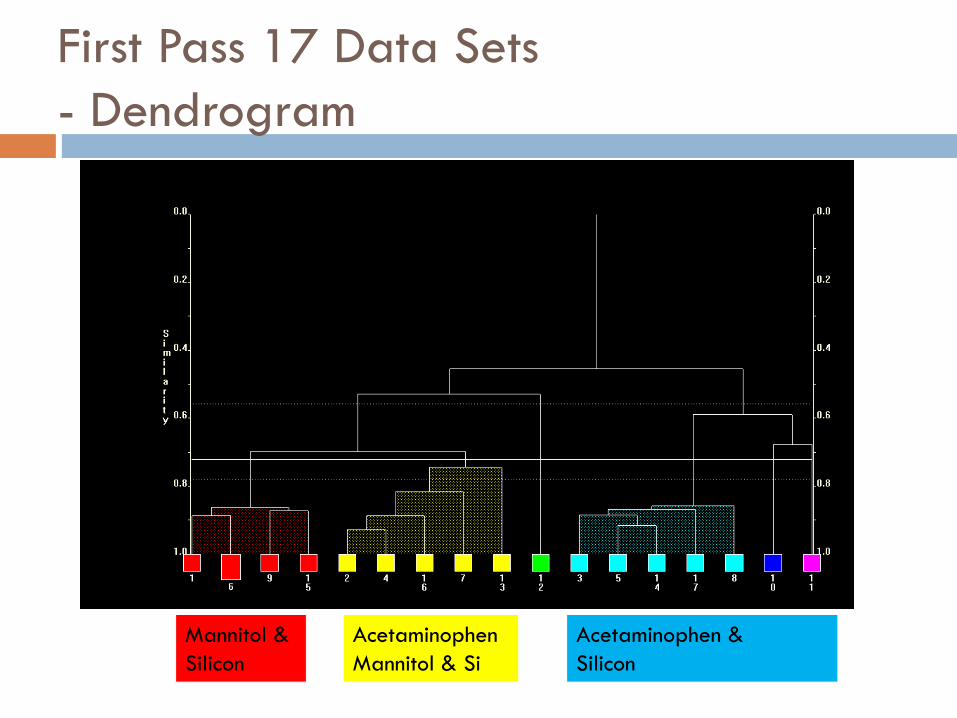
First Pass 17 Data Sets- Dendrogram
Mannitol &Silicon
AcetaminophenMannitol & Si
Acetaminophen &Silicon

First Pass – 17 Data Sets
1 23
Clusters
1) Mannitol and Silicon
2) Manitol, Acetaminophen andSilicon
3) Acetaminophen andSilicon
Different optics and specimenprep

Comparison of dataLab 9, not clusteredLow mannitol
Mannitol, Acetaminophen andSilicon Lab 17
Acetaminophen andSilicon Lab 4

Results Acetaminophen + Mannitol + Silicon
High Acetaminophen
High Acetaminophen
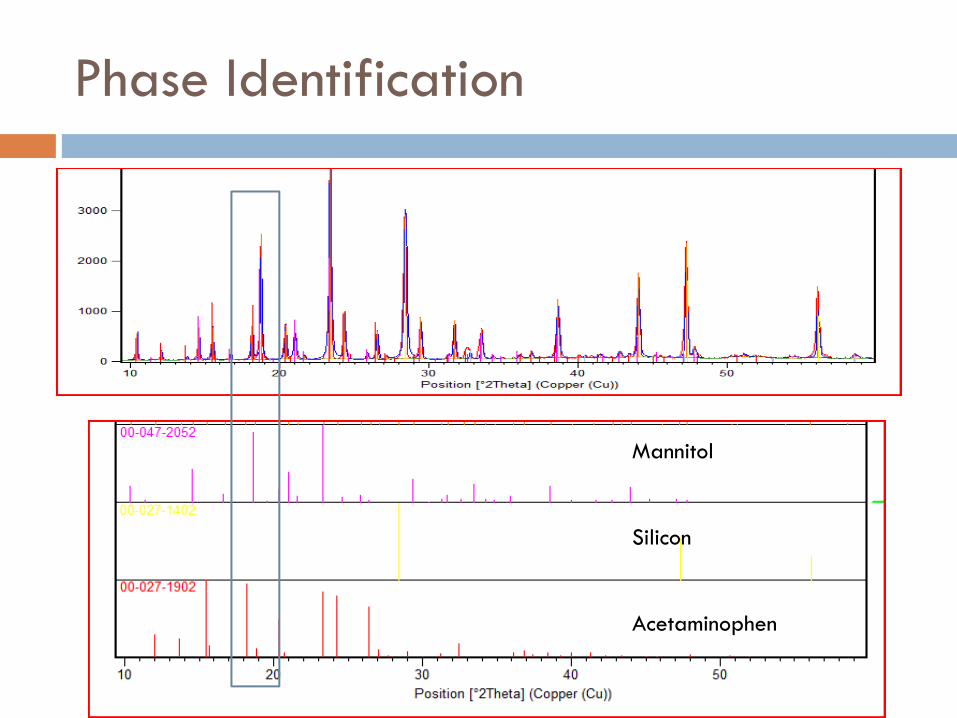
Phase Identification
Mannitol
Silicon
Acetaminophen

Results – Acetaminophen + Silicon
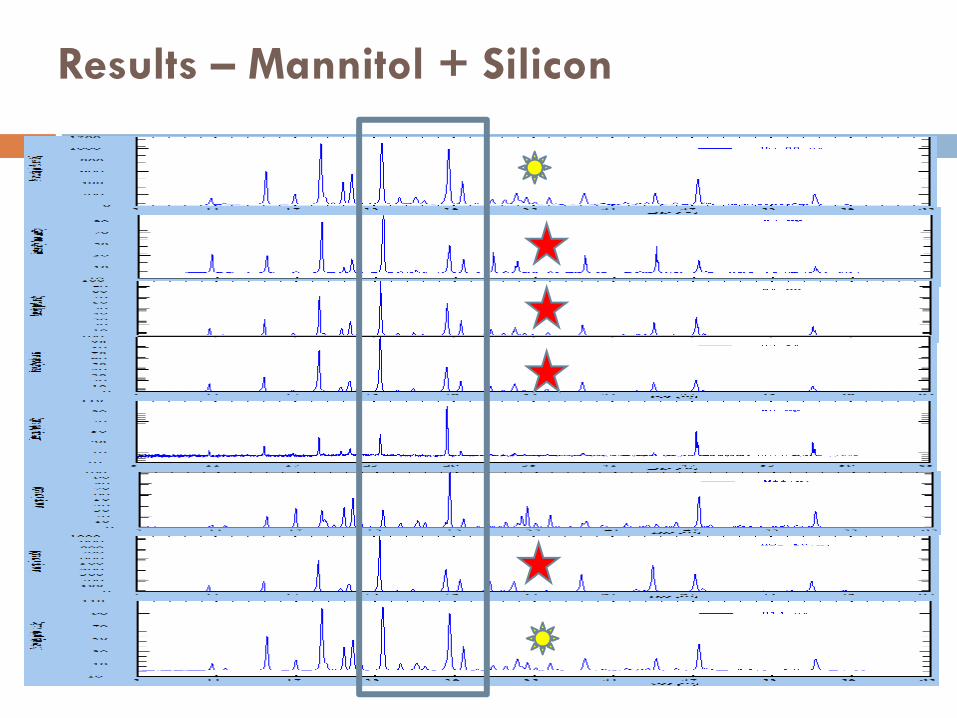
Results – Mannitol + Silicon

Issues in specimen prep
Specimen displacement observed in most data sets - Was this corrected ?
Specimen orientation observed
Non-representative specimens (obvious concentration differences)
Note: Ala Ron JenkinsThe sample is what is in the bottle. The specimen is what youpresent to the instrument.

2nd Pass – 21 Data Sets
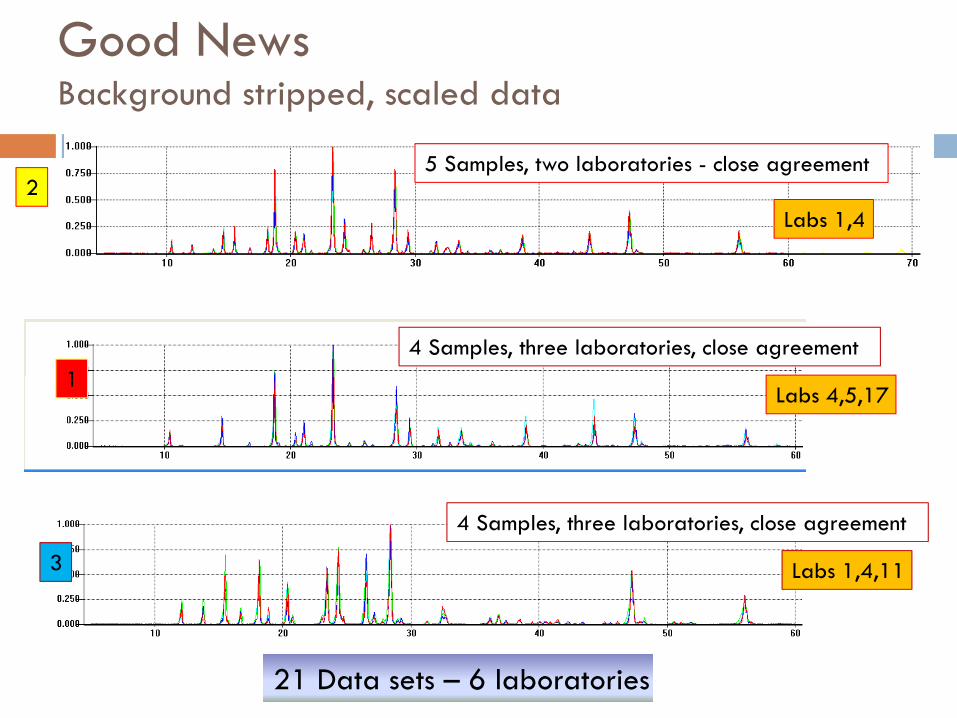
Good NewsBackground stripped, scaled data
5 Samples, two laboratories - close agreement
Labs 1,4
4 Samples, three laboratories, close agreement
Labs 4,5,17
2
1
3 Labs 1,4,11
4 Samples, three laboratories, close agreement
21 Data sets – 6 laboratories
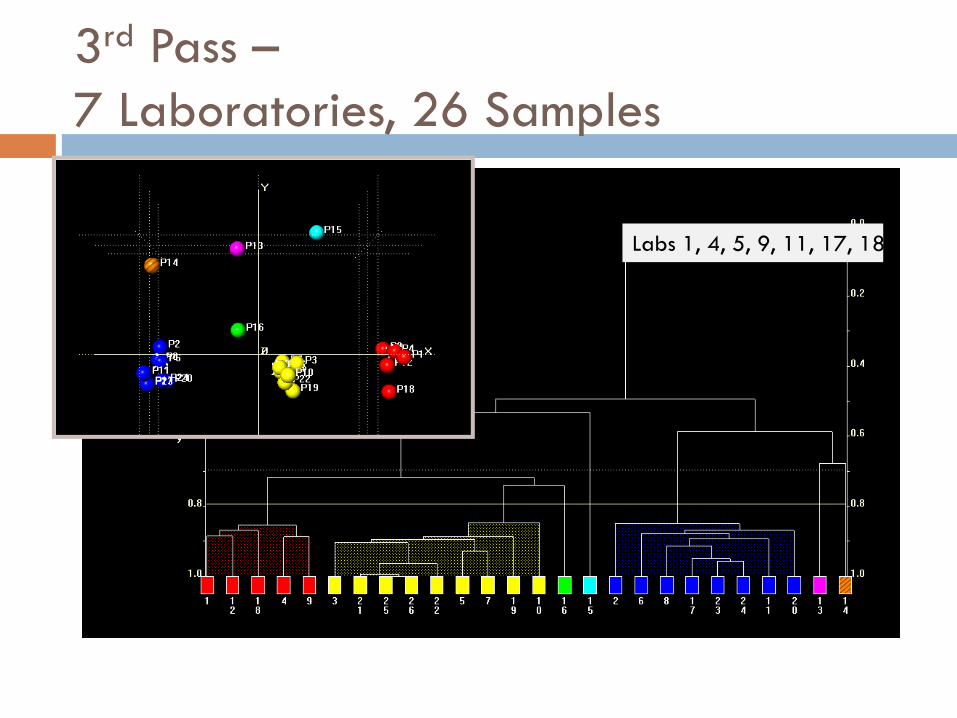
3rd Pass –7 Laboratories, 26 Samples
Labs 1, 4, 5, 9, 11, 17, 18

HighScore Plus4 labs, 37 Samples
Labs 1,3, 11,19

PCA
Synchrotron Data Sets
Synchrotron DataW scatter
Large collectionof lab data
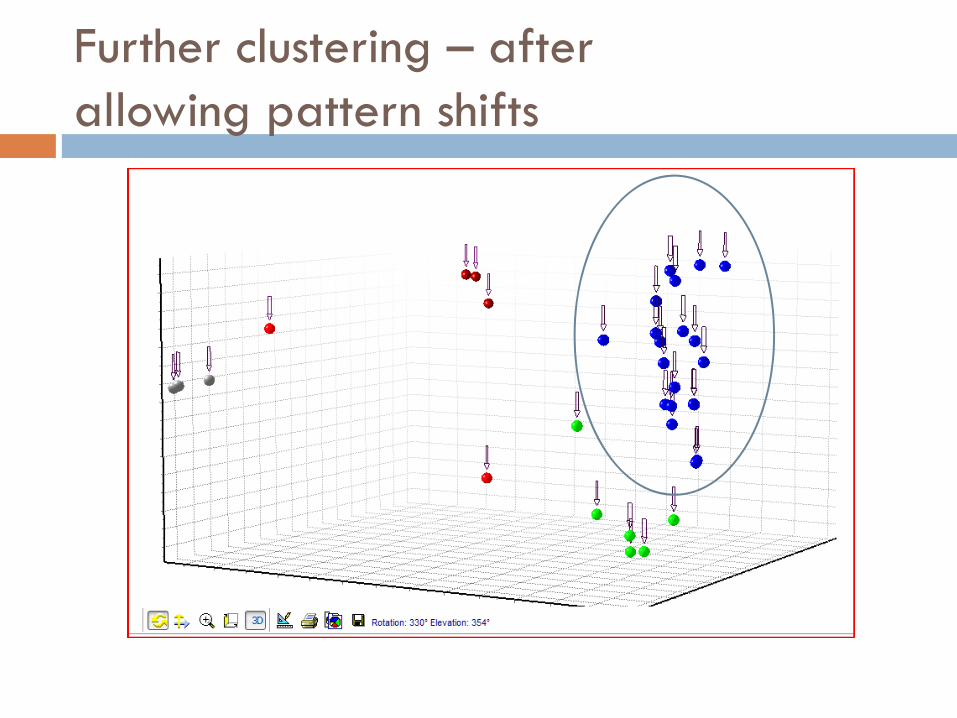
Further clustering – afterallowing pattern shifts

Main cluster
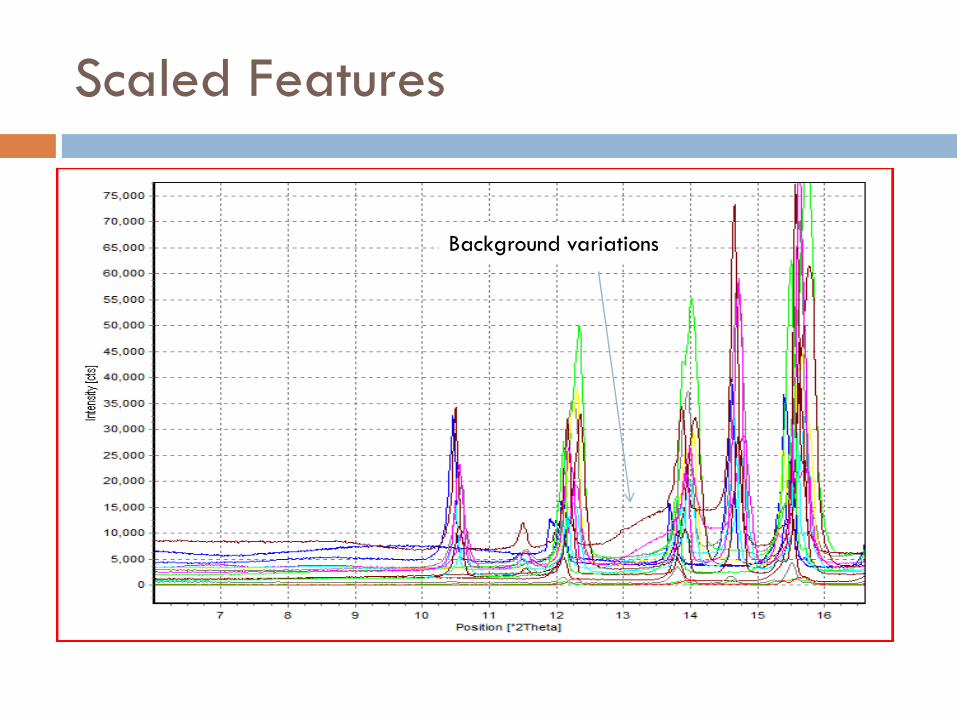
Scaled Features
Background variations

Acetaminophen/Silicon- Tighest cluster
id acetamino silicon
0 87 13
2 46.1 53.9
3 82.4 17.6
4 78.3 21.7
5 91.5 8.5
9 87.4 12.6
11 83.1 16.9
12 82 18
17 49 51
18 33 66
0
20
40
60
80
100
0 5 10 15 20
acetamino Si
Lab Number

Acetaminophen/Silicon – 85/15
id acetamino silicon2 46.1 53.93 82.416 17.5844 78.3 21.75 91.5 8.59 87.4 12.6
11 83.1 16.917 49 5118 33 66
0
20
40
60
80
100
0 5 10 15 20
acetamino Si
Normalized data – 4,5,18

Acetaminophen/Silicon
Processing very similar data resulted in very different results
Were the correct polymorphs used ?Can the program handle orientation ?
Were specimen displacements adjusted ?
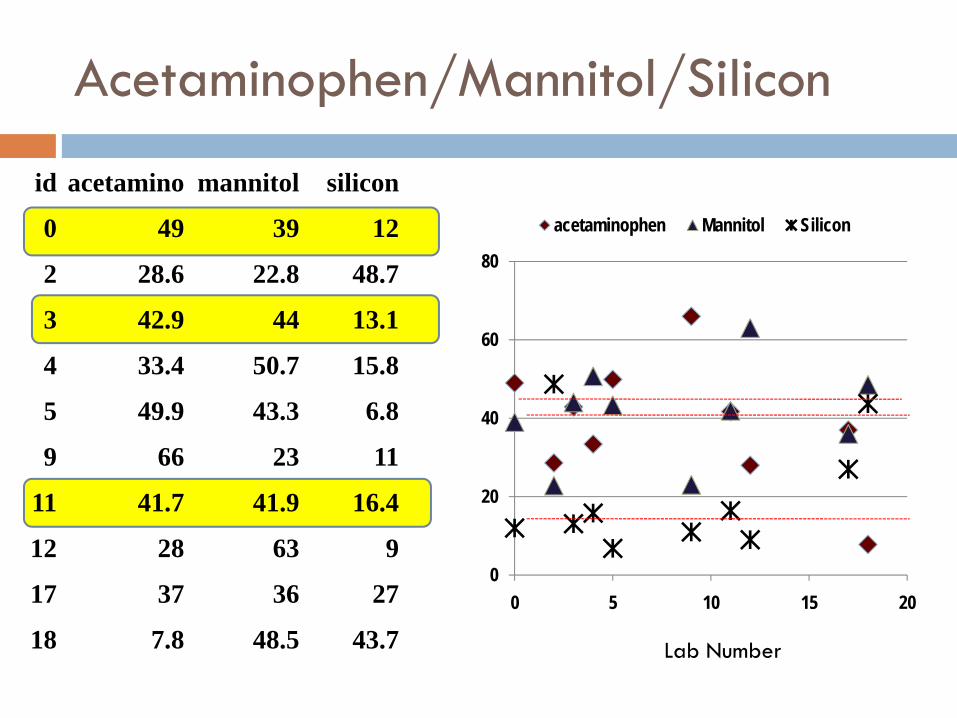
Acetaminophen/Mannitol/Silicon
id acetamino mannitol silicon
0 49 39 12
2 28.6 22.8 48.7
3 42.9 44 13.1
4 33.4 50.7 15.8
5 49.9 43.3 6.8
9 66 23 11
11 41.7 41.9 16.4
12 28 63 9
17 37 36 27
18 7.8 48.5 43.7
0
20
40
60
80
0 5 10 15 20
acetaminophen Mannitol Silicon
Lab Number
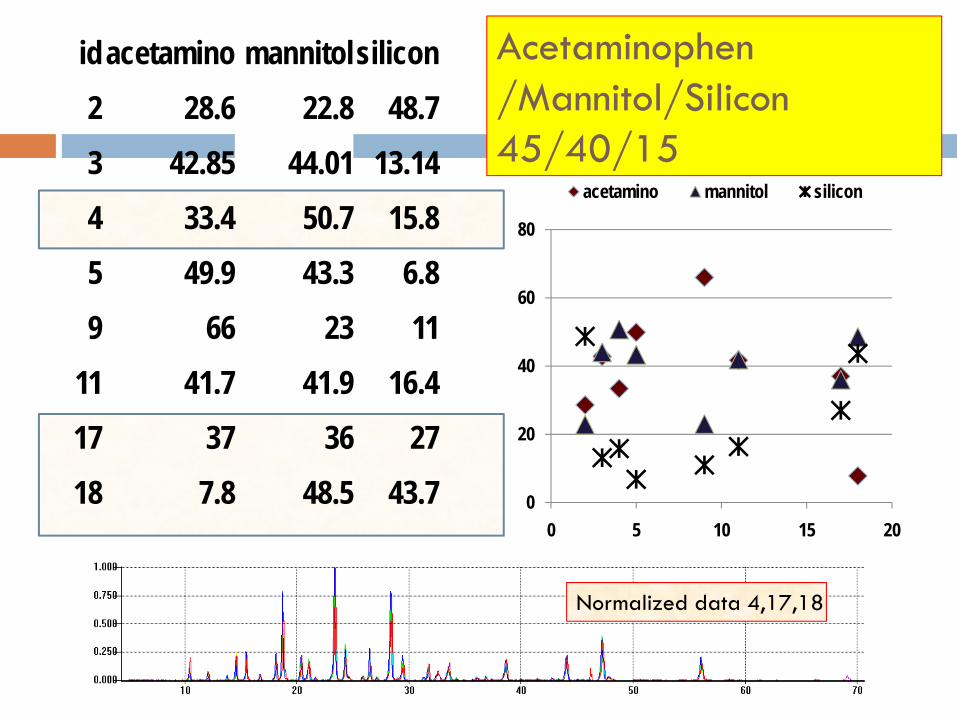
Acetaminophen/Mannitol/Silicon45/40/15
0
20
40
60
80
0 5 10 15 20
acetamino mannitol silicon
Normalized data 4,17,18
idacetamino mannitolsilicon2 28.6 22.8 48.73 42.85 44.01 13.144 33.4 50.7 15.85 49.9 43.3 6.89 66 23 11
11 41.7 41.9 16.417 37 36 2718 7.8 48.5 43.7
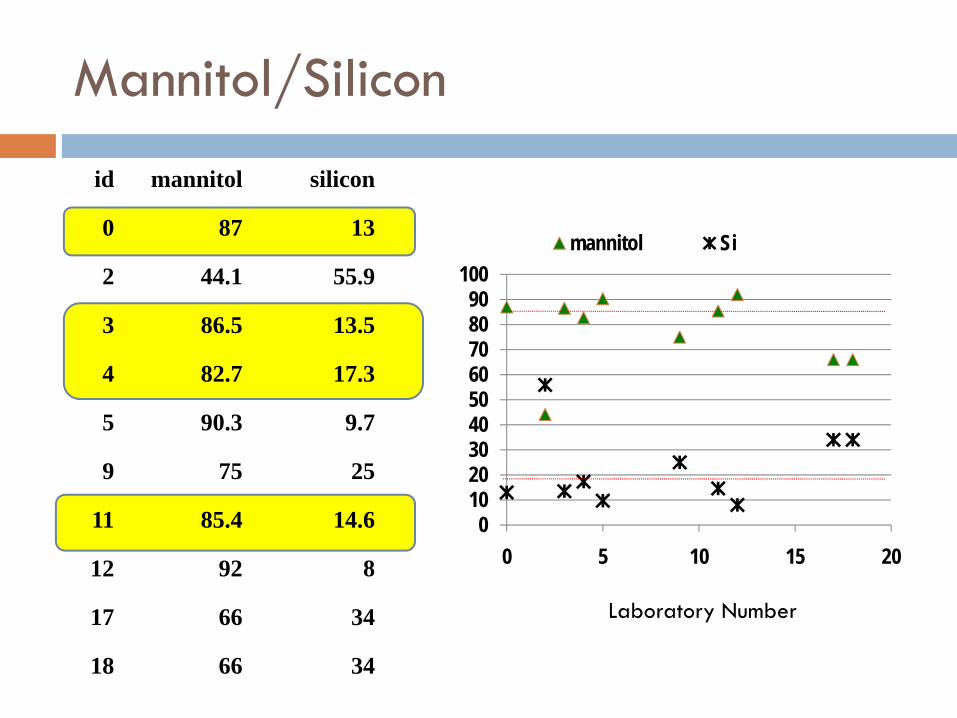
Mannitol/Silicon
id mannitol silicon
0 87 13
2 44.1 55.9
3 86.5 13.5
4 82.7 17.3
5 90.3 9.7
9 75 25
11 85.4 14.6
12 92 8
17 66 34
18 66 34
0102030405060708090
100
0 5 10 15 20
mannitol Si
Laboratory Number

Mannitol/Silicon 85/15id mannitol silicon2 44.1 55.93 86.5 13.54 82.7 17.35 90.3 9.79 75 25
11 85.4 14.617 66 3418 66 34
0102030405060708090
100
0 10 20
mannitol Si
Normalized Data 18, 4, 11
Analysis
Laboratories 0, 3 and 11 achieved good results on all specimensUsed cavity, capillary and foil mounts
Laboratories 2, 17 and 18 all overestimated Silicon concentrationAll 3 used cavity mountsThey used 3 different analysis programs
Laboratory 18 had reproducible data that was very comparable toother laboratories on the same sample. This suggest data processingwas the problem.
As a check Lab 17,18 data were refined at ICDD – and very differentresults were obtained.

Scaling Factors – I/Ic
Best Value Known range
Silicon 4.55 1-5 PolymorphicMannitol (beta-D) 0.51 0.48-0.66 PolymorphicAcetaminophen (Form I) 0.63 0.5-1.03 Polymorphic
SuggestLet Search/Match pickThe polymorph
Then use highest qualityambient data
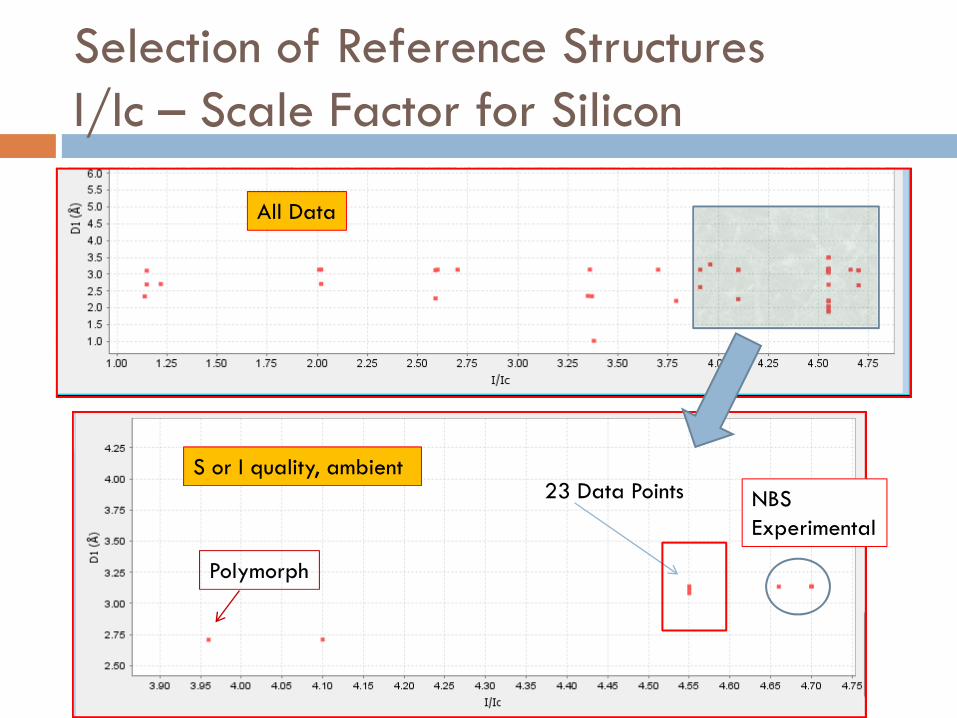
Selection of Reference StructuresI/Ic – Scale Factor for Silicon
All Data
S or I quality, ambient 23 Data Points
Polymorph
NBSExperimental

Observations
Specimen Prep
Several specimens did not exhibit representative samplingOrientation was observedSpecimen displacement was frequently observedGranularity was observable from the acetaminophen data
In otherwords- all the well known factors that can cause poor results were present
Processing
Each component has polymorphs – choosing the appropriate structurewas critical (i.e. good search match identification)
Specimen prep error could lead to false identification among close choices between the polymorphs
The ability to adjust for orientation was very importantWere observed displacements or zero point shifts corrected ?

Results
Laboratory Data Resolution Intensity Data Processing Overall Results0 Good Strong Excellent Excellent2 No Raw Data Poor3 Poor (grainy) Med Excellent Excellent4 Excellent Med Good Good5 Good Strong Average Average9 Poor (bkgd) Weak Good Average11 Moderate Strong Excellent Excellent17 Good Med Poor Poor18 Excellent Med Poor Poor19 Excellent Strong
Poor to moderate resolution but reproducible strong intensity (i.e. good counting statistics)- produces excellent results
Excellent is ~ within 5 % absolute value