![Untitled-1 [washservice.pl] · 7197 10255 10.00 15.63 29.12 51.24 82.3 103.9 159.2 237.58 408.1 614.18 ... NBR Stainless steel Cast aluminum NBR POM Stainless steel Stainless steel](https://static.fdocuments.us/doc/165x107/5bf5f0c209d3f20a768bd83a/untitled-1-7197-10255-1000-1563-2912-5124-823-1039-1592-23758-4081.jpg)
ROSNEFT INVESTOR DAY NEW YORK · Combined Company Pro-forma Income Statement US$ bn 12M 2012...
19
ROSNEFT INVESTOR DAY NEW YORK Igor I. Sechin April 25, 2013
Transcript of ROSNEFT INVESTOR DAY NEW YORK · Combined Company Pro-forma Income Statement US$ bn 12M 2012...

ROSNEFT INVESTOR DAYNEW YORK
Igor I. SechinApril 25, 2013

Rosneft – New Global Leader
Global Proved Reserves(1)(2) Hydrocarbon Production(2) Lifting Costs(3)(4)
4.7
3.7
Lukoil
Rosneft US$/boe
25.2
33.9
Exxon
Rosneft
4.2
4.7
Exxon
Rosneft
10 1
7.3
BP
ENI
17 3
22.3
Lukoil
PetroChina
3 3
3.7
Shell
PetroChina
11.2
10.1
PetroChina
BP
16.0
17.3
BP
Lukoil
3.3
3.3
BP
Shell
12.9
12.3
Petrobras
Exxon
12.9
13.6
Petrobras
Shell
2.4
2.6
Petrobras
Chevron
14.0
13.1
Chevron
Shell
7.2
11.3
ENI
Chevron
1.7
2.2
ENI
Lukoil
- 5 10 15
2
- 10 20 30 40
bnboe
- 1 2 3 4 5
mmboepd
Notes: (1) SEC Reserves as of 31.12.2012(2) Rosneft data includes affiliates and TNK-BP(3) Includes materials and supplies, equipment maintenance and repairs, wages and salaries, activities to enhance oil recovery, procurement of fuel and lubricants, electricity etc/ (4) Rosneft data is proforma with TNK-BP for 2012. Peers data is 2011.

Delivering Profitable Growth
5 0
Oil and Gas Production EBITDA
50%404.7
2 02.53.03.54.04.55.0
mbo
epd
2008-2012 CAGR of 3.6%
20%
30%
40%
50%
20
25
30
35
40
$ bn
33
0.00.51.01.52.0
2008 2009 2010 2011 2012 2012
mm
Pro forma
0%
10%
20%
0
5
10
15
2008 2009 2010 2011 2012 2012Pro-forma
167 7 7 11
Stations Refinery Throughput
Pro-formaRosneft + TNK-BP EBITDA (LHS) EBITDA Margin (RHS)
11
Pro-formaRosneft + TNK-BP
2 801
1.5
2.0
2.5
oepd4.0
5.0
6.0
7.0
1,500
2,000
2,500
3,000
$mnits
167 7 7 11 112,801
1.9
0.0
0.5
1.0
2008 2009 2010 2011 2012 2012
mm
b
0.0
1.0
2.0
3.0
0
500
1,000
2009 2010 2011 2012 2012
$un
2008 2009 2010 2011 2012 2012
Number (LHS) Sales per Station (RHS)
3
Number of refineriesPro-forma
Rosneft + TNK-BPPro-forma
Rosneft + TNK-BP
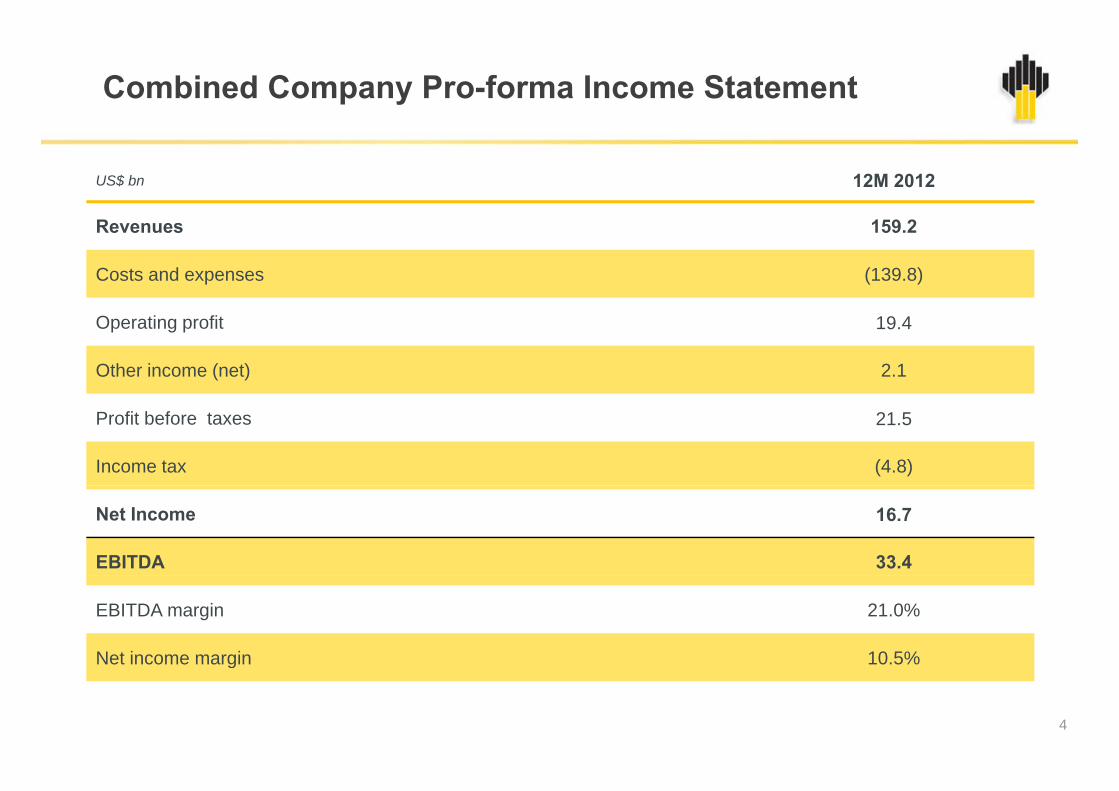
Combined Company Pro-forma Income Statement
US$ bn 12M 2012
Revenues 159.2
Costs and expenses (139.8)
Operating profit 19.4
Other income (net) 2.1
Profit before taxes 21.5
Income tax (4.8)
Net Income 16.7
EBITDA 33.4
EBITDA margin 21.0%
Net income margin 10.5%g
4

TNK-BP Acquisition
$
Transaction Highlights Financial Strength
The largest industry deal (US$55.3 bn) in the last decade in terms of cash consideration
Unprecedented financial package used for acquisition
• Efficient combination of debt and equityUS$31 b di d l f i i l b k Rosneft becomes the largest public oil company
Synergies exceeding US$10 bn
• US$31 bn syndicated loans from international banks and US$6 bn from Russian banks
• Innovative financing with pre-payment from traders (US$10 bn commitment, US$7.5 bn called) Synergies exceeding US$10 bn
BP ready to share industry insight and know-how
All-in funding cost < 3%
Prudent leverage of 2x Net Debt / EBITDA
Private shareholder base over 30.5%
Prudent leverage of 2x Net Debt / EBITDA
Credit rating upgrade
5

Delivering Value Through Synergies and Cost Reduction
1.0
US$bn
10.02 0
0.51.0
2.5
3.0
2.0
Upstream Marketing&Logistics Refining Personnel Procurements Others TotalUpstream Marketing&Logistics Refining Personnel Procurements Others Total2
1. Joint use of Vankor infrastructure for the development of Suzun, Tagul and Lodochnoye, exploration portfolio optimization
31 54
2. Crude and petroleum products supply chains and filling station networks optimization
3. Optimizing project portfolio of refineries and gas processing plants to be upgraded, use of state of arttechnologies and best practices
4. G&A reduction, using qualifications of best industry professionals
5. Unification of purchase terms
A d 24% f US$10 b t t l i i CAPEX i t f US$3 4 b
6
Around 24% of US$10 bn total synergies is expected to be obtained in 3 years from now
CAPEX savings account for US$3.4 bnof the total synergies

Strong Resource Foundation for Long Term Growth
Total reserve additions by 2030 c. 30bn boe• Including onshore c. 22bn boe and shelf c.8bn boe
Проектируемые нефтепроводыМагистральная система АК «Транснефть»Shelf West Arctic
902 (2013-2017)3,262 (2018-2030)
Shelf East Arctic2,030 (2018-2030)
West Siberia
, ( )
4,310 (2013-2017)7,059 (2018-2030)
Shelf Far East
Central Russia938 (2013-2017)1 400 (2018-2030)
East Siberia1,803 (2013-2017)6,216 (2018-2030)
Shelf Far East308 (2013-2017)828 (2018-2030)
Moscow1,400 (2018-2030)
South of Russia40 (2013-2017)172 (2018-2030)( )
Shelf South Seas528 (2013-2017)147 (2018-2030)
Regionmmboe (addition date range)
7
Head Office
Exploration and production
147 (2018 2030) mmboe (addition date range)

Production from Core Areas
10% bi d f th C ’ t t l d ti
SamotlorYuganskneftegaz
30% f th bi d C ’ t t l d ti c.10% combined of the Company’s total production
High depletion (74%) of reserves
The use of new technologies is the primary method of dditi l
c.30% of the combined Company’s total production
Priobskoye field – low depletion (24%) and low watercut
Tax incentives are expected for unconventional reserves and l d i l f d l t d fi ld additional reserves recovery:
• Drilling of horizontal wells with multistage fracturing
• Sidetracking with modern methods of localizing the i i
are already in place for depleted fields
Advanced geological, technical programs and the efficient use of low permeability reserves
remaining reserves
• Waterflood management
Production Profile Production Profile
1,200
1,400
1,600
1,200
1,400
1,600
400
600
800
1,000
mbo
epd
400
600
800
1,000 m
boep
d
8-
200
2002 2003 2004 2005 2006 2007 2008 2009 2010 2011 2012 2013 2014 2015 2016 2017-
200
2002 2003 2004 2005 2006 2007 2008 2009 2010 2011 2012 2013 2014 2015 2016 2017
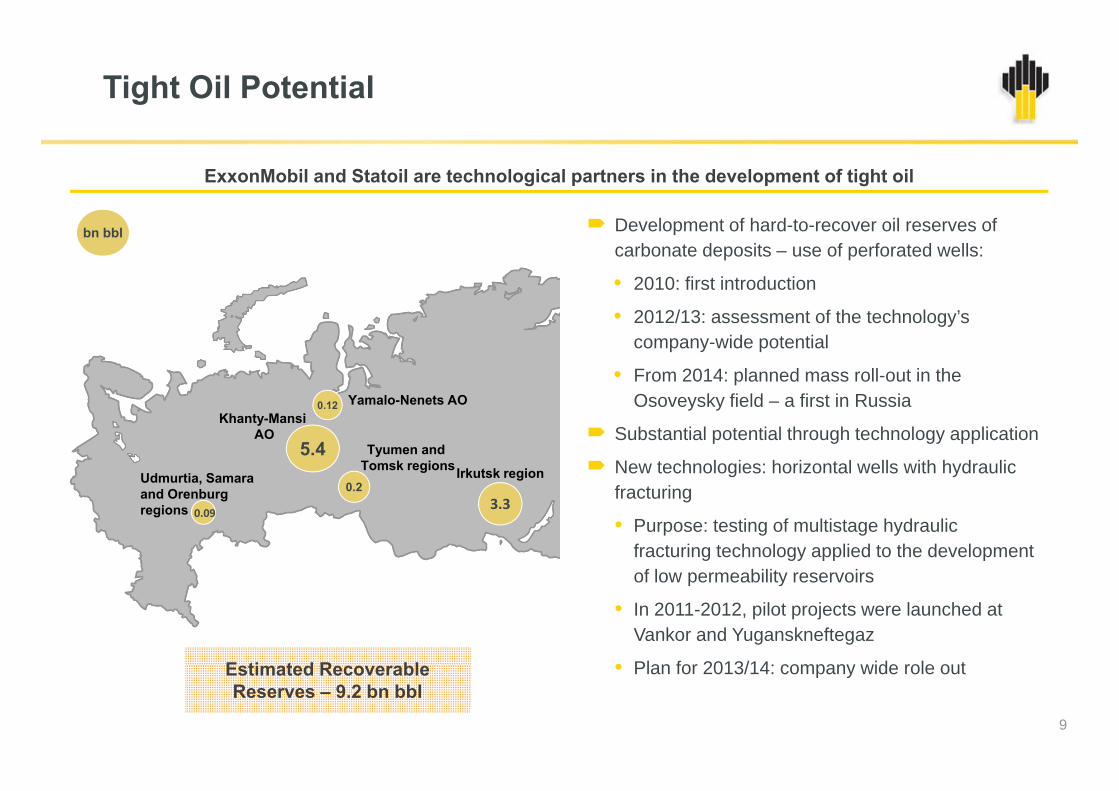
Tight Oil Potential
ExxonMobil and Statoil are technological partners in the development of tight oil
Development of hard-to-recover oil reserves of carbonate deposits – use of perforated wells:
• 2010: first introduction
bn bbl
• 2012/13: assessment of the technology’s company-wide potential
• From 2014: planned mass roll-out in the O k fi ld fi t i R iY l N t AO
5.4
0.12Khanty-Mansi
AO
Osoveysky field – a first in Russia
Substantial potential through technology application
New technologies: horizontal wells with hydraulic f i
Yamalo-Nenets AO
Irkutsk region0 2
Udmurtia, Samara
Tyumen and Tomsk regions
fracturing
• Purpose: testing of multistage hydraulic fracturing technology applied to the development of low permeability reservoirs
3.30.2and Orenburg
regions 0.09
of low permeability reservoirs
• In 2011-2012, pilot projects were launched at Vankor and Yuganskneftegaz
• Plan for 2013/14: company wide role outE ti t d R bl • Plan for 2013/14: company wide role out
9
Estimated Recoverable Reserves – 9.2 bn bbl

East Siberia – Driver of Growth
GorchinskoyeVostochno Messoyakhskoe
17.4 bn bbl – total oil and condensate resources of East Siberian fields
Suzunskoe
GorchinskoyeVostochno-Messoyakhskoe
Zapadno-Messoyakhskoe
resources of East Siberian fields
Combined production will exceed 200mboepd
Pyakyahinskoe
Yuzhno-Messoyakhskoe200mboepd
Rosneft will accelerate the development of Suzun Tagul and Lodochnoye fields by 1 2Vankor
Lodochnoe
Khalmerpayutinskoe
I h i k
Suzun, Tagul and Lodochnoye fields by 1-2 years
Significant capex savings using the VankorTagulskoe
Russko-Rechenskoe
Ichemminskoe Significant capex savings using the Vankor infrastructure (162km pipeline not required)
Fi t Oil f S T l L d h i
Russkoe
Mangazeyskoe
First Oil from Suzun, Tagul, Lodochnoe in 2016 / 17
10
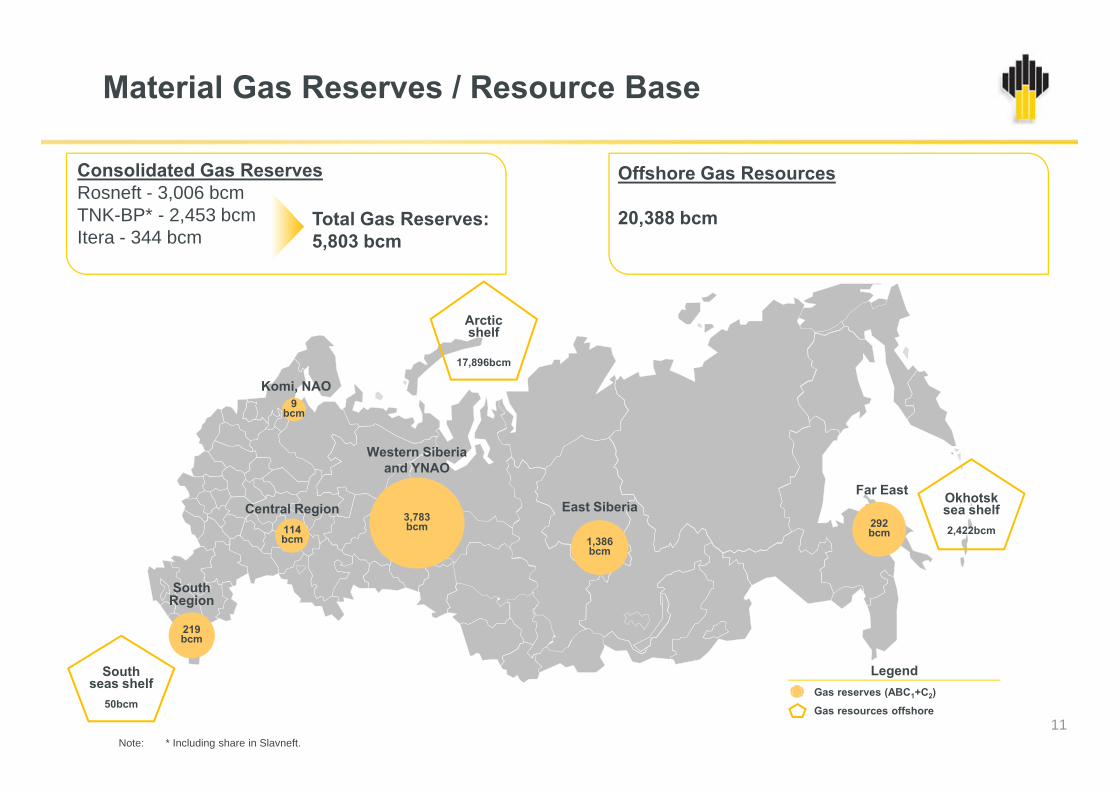
Material Gas Reserves / Resource Base
Consolidated Gas ReservesRosneft - 3,006 bcmTNK-BP* - 2 453 bcm Total Gas Reserves:
Offshore Gas Resources
20 388 bcmTNK-BP - 2,453 bcmItera - 344 bcm
Total Gas Reserves: 5,803 bcm
20,388 bcm
Arctic shelf
17,896bcm
Komi, NAO9
bcm
Western Siberia and YNAO
F E t
1,386bcm
3,783bcm114
bcm
Okhotsksea shelf2,422bcm292
bcm
Central Region East SiberiaFar East
219bcm
SouthRegion
Gas reserves (ABC1+C2)
Gas resources offshore
LegendSouth seas shelf
50bcm
Note: * Including share in Slavneft.11

Gas Monetisation
100Gas production, bcm
Rospan
Sakhalin-3Others Gas is 22% of proved hydrocarbon reserves
Itera JV provides access to unique regional
Kharampur
53Kynsko-Chaselskoe distribution network
As at January 2013, 72 bcm already covered by
Vankor
41
As at January 2013, 72 bcm already covered by long-term contracts
Covering 75% of target gas production in 2017
Existing fields
TNK-BP
Covering 75% of target gas production in 2017
Rosneft
gItera
2013 2020
12

Transformational Upside from Shelf Development
48 55Barents Sea Kara Sea East Siberian, Chukchi
and Laptev Seas42
29
Total RecoverableResources on Shelf, bn boe
155
Нефть Газ
103 bn boe
47 bn boeНефть Газ
71 bn boe
Oil Gas Oil Gas
120
Нефть ГазOil Gas
Oil Gas
ф275 bn boe
16 14
Нефть ГазMoscow Oil Gas
Okhotsk Sea
30 bn boe
Black, Azov and Caspian Seas23
Legend
13
230.3
Нефть Газ
23 bn boeOil Gas
Head office
Offshore resources

Refineries’ Modernization Program
Significant gains are expected from US$25 bn value Rosneft refineries’ modernization program
Modernization results Value creation lever
Increased light product yieldIncrease of domestic market sales with premium to exports1
US$5bn additional
Increased light product yield sales with premium to exports over US$100 per ton
Increased added value of oil
1
2 EBITDA p.a.
Increased volume of conversion from heavy into light products
products basket
Capture of tax abatement up to
2
Additional US$1bn EBITDA for TNK-BP
from heavy into light products US$100 per ton of light products converted from heavy(1)
3
EBITDA for TNK BP
Substitution export of heavy fuel by diesel Pipeline logistics cost benefit4
14Note: (1) Export duties for heavy products to be raised to the crude oil duties’ level
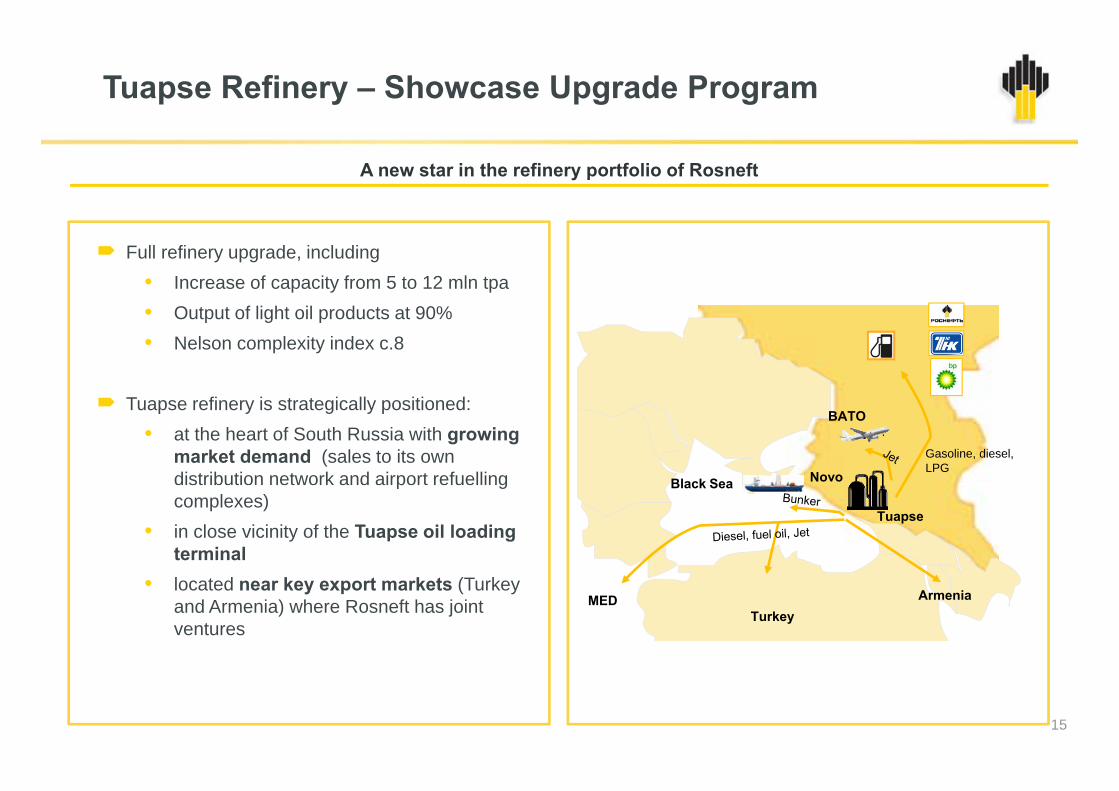
Tuapse Refinery – Showcase Upgrade Program
A new star in the refinery portfolio of Rosneft
Full refinery upgrade, including• Increase of capacity from 5 to 12 mln tpa
O f li h il d 90%• Output of light oil products at 90%• Nelson complexity index c.8
Black Sea
BATO
Gasoline, diesel, LPG
Novo
Tuapse refinery is strategically positioned: • at the heart of South Russia with growing
market demand (sales to its own distribution network and airport refuelling
Tuapse
Black Seap gcomplexes)
• in close vicinity of the Tuapse oil loading terminal
MEDTurkey
Armenia• located near key export markets (Turkey
and Armenia) where Rosneft has joint ventures
15

Enlarged Company Provides Unique Trading Flexibility
Crude supplies to direct customers via Northern Druzhba
Primorsk
Vankor
PurNGSevernaya Neft
Polar light Nyagan
Ust-LugaJV Ruhr Oel(11,91 mtpaproduction in 2012)
Ventspils32
Primorsk
1926
Druzhba
Tomskneft
YuganskNG
VerkhnechonskNG
SakhalinmorNG
Sakhalin-1
Udmurtneft
SamaraNG
OrenburgNG
Samotlor
Kozmino
Ruhr Oel
Novo
Trading and logistics of Caspian crude, processing at Eni refineries, gas sales from Yamal fields
Supplies to China by ESPO on long
Plock refinery
Mozyr refineryLisichansk
Tuapse
Taganrog Nakhodka
Vanino
15
138
8
g
15
Yamal fields
JV for crude and products trading
by ESPO on long-term contracts basis Tyanzhin
refineryPlans for 13 mtparefinery construction
Saras
… Crude export 2012 mtpa
Crude fields
… Crude export 2012, mtpa
… Products export 2012, mtpa
Note: (1) Rosneft share.16
Key crude flows

Corporate Governance
Rosneft shareholders proposed to add three new international board members increasing the depth of senior corporate governance experience and knowledge in both the oil and gas sector as well as
t ficorporate finance
Donald Humphreys John MackRobert Dudley p yFormer Senior Vice President and Treasurer of ExxonMobil
Mr. Humphreys brings to Rosneft 36 years of experience as a corporate
Senior Advisor at KKR and Co. L.P.
Mr. Mack has served as Chairman and CEO of Morgan Stanley as well as CEO of Credit Suisse First
yChief Executive Officer of BP p.l.c.
Mr. Dudley has 33 years of experience in the oil and gas sector and has served as CEO of TNK-BP years of experience as a corporate
finance professional in the oil and gas sector at ExxonMobil
as CEO of Credit Suisse First Boston
and has served as CEO of TNK-BP from 2003-2008
17

Key Strategic Initiatives
• Optimisation of procurement• Reduction of SG&A
I d ffi i f it l d ti l ditCost Reduction
• Increased efficiency of capital and operational expenditures
• Focus on maintaining stable production• Drilling out of adjacent fields and horizons• Implementation of new practices – horizontal multifrac drilling
Brownfield Optimisation p p gp
• Continued focus on East Siberia – Suzun, Tagul, Lodochnoye• Shelf projects in Arctic, Black Sea and Sakhalin• Tight oil
Greenfield Development
• Growth in production and reserves• Long-term contracts and market share• Explore LNG projects
Gas Strategy
• Glencore/Vitol contract with associated pre-payments• Discussions with partners in Asia• Long term gas supply contracts
Long term supply contracts
• Complete overhaul programme of refineries• New capacity coming onstream from 2013 (Tuapse)• Optimisation of retail
Downstream Investment
• Economic climate supporting production growthPartnership ith
18
• Economic climate supporting production growth• Tax incentives, export duties and localisation of component production• Focus on best practice environmental regulation
Partnership with the Government

Important Notice
The information contained herein has been prepared by the Company. The opinions presented herein are based on general information gathered at the timeof writing and are subject to change without notice. The Company relies on information obtained from sources believed to be reliable but does not guaranteeits accuracy or completeness.
These materials contain statements about future events and expectations that are forward-looking statements. Any statement in these materials that is not astatement of historical fact is a forward-looking statement that involves known and unknown risks, uncertainties and other factors which may cause our actualresults, performance or achievements to be materially different from any future results, performance or achievements expressed or implied by such forward-looking statements. We assume no obligations to update the forward-looking statements contained herein to reflect actual results, changes in assumptions orchanges in factors affecting these statements.
This presentation does not constitute an offer or invitation to sell, or any solicitation of any offer to subscribe for or purchase any securities and nothingcontained herein shall form the basis of any contract or commitment whatsoever. No reliance may be placed for any purposes whatsoever on the informationcontained in this presentation or on its completeness, accuracy or fairness. The information in this presentation is subject to verification, completion andchange. The contents of this presentation have not been verified by the Company. Accordingly, no representation or warranty, express or implied, is made orgiven by or on behalf of the Company or any of its shareholders, directors, officers or employees or any other person as to the accuracy, completeness org e by o o be a o t e Co pa y o a y o ts s a e o de s, d ecto s, o ce s o e p oyees o a y ot e pe so as to t e accu acy, co p ete ess ofairness of the information or opinions contained in this presentation. None of the Company nor any of its shareholders, directors, officers or employees norany other person accepts any liability whatsoever for any loss howsoever arising from any use of this presentation or its contents or otherwise arising inconnection therewith.