Ronald MacDonald and Xuxin Mao 18 January 2016 · Ronald MacDonald. 1. and Xuxin Mao. 2. ......
40
1 Forecasting the 2015 General Election with Internet Big Data: An Application of the TRUST Framework Ronald MacDonald 1 and Xuxin Mao 2 18 January 2016 “Britain and Twitter are not the same thing.” - David Cameron Abstract Many variables, such as currencies, are very difficult to predict and often researchers demonstrate that a simple random walk process can out-perform a model-based forecast using fundamentals. However, there is increasing evidence that such results can be overturned with the use of rich enough dynamic processes in the underlying statistical modelling and also by ensuring that a rich enough information set is used. Elections have also become increasingly difficult to predict, despite the use of increasingly sophisticated methods, with the 2015 UK General Election being a good case in point. In this paper we demonstrate that the kind of statistical methods used to predict currencies and other financial variables, combined with information culled from internet sources such as Google trends, can greatly improve on the predictions based solely on opinion polls. This paper offers the first real time test of the so-called Big Data for the UK 2015 General Election. Our real time predictions of both the overall UK and Scottish components of the election are very close to the actual outcomes. 1 Adam Smith Business School, University of Glasgow, Glasgow, G12 8QQ, Email: [email protected] 2 The Bartlett, University College London and AECOM, London, WC1E 6BT, Email: [email protected]
Transcript of Ronald MacDonald and Xuxin Mao 18 January 2016 · Ronald MacDonald. 1. and Xuxin Mao. 2. ......

1
Forecasting the 2015 General Election with Internet Big Data: An Application of the TRUST Framework
Ronald MacDonald1 and Xuxin Mao2
18 January 2016
“Britain and Twitter are not the same thing.” - David Cameron Abstract Many variables, such as currencies, are very difficult to predict and often researchers demonstrate that a simple random walk process can out-perform a model-based forecast using fundamentals. However, there is increasing evidence that such results can be overturned with the use of rich enough dynamic processes in the underlying statistical modelling and also by ensuring that a rich enough information set is used. Elections have also become increasingly difficult to predict, despite the use of increasingly sophisticated methods, with the 2015 UK General Election being a good case in point. In this paper we demonstrate that the kind of statistical methods used to predict currencies and other financial variables, combined with information culled from internet sources such as Google trends, can greatly improve on the predictions based solely on opinion polls. This paper offers the first real time test of the so-called Big Data for the UK 2015 General Election. Our real time predictions of both the overall UK and Scottish components of the election are very close to the actual outcomes.
1 Adam Smith Business School, University of Glasgow, Glasgow, G12 8QQ, Email: [email protected] 2 The Bartlett, University College London and AECOM, London, WC1E 6BT, Email: [email protected]

2
Introduction It has become something of a paradigm in Finance and International Finance that asset prices and returns are very hard to predict. For example, numerous researchers have argued that exchange rates, are impossible to predict and have established that such variables follow a random (walk) process (see, for example, Meese and Rogoff (1983)). An alternative viewpoint exists that if a rich enough information set is created, with associated dynamics to model the underlying processes of the forcing variables, predictability can be strikingly found (see MacDonald and Marsh (1997), (1999)). In the wider forecasting genre, elections have proved increasingly difficult to predict, with the May 2015 General Election in the UK being a good example of this, where no pollster was able to predict that the Conservative party would gain an overall majority or indeed be the majority party. This forecasting failure has led to the setting up of an inquiry by the British Polling Council/Market Research Society into why the pollsters’ predictions in May 2015 were so poor. There have been several recent innovations in the area of election prediction with pollsters utilising internet based data and using different survey methods, while modellers have considered various fundamental factors, including economic, political and social factors, and adopted more sophisticated statistical techniques. Recently, forecasters have also begun to use so-called Big Data (that is data culled from a search engine like Google and social media data sources such as Facebook and Twitter and other sources such as Wikipedia) to try to predict election outcomes. In this paper we use internet Big Data within a Topic Retrieved, Uncovered and Structurally Tested (TRUST) framework (see Mao (2016)) to predict the 2015 UK general election. This approach essentially combines the use of internet data with the kind of dynamic modelling that has been used to improve the forecasts of exchange rates, noted above, and other economic variables. The three forecasts contained in this paper are ‘real time’ and were conducted as the election evolved and the outcome of the first two forecasts were reported on BBC Scotland’s ‘Scotland 2015’ on April 28 and May 6, 2015. The first forecast was based on data spanning the post 2010 General Election and up to March 26 2015 (weekly data). We label this the pre-campaign period forecast (reported on April 28). The official campaign period runs from March 26 up to Election day and in this period we constructed two sets of forecasts, one using data up to the weekend prior to the General Election and the other using data up to two days before the election. In sum, our results reveal that Big Data has a significant effect on voting intention and we are able to provide good predictions of the election outcomes for the various parties. For example, in the Scottish context we find evidence of a ‘referendum effect’, which has a significantly negative effect on those intending to vote Labour and a significantly positive effect for the SNP. Our methods also facilitate finding what we refer to as ‘own’ and ‘cross’ momentum effects. The own effects simply indicate that a one per cent increase in voter intention for one party may cause a more than proportionate share in the vote for that party over a given period. The cross momentum effects may be interpreted as a form of

3
tactical voting. Given our methods can be applied real time as an election process develops (which was the case in our analysis), the estimation of these effects may be useful for political party strategists trying to improve their respective party’s share of the vote as the election period evolves. Our statistical modelling framework also facilitates the calculation of ‘real time’ forecasts for the each of the parties for both the overall UK and Scottish results. In the Scottish case we were able to predict that the Labour party would face an almost wipe out of its Westminster seats using data only from the pre official campaign period. Also of considerable interest during that period is that Labour in Scotland had significant own and cross momentum effects which had they been exploited could have had a dramatic effect on the party’s vote share. Indeed, by focussing on a narrow range of topics than was the case, and particularly addressing the ‘referendum effect’, the outcome for Labour in Scotland could have been very different. However, we find that on moving into the official campaign period that these momentum effects for Labour had disappeared and the die was cast for an almost complete wipe of out of Labour seats at that time. In the broader UK context the results for the pre official campaign show that the Labour party were ahead in the polls and that all parties exhibited momentum effects, but particularly so the Conservative party. However, in terms of our first set of forecasts using only the official campaign data (constructed the weekend before the election) the Conservative party had moved ahead of Labour with vote share of 34.2% Vs. 32.2% and a seat range of 263-310 Vs. 248-300 and the momentum indicators led us to predict presciently that: ‘they [the Conservatives] are the main party most likely to move the vote share in the final stages of the campaign’. This prediction was borne out by our final set of projections calculated using official campaign data up to two days before the election. This predicted that the Conservatives mean share of seats of 318, with a seat range of 306-331, the upper value being one short of the actual election outcome. The social media component of our analysis also demonstrated that the Conservative tactic of repeating the possibility of an SNP-Labour coalition had worked and had a significantly negative influence on the Labour vote. The rest of the paper has the following structure. In the next section we provide a brief survey of related literature including our own attempts to forecast the Scottish independence referendum in 2015 (MacDonald and Mao, 2015). We then outline our methodology for predicting the 2015 UK general election and the results for each of the three periods. In closing we provide suggestions as to how this line of work may be developed in the future. 2. Literature Review 2.1 Election Prediction with Polls For some time now, the prediction of British elections has been based on two key methods: opinion polls and statistical models. Ever since Gallup predicted the results of the 1936 US Presidential election, pollsters have gained respectability and polls have become a worldwide standard for forecasting elections. In the UK, many elections have been predicted using polling vote intentions, with questions, such as “If the general election were held tomorrow, which party would you vote

4
for?” (Gibson and Lewis-Beck, 2011). While the polls provide the most constant information to gauge public opinions and intentions of potential voters, their accuracy of measuring voting results is questionable. First of all, it is difficult to control for errors between the voters’ intention and their final behaviour. Many studies, most notably Perry (1960, 1979), find that many respondents say they will vote but do not actually do so in the end. On the other hand, Rogers and Aida (2012) showed that some respondents intending not to cast their vote actually did so. It is for this reason that many economists tend to distrust polls and surveys, because in non-market decision-making, such as in surveys and polls, what people say is often different to how they actually behave. Second, many researchers, including MacDonald and Mao (2015), have observed that there often exists a large disparity between polls for the same election due to issues with respect to the polling samples or methods used. Third, as Morwitz and Pluzinski (1996) show, polls are subject to bias that influences voters’ final decisions and hence their final election results. In summary, although traditional polls still provide important information about voters’ reported voting intentions, they may generate biases and therefore may not yield reliable election predications (Rogers and Aida, 2012). The purpose of this paper is to establish if we can improve on polling results by using alternative methods to increase the forecasting accuracy of polling data. 2.2 Election Prediction with Fundamental Models The unsatisfactory performances of polls, has led political scientists to supplement polling data with fundamental factors suggested by economic, political, and sociological theories, along with various relatively sophisticated statistical methods. In terms of the latter, popular functional forms are used with the percentage of party support registered in a public opinion poll as the main dependent variable (Lewis-Beck, et. al., 2004). As a first attempt in this direction, Whiteley (1979) used a first-order autoregressive moving-average (ARMA) model to forecast the 1979 UK general election with monthly frequency polling data over the period 1951 and 1974. Although he failed to forecast the Conservative victory in 1979, other political scientists, notably Sanders (1991, 1993, 1995 and 1996) and Clarke and Stewart (1994), have continued to consider fundamental variables (i.e., various economic, political and social factors) and used more sophisticated time series models for forecasting, such as vector autoregressive (VAR) models. Over the past decade, various forms of fundamental models have become the standard toolkits for many political scientists for their UK election predictions (Lebo and Norpoth, 2007, Lewis-Beck, 2005, Nadeau et al., 2009, Norpoth, 2004, Sanders, 2005, and Whiteley, 2008). To predict the 2010 UK general election, modellers found new ways of dealing with the issue of the discrepancy between the shares of the national vote and the number of parliamentary seats. One approach, led by Fischer et al. (2011) and Lewis-Beck et al. (2011), adopts

5
advanced techniques to forecast voter intentions and, given these, calculates the actual seat numbers using vote share estimation. The second group focused on modelling and predicting seats directly (Whiteley et al. 2011, and Lebo and H. Norpoth, 2011). While modellers have made great progress in producing improved election forecasts – using sophisticated modelling techniques and accounting for economic, political, and sociological theories - there remains an imprecision in election forecasting that could potentially be addressed. For example, Sanders (1995) raised the issue of variable selection and model specification: while including lots of fundamental variables at the same time avoids the information omission problem, it can create an information redundancy issue in modelling and forecasting. This issue – of choosing key factors and identifying proper key relationships between fundamental factors and votes - remains unresolved. Another issue that fundamental modellers have failed to account for is the rising influence of the Internet on voters’ behaviour and election results. There have been continuous discussions in terms of the scope of internet influence on the past few UK general elections,3 given the rapid expansion of Internet data. Generally speaking, in the UK the percentage of households with Internet access increased from 9% to 83% between 1998 and 2013 (ONS, 2013) and more than 73% of UK voters use the internet daily, for activities like reading and downloading online news, Google searching, social networking, with Facebook and Twitter, and consulting Wikis, which generates a large amount of unstructured information, that we label Internet Big Data. However, traditional political modellers are silent on the issue of the influence of Internet Big Data influence, perhaps because they lack the necessary toolkit to analyse such data. In summary, pollsters and modellers have played key roles in generating UK election forecasts. However, there are some issues that the two groups cannot tackle, especially the impact of internet Big Data. Innovative research is needed to provide more robust election forecasts and that is the purpose of this paper. 2.3 Election Forecasts with Internet Big Data Social Scientists have for some time noticed the potential influence of media information on voters’ behaviour; see, for example, Bray and Kreps (1987) and Chiang and Knight (2011). The latter, for example, documented that traditional media information from newspapers, polls, and television could have persuasive, confirmative, or no effects on political behaviour. With the extensive development of the Internet, potential voters are ever more dependent on internet digital media, such as Facebook, Google, Twitter, and Wikipedia, for political information (ONS, 2013) and as a result election forecasting with Internet Big Data has begun to be explored by some political scientists. Accordingly, in the succeeding sub-sections we review the related forecasts with data from social media, Google and other Internet sources, that
3 One of the recent arguments has been documented at http://www.channel4.com/news/social-media-general-election-2015-youtube-facebook-twitter

6
provides some background for the TRUST framework we adopt for our real time 2015 UK general election predictions. 2.3.1 Practices of Social-Media-Only Forecasts Besides being real-time, popular and public, Twitter messages are very short (no more than 140 characters) with an average of 11 words, and are technically much easier to analyse and use for forecasting purposes than information from other Internet media. Therefore, most early Internet Big Data election forecasters used only Twitter data; see, for example, O’Connor, et al. (2010); Tumasjan et al. (2010 and 2011). O’Connor et al. (2010) provide one of the earliest studies using Twitter data as an election predictor. They first retrieve Twitter messages containing names of the 2008 US presidential candidates “Obama” and “McCain” and then apply a subjectivity lexicon from Opinion Finder to determine both a positive and a negative score for each tweet, and calculated a sentiment score based on the raw positive and negative numbers. By doing so, they created a sentiment time series to predict the 2008 US presidential election. O’Connor, et al. (2010) found that their sentiment scores were often wrong, even by simple manual inspections, and their Twitter sentiment time series were not correlated with the actual electoral polls. Tumasjan, et al. (2010 and 2011) took a less cautious approach and claimed that the distribution of tweets mentioning a party or its candidate closely follows the distribution of votes for the party, and the volume of tweets alone can predict elections. However, worldwide election predictions based on Twitter data have not produced successful forecasts.4 For example, Gayo-Avello (2011) shows that the approaches used by O’Connor, et al. (2010) and Tumasjan, et al. (2010 and 2011) cannot predict the 2008 US Presidential Election. Bermingham and Smeaton (2011) find that in trying to predict the 2011 Irish General Election Twitter sentiment data does not provide any value added over traditional polling information. Skoric et al. (2012) show that Twitter chatter is not an accurate predictor for elections in Singapore, especially at local levels. Based on analyses of various previous election predictions, Metaxas et al. (2011) concluded that election forecasts based only on Twitter data are only slightly better than a chance prediction. Even Tumasjan et al. (2012) admits that Twitter data cannot replace polls but complements them for election predictions. Despite the apparent failures of Twitter data to predict election results it has been used recently in the UK in the context of both the UK elections and the Scottish referendum. For example, a 2014 Scottish Referendum prediction, using predominantly Twitter data, was conducted by a Canadian Company, First Contact5 for the SNP. First Contact predicted that Scotland would be independent
4 The forecasts of O’Connor, et al. (2010) and Tumasjan, et al. (2010 and 2011) were conducted after the elections, which are essentially back-tests rather than forecasts. 5 Related information available at http://www.ourwindsor.ca/news-story/4868136-scotland-referendum-canadian-team-sees-yes-win-amid-large-voter-turnout/ and http://www.scotlandnow.dailyrecord.co.uk/news/secret-opinion-poll-convinced-alex-4316507

7
in September 2014 by an 8% voting margin (The actual result was that the pro-independent side lost by 10%.). Recently, Burnap et al. (2015) used Twitter data to predict the 2015 UK General Election. Although they acknowledged that their method was subject to further improvements, it is still striking that they predicted Labour would win most seats in the UK overall and the SNP would only get 9 seats in Scotland (In actuality the Conservatives gained most seats in the UK and the SNP got 56 seats). Mao (2016) listed eight reasons behind the failures of predictions based only on social media, especially Twitter:
1. Social media are in general not independent content generators and are highly dependent on traditional media.
2. Demographically, social media users are not representative of the whole voting population and their distribution is highly biased towards the younger generation.
3. There exists behavioural bias among social media users: the vocal minority versus the silent majority.
4. The usefulness and credibility of Twitter messages is questionable because they often do not follow normal writing routines and are quite hard to analyse by machine learning based natural language processing methods.
5. Furthermore, the methods used to extract Twitter volume and sentiment are quite raw and fail to consider recent developments in areas such as information retrieval, text mining and natural language processing.
6. There is a huge risk of error amplification if only one resource is used. 7. Few Twitter predictions consider fundamental factors or theory-based
models. 8. The statistical methods adopted by Twitter forecasters are quite simple,
which may not fit the data generated from social media. Although some researchers, e.g., Castillo, et al. (2011) and Sloan, et al. (2015), have tried to tackle the issues related to predictions using only Twitter data, the problems remain, which prompted Huberty (2015) to assert that social media probably will never offer a stable and unbiased predictor for election predictions. 2.3.3 Election Predictions with Google Trends Data In addition to social media data, researchers have adopted data from other internet resources, such as Google Trends data, for forecasting purposes.6 Google dominates the global online information search market with 90% of the market share (Statista, Inc., 24 Sep 2015). Based on ONS (2003), 57-58% of the UK population in the 16-24, 25-34, and 35-44 age groups, and about 46% of the older generations aged 45-64, search for information online. Therefore, Google Trends data, based on search volume of specific key words, can provide a comprehensive and unbiased sample of voters’ information interest compared to its Twitter counterpart.
6 MacDonald and Mao (2015) have provided a literature review on economic forecasting with Google Trends data.

8
Schonfeld (2008), was the first to use a Google Trends volume7 data to predict the 2008 US presidential elections using Google Trends volume, reflecting the number of search queries on the keywords of “Obama” and “McCain”. However, as Lui et al. (2011) documented, a simple Google Trends indicator, based on the search volume of candidate names, failed to be a good predictor for the US elections. In fact it provided worse results than traditional polls or tossing a coin. The prediction failure was attributable to the fact that the simple Google Trends index failed to examine the sentiment of a user’s query, i.e., “to determine the circumstances behind a user's search of the profile of a certain candidate to make a guess about that candidate's public image and why a user might be interested in the candidate.” (Lui et al. (2011)). In other words, a naïve Google Trends method failed to provide theory-based fundamental factors behind voters’ behaviour. Chen et al. (2012) tried several machine learning techniques to predict the 2010 US presidential election with Google Trends data. However, without giving explanations, they selected topics from manually chosen areas that they thought voters might be interested in. They ended up with 21 relevant indicators that made their predictions hard to conduct. Indeed, their prediction error was larger than 10%. MacDonald and Mao (2015) provide a rare success in using Google Trends data in their work on the 2014 Scottish Referendum. Their starting point was a rigid text mining process to retrieve topics most related to the pro-independence side from tens of thousands of news reports. They found that the terms ‘SNP’ and the name of its leader Alex Salmond were the main indicators that influenced potential voters. Within a Vector Autoregressive (VAR) modelling framework, MacDonald and Mao then used search volume of the two key items to build a Google Trends indicator, together with averaged voting intention data, and predicted that the majority of Scottish voters would vote ‘No’ in the September 2015 referendum. Specifically, with information only available up until 13 September 2014, MacDonald and Mao (2015) projected that the ‘Yes’ side would get 45.0% votes which was the same as the actual outcome. There was a 90% chance that the ‘Yes’ campaign would get 44.8%- 45.2% of the votes. However, if unplanned events happened in the last few days before the referendum, we projected that that there was a 90% chance that the percentage of votes for independence was 44.6%-45.4%. In sum, MacDonald and Mao demonstrated that Google Trends data can work as a good election predictor if the search terms are chosen by rigid text mining methods and only the most relevant and significant themes are selected through statistical tests and kept for predictions. 2.3.4 Election Forecasting with Data from Various Media To avoid extensive reliance on a single Internet information source, Franch (2013) manually collected data from Facebook, Twitter, Google, and YouTube, 7 Stephens-Davidowitz (2013) provided a good example of using Google searches prior to an election as proxies of turnout rates in different parts of the United States.
9
and conducted post-mortem predictions for the 2010 UK general election with an autoregressive integrated moving average (ARIMA) model. However, his analysis is essentially based on data accumulated from counting the number of mentions of each PM candidate, which failed to generate a fundamentally meaningful or technically sound predication. Recently, Anstead and O’Loughlin (2015) analyse social media data during the 2010 UK General election as part of their public opinion studies. They count coverages of newspaper articles, television samples, and mainstream media websites mentioning both “Twitter” and “general election”, and generated 287 items. They then thematically analyse the media content with interviews of professional social media researchers, opinion pollsters and journalists. While their qualitative approach may generate good theory-based measures of public opinion, which could be useful for future election predictions, their framework failed to take account of recent developments in text mining techniques, which we think would generate more accurate content analysis results. 2.3.5 Summary After decades of using an array of different forecasting methods, it still remains difficult to forecast election outcomes. Even with recent advances, the current prediction methods using polls, fundamental models and internet Big Data predictive methods are somewhat limited. More innovative ideas are needed to provide robust and precise forecasts for elections in the digital age. 3. A TRUST Framework for Predicting the 2015 UK General Election Based on the success of predicting the 2014 Scottish referendum (MacDonald and Mao, 2015), Mao (2016) proposed an innovative analysis and prediction framework for social science researchers-a TRUST (Topic Retrieved, Uncovered and Structurally Tested) framework. This paper is the first to adopt this framework to predict a more complicated multiple-party election- the 2015 UK general election. This section illustrates the various steps in this framework for the analyses of forecasts. 3.1 Elements of a TRUST Election Prediction Framework 3.1.1 Selection of Period, Party and Area Prior to introducing the framework used for predicting the 2015 General Election, we start with a discussion of some of the underlying preparatory issues relating to our analysis and prediction, specifically the sample period, the parties, and areas we adopt for our election forecasting. We use two sample periods: a long-term low-frequency monthly study, covering the period after the 2010 General Election and up to the official campaign period of the 2015 election and a short-term high-frequency daily study covering the official campaign period, starting from 26 March 2015 until 5 May 20158. In so doing, we avoid the issue of picking the period randomly to suit our predictions. We provide predictions for the overall UK situation and for Scotland separately. For the UK, the parties considered were Labour, Conservative, Lib-Dem, UKIP and Green and for Scotland Labour, Conservative, Lib-Dem, and SNP.
8 Our predictions are based on all data public available before 5 May 2015.

10
3.1.2 Combination of Polls for Measuring Voters’ Intention Following the suggestions from Graefe, et al. (2014), we construct an equally weighted poll using the projections from mainstream pollsters as the one main variable in our system. In so doing we control for the disparity and bias among polls and reduce forecasting errors. 3.1.3 Text Mining: Topic Retrieval from Big News Text Data Benefiting from recent advances in machine learning and natural language processing, there are some advanced text mining tools available to us. This section outlines the object and tools used for our text mining tasks.
(a) Text Mining Object: Reports from All National Newspapers
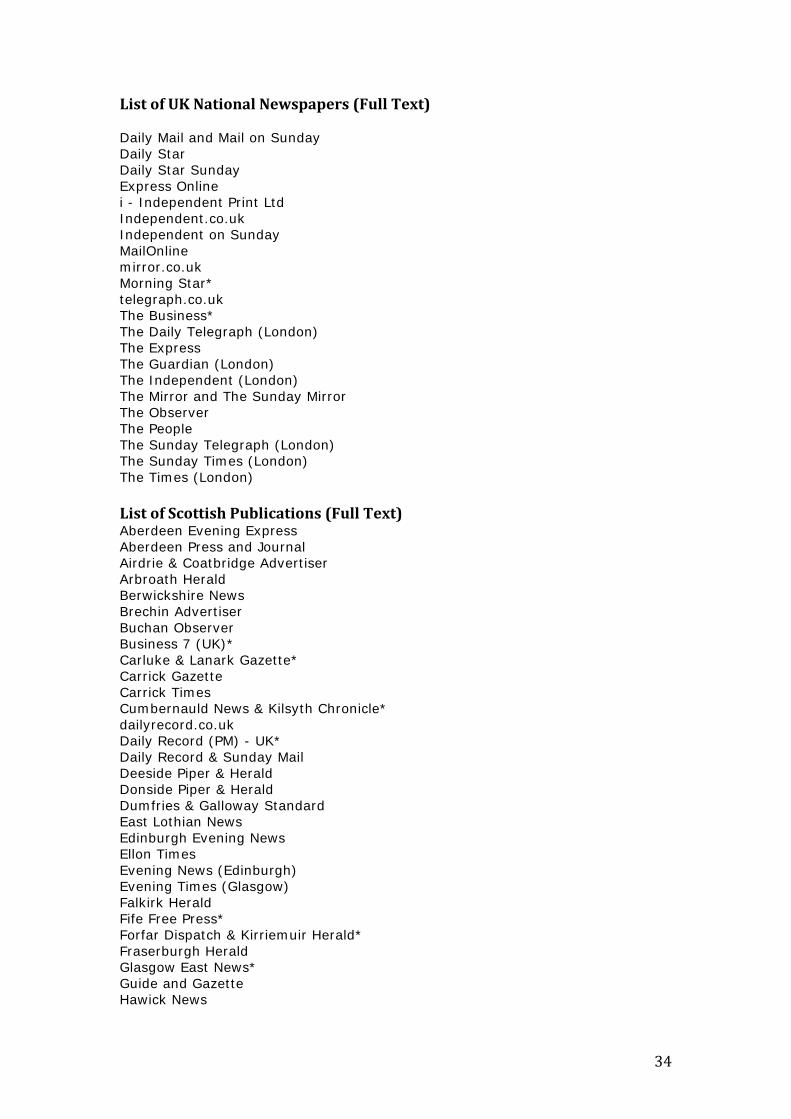
As documented in MacDonald and Mao (2015) and Mao (2016), the objects of our text mining are text files of all related reports from all national British and Scottish newspapers (see Appendix 1 for the complete list of newspapers used). We use these newspapers for the following reasons:
1. The readership of newspapers, especially their online contents9, are rising, and are now at a higher level than the ratio of social media users in the UK (ONS, 2013).
2. Newspapers and their online contents are widely read across different age groups and there is not an issue of a ‘Silent Majority’.
3. National newspapers still play the ‘newspaper of record’ role and provide more reliable and credible news than social media.
4. Newspapers are the main content creators and dominate the conversation agenda of social media.
5. Media bias can be reduced by including contents of all national newspapers across the political spectrum.
6. Newspaper reports follow rigid language routines and are suitable for automatic text mining
(b) Text Mining using the Latent Dirichlet Allocation (LDA) method
Our empirical analysis starts with ‘seed words’ for the main political parties in the UK and Scotland – specifically, the names of party and its leader. We used Lexis Nexis searches applied to all national British and Scottish newspaper and generate a text file containing thousands of related reports (see appendix 1 for examples of the Seed words and the Lexis Nexis search). We then adopt the standard natural language processing tool – LDA method (Blei et al., 2003) - to retrieve 20 key words. The key words can be classified into two groups. The first group is about the basic information of a party, e.g., names of the party and its leader, and some places like London, England, etc. The second group is about the specific opinions 9 Nowadays, most national newspapers have an online version. Even if some contents are gated, readers can still read some of the reports which often contain key information.

11
of the party, which include several related themes containing economic, political and social factors that fundamental modellers may use. We only consider the second group based on the consideration of fundamental factors and related theories. By doing so, we inherit the advantages of fundamental models by considering theory-based fundamental factors, and fix one important issue facing modellers and big data forecasters - how to scientifically explore and choose only the most election-relevant topics and simplifying a high-dimensional dependency structure. 3.1.4 Uncovering Big Data Volume Indicators from Twitter, Google and Wikipedia We then construct our Big Data indicators based on the volume of Tweets, Google searches and Wikipedia page views. With the key topics explored in the news text, we find key words or hashtags used for Google Searches, Tweets and Wiki Page Views; i.e., the number of Tweets containing the key words, volume of Google searches and Wikipedia pages on the key topics, based on the following criteria. Firstly, they must have the same meaning as the key topics in the news. Secondly, they are the searches with the largest volume, which means that they interest potential voters the most. Based on search or mention volume, we can then build Big Data indicators separately, or by the weighted combination of various Internet information sources. We have reviewed the studies using Twitter and Google big data for election predictions and, as we have seen, Twitter has attracted most research attention, Google has started to be used for prediction purposes, and very little use has been made of Wikipedia data. Based on the ONS (2003) data, about 55% of British residents aged between 16 and 44 consult Wikipedia for information. And Wikipedia remains popular among older British residents aged between 45 and 64, with 42% of this age group viewing Wikipedia pages to find information they need. Therefore, like Google search data, Wikipedia page views can provide an unbiased sample of information interest to potential voters. Our research on Internet Big Data therefore also considers Wikipedia page views with respect to the key topics we retrieve through text mining as measures of information demand. Besides the importance of Wikipedia in information demand, we propose using volume data of the three Internet sources for the following reasons. First, we do not use a sentiment index because there are no common technical or theoretical grounds to measure sentiment from online social media and information demand data. Instead, we construct proper volume indicators for the three Internet information resources. Second, by considering the effects of three internet media - i.e., Twitter, Google, and Wikipedia - separately or in the form of a combination in a framework, we can address the single media sample bias issue and avoid the potential rigging effects raised by Epstein, R. and R. E. Robertson (2015). Third, we do not construct the volume indicator for News text data to avoid the problem of bias amplification.

12
3.1.5 VAR methodology for Structural Tests and Forecasts In line with MacDonald and Mao (2015), we adopt the popular vector autoregressive (VAR) methodology for our structural tests and forecasts. The VAR permits the structural testing of the significance of the effects of Big Data indicators, and facilitates the deletion of the insignificant effects in real time to further simplify the dependency structure. It also facilitates capturing momentum effects (discussed below) and unravelling the relationship between different variables, such as the potential swing ratio between parties, and the influence of fundamental Big Data topics on voting intention, etc. Hence, in the spirit of the modelling approach, we can provide a mainstream statistical analysis and prediction that many Big Data forecasters fail to do, and gives robust forecasts with real-time consideration of unpredicted events.
4. The Pre-Campaign Results In this section we provide our results based on the TRUST framework for the 2015 General Election based on data from May 2010 up to the start of the Official Campaign in March 2015. 4. a. Scottish Results10 In Table 1 we report the text-mined topics generated from our text-mining algorithm for the main Scottish parties over the pre official campaign period. There is clearly a similarity of issues to which voters place emphasis across the parties, with differences having an intuitive interpretation – being part of the Coalition was a clear issue for Lib Dem voters and ‘work’ for Labour voters.
10 These results and those reported in the next Section for the UK were reported on Scotland 2015 on the evening of April 28 and May 6 2015.

13
Table 1: Text Mined Topics on Main Scottish Parties between May 2010 and March 2015
Scottish Parties Key Words and Topics
Conservative Tax, Scottish, Independence, Referendum Labour Tax, Scottish, Independence, Work Lib Dems Tax, Coalition, Government, Scottish, Referendum, Independence SNP Scottish, Referendum, Independence, EU, Tax Summary of Topics Coalition Government, Tax, Scottish Independence, Scottish Referendum
Having defined the relevant key terms for the different political parties we can now analyse the effects they have on voters’ voting intentions for the General Election. We used three Internet Big Data sets for this analysis: Twitter, Wikipedia and Google. Our statistical analysis is undertaken using the well-known Vector Autoregressive (VAR) model in which we capture the factors influencing voting intention for the general election and in which the factors or variables appear with 3 lagged values (i.e. up to 3 weeks previously). The voting intention data is taken directly from yougov.co.uk, which provides daily updates of voting intention on the main Scottish parties.
The results from the VAR exercise are summarised in Table 2 where the cells denote a statistically significant effect (at the 5% level) over the last 3 weeks on the terms listed in column 1. So, for example, if over the last three weeks there is a 1 per cent increase in those considering voting Labour a further 0.78% vote for labour accrues. Similarly, a 1 per cent increase in those intending to vote Lib Dem results in a further 0.49 per cent voting Lib Dem. We refer to these effects as ‘own momentum’ effects.
Furthermore, we find that a one per cent increase in those intending to vote Conservative this leads to a 0.11 per cent increase in votes for Labour and a 0.11 decrease in votes for the SNP. Strikingly, a 1 per cent increase in those intending voting Lib Dem leads to a 0.33 percent increase in the Labour vote in addition to a 0.49 per cent increase in the Lib Dem vote. We classify these effects as ‘cross momentum’ effects and can be thought of as picking up tactical voting effects.. The results demonstrate that in the pre-campaign period the Labour party in Scotland was the only party that could benefit from tactical voting so there could clearly be a decisive shift to Labour if such tactical voting occurred on polling day.
A second striking result from the results reported in Table 1 is that there appears to be no negative spillover from increased votes for the SNP to Labour: a 1 percent increase in those intending voting SNP over the past three weeks leads to a further 0.43 percent increase in votes for the SNP and a positive but significant effect on Labour of 0.07 percent.

14
We find that the Google search volume of key topics11 produces statistically significant effects for three terms: ‘Scottish Independence Referendum’, ‘Coalition Government’ and ‘Tax’. Interestingly, we find that there are no significant effects from Twitter and Wikipedia for this long-term analysis (although the information from these data sources may be more appropriate for the high frequency data sets reported below). Note that the Scottish Independence referendum has a continuing negative effect in this period on Scottish Labour and a positive effect on the SNP. The Coalition Government term has a significantly positive effect on both Labour and the SNP and this, plus taxation, has a significantly negative effect on Conservative party voting intention. It is interesting to note that the Coalition Government and the Tax policy terms do not appear to have harmed the Lib Dems.
In order to gain further insight into the effects of the Scottish independence referendum we introduced a shift term into our model. This shift term is designed to determine if the Scottish referendum led to a regime change in Scottish Politics. The results are contained in the last row of Table 2 and show that the referendum had a very significant and permanent effect on the voting intentions for the Conservative, Labour and SNP parties. For the former two parties, the referendum had a large and significant negative effect (Con -2.07%, Lab -2.24%) and for the SNP a large significantly positive effect of 4.08%. The key message that the Unionist parties could have drawn from these results, had they been using them ‘real time’ would have been to significantly improve their outcomes they have to address the key reason(s) for this regime change.
Table 2: Factors Influencing Potential Votes of Main Scottish Parties, 2011-2015 (Google)
Conservatives Labour Lib Dems SNP
Conservatives Voting Intention 0.11 -0.11 Labour Voting Intention -0.21 0.78 -0.27 Lib Dems Voting Intention -0.2 0.33 0.49 -0.51 SNP Voting Intention -0.2 0.07 -0.1 0.43 Scottish Independence Referendum (G) -0.02 0.03 Coalition Government (G) -0.06 0.07 0.04 Tax (G) -0.03 0.01 0.04 Scottish Independence Referendum Shift -2.07 -2.24 4.08
11 During the pre-campaign period in Scotland and UK, we find no significant effects from social media data; therefore we focus on the effects from big information demand measured by Google search volume.

15
Using the VAR model underlying the results reported in Table 2 we then made projections of the vote shares for the main Scottish parties and these are recorded in Table 3. The first row of this Table shows the mean vote shares predicted from the model, the second row the mean share with a one standard error band and the rate range under uncertainty row shows the mean value with the standard error band and allowance for parameter uncertainty in the VAR model. The seat range numbers in the last row are based on the rate range under uncertainty row numbers. Table 3: Projecting Results for Main Scottish Parties
Conservatives Labour Lib Dems SNP Mean Rate 14.73% 32.14% 4.85% 43.8% Rate Range 12.81-16.65% 29.42-34.86% 4.57-6.13% 41.19-46.41% Rate Range Under Uncertainty 11.09-17.37% 29.06-35.22% 4.43-6.27% 40.88-46.72% Seat Range 0-1 3-9 0-1 50-56
Note: Ranges are within 95% confidence intervals. Table 3 shows a voting pattern which was widely, although not universally, predicted at the time that the SNP were going to created a dramatic turnaround in Scottish politics. 4b Overall UK results. The key words for the overall UK results in the pre-campaign period were extracted in the same way as the Scottish results and are reported below in Table 4. We note that compared to the corresponding table for the Scottish parties, there are a broader range of keywords relevant in the UK wide case. While IndyRef-related issues seem to dominate the main Scottish parties for the whole period, EU, economics and health were the focus of Con, Lab and Lib in the UK. UKIP-related topics on European immigration and Green-related topics on climate change, also figure in the Table of keywords. In our analysis of the data Big data sets for the UK we used the word ‘austerity’ to represent both ‘spending’ and ‘cuts’. Table 4: Text Mined Topics on the UK Parties between May 2010 and March 2015 UK Parties Key Words and Topics Conservative Tax, EU, Spending, Cuts, NHS Labour Tax, Economy, Business, NHS, Spending,
Cuts, EU Lib Dems Coalition, Government, Tax, NHS, Cuts UKIP EU, European, Immigration, Referendum Green Energy, Climate Change Topic Summary Austerity, Climate Change, Coalition
Government , EU Immigration, EU Referendum, NHS, Tax

16
Having defined the relevant key terms for the different UK political parties we go on to analyse the effects they have on voters’ voting intentions for the General Election. Again, we used three Internet Big Data sets for this analysis: Twitter, Wikipedia and Google and our statistical analysis is again undertaken using a Vector Autoregressive (VAR) model in which we capture the factors influencing voting intention for the general election and in which the factors or variables appear with 3 lagged values (i.e. up to 3 weeks previously). The values of the voting intention variables are the monthly average of the specific intention data from ComRes, ICM, Ipsos-Mori, and YouGov.
The results from the VAR exercise are summarised in Table 5 where the cells denote a statistically significant effect (at the 5% level) over the last 3 weeks for the parties labelled in the head of the columns. So, for example, column 2 labelled ‘Conservative’ shows voting intentions in the pre-campaign period for the Conservatives. Looking at rows 2-6 we see ‘own’ and ‘cross’ momentum effects the latter indicative of tactical voting. So in terms of the momentum effects, the first cell in the Conservative column indicates that if there is an increased one per cent intention by Conservatives voters to vote Conservative this will have an extra 0.77 per cent effect due to the lagged effects of this intention (so total effect 1.77%).
Reading across the other cells in row 2 we note that the one per cent increased intention to vote Conservative has a negative cumulative effect on the other parties. Returning to the Conservative column, a one per cent increased intention to vote Lib Dem does not have a significant cumulative effect on the Lib Dems but has a positive cumulative impact on the Conservative vote of 0.88%. There does not appear to be any tactical voting from UKIP towards the Conservative party and vice versa.
Rows 7-10 of Table 5 show the significant factors from the Google searches influencing party performances during the period (Austerity, Tax, to capture economic elements, Climate Change for environmental issues, NHS for health issues, EU Immigration and Referendum for immigration issues, and Coalition Government for general issues.) Environmental issues have a positive effect on both Conservative and Green votes, while tax policy improved the vote for both Labour and UKIP and UKIP’s vote is also significantly improved by EU immigration and referendum issues. NHS proves the dominant significant effect for the Lib Dems.

17
Table 5: Monthly VAR(3) Analysis of Tactical Voting and Influential Factors, June 2010- March 2015 (Google) UK
Conservatives Labour Lib Dems
UKIP Green
Conservatives Voting Intention 0.77 -0.25 -0.66 -0.9 Labour Voting Intention 0.05 0.67 -0.78 -0.33 Lib Dems Voting Intention 0.88 -0.41 UKIP Voting Intention -0.19 -0.65 0.26 Green Party Voting Intention 0.93 -0.75 -1.15 0.84 Austerity (G) -0.03 -0.06 -0.01 Tax (G) -0.06 0.07 -0.11 0.04 Climate Change (G) 0.03 0.01 NHS (G) -0.1 0.16 -0.09 EU Immigration & Referendum (G)
-0.04 -0.02 -0.44 0.04
Coalition Government (G) -0.03 -0.06 Using the VAR model identified under Step 2 for the UK parties we make a projection of the vote shares for each of the main UK parties and these are recorded in Table 6. The first row of this Table shows the mean vote shares predicted from the model, the second row the mean share with a one standard error band and the rate range under uncertainty row shows the mean value with the standard error band and allowance for parameter uncertainty in the VAR model. The seat range numbers in the last row are based on the rate range under uncertainty row numbers.
Table 6: Projecting Results for Main UK Parties
Conservatives Labour Lib Dems UKIP Green Mean Rate 32.01% 34.69% 8.17% 11.05% 5.69% Rate Range 29.9-34.12% 32.49-
36.89% 6.82-9.52% 8.73-13.33% 4.5-6.87%
Rate Range Under Uncertainty 29.16-34.86% 32.33-37.05%
6.54-9.8% 7.84-14.26% 4.24-7.14%
Seat Range 260-289 269-297 14-20 0-2 0-1 Note: Ranges are within 95% confidence intervals.
At this stage of the campaign – i.e. the official campaign - the Labour party was the dominant party and if results had stayed this way then they would have been able to form either a minority government, with the support of the SNP or a coalition government given the seat numbers the SNP got on polling day.

18
5. Official Campaign Period – March 30 to May 6. The Official Campaign (OC) period started on March 30 up to May 6 2015. During this period we ran a set of forecasts using data available the weekend before the general election (up to May 1) and these results are summarised in Section 5.1 and 5.2 and these results were reported on BBC Scotland’s ‘Scotland 2015’ on the night before the election (May 6). A final set of forecasts was produced using data collected up to two days before the general election and these results are contained in Section 6. 5.1 Scottish Result As we move into the higher frequency official campaign period the key words that our programming method extracts from the Nexis data base, reported in Table 7, change and there is also a larger range of relevant keywords. The key words for the OC period are (the additions from the pre-campaign period are given in bold) Austerity, Coalition Government, Full Fiscal Autonomy, NHS, Scottish Independence and Referendum, Tax, Tactical Voting, Trident. We then uncover the Internet Big Data indicators on the above themes based on their volume of Google searches, tweets and Wiki page views, and report them in Table 812. Table 7: Text Mined Topics on Main Scottish Parties during the Official Campaign Period Conservatives Labour Lib Dems SNP 29 Mar-4 Apr 2015
Tax, Spending, Jobs, NHS
Tax, Business Tax, NHS Tax, Austerity, Referendum, NHS, Spending
5 Apr-11 Apr 2015
Tax, Referendum, Cuts, Spending
Tax, Spending, Trident
Tax, Coalition, Government
Tax, Full Fiscal Autonomy, Referendum, Independence, Spending, Trident
12 Apr-18 Apr 2015
Tax, Spending, Cuts
Tax, Cuts, Spending, Trident
Tax, Coalition, Government
Tax, Austerity, Full Fiscal Autonomy, NHS, Spending, Cuts
19 Apr-27 Apr 2015
Cuts Tactical, Vote, Referendum
NHS Tax, Independence, Referendum, Spending
Summary Tax, Spending, Cuts, Jobs, NHS, Referendum
Tax, Spending, Cuts, Tactical Vote, Trident, Referendum
Tax, Coalition, Government, NHS
Spending, Tax, Austerity, Full Fiscal Autonomy, NHS, Referendum, Independence
Proposed Topics
Austerity, Coalition Government, Full Fiscal Autonomy, NHS, Scottish Independence and Referendum, Tax, Tactical Voting, Trident
Re Note: We use Austerity to represent key topics of Austerity and Spending Cuts.
12 During the official campaign period in Scotland and the UK, we still do not find lasting significant effects from the social media data. Instead, information demand volume of Google searches and Wikipedia page views of related key words are found to be influential. Therefore in the following sections, we use mean weighted Average of Google Trends, and Wikipedia page views to measure the Big Data impact on potential votes.

19
Table 8: Key Words or Hashtags Used for Google Searches, Tweets and Wiki Page Views. Topic Google Tweet Wikipedia Austerity Austerity UK Austerity United Kingdom Government
Austerity Programme Tax Tax Scotland Tax Taxation in the United Kingdom Full Fiscal Autonomy Devolution Full Fiscal
Autonomy Full Fiscal Autonomy for Scotland
NHS NHS #NHS National Health Service Trident Trident Trident UK Trident Programme Scottish Independence and Referendum
Scottish Independence, Scottish Independence
#indyref, #IndyRef2
Scottish Independence Referendum, 2014
Tactical Voting Tactical Voting #SNPout Tactical Voting Notes: The Google search volume is based on Google Trends via google.com/trends; The Tweet volume is obtained from Topsy Lobs, Inc. via topsy.com/tweets; The Wikipedia page views are based on WikiMedia Analytics via http://stats.grok.se/ In summary, and in contrast to the pre-official campaign period we find that austerity, full fiscal autonomy, NHS, tactical voting, and trident become important topics in this first phase of the official campaign (OC) period. The UK results for our VAR based model are reported in Table 9. In the pre OC data period (Table 3) we recall that there was a substantial ‘own momentum effect’ for Scottish Labour; that is, if a one per cent improvement in voting intention for Labour could be engineered this would lead to a further 0.8 per cent change in Labour’s favour. Similar but smaller momentum effects (about half of that for Labour) also existed for both the Lib Dems and the SNP. If the parties had been able to exploit such momentum effects they could have changed their vote share significantly (clearly a factor which would have been of most import to Labour). In the OC period, however, such beneficial momentum effects disappear for all three parties and it would seem therefore that neither Labour nor the Lib Dems were able to exploit such momentum effects to increase their share of the vote.

20
Table 9: Factors Influencing Potential Votes of Main Scottish Parties, March-April 2015
Conservatives Labour Lib Dems SNP
Conservatives Voting Intention 0.29 Labour Voting Intention 0.44 Lib Dems Voting Intention SNP Voting Intention 0.29 Austerity -0.05 0.05 0.08 -0.05 Tax -0.06 0.08 -0.16 Full Fiscal Autonomy -0.06 NHS 0.1 -0.14 Trident -0.04 Scottish Independence Referendum 0.11 Tactical Voting -0.07 0.03 0.12
In our initial pre OC results there was also clear and significant evidence that Labour could gain from tactical voting from the three other parties considered. However, we do not find any evidence for this in the OC period, which again could explain the fall in their share of the vote. The only evidence of potential tactical voting that we do observe in the OC period is that from intended SNP voters towards the Conservatives and vice versa (the 0.29 cells in Table 9). In the pre OC period our Internet Big Data indicated that the Indy ref event was THE factor that explains the large wedge that separates the voting shares of Scottish Labour and the SNP. Specifically, we found that this caused a 6% permanent shift in the vote away from Labour towards the SNP and that this also had a trending component that cumulated into a very large effect as we move towards election day. Interestingly, this effect still appears significantly in the OC results and there are doubtless many and various interpretations for this effect, such as: a disillusionment with Westminster/Metropolitan politics; the potential toxicity of the Conservative brand in Scotland on Scottish Labour through working as part of Better Together. Whatever the interpretation is, however, it is clear that neither Labour nor any of the other Unionist parties have been able to overturn this Indy ref effect and it is still evidenced in our OC data (the + 0.11 cell in the SNP column of Table 9). To set against the Indy Ref effect our Big Data analysis also indicates that other factors/ searches have had a significant effect on vote shares although they appear not to have been enough to overturn the trend in favour of the SNP and away from Labour. For example, Scottish Labour repeatedly raised the issue of the potential costs of full fiscal autonomy during the pre election period, and this has had a significantly negative effect on the voting share for the SNP (the -0.06

21
in Table 9) as have austerity searches and searches on the tax term. For Labour the issue of tax harmed their vote share whilst Conservative austerity policies boosted its share. In the case of the Lib Dems, austerity and tax issues had a positive impact on their voting share while, NHS and Trident reduced their share. For the Conservative party, their austerity policies have a significantly negative effect on their vote share, but such is the momentum in favour of the SNP it has been unable to change the lead that the SNP has. In Table 10 we present the comparable set of results to Table 6 for the official campaign (OC) period. So for the OC period we we found that the SNP share of the vote increased to 49% (Mean seats 54, mean seat range 51-57), Labour dropped to 24%, (mean 3, seat range 0-6), the Conservatives are on 17% (0 or 1 seat) and Lib Dems 6% (0 or 1 seat). Table 10: Projecting Results for Main Scottish Parties
Conservatives Labour Lib Dems SNP Mean Rate 16.67% 23.99% 6.24% 48.83% Rate Range 11-22.3% 18.75-29.22% 1.42-11.07% 43.95-53.71% Seat Range 0-1 0-6 0-1 51-57
Compared to Table 3 both the SNP and Conservatives mean share of the vote increased further, whilst that of Labour and the Lib Dems has gone down. It is also noteworthy that the seat range number indicate a potential total wipe out for the Labour party.
22
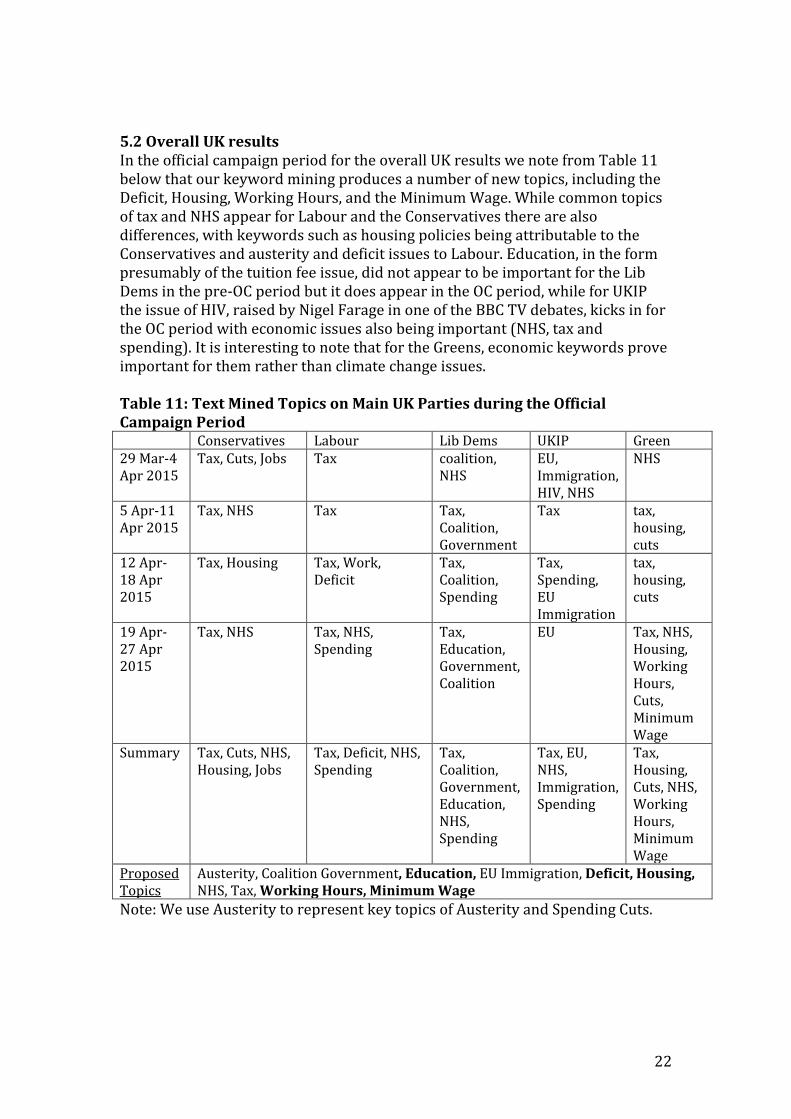
5.2 Overall UK results In the official campaign period for the overall UK results we note from Table 11 below that our keyword mining produces a number of new topics, including the Deficit, Housing, Working Hours, and the Minimum Wage. While common topics of tax and NHS appear for Labour and the Conservatives there are also differences, with keywords such as housing policies being attributable to the Conservatives and austerity and deficit issues to Labour. Education, in the form presumably of the tuition fee issue, did not appear to be important for the Lib Dems in the pre-OC period but it does appear in the OC period, while for UKIP the issue of HIV, raised by Nigel Farage in one of the BBC TV debates, kicks in for the OC period with economic issues also being important (NHS, tax and spending). It is interesting to note that for the Greens, economic keywords prove important for them rather than climate change issues. Table 11: Text Mined Topics on Main UK Parties during the Official Campaign Period Conservatives Labour Lib Dems UKIP Green 29 Mar-4 Apr 2015
Tax, Cuts, Jobs Tax coalition, NHS
EU, Immigration, HIV, NHS
NHS
5 Apr-11 Apr 2015
Tax, NHS Tax Tax, Coalition, Government
Tax tax, housing, cuts
12 Apr-18 Apr 2015
Tax, Housing Tax, Work, Deficit
Tax, Coalition, Spending
Tax, Spending, EU Immigration
tax, housing, cuts
19 Apr-27 Apr 2015
Tax, NHS Tax, NHS, Spending
Tax, Education, Government, Coalition
EU Tax, NHS, Housing, Working Hours, Cuts, Minimum Wage
Summary Tax, Cuts, NHS, Housing, Jobs
Tax, Deficit, NHS, Spending
Tax, Coalition, Government, Education, NHS, Spending
Tax, EU, NHS, Immigration, Spending
Tax, Housing, Cuts, NHS, Working Hours, Minimum Wage
Proposed Topics
Austerity, Coalition Government, Education, EU Immigration, Deficit, Housing, NHS, Tax, Working Hours, Minimum Wage
Note: We use Austerity to represent key topics of Austerity and Spending Cuts.

23
Momentum effects and Tactical voting in the UK context are captured by rows 2-6 of Table 12. In summary, and in contrast to the Scottish results, we find strong momentum effects for all parties in the official campaign period and particularly so for the Conservatives (1.78 compared to 1.46 for Labour and 1.58 for the Lib Dems). This combined with our tactical voting results demonstrated that the Conservatives were clearly the only national party to have potential to attract more votes from other parties, and suggested that they are the main party most likely to move the vote share in the final stages of the campaign (a real time prediction borne out by our final set of results reported below). The effects of the Big Data keywords on vote shares are contained in rows 7-10 of Table 12. In summary, we found, first, that an important range of factors - the deficit, minimum wage, working hours and education - had no effects on any party; similar to the UK LT results, EU immigration is still important for the UKIP vote and health policy still is significant for the Lib Dems, with housing policy being significantly important for Labour. Interestingly, the austerity issue damaged the Conservative vote but only by a very small percentage. Table 12. Factors Influencing Potential Votes of Main UK Parties, 26 March-1 May 2015
Conservatives Labour Lib Dems
UKIP Green
Conservatives Voting Intention
0.78 0.58 -0.43 -0.04
Labour Voting Intention 0.18 0.46 Lib Dems Voting Intention 0.58 UKIP Voting Intention 0.16 -0.15 -0.27 1.02 Green Voting Intention -0.26 0.16 0.64 Austerity -0.005 0.005 Deficit Housing 0.01 -0.01 Minimum Wage Tax Working Hours NHS -0.02 0.02 EU Immigration -0.02 0.003 Education
Note: The values of voting intention variables are the daily average of specific intention data from ComRes, ICM, Ipsos-Mori, and YouGov; The analysis only consider the Google search volume and Wiki page views of the key topics as Twitter did not convey trending information; only significant coefficients with p<0.05 are shown in the table.

24
Table 13. Key Topic Words Used for Google Searches, Wiki Page Views. Topic Google Wikipedia Austerity Austerity United Kingdom Government
Austerity Programme Deficit Deficit Government Budget Deficit Housing Housing Affordability of housing in the
United Kingdom Minimum Wage Minimum Wage Minimum Wage Tax Tax Taxation in the United
Kingdom Working Hours Working Hours Working Time NHS NHS National Health Service EU Immigration Immigration Modern immigration to the
United Kingdom Education Education Education in the United
Kingdom Note: We do not consider Tweets because the volume of tweets is found to be insignificantly related to the voting intentions.
For the OC period up to the weekend of May 2 2015 we calculated the vote shares recorded in Table 14. These results calculated using data up to the May 1 and reported on the BBC’s Scotland 2015 programme show the Conservatives with a clear lead over the Labour party and with seat ranges that dominate the Labour party. These results essentially pick up the momentum effects and tactical voting effects in favour of the Conservatives reported in Table 5 and explain why they were leading Labour in the OC campaign period (Table 14) compared to the pre-campaign period (Table 6). Interestingly, on the more optimistic projections for the Conservatives and Lib Dems, estimated one week before the election, this could produce a workable majority (i.e above 323 seats), whereas by this stage a Lab Lib Dem coalition would not.
Table 14. Projecting Results for Main UK Parties
Conservatives Labour Lib Dems UKIP Green Mean Rate 34.4% 32.2% 8.0% 13.5% 5.9% Rate Range 32.9-35.9% 30.2-34.2% 6.8-9.2% 11.3-15.7% 5.4-6.4% Mean Seats 285 274 14 1 1 Seat Range
263-310 248-300 11-17 0-2 0-1
Note: Ranges are based on 95% confidence intervals.

25
6. Final General Election Forecasts, updated using data up to and including May 5 2015. In our final predictions for the May General Election we used data during the official campaign up to and including May 5 2015. The text mined topics that appear significant are reported in Table 15 and one key topic emerges, namely the SNP term and this presumably relates to the effectiveness of the Conservative advertising campaign regarding the possibility of a SNP/ Labour coalition post election. Also the ‘Economy’ emerged in the last few days of the of the OC campaign as being important for the Conservatives. Either this was due to voters’ uncertainty about the economy given the unclear political prospects after the election, or the Conservative Party’s emphasis on their economic achievements. Interestingly, in this final period the Greens core policies on climate change and the environment become important, although not before. Table 15: Text Mined Topics on Main UK Parties during the Official Campaign Period Conservatives Labour Lib Dems UKIP Green 29 Mar-4 Apr 2015
Tax, Cuts, Jobs, SNP
Tax, SNP Coalition, NHS EU, Immigration, HIV, NHS
NHS
5 Apr-11 Apr 2015
Tax, NHS, SNP Tax, SNP Tax, Coalition, Government, SNP
Tax, SNP tax, housing, cuts
12 Apr-18 Apr 2015
Tax, Housing, SNP
Tax, Work, Deficit, SNP
Tax, Coalition, Spending, SNP
Tax, EU, Spending, Immigration, SNP
tax, housing, cuts
19 Apr-27 Apr 2015
Tax, NHS, SNP Tax, NHS, Spending, SNP
Tax, Education, Government, Coalition, SNP
EU, SNP Tax, NHS, Housing, Working Hours, Cuts, Minimum Wage
28 Apr-6 May 2015
Tax, Cuts, Economy, SNP
Tax, SNP, NHS Cuts, SNP, Referendum
Immigration, SNP, NHS
Climate, Change, Energy, Environment
Summary Tax, Cuts, NHS, Housing, Jobs, Economy, SNP
Tax, Deficit, NHS, Spending, SNP
Tax, Coalition, Government, Education, NHS, Spending, SNP
Tax, EU, NHS, Immigration, Spending, SNP
Climate, Change, Energy, Environment, Tax, Housing, Cuts, NHS, Working Hours, Minimum Wage
Proposed Topics
Austerity, Coalition Government, Climate Change, Education, EU Immigration, Deficit, Housing, NHS, Tax, Working Hours, Minimum Wage, SNP, Economy
Note: We use Austerity to represent key topics of Austerity and Spending Cuts.

26
Table 16. Key Topic Words Used for Google Searches, Wiki Page Views. Topic Google Wikipedia Austerity Austerity United Kingdom Government
Austerity Programme Deficit Deficit Government Budget Deficit Housing Housing Affordability of housing in the
United Kingdom Minimum Wage Minimum Wage Minimum Wage Tax Tax Taxation in the United
Kingdom Working Hours Working Hours Working Time NHS NHS National Health Service EU Immigration Immigration Modern immigration to the
United Kingdom Education Education Education in the United
Kingdom Climate change Climate change Climate change in the United
Kingdom SNP SNP Scottish National Party Economy UK Economy Economy of the United
Kingdom Note: We did not consider Tweets because the volume of tweets are found to be insignificantly related to the voting intentions Table 17 contains our results for the factors influencing potential votes in this final period of the campaign and confirms that the Conservative party did not win from campaigning on daily issues mattering to voters, but as the only main UK party to attract voters from other parties, from the tactical voting from the UKIP and Labour as predicted in our results of May 2. We also note that the significance of immigration for UKIP support disappeared in this final phase and swing voters tended to vote for the Conservatives. The switch from Labour to the Conservative party, sustained for the whole period, seems to have been driven out of fear for some form of SNP-Labour coalition. For example, the -0.01 cell of the ‘Labour Column’ in Table 17 shows that the Big Data information interest on ‘SNP’ has had a significant negative effect on the vote for UK Labour during the period. While the general economic factors did not influence the performance of the Tories, the Green party seemed to enjoy positive effects (0.01) from the environmental issue. However, the later topic came too late to gain the Greens a second seat.

27
Table 17. Factors Influencing Potential Votes of Main UK Parties, 26 March-5 May 2015
Conservatives Labour Lib Dems
UKIP Green
Conservatives Voting Intention
0.71
Labour Voting Intention 0.2 0.81 Lib Dems Voting Intention 0.67 UKIP Voting Intention 0.27 0.9 Green Voting Intention 0.65 SNP -0.01 Economy Climate Change 0.01 Austerity Deficit Housing Minimum Wage Tax Working Hours NHS EU Immigration Education
Note: The values of voting intention variables are the daily average of specific intention data from ComRes, ICM, Ipsos-Mori, and YouGov; The analysis only consider the Google search volume and Wiki page views of the key topics as Twitter did not convey trending information; only significant coefficients with p<0.05 are shown in the table. Our final set of projections contained in Table 18 demonstrate that the momentum in favour of the Conservatives reported in Table 14 continued in the last week and indeed produced the forecast that the Conservative party would win a clear majority of the seats in the 2015 Parliament. Our mean seat prediction of 318 seats for the Conservatives is slightly below the 326 majority line needed for an overall majority but our seat range projections of 306-330 for the Conservatives give an upper bound which was only one short of the actual outcome for the Conservatives and clearly underscores out projection from a week before that they were the one party who were likely to gain a majority outcome.

28
Table 18: Projecting Results for Main UK Parties Conservatives Labour Lib Dems UKIP Green Mean Rate 35.2% 31.5% 8.6% 13.3% 5.5% Rate Range 33.7-36.8% 30-33% 7.8-9.4% 12.3-14.3% 4.8-6.3% Mean Seats 318 242 11 1 1 Seat Range 306-330 233-252 9-14 1-2 1-1
Note: Ranges are based on 95% confidence intervals. 7. Concluding Comments Our election analysis and forecasting approach is not intended to replace traditional polls and socio-economic models. Instead, we intend to improve the accuracy of forecasting by combining polling information with other available information, such as media and Internet Big Data, and adopting advances from text mining techniques, Big Data analytics and econometric models. In summary, this paper provides an application of the TRUST framework in analysing and forecasting the UK 2015 general election. Within this framework, we can identify the key themes that dominated the political landscapes of the UK and Scotland and examine the effects of key topics and swing vote effects. Furthermore our approach also provides the possibility of managing a real-time election campaign by tackling the key themes potential voters show interest in and forecasting the final vote results more robustly by taking into consideration all available information from polls, media, and Internet Big Data. As demonstrated our final forecasts for the overall UK results and the Scottish results are very close to the actual outcomes. While our approach shows a promising direction for predicting future elections predictions, it may be improved in several ways. Firstly, dynamic text analytics could be conducted on newspaper reports and other text files like TV programme scripts based on recent advances in LDA and other topic models in the area of information retrieval, machine learning and natural language processing, e.g. Blei and Lafferty (2009). Secondly, a broader range of data mining techniques could be used to analyse figures, videos, and other multi-media information from traditional mass media like TV, magazines, newspapers, given the eminent roles that they play in political campaigns (DellaVigna and Kaplan, 2007; Druckman and Parkin, 2005; Gerber et al., 2009; Martin and Hansen, 1998; and Newman, 2011). Thirdly, although still at an early stage, techniques of text mining social media data and other Internet data resources (see e.g., Zhao et.al. (2011)), could be incorporated into the TRUST framework if proven efficient to find the most related factors. Fourthly, the availability of local Internet Big Data, would allow the calculation of direct seat predictions at the constituency level. Currently, given the limited nature of Internet data resources, it was not possible to perform a direct seat

29
prediction for the 2015 UK election. Rather a two-step vote-to-seat forecast based on previous constituency results and the national partial swing rate was used. Fifthly, it may be possible to incorporate developments in voting theories into our TRUST framework. For example, there are some interesting theoretical studies in economic voting, swing voting, and retrospective voting, and voting indecision, e.g., Orriols and Martínez (2014), and Rogers (2014) and key elements of these could be incorporated into our model setups to further improve predictability. Sixthly, advances in modelling techniques may be considered to provide better structural and dynamic analyses and forecast. For example, new developments in panel data cointegration modelling (Westerlund and Edgerton, 2008; Westerlund and Persyn, 2008) can capture short-term dynamics and analyse long-term relationships and provide robust forecasts across different parties and in response to various scenarios. Similar developments in statistics and econometrics should be considered if standard VAR and other time series models do not prove to be data coherent. In summary, forecasting any variable is not an easy task, especially multi-partial elections involving millions of people. Building on decades of research from pollsters and modellers, we incorporate recent developments in data mining, big data analytics and statistical modelling into a coherent TRUST framework with the aim of providing a solid analysis and robust prediction method for elections and possibility facilitating the more efficient management of election campaigns. Although our research is subject to further improvements, we believe the results contained in this paper indicates that our approach, even at this stage, has great potential for the prediction of election campaigns and many other areas of business and social sciences.

30
Appendix 1 Seed WORDS TO IDENTIFY NEWS FOR PARTIES IN THE UK Source: UK National Newspapers Time period: 11 May 2008-Present Update Frequency: Weekly, Monthly and Semi-annually (Note: Sunday-Saturday as one week) Party : Conservatives
(1) Conservative (Headline) OR
(2) Tory (Headline) OR
(3) Tories (Headline) OR
(4) Cameron (Headline)
Party: Liberal Democrats (1) lib dem (Headline)
OR (2) Liberal Democrat (Headline)
OR (3) Clegg (Headline)
Party: UK Labour
(1) Labour (Headline) OR
(2) Gordon Brown (Headline) OR
(3) Ed Miliband (Headline) AND
(4) UK (major mentions)
Party: UKIP (1) UKIP (Headline)
OR (2) Nigel Farage (Headline)
Party: Green Party England and Wales
(1) Green Party (Headline) OR
(2) Caroline Lucas (Headline) Note: Leader between 2008 and 2012 and only Green MP OR
(3) Natalie Bennett (Headline) Note: Leader from 3 Sep 2012 Picture Illustration Examples

31

32
Seed WORDS TO IDENTIFY NEWS FOR PARTIES IN SCOTLAND Source: Scottish Publications Time period: 11 May 2008-Present Update Frequency: Weekly, Monthly and Semi-annually (Note: Sunday-Saturday as one week) Party: Scottish Conservatives
(1) Conservative (Headline) OR
(2) Tory (Headline) OR
(3) Tories (Headline) AND
(4) Scotland (major mentions)
Party: Scottish Labour (1) Labour (Headline)
OR (2) Jim Murphy (Headline) for 13 Dec 2014-Present
Johann Lamont(Headline) for 17 Dec 2011-24 Oct 2014 Iain Gray 13 Sep(Headline) for 2008 – 17 Dec 2011 Wendy Alexander (Headline) for 14 Sep 2007- 28 Jun 2008 AND
(3) Scotland (Major Mentions)
Party: Scottish Liberal Democrats (1) lib dem (Headline)
OR (2) Liberal Democrat (Headline)
OR (3) Tavish Scott (Headline) for 26 Aug 2008-7 May 2011,
Willie Rennie (Headline) 17 May 2011-Present AND
(4) Scotland (Major Mentions)
Party: SNP (1) SNP (Headline)
OR (2) Scottish Nationalist (Headline)
OR (3) Alex Salmond (Headline)
OR (4) Nicola Sturgeon (Headline)

33
34
List of UK National Newspapers (Full Text) Daily Mail and Mail on Sunday Daily Star Daily Star Sunday Express Online i - Independent Print Ltd Independent.co.uk Independent on Sunday MailOnline mirror.co.uk Morning Star* telegraph.co.uk The Business* The Daily Telegraph (London) The Express The Guardian (London) The Independent (London) The Mirror and The Sunday Mirror The Observer The People The Sunday Telegraph (London) The Sunday Times (London) The Times (London) List of Scottish Publications (Full Text) Aberdeen Evening Express Aberdeen Press and Journal Airdrie & Coatbridge Advertiser Arbroath Herald Berwickshire News Brechin Advertiser Buchan Observer Business 7 (UK)* Carluke & Lanark Gazette* Carrick Gazette Carrick Times Cumbernauld News & Kilsyth Chronicle* dailyrecord.co.uk Daily Record (PM) - UK* Daily Record & Sunday Mail Deeside Piper & Herald Donside Piper & Herald Dumfries & Galloway Standard East Lothian News Edinburgh Evening News Ellon Times Evening News (Edinburgh) Evening Times (Glasgow) Falkirk Herald Fife Free Press* Forfar Dispatch & Kirriemuir Herald* Fraserburgh Herald Glasgow East News* Guide and Gazette Hawick News

35
Inverurie Herald Kincardineshire Observer Kirkintilloch Herald Linlithgowshire Journal & Gazette* Mearns Leader Midlothian Advertiser Milngavie & Bearsden Herald Montrose Review Motherwell Times Paisley & Renfrew Extra* Paisley Daily Express PA Newswire: Scotland Scotland on Sunday Scottish Business Insider Scottish Daily Mail Scottish Express Scottish Mail on Sunday Scottish Star Selkirk Weekend Advertiser Southern Reporter Stirling Observer Stornoway Gazette Sunday Herald The Buteman The Galloway Gazette The Herald (Glasgow) The Scotsman & Scotland on Sunday The Scottish Farmer* Wishaw Press

36
References Anstead, N. and B. O’Loughlin (2015), Social Media Analysis and Public Opinion: The 2010 UK General Election, Journal of Computer-Mediated Communication, 20 (2), pp. 204-220. Bermingham, A. and A. F. Smeaton (2011), On Using Twitter to Monitor Political Sentiment and Predict Election Results in Proceedings of the Workshop on Sentiment Analysis where AI meets Psychology (SAAIP). Blei, D. M., Ng, A. Y. And M. I Jordan (2003), Latent Dirichlet Allocation, Journal of Machine Learning Research, 3, pp. 993-1022. Blei, D. M., and J. Lafferty (2009), Topic Models, in A. Srivastava and M. Sahami (ed.), Text Mining: Theory and Applications. Taylor and Francis. Bray, M. and D. M. Kreps (1987), Rational Learning and Rational Expectations, in G. Feiwel (ed.) Kenneth Arrow and the Ascent of Economic Theory, Macmillan. Burnap, P., Gibson, R., Sloan, L., Southern, R. and M. Williams (2015), 140 Characters to Victory?: Using Twitter to Predict the UK 2015 General Election, Available at arxiv.org/pdf/1505.01511.pdf Castillo, C., Mendoza, M., and B. Poblete (2011), Information Credibility on Twitter, In Proceedings of WWW 2011. Chen, Y., Zhang, F. and Y. Yue (2012), Predicting U.S. President Election Result Based on Google Insights, Available at http://cs229.stanford.edu/proj2012/ChenZhangYue-PredictingUSPresidentElectionResultBasedOnGoogleInsights.pdf Chiang, C. F. and B. G. Knight (2011), Media Bias and Influence: Evidence from Newspaper Endorsements, Review of Economic Studies, 78(3), pp. 795-820. Clarke, H. D. and M. C. Stewart (1994), Economic Evaluations and Election Outcomes: An Analysis of alternative forecasting models, In D. Broughton (Ed.), et al., British Elections and Parties Yearbook 1994, Frank Cass, London, pp. 73-91. DellaVigna, S. and E. Kaplan (2007), The Fox News effect: Media bias and voting, Quarterly Journal of Economics, 122(3), pp. 1187-1234. Druckman, J. N. and M. Parkin (2005), The Impact of Media Bias: How Editorial Slant Affects Voters, Journal of Politics, 67 (4), pp. 1030-1049. Epstein, R. and R. E. Robertson (2015), The Search Engine Manipulation Effect (SEME) and Its Possible Impact on The Outcomes of Elections, Proceedings of the National Academy of Sciences USA, 112 (33), E4512-E4521.

37
Fisher, S. D., Ford, R., Jennings, W., Pickup M. and C. Wlezien (2011), From Polls to Votes to Seats: Forecasting the 2010 British General Election, Electoral Studies, 30 (2), pp. 250-257. Franch, F. (2013), (Wisdom of the Crowds): 2010 UK Election Prediction with Social Media, Journal of Information Technology & Politics, 10 (1), pp. 57-71. Gayo-Avello, D. (2011), Don’t Turn Social Media into Another ’ Literary Digest’ Poll, Communications of the ACM. Gerber, A., Karlan, D. S. and D. Bergan (2009), Does the Media Matter? A Field Experiment Measuring the Effect of Newspapers on Voting Behavior and Political Opinions, American Economic Journal: Applied Economics, 1 (2), pp. 35-52. Gibson, R. and M. S. Lewis-Beck (2011), Methodologies of Election Forecasting: Calling the 2010 UK “Hung Parliament”, Electoral Studies, 30 (2), pp. 247-249. Graefe, A., Armstrongb, J. S., Jones, R. J., and A. G. Cuzáne (2014), Combining Forecasts: An Application to Elections, International Journal of Forecasting, 30, pp. 43-54. Huberty, M. (2015), Can We Vote with Our Tweet? On the Perennial Difficulty of Election Forecasting with Social Media, International Journal of Forecasting, 31 (3), pp. 992-1007. Lebo, M. J. and H. Norpoth (2007), The PM and the Pendulum: Dynamic Forecasting of British Elections, British Journal of Political Science, 37 (1) pp. 71-87. Lebo, M. and H. Norpoth (2011), Yes, Prime Minister: The Key to Forecasting British Elections, Electoral Studies, 30 (2), pp. 258-263. Lewis-Beck, M. S. (2005), Electoral Forecasting: Principles and Practice, British Journal of Politics and International Relations, 7, pp. 145-164. Lewis-Beck, M. S., Nadeau, R. and E. Bélanger (2004), General Election Forecasts in the United Kingdom: A Political Economy Model, Electoral Studies, 23 (2), pp. 279-290. Lewis-Beck, M. S., Nadeau, R. and E. Bélanger (2011), Nowcasting V. Polling: The 2010 UK Election Trials, Electoral Studies, 30 (2), pp. 284-287. Lui, C., Metaxas, P. T. and E. Mustafaraj (2011), On the Predictability of the U.S. Elections Through Search Volume Activities, Available at http://cs.wellesley.edu/~pmetaxas/e-Society-2011-GTrends-Predictions.pdf MacDonald, R. and I.W. Marsh (1997), "On Fundamentals and Exchange Rates: A Casselian Perspective", Review of Economics and Statistics, November, 655-664. MacDonald, R. and I.W. Marsh (1999), Exchange Rate Modelling, Kluwer, 1999.

38
MacDonald, R. and X. Mao (2015), Predicting the Outcome of the Scottish Independence Referendum: The Information from the Ether, University of Glasgow Economics Working Papers, No. 2015-05. Mao, X. (2016), Cracking the Myths of Big Data Forecasting with TRUST: An Innovative Framework for Analysing and Predicting Human Behaviour, Working Paper, UCL, available on request. Martin, S. and K. Hansen (1998), Newspapers of Record in A Digital Age: From Hot Type to Hot Link, Westport, CT: Praeger. Meese, R. and K. Rogoff (1983), ‘Empirical Exchange Rate Models of the Seventies: Do they fit out of Sample?’, Journal of International Economics, 13, 3-24. Metaxas, P. T., Mustafaraj, E., and D. Gayo-Avello (2011), How (Not) To Predict Elections, In Proceedings of PASSAT/SocialCom. Morwitz, V.G. and C. Pluzinski (1996), Do Pools Reflect Opinions or Do Opinions Reflect Polls? The Impact of Political Polling on Voters’ Expectation, Preferences, and Behavior, Journal of Consumer Research, 23 (1), pp. 53-67. Nadeau, R., Lewis-Beck, M. S. and E. Bélanger (2009), Election Forecasting in the United Kingdom: A Two-Step Model, Journal of Elections, Public Opinion and Parties, 19 (3), pp. 333-358. Newman, N. (2011), Mainstream Media and the Distribution of News in the Age of Social Discovery, Reuters Institute for the Study of Journalism, University of Oxford, UK. Norpoth, H. (2004), Forecasting British Elections: A Dynamic Perspective, Electoral Studies, 23, pp. 297-305. O’Connor, B., Balasubramanyan, R., Routledge, B. R. and N. A. Smith (2010), From Tweets to Polls: Linking Text Sentiment to Public Opinion Time Series, Proceedings of the International AAAI Conference on Weblogs and Social Media. ONS (2013), Internet Access - Households and Individuals, Available at http://www.ons.gov.uk/ons/dcp171778_322713.pdf Orriols, L. and Á. Martínez (2014), The Role of the Political Context in Voting Indecision, Electoral Studies, 35, pp. 12-23. Perry, P. (1960), Election Survey Procedures of Gallup poll, Public Opinion Quarterly, 24, pp. 531-542. Perry, P. (1979), Certain Problems in Election Methodology, Public Opinion Quarterly, 43, pp. 312-345.

39
Rogers, J. (2014), A Communotropic Theory of Economic Voting, Electoral Studies, 36, pp. 107-116. Rogers, T. and M. Aida (2012), Why Bother Asking? The Limited Value of Self-Reported Vote Intention, Harvard Kennedy School Faculty Research Working Paper Series, RWP12-001. Sanders, D. (1991), Government Popularity and the Next General Election, Political Quarterly, 62, pp. 235-261. Sanders, D. (1993), Forecasting the 1992 General Election Result: The Performance of an Economic Model, In D. Denver (Ed.), et al., British Elections and Parties Yearbook, Harvester Wheatsheaf, London. Sanders, D. (1995), Forecasting Political Preferences and Election Outcomes in the UK: Experiences, Problems and Prospects for the Next General Election, Electoral Studies, 14, pp. 251-272. Sanders, D. (1996), Economic performance, management competence and the outcome of the next general election, Political Studies, 44, pp. 203-231. Sanders, D. (2005), Popularity function forecasts for the 2005 UK general election, British Journal of Politics and International Relations, 7, pp. 174-190. Schonfeld, E. (2008), Can Google Trends Predict the Election? Available at http://techcrunch.com/2008/06/07/can-google-trends-predict-the-election/ Skoric, M., Poor, N., Achananuparp, P., Lim, E-P., and J. Jiang (2012), Tweets and Votes: A Study of the 2011 Singapore General Election, Proceedings of the 45th Hawaii International Conference on System Sciences. Sloan, L., Morgan, J., Burnap, P. and M. Williams (2015), Who Tweets? Deriving the Demographic Characteristics of Age, Occupation and Social Class from Twitter User Meta-Data, PLoS ONE. Statista, Inc. (24 September 2015), Worldwide Market Share of Leading Search Engines from January 2010 to July 2015, Available at http://www.statista.com/statistics/216573/worldwide-market-share-of-search-engines/ Stephens-Davidowitz, S. (2013), Using Google Data to Predict Who Will Vote, Available at http://papers.ssrn.com/sol3/papers.cfm?abstract_id=2238863 Tumasjan, A., Sprenger, T. O., Sandner, P. G., and I. M. Welpe (2010), Predicting Elections with Twitter: What 140 characters Reveal about Political Sentiment, Word, Journal of the International Linguistic Association, pp. 178-185.

40
Tumasjan, A., Sprenger, T. O., Sandner, P. G., and I. M. Welpe (2011), Election Forecasts with Twitter: How 140 Characters Reflect the Political Landscape, Social Science Computer Review, 29(4), pp. 402-418. Tumasjan, A., Sprenger, T.O., Sandner, P.G., and I. M. Welpe (2012), Where There is a Sea There are Pirates: Response to Jungherr, Jurgens, and Schoen, Social Science Computer Review, 30 (2), pp. 235-239. Westerlund, J. and D. L. Edgerton (2008), A Simple Test for Cointegration in Dependent Panels with Structural Breaks, Oxford Bulletin of Economics and Statistics, 70(5), pp. 665-704. Westerlund, J. and D. Persyn (2008), Error Correction Based Cointegration Tests for Panel Data, Stata Journal, 8, 232–241. Whiteley, P. (1979), Electoral Forecasting from Poll Data: The British Case, British Journal of Political Science, 9, pp. 219-236. Whiteley, P. (2008), Evaluating Rival Forecasting Models of the 2005 General Election in Britain - An Encompassing Experiment, Electoral Studies, 27 (4), pp. 581-588. Whiteley, P., Sanders, D., Stewart, M. and H. Clarke (2011), Aggregate Level Forecasting of the 2010 General Election in Britain: The Seats-Votes Model, Electoral Studies, 30 (2), pp. 278-283. Zhao, W. X., Jiang, J., Weng, J., He, J., Lim, E-P, Yan, H. and X. Li (2011) Comparing Twitter and Traditional Media Using Topic Models, in P. Clough et al. (ed.) Advances in Information Retrieval, pp. 338-349.