Romania Market Overview - Knight Frank · ROMANIA MARKET OVERVIEW −054–−056 04 Contents...
13
Romania Market Overview Real Estate Year Round Highlights 2018 –2019
Transcript of Romania Market Overview - Knight Frank · ROMANIA MARKET OVERVIEW −054–−056 04 Contents...

RomaniaMarketOverview Real Estate Year Round Highlights 2018 –2019

KNIGHTFRANK.COM.RO | 32 | KNIGHTFRANK.COM.RO
ROMANIA MARket OVeRVIeW 2018–2019
Con
tent
s04
Romanian Economic Overview
12
Retail Market
18
Residential Market
22
Legal Aspects
06
Office Market
14
Land Market
20
Project Management
10
Investment Market
16
Industrial Market
21
Property Taxation
KNIGHTFRANK.COM.RO | 3
ROMANIA MARket OVeRVIeW 2018–2019
Independent, international,commercial, residential.
Locally expert, globally connected.
ABOUT THE GROUPAt Knight Frank we build long-term relationships, which allow us to provide
personalised, clear and considered advice on all areas of property in all key markets. We believe personal interaction is a crucial part of ensuring every client is matched
to the property that suits their needs best – be it commercial or residential.
Operating in locations where our clients need us to be, we provide a worldwide service that’s locally expert and globally connected.
We believe that inspired teams naturally provide excellent and dedicated client service. Therefore, we’ve created a workplace where opinions are respected, where everyone is invited to contribute to the success of our business and where they’re
rewarded for excellence. The result is that our people are more motivated, ensuring your experience with us is the best that it can be.
523 OFFICeS
60 TERRITORIES18,170 PEOPLE

ROMANIA MARket OVeRVIeW 2018–2019
KNIGHTFRANK.COM.RO | 54 | KNIGHTFRANK.COM.RO
“ In Romania the economic growth pace decelerated last year, due to the normalisation of the private consumption and to the deterioration of the net foreign demand.
“ The global economy has recently continued the deceleration process, an evolution mainly determined by the global trade tensions and the maturity of the investment cycle
2019
According to the PMI Composite indicator the global growth pace decelerated to the lowest level since the autumn of 2016 in January.
In USA the GDP accelerated last year on the back of the fixed investments, supported by the expansionary policy-mix. During January-September 2018 the GDP advanced by 2.8% YoY, as the fixed investments and the private consumption rose by 5.5% YoY and 2.6% YoY, respectively.
On the other hand, the Euroland economy (the main economic partner of Romania) decelerated last year (1.8% YoY, the slowest pace since 2014), converging towards potential, an evolution influenced by the global trade tensions, the fading-out of the expansionary monetary policy and the accumulation of challenges in terms of regional economic integration.
At the same time, the GDP of China rose by only 6.6% YoY in 2018, the slowest pace since 1990.
In Romania the economic growth pace decelerated last year, due to the normalisation of the private consumption and to the deterioration of the net foreign demand.
According to the estimates of the National Institute of Statistics (NIS) the GDP climbed by 4.2% YoY during 1–3Q 2018, a growth pace close to the potential, an evolution supported by the affordable level of the real financing costs and the expansionary fiscal and income policies.
The household consumption advanced by 5.1% YoY, due to the increase of the real disposable income of the population, the decline of the savings ratio and the positive climate on the credit market.
At the same time, the collective consumption expenditure of the general
government climbed by 5.5% YoY, due to the expansionary fiscal policy and the increase of the wages in the public sector.
Furthermore, the inventories of the companies had an important contribution to the YoY growth pace of the economy during January–September 2018, as the gross capital formation climbed by 11.7% YoY, while the fixed investments contracted by 1.1% YoY. The decline of the investments was determined by the maturity of the post-crisis cycle in Euroland and the domestic challenges in terms of macroeconomic equilibria.
As regards the net foreign demand the imports continued to increase by a higher pace compared with the exports during 9M2018: 9.1% YoY vs. 5.8% YoY.
In our core macroeconomic scenario the YoY growth of the Romanian economy would decelerate from 7% in 2017 to 4% in 2018 and 2.8% in 2019, due to the maturity of the cycle in Euroland and to the domestic factors: the aggressive state intervention with impact for the investment climate in a context of high level of macroeconomic disequilibria.
However, the GDP may accelerate to 3.3% YoY in 2020.
For the fixed investments we expect a slow growth pace (2.3% YoY in 2019 and 2020), given the twin deficits and the low manoeuvre room of the policy-mix.
As regards the private consumption (the main component of the GDP) we forecast YoY growth paces of 4% in 2019 and 5% in 2020, due to the normalisation of the real disposable income and to the deterioration of the credit markets.
The public consumption would consolidate in 2019, while a growth by 1.1% YoY is expected in 2020, in our scenario.
On the other hand, the exports would continue to underperform compared with the imports in the short and mid-run, but a narrowing of the differential dynamics seems likely this year, due to the depreciation of the RON.
For 2021 we expect the acceleration of the GDP growth pace to 3.7% YoY, on the back of the improvement of the investment climate: the fixed investments are forecasted to climb by 3.9% YoY, the best pace since 2015.
The acceleration of the fixed investments and the prospects for gradual improvement of the credit markets would determine an increase of the private consumption by 5.3% YoY in 2021.
At the same time, the public consumption is forecasted to advance by 1% YoY in 2021.
As regards the net foreign demand we expect both exports and imports to accelerate in 2021, to 6.8% YoY and 8.1% YoY, respectively.
Last, but not least, in our scenario the trend on the labour market would change in the short-run, given the expected negative output gap and the increasing cost pressures.
On the other hand, we forecast the deceleration of the average annual inflation (HICP basis) from 4.1% in 2018 to 3.1% in 2019 and 2.6% in 2020, due to the slowing-down of the growth pace and to the rebalancing of the economic policy. However, inflation would accelerate to 2.9% in 2021 in our scenario.
The slowing-down of the real growth pace and the prospects for inflation (fluctuation within the target of the central bank) express
a high probability for the consolidation of the monetary policy in the following quarters.
In other words, the National Bank of Romania (NBR) would keep the policy rate at 2.50% in 2019 and 2020. However, we do not exclude the central bank to relaunch the process of convergence of MRRs towards the Euroland level in a gradual manner.
On the other hand, we forecast the increase of the sovereign financing costs in the short-run, due to the challenges in terms of public finance and macro-financial stability. In our scenario, the annual average yield for the 10YR bonds (a barometer for the financing cost in the economy) would increase from 4.7% in 2018 to 5.5% in 2019. An adjustment towards 4.7% in 2020 and 2021 is likely, given the prospects for the implementation of fiscal consolidation measures.
For the €/RON we expect the continuity of the upward trend in the short and mid-run, towards average annual levels of 4.75 in 2019, 4.78 in 2020 and 4.82 in 2021. This scenario is supported by the expected volatility on the global financial markets and the domestic challenges in terms of macroeconomic equilibria.
In our view the main risk factors for the evolution of the Romanian economy (real and financial sides) in the following quarters are: the macro-financial climate (global/European); the EU challenges (Brexit); the domestic policy-mix in the electoral year (including the state intervention in the economy and the fragile stance of the public finance); the regional geo-political climate.
Source: Eurostat, BT forecasts
Dr. Andrei Radulescu Director Macroeconomic Analysis Banca Transilvania
Source: Eurostat, BT forecasts
20
09
20
10
20
11
20
12
20
13
20
14
20
15
20
16
20
17
20
18
20
19
20
20
20
21
-2
-1
0
1
2
3
4
5
6
7
Consumer prices (HICP) YoY (%)
Private consumption vs. fixed investments YoY (%)
-40
-30
-20
-10
0
10
20
30
40
-9
-4
1
6
11
16
60
50
Private consumptionFixed investments
20
00
20
01
20
02
20
03
20
04
20
05
20
06
20
07
20
08
20
09
20
10
20
11
20
12
20
13
20
14
20
15
20
16
20
17
20
18
20
19
20
20
20
21
A year between cycles for Romanian economy
KNIGHTFRANK.COM.RO | 7
ROMANIA MARket OVeRVIeW 2018–2019
6 | KNIGHTFRANK.COM.RO
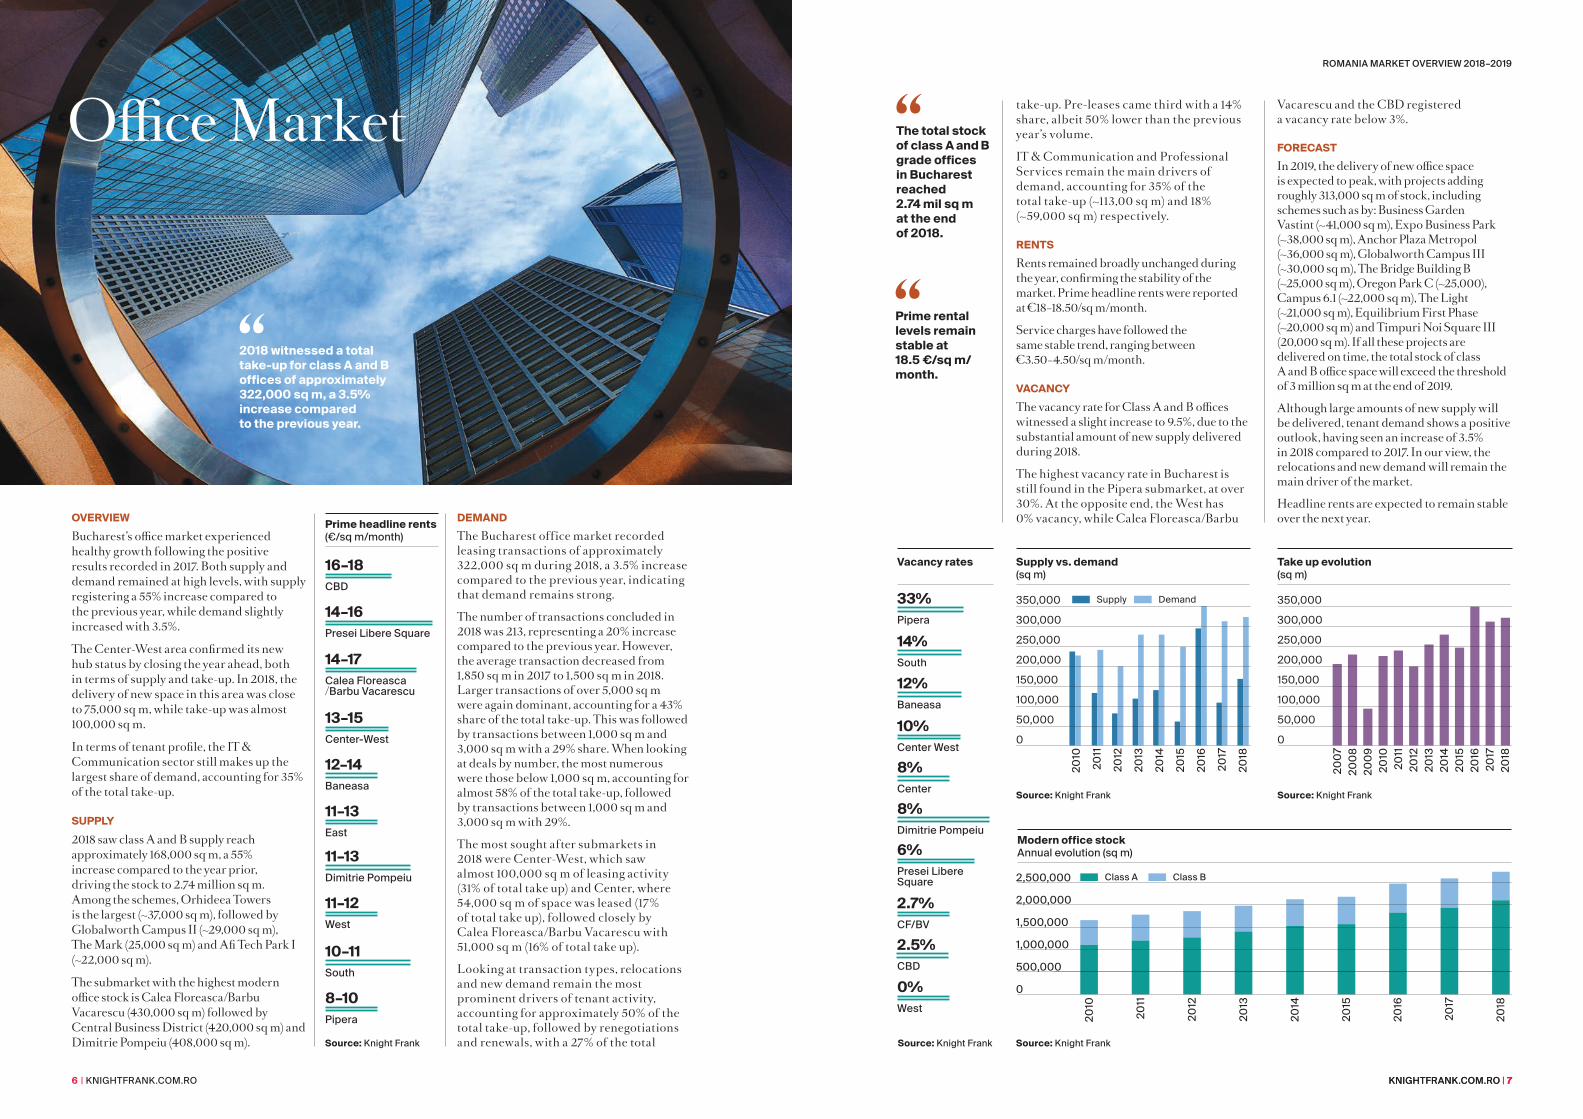
OveRvIewBucharest’s office market experienced healthy growth following the positive results recorded in 2017. Both supply and demand remained at high levels, with supply registering a 55% increase compared to the previous year, while demand slightly increased with 3.5%.
The Center-West area confirmed its new hub status by closing the year ahead, both in terms of supply and take-up. In 2018, the delivery of new space in this area was close to 75,000 sq m, while take-up was almost 100,000 sq m.
In terms of tenant profile, the IT & Communication sector still makes up the largest share of demand, accounting for 35% of the total take-up.
SuPPly2018 saw class A and B supply reach approximately 168,000 sq m, a 55% increase compared to the year prior, driving the stock to 2.74 million sq m. Among the schemes, Orhideea Towers is the largest (~37,000 sq m), followed by Globalworth Campus II (~29,000 sq m), The Mark (25,000 sq m) and Afi Tech Park I (~22,000 sq m).
The submarket with the highest modern office stock is Calea Floreasca/Barbu Vacarescu (430,000 sq m) followed by Central Business District (420,000 sq m) and Dimitrie Pompeiu (408,000 sq m).
DeMAnDThe Bucharest office market recorded leasing transactions of approximately 322,000 sq m during 2018, a 3.5% increase compared to the previous year, indicating that demand remains strong.
The number of transactions concluded in 2018 was 213, representing a 20% increase compared to the previous year. However, the average transaction decreased from 1,850 sq m in 2017 to 1,500 sq m in 2018. Larger transactions of over 5,000 sq m were again dominant, accounting for a 43% share of the total take-up. This was followed by transactions between 1,000 sq m and 3,000 sq m with a 29% share. When looking at deals by number, the most numerous were those below 1,000 sq m, accounting for almost 58% of the total take-up, followed by transactions between 1,000 sq m and 3,000 sq m with 29%.
The most sought after submarkets in 2018 were Center-West, which saw almost 100,000 sq m of leasing activity (31% of total take up) and Center, where 54,000 sq m of space was leased (17% of total take up), followed closely by Calea Floreasca/Barbu Vacarescu with 51,000 sq m (16% of total take up).
Looking at transaction types, relocations and new demand remain the most prominent drivers of tenant activity, accounting for approximately 50% of the total take-up, followed by renegotiations and renewals, with a 27% of the total
“ 2018 witnessed a total take-up for class A and B offices of approximately 322,000 sq m, a 3.5% increase compared to the previous year.
“ Prime rental levels remain stable at 18.5 €/sq m/month.
“ The total stock of class A and B grade offices in Bucharest reached 2.74 mil sq m at the end of 2018.
KNIGHTFRANK.COM.RO | 7
Office Market
Prime headline rents (€/sq m/month)
16–18CBD
14–16Presei Libere Square
14–17Calea Floreasca/Barbu Vacarescu
13–15Center-West
12–14Baneasa
11–13East
11–13Dimitrie Pompeiu
10–11South
11–12West
8–10Pipera
Source: Knight Frank
take-up. Pre-leases came third with a 14% share, albeit 50% lower than the previous year’s volume.
IT & Communication and Professional Services remain the main drivers of demand, accounting for 35% of the total take-up (~113,00 sq m) and 18% (~59,000 sq m) respectively.
RenTSRents remained broadly unchanged during the year, confirming the stability of the market. Prime headline rents were reported at €18–18.50/sq m/month.
Service charges have followed the same stable trend, ranging between €3.50–4.50/sq m/month.
vACAnCyThe vacancy rate for Class A and B offices witnessed a slight increase to 9.5%, due to the substantial amount of new supply delivered during 2018.
The highest vacancy rate in Bucharest is still found in the Pipera submarket, at over 30%. At the opposite end, the West has 0% vacancy, while Calea Floreasca/Barbu
Vacarescu and the CBD registered a vacancy rate below 3%.
FOReCASTIn 2019, the delivery of new office space is expected to peak, with projects adding roughly 313,000 sq m of stock, including schemes such as by: Business Garden Vastint (~41,000 sq m), Expo Business Park (~38,000 sq m), Anchor Plaza Metropol (~36,000 sq m), Globalworth Campus III (~30,000 sq m), The Bridge Building B (~25,000 sq m), Oregon Park C (~25,000), Campus 6.1 (~22,000 sq m), The Light (~21,000 sq m), Equilibrium First Phase (~20,000 sq m) and Timpuri Noi Square III (20,000 sq m). If all these projects are delivered on time, the total stock of class A and B office space will exceed the threshold of 3 million sq m at the end of 2019.
Although large amounts of new supply will be delivered, tenant demand shows a positive outlook, having seen an increase of 3.5% in 2018 compared to 2017. In our view, the relocations and new demand will remain the main driver of the market.
Headline rents are expected to remain stable over the next year.
Source: Knight Frank
0
500,000
1,000,000
1,500,000
2,000,000
2,500,000 Class A Class B
Modern office stock Annual evolution (sq m)
20
10
20
11
20
12
20
13
20
14
20
15
20
16
20
17
20
18
Source: Knight Frank
20
07
20
08
20
09
20
102
011
20
122
013
20
142
015
20
162
017
20
18
0
350,000
300,000
250,000
200,000
150,000
100,000
50,000
Take up evolution (sq m)
Source: Knight Frank
20
10
20
11
20
12
20
13
20
14
20
15
20
16
20
17
20
18
0
350,000
300,000
250,000
200,000
150,000
100,000
50,000
Supply vs. demand (sq m)
33%Pipera
14%South
12%Baneasa
10%Center West
8%Center
8%Dimitrie Pompeiu
6%Presei Libere Square
2.7%CF/BV
2.5%CBD
0%West
Source: Knight Frank
vacancy rates
Supply Demand
KNIGHTFRANK.COM.RO | 98 | KNIGHTFRANK.COM.RO
ROMANIA MARket OVeRVIeW 2018–2019
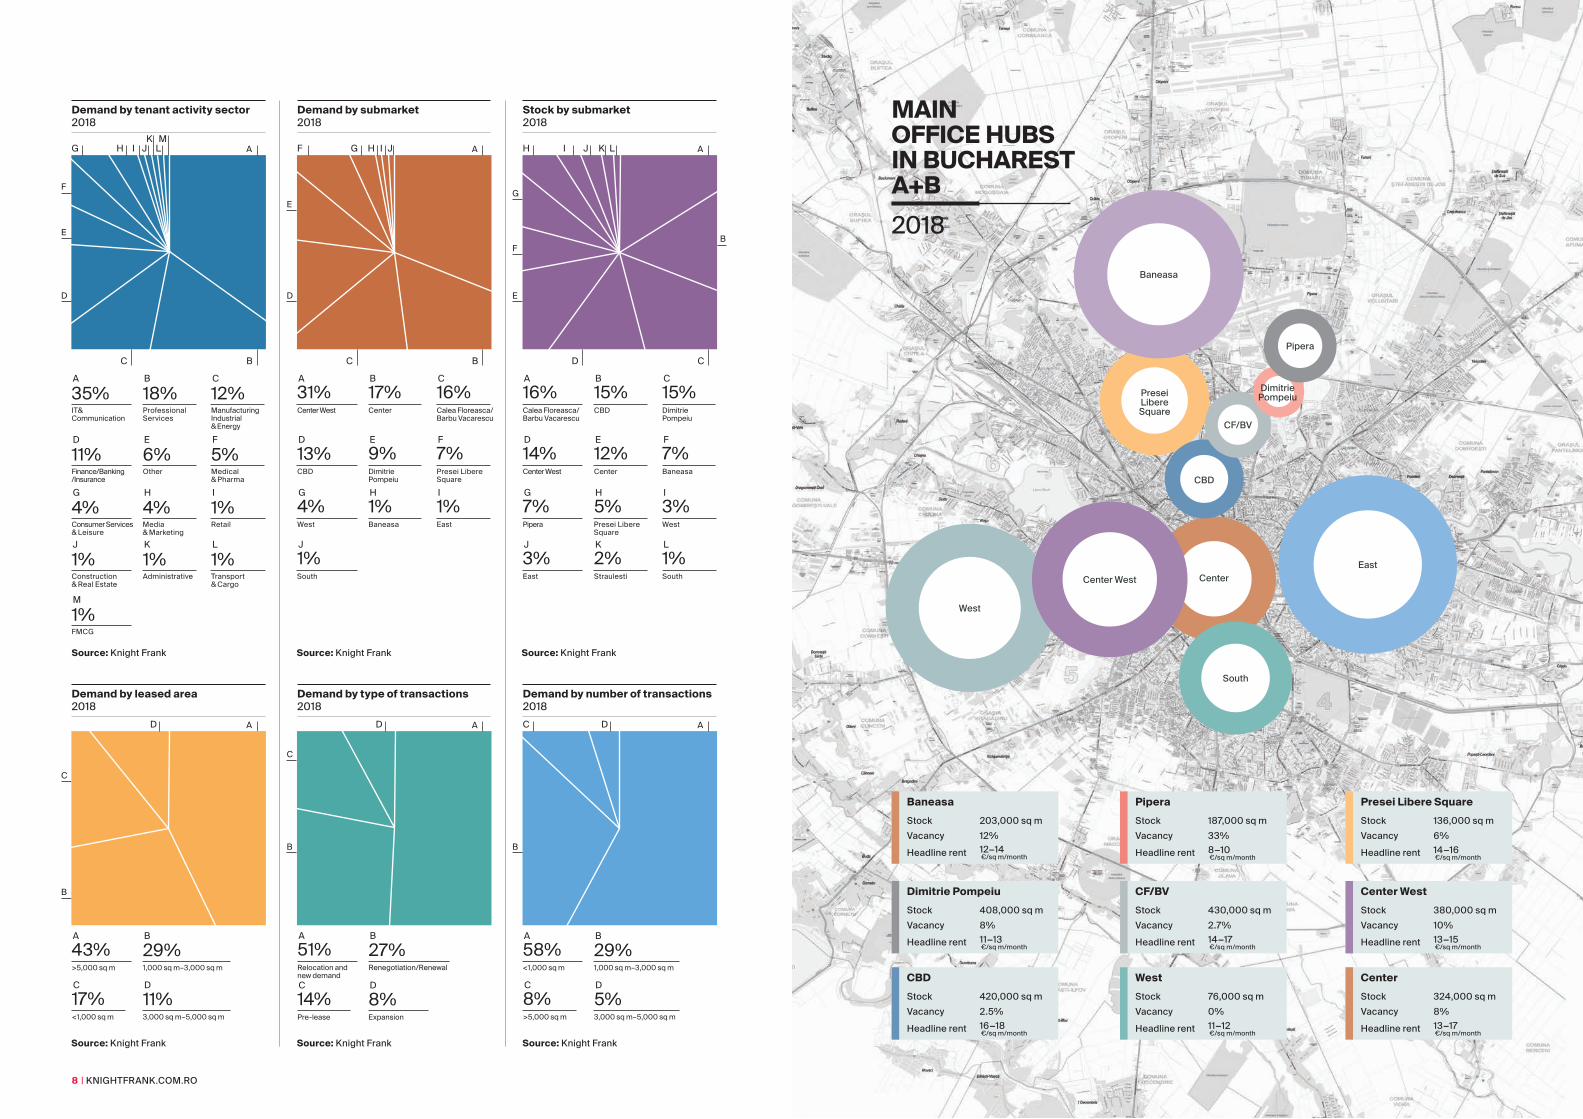
MAInOFFICe HuBS In BuCHAReSTA+B2018
Baneasa
Presei Libere Square
Pipera
CBD
CenterCenter West
West
South
East
Dimitrie Pompeiu
CF/BV
BaneasaStock 203,000 sq m
Vacancy 12%
Headline rent 12−14 €/sq m/month
Dimitrie PompeiuStock 408,000 sq m
Vacancy 8%
Headline rent 11−13 €/sq m/month
CBDStock 420,000 sq m
Vacancy 2.5%
Headline rent 16−18 €/sq m/month
PiperaStock 187,000 sq m
Vacancy 33%
Headline rent 8−10 €/sq m/month
CF/BvStock 430,000 sq m
Vacancy 2.7%
Headline rent 14−17 €/sq m/month
westStock 76,000 sq m
Vacancy 0%
Headline rent 11−12 €/sq m/month
Presei libere SquareStock 136,000 sq m
Vacancy 6%
Headline rent 14−16 €/sq m/month
Center westStock 380,000 sq m
Vacancy 10%
Headline rent 13−15 €/sq m/month
CenterStock 324,000 sq m
Vacancy 8%
Headline rent 13−17 €/sq m/month
Source: Knight Frank
Demand by tenant activity sector 2018
A
F
E
D
BC
G H
A
M
B C
35%
1%
18% 12%Manufacturing Industrial & Energy
IT & Communication
FMCG
Professional Services
D E F
11% 6% 5%Finance/Banking /Insurance
Medical & Pharma
Other
G H I
4% 4% 1%Consumer Services & Leisure
Media & Marketing
Retail
J K L
1% 1% 1%AdministrativeConstruction
& Real EstateTransport& Cargo
I JK
LM
Calea Floreasca/Barbu Vacarescu
Source: Knight Frank
Demand by submarket 2018
A
E
D
BC
F G
A B C31% 17% 16%Center West Center
J1%South
Presei LibereSquare
D E F
13% 9% 7%DimitriePompeiu
CBD
G H I4% 1% 1%
Baneasa EastWest
H JI
Stock by submarket 2018
Source: Knight Frank
A B C16% 15% 15%
DimitriePompeiu
Calea Floreasca/Barbu Vacarescu
CBD
D E F14% 12% 7%Center West BaneasaCenter
G H I7% 5% 3%Pipera Presei Libere
SquareWest
J K L3% 2% 1%
StraulestiEast South
G
F
E
H A
B
CD
I J K L
B
C
<1,000 sq m
Demand by leased area 2018
A
A B
C
43% 29%
17%
>5,000 sq m 1,000 sq m–3,000 sq m
3,000 sq m–5,000 sq m
D
11%
D
Source: Knight Frank
Demand by type of transactions 2018
A
B
C
A B51% 27%Relocation andnew demand
Renegotiation/Renewal
Pre-lease
C14%
Expansion
D
8%
D
Source: Knight Frank
>5,000 sq m
Demand by number of transactions 2018
A
B
C
A B
C
58% 29%
8%
<1,000 sq m 1,000 sq m–3,000 sq m
3,000 sq m–5,000 sq m
D
5%
D
Source: Knight Frank
KNIGHTFRANK.COM.RO | 11
ROMANIA MARket OVeRVIeW 2018–2019
10 | KNIGHTFRANK.COM.RO
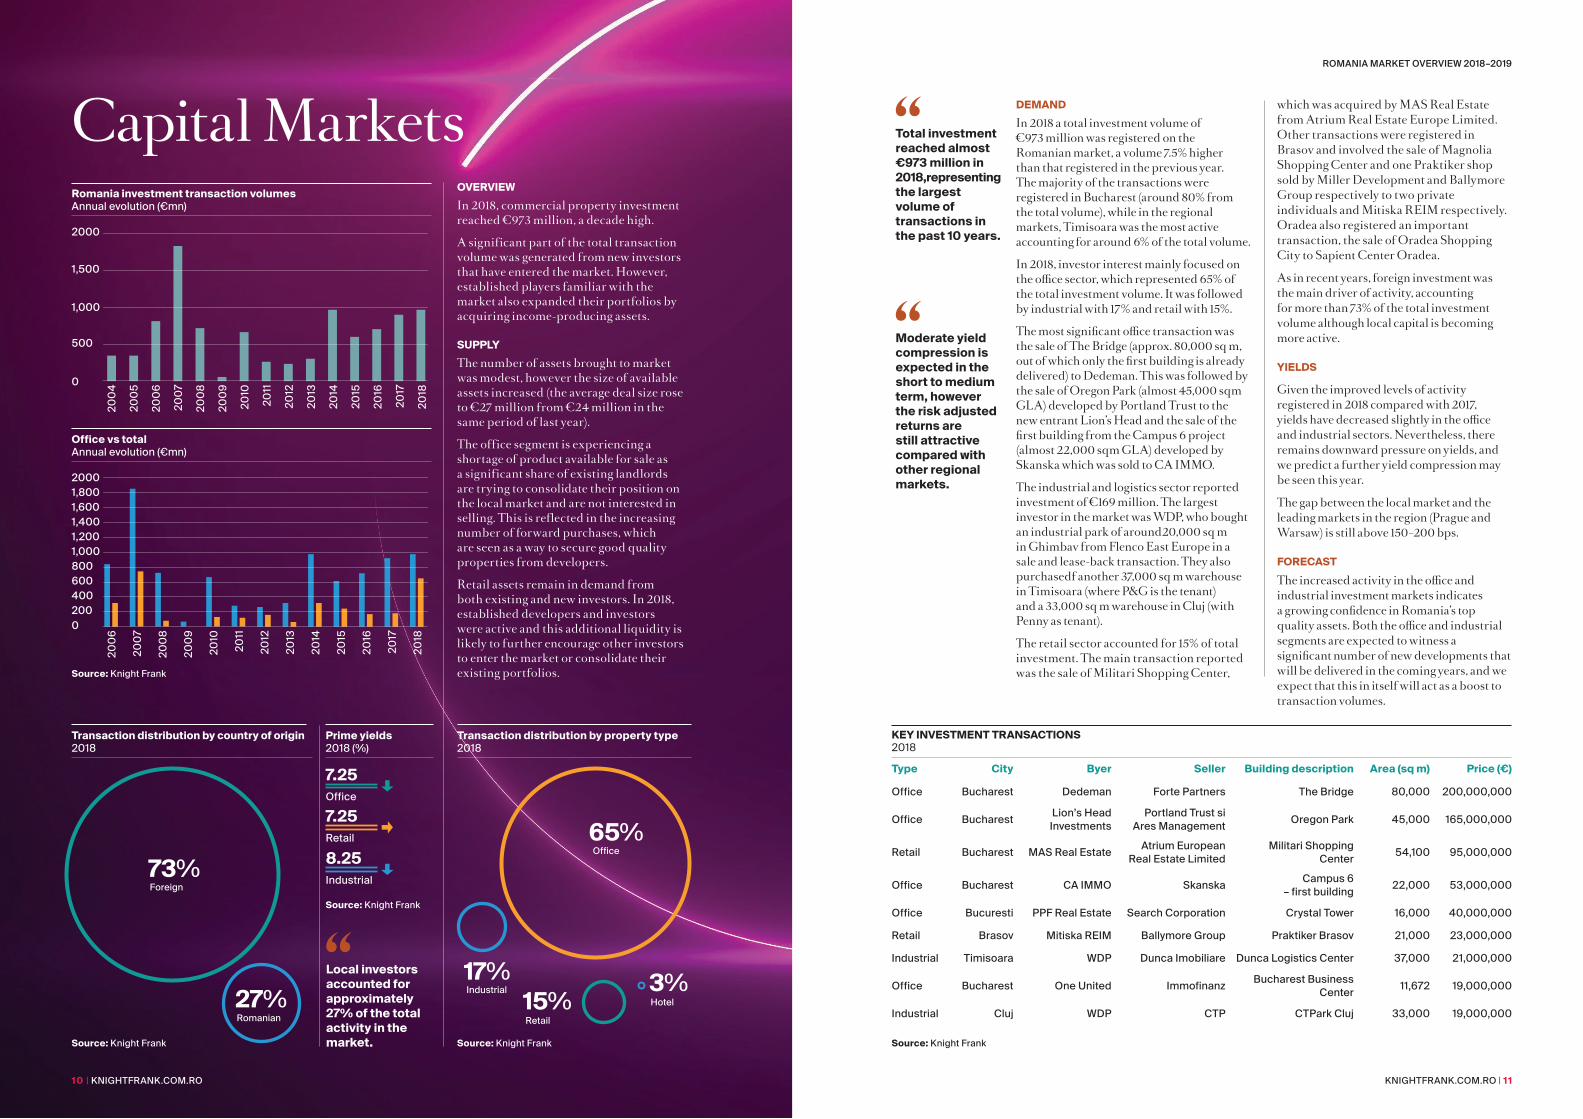
OveRvIewIn 2018, commercial property investment reached €973 million, a decade high.
A significant part of the total transaction volume was generated from new investors that have entered the market. However, established players familiar with the market also expanded their portfolios by acquiring income-producing assets.
SuPPlyThe number of assets brought to market was modest, however the size of available assets increased (the average deal size rose to €27 million from €24 million in the same period of last year).
The office segment is experiencing a shortage of product available for sale as a significant share of existing landlords are trying to consolidate their position on the local market and are not interested in selling. This is reflected in the increasing number of forward purchases, which are seen as a way to secure good quality properties from developers.
Retail assets remain in demand from both existing and new investors. In 2018, established developers and investors were active and this additional liquidity is likely to further encourage other investors to enter the market or consolidate their existing portfolios.
Capital Markets DeMAnDIn 2018 a total investment volume of €973 million was registered on the Romanian market, a volume 7.5% higher than that registered in the previous year. The majority of the transactions were registered in Bucharest (around 80% from the total volume), while in the regional markets, Timisoara was the most active accounting for around 6% of the total volume.
In 2018, investor interest mainly focused on the office sector, which represented 65% of the total investment volume. It was followed by industrial with 17% and retail with 15%.
The most significant office transaction was the sale of The Bridge (approx. 80,000 sq m, out of which only the first building is already delivered) to Dedeman. This was followed by the sale of Oregon Park (almost 45,000 sqm GLA) developed by Portland Trust to the new entrant Lion’s Head and the sale of the first building from the Campus 6 project (almost 22,000 sqm GLA) developed by Skanska which was sold to CA IMMO.
The industrial and logistics sector reported investment of €169 million. The largest investor in the market was WDP, who bought an industrial park of around20,000 sq m in Ghimbav from Flenco East Europe in a sale and lease-back transaction. They also purchasedf another 37,000 sq m warehouse in Timisoara (where P&G is the tenant) and a 33,000 sq m warehouse in Cluj (with Penny as tenant).
The retail sector accounted for 15% of total investment. The main transaction reported was the sale of Militari Shopping Center,
which was acquired by MAS Real Estate from Atrium Real Estate Europe Limited. Other transactions were registered in Brasov and involved the sale of Magnolia Shopping Center and one Praktiker shop sold by Miller Development and Ballymore Group respectively to two private individuals and Mitiska REIM respectively. Oradea also registered an important transaction, the sale of Oradea Shopping City to Sapient Center Oradea.
As in recent years, foreign investment was the main driver of activity, accounting for more than 73% of the total investment volume although local capital is becoming more active.
yIelDS
Given the improved levels of activity registered in 2018 compared with 2017, yields have decreased slightly in the office and industrial sectors. Nevertheless, there remains downward pressure on yields, and we predict a further yield compression may be seen this year.
The gap between the local market and the leading markets in the region (Prague and Warsaw) is still above 150–200 bps.
FOReCASTThe increased activity in the office and industrial investment markets indicates a growing confidence in Romania’s top quality assets. Both the office and industrial segments are expected to witness a significant number of new developments that will be delivered in the coming years, and we expect that this in itself will act as a boost to transaction volumes.
Source: Knight FrankSource: Knight Frank
Source: Knight Frank
65%
73%
3%15%
17%27%Romanian
Office
Foreign
Hotel
Retail
Industrial
Prime yields 2018 (%)
7.25Office
7.25Retail
8.25Industrial
“ Total investment reached almost €973 million in 2018, representing the largest volume of transactions in the past 10 years.
“ local investors accounted for approximately 27% of the total activity in the market.
“ Moderate yield compression is expected in the short to medium term, however the risk adjusted returns are still attractive compared with other regional markets.
Transaction distribution by property type 2018
Transaction distribution by country of origin 2018
10 | KNIGHTFRANK.COM.RO
Source: Knight Frank
Romania investment transaction volumes Annual evolution (€mn)
Office vs total Annual evolution (€mn)
20
04
20
05
20
06
20
07
20
08
20
09
20
10
20
11
20
12
20
13
20
14
20
15
20
16
20
17
20
18
20
06
20
07
20
08
20
09
20
10
20
11
20
12
20
13
20
14
20
15
20
16
20
17
20
18
0
0
500
400600
200
1,000
8001,000
1,500
1,2001,4001,6001,800
2000
2000
Source: Knight Frank
Type City Byer Seller Building description Area (sq m) Price (€)
Office Bucharest Dedeman Forte Partners The Bridge 80,000 200,000,000
Office BucharestLion’s Head Investments
Portland Trust si Ares Management
Oregon Park 45,000 165,000,000
Retail Bucharest MAS Real EstateAtrium European
Real Estate LimitedMilitari Shopping
Center54,100 95,000,000
Office Bucharest CA IMMO SkanskaCampus 6
– first building22,000 53,000,000
Office Bucuresti PPF Real Estate Search Corporation Crystal Tower 16,000 40,000,000
Retail Brasov Mitiska REIM Ballymore Group Praktiker Brasov 21,000 23,000,000
Industrial Timisoara WDP Dunca Imobiliare Dunca Logistics Center 37,000 21,000,000
Office Bucharest One United ImmofinanzBucharest Business
Center11,672 19,000,000
Industrial Cluj WDP CTP CTPark Cluj 33,000 19,000,000
Key InveSTMenT TRAnSACTIOnS 2018
KNIGHTFRANK.COM.RO | 13
ROMANIA MARket OVeRVIeW 2018–2019
12 | KNIGHTFRANK.COM.RO
SuPPly
The new supply delivered in 2018 totalled approximately 115,000 sq m across the entire country. Only 11,000 sq m of the new supply was in Bucharest, covered by the extension of Sun Plaza in Bucharest owned by S Immo.
The most active developer was Prime Kapital/MAS REI with new space delivered in four cities: Focsani, Baia Mare, Roman
Project Developer Type GlA (sq m)Openville Timisoara Iulius Group Extension 47,000
AFI Palace Barasov AF IEurope New project 45,000
Festival Shopping Center NEPI Rockcastle New project 42,000
Shopping City TarguMures NEPI Rockcastle New Project 33,000
ERA Park Iasi Prime Kapital Extension 30,000
Baneasa Shopping City BaneasaDevelopments Extension 25,000
Colloseum Retail Park Nova Imobiliare Extension 16,500
Iulius Mall Timisoara Iulius Group Extension 10,000
Veranda ProdplastImobiliare Extension 6,000
“ Due to the strong performance of malls in Bucharest, developers are heading for expansion, both in terms of new space completed and future pipeline.
“ with the exception of a few extensions taking place in Bucharest, investment is flowing to secondary and tertiary cities.
PlAnneD COMPleTIOnS OveR THe FOllOwInG 18 MOnTHS
Source: Knight Frank
Retail Market and Slobozia. NEPI also registered an important completion, a shopping centre in Santu Mare of approximately 29,000 sq m GLA.
The commercial gallery and Carrefour hypermarket within Bucharest’s Vitantis Shopping Center were closed at the beginning of 2018, an anticipated scenario for the underperforming scheme, located in a very competitive area of the city.
DeMAnDThe development of new retail stock in recent years has coincided with rising occupational demand. Retailer interest remains high and vacancy rates low.
Recent new entrants were represented by brands such as Vitapur and TAG Heuer in Bucharest (in Mega Mall and Baneasa Shopping City respectively), while Kik opened 2 stores in Oradea and Piatra Neamt and Under Armour opened their first store outside Bucharest, in Timisoara.
RenTSRental levels remained broadly unchanged in 2018, as the market was able to absorb the newly released supply in retail centres. In the first six months of 2018, prime rents for the leading schemes remained relatively stable. Rents were approx. €65–75/sq m/month for 100 sq m units for shopping centres in Bucharest and between €30–40/sq m/in the secondary cities.
FOReCASTDevelopers plan to add another 250,000 sq m to the map of the Romanian malls in the next 18 months. Nearly 60% of the spaces scheduled to be delivered during this period are extensions of the existing centres and, with the exception of three expansions, totalling 48,000 sq m — Veranda Mall, Colloseum Retail Park and Baneasa
Quarter Developer (location) GlA (sq m)Q1 S-Immo (Bucharest) 11,000
Q2 Element Development (Bistrita), Prime Kapital (Focsani)
14,000
Q3 - 0
Q4 Prime Kapital (Baia Mare, Roman, Slobozia), NEPI Rockcastle (Satu Mare)
90,000
Shopping City, investment is flowing to secondary and tertiary cities.
Given the volume of new completions due in the next two years, we expect to see many new market entrants.
HIGH STReeT ReTAIl MARKeT2018 market activity remained broadly stable in the high street sector.
New supply was mainly represented by spaces located at the groundfloor of new office buildings, targeting catering and services, or residential compounds targeting mainly services (supermarkets, laundry, etc).
New developments gave tenants the opportunity to open in areas they would not otherwise have considered. Such an example is the Timpuri Noi Square office project where during 2018 Fratelli Group opened Biutiful Downtown, Carnivale Food Market and Fratellini Bistro. Another active player in this type of space is Starbucks, who opened in Day Tower and Campus 6 office buildings.
In the luxury high street sector, the most significant opening was Hugo Boss, returning to Calea Victoriei, but this time in a different location, namely at the ground floor of Radisson Blu Hotel.
The traditional well-established retail areas from the residential neighborhoods remain the focus of food retailers, pharmacies, betting shops and casinos.
The Old City Center has evolved into a tourist area with a focus on leisure and hospitality and catering. The fashion sector is not performing well in this location — H&M, one of the most important fashion anchors, closed their store located on Lipscani street. However we anticipate a revival of the area amid the large number of residential accommodation announced in the next years.

KNIGHTFRANK.COM.RO | 15
ROMANIA MARket OVeRVIeW 2018–2019
14 | KNIGHTFRANK.COM.RO
SuPPly
Bucharest’s and other secondary cities’ major land supply comes from former factories, located in semi-central areas.
In Bucharest, the few remaining prime plots located in central, high end, residential areas are also sought-after by residential constructors and developers.
Investors are more interested in land that have already acquired development documents, including the essential PUZ permit, rather than incur two year delays for approvals.
DeMAnD
Demand trends remained positive in 2018, with high volumes of activity across all market segments. Well known developers have secured new sites for future developments.
AFI Europe bought a 43,000 sq m land plot situated in the proximity of AFI Park and AFI Cotroceni, part of the former industrial platform, UMEB. AFI Europe is planning to develop the commercial mix in the coming years.
Globalworth acquired two adjoined land plots in order to develop two office buildings, in the Gara Herastrau/Barbu Vacarescu area, near the Green Court office development. Globalworth also bought a land plot of 30 ha in Timisoara, near the TAP development.
Forte Partners bought two pieces of land in Bucharest, a 5,400 sq m plot from Hercesa and 8,700 sq m from UniCredit.
Hagag Development invested in two land plots and two buildings in Bucharest this year. One plot was on Eliade Street and one in Pipera, both for residential developments.
The end of 2018 was marked by important transactions in all segments:
Source: Knight Frank
“ ATenOR entered the residential segment with its first project, up-Site, through an aquisition of a plot of land in Floreasca, which was intermediated by Knight Frank.
City Byer location (area) use Size (sq m)Bucharest AFI Europe Politehnica Mixed 43,000
Bucharest One United Floreasca Office 26,000
Bucharest Portland Trust Pajura Office 16,000
Bucharest Globalworth BarbuVacarescu Office 13,000
Bucharest Forte Partners Orhideea Office 5,500
Bucharest One United Razoare Mixed 53,000
Bucharest Speedwell Jandarmeriei Residential 50,000
Bucharest 21Residence Pipera Residential 20,000
Bucharest Metropolitan Residence Jandarmeriei Residential 7,500
Bucharest Atenor Floreasca Residential 7,150
Stefanestii de Jos WDP Stefanestii de Jos Industrial 440,000
Timisoara Globalworth Timisoara Industrial 300,000
Brasov VGP Brasov Industrial 230,000
Bucharest Mitiska REIM Colentina Retail 90,000
RelevAnT lAnD TRAnSACTIOnS 2018
Source: Knight Frank
Office Barbu Vacarescu/ Calea Floreasca
1,500
Center-West 700–900Residential Prime areas 1,200–1,500
Periphery 250–300Retail Bucharest 350–500
Countryside 100–250
lAnD PlOT PRICeS By uSe (€/SQ M)
Portland Trust secured a new site for a future office development, through the acquisition of a 16,000 sq m land plot located in the Pajura area.
ATENOR, in a transaction intermediated by Knight Frank, bought a 7,150 sq m plot in Floreasca, which represented their entrance into the local residential market.
Mitiska REIM concluded the acquisition of the former Helitube plant in the Colentina area, and are planning to develop it into a retail unit.
Local developer One United bought the 53,000 sq m Ventilatorul site, which was a former industrial platform located in the Razoare area. They now look to develop it into a mixed use project.
PRICeS
Prices remained at a constant level throughout 2018.
FOReCAST
We expect the increase in demand for land plots suitable for residential and office use to continue, with developers actively searching to secure the best available sites. There will be high demand for land with all authorizations in place, as the process of obtaining all the documents needed for a development is lengthy.
Land Market
MOST ACTIve DevelOPeRS
AFI europe
Hagag Development
Globalworth
Portland Trust
Forte Partners
ATenOR
Mitiska ReIM
14 | KNIGHTFRANK.COM.RO
KNIGHTFRANK.COM.RO | 1716 | KNIGHTFRANK.COM.RO
ROMANIA MARket OVeRVIeW 2018–2019
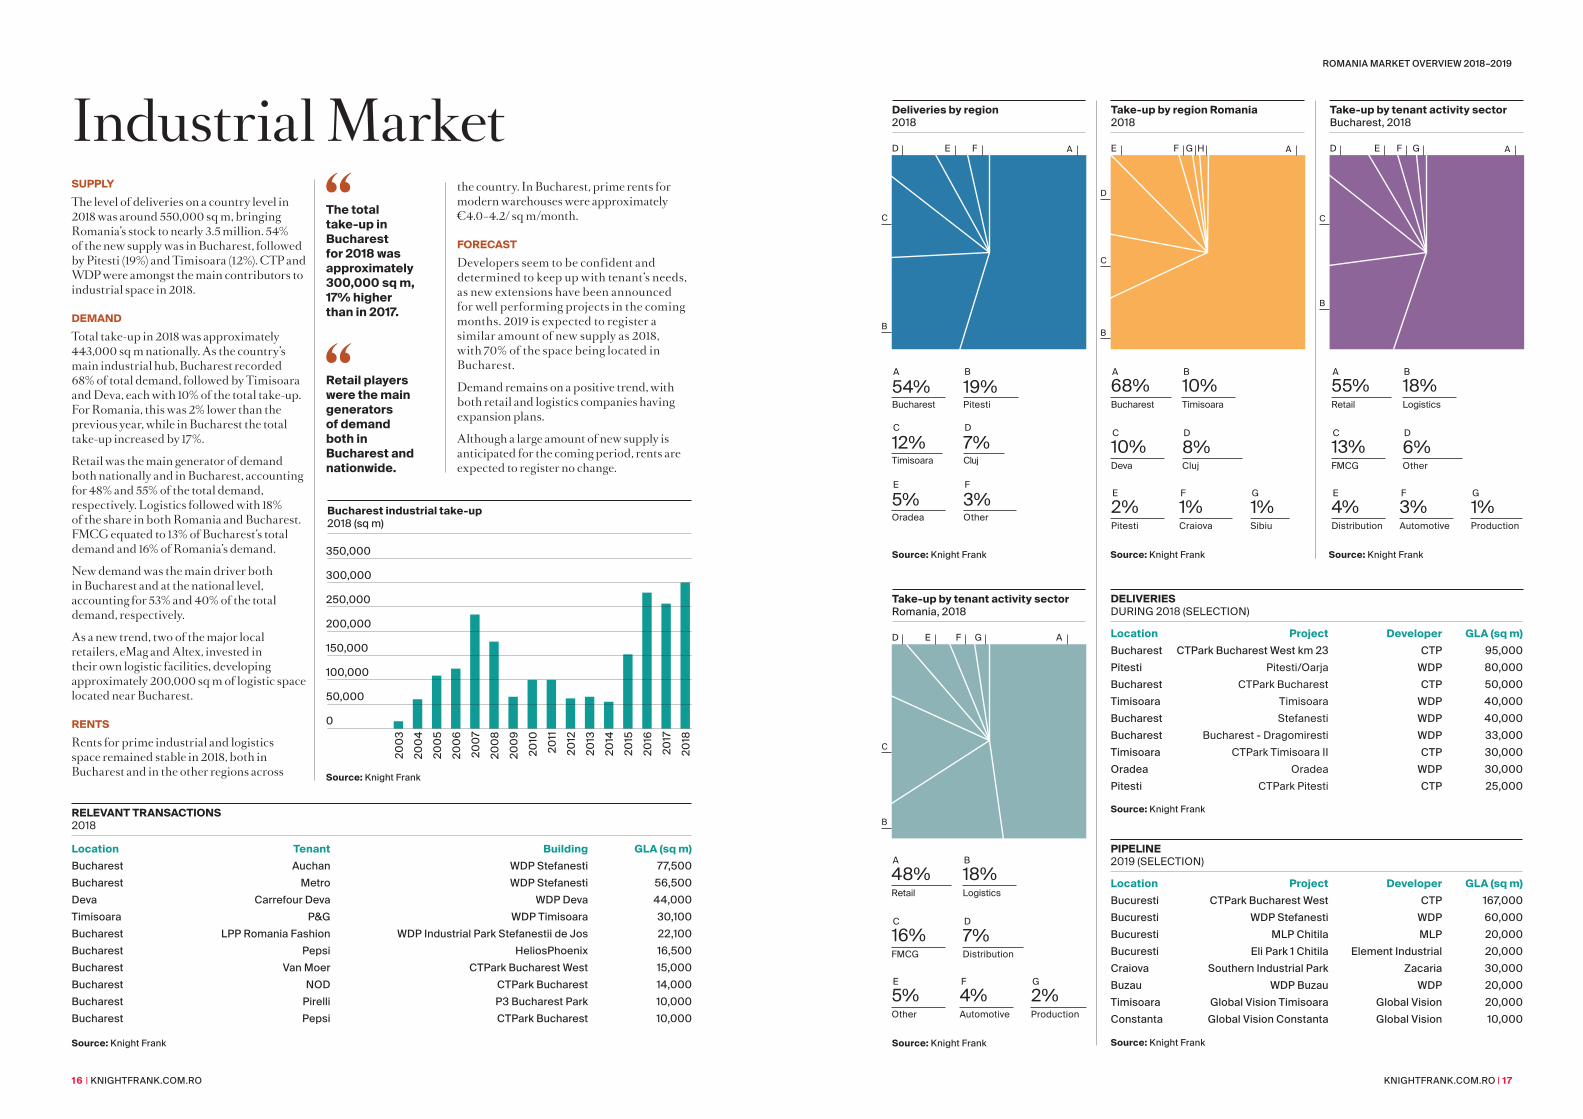
SuPPlyThe level of deliveries on a country level in 2018 was around 550,000 sq m, bringing Romania’s stock to nearly 3.5 million. 54% of the new supply was in Bucharest, followed by Pitesti (19%) and Timisoara (12%). CTP and WDP were amongst the main contributors to industrial space in 2018.
DeMAnDTotal take-up in 2018 was approximately 443,000 sq m nationally. As the country’s main industrial hub, Bucharest recorded 68% of total demand, followed by Timisoara and Deva, each with 10% of the total take-up. For Romania, this was 2% lower than the previous year, while in Bucharest the total take-up increased by 17%.
Retail was the main generator of demand both nationally and in Bucharest, accounting for 48% and 55% of the total demand, respectively. Logistics followed with 18% of the share in both Romania and Bucharest. FMCG equated to 13% of Bucharest’s total demand and 16% of Romania’s demand.
New demand was the main driver both in Bucharest and at the national level, accounting for 53% and 40% of the total demand, respectively.
As a new trend, two of the major local retailers, eMag and Altex, invested in their own logistic facilities, developing approximately 200,000 sq m of logistic space located near Bucharest.
RenTSRents for prime industrial and logistics space remained stable in 2018, both in Bucharest and in the other regions across
Industrial Market
Source: Knight Frank
Source: Knight Frank
Source: Knight Frank
location Project Developer GlA (sq m)Bucharest CTPark Bucharest West km 23 CTP 95,000
Pitesti Pitesti/Oarja WDP 80,000
Bucharest CTPark Bucharest CTP 50,000
Timisoara Timisoara WDP 40,000
Bucharest Stefanesti WDP 40,000
Bucharest Bucharest - Dragomiresti WDP 33,000
Timisoara CTPark Timisoara II CTP 30,000
Oradea Oradea WDP 30,000
Pitesti CTPark Pitesti CTP 25,000
location Project Developer GlA (sq m)Bucuresti CTPark Bucharest West CTP 167,000
Bucuresti WDP Stefanesti WDP 60,000
Bucuresti MLP Chitila MLP 20,000
Bucuresti Eli Park 1 Chitila Element Industrial 20,000
Craiova Southern Industrial Park Zacaria 30,000
Buzau WDP Buzau WDP 20,000
Timisoara Global Vision Timisoara Global Vision 20,000
Constanta Global Vision Constanta Global Vision 10,000
DelIveRIeS DURING 2018 (SELECTION)
PIPelIne 2019 (SELECTION)
location Tenant Building GlA (sq m)Bucharest Auchan WDP Stefanesti 77,500
Bucharest Metro WDP Stefanesti 56,500
Deva Carrefour Deva WDP Deva 44,000
Timisoara P&G WDP Timisoara 30,100
Bucharest LPP Romania Fashion WDP Industrial Park Stefanestii de Jos 22,100
Bucharest Pepsi HeliosPhoenix 16,500
Bucharest Van Moer CTPark Bucharest West 15,000
Bucharest NOD CTPark Bucharest 14,000
Bucharest Pirelli P3 Bucharest Park 10,000
Bucharest Pepsi CTPark Bucharest 10,000
RelevAnT TRAnSACTIOnS 2018
“ The total take-up in Bucharest for 2018 was approximately 300,000 sq m, 17% higher than in 2017.
“ Retail players were the main generators of demand both in Bucharest and nationwide.
Source: Knight Frank
Deliveries by region 2018
A
C
B
D
A B
54% 19%Bucharest Pitesti
C
12%Timisoara
D
7%Cluj
E
5%Oradea
F
3%Other
E F
Source: Knight Frank
Take-up by region Romania 2018
A
C
D
B
E
A B68% 10%Bucharest Timisoara
C10%Deva
F HG
D
8%Cluj
1%Sibiu
E F2% 1%Pitesti Craiova
G
Source: Knight Frank
Take-up by tenant activity sector Romania, 2018
C
B
D E F G A
A B48% 18%Retail Logistics
C16%FMCG
D
7%Distribution
2%Production
E F5% 4%Other Automotive
G
Take-up by tenant activity sector Bucharest, 2018
Source: Knight Frank
C
B
D AE F G
A B55% 18%Retail Logistics
C13%FMCG
D
6%Other
1%Production
E F4% 3%Distribution Automotive
G
the country. In Bucharest, prime rents for modern warehouses were approximately €4.0–4.2/ sq m/month.
FOReCASTDevelopers seem to be confident and determined to keep up with tenant’s needs, as new extensions have been announced for well performing projects in the coming months. 2019 is expected to register a similar amount of new supply as 2018, with 70% of the space being located in Bucharest.
Demand remains on a positive trend, with both retail and logistics companies having expansion plans.
Although a large amount of new supply is anticipated for the coming period, rents are expected to register no change.
Source: Knight Frank
0
50,000
100,000
150,000
200,000
250,000
300,000
350,000
Bucharest industrial take-up 2018 (sq m)
20
03
20
04
20
05
20
06
20
07
20
08
20
09
20
10
20
11
20
12
20
13
20
14
20
15
20
16
20
17
20
18
ROMANIA MARket OVeRVIeW 2018–2019
KNIGHTFRANK.COM.RO | 1918 | KNIGHTFRANK.COM.RO
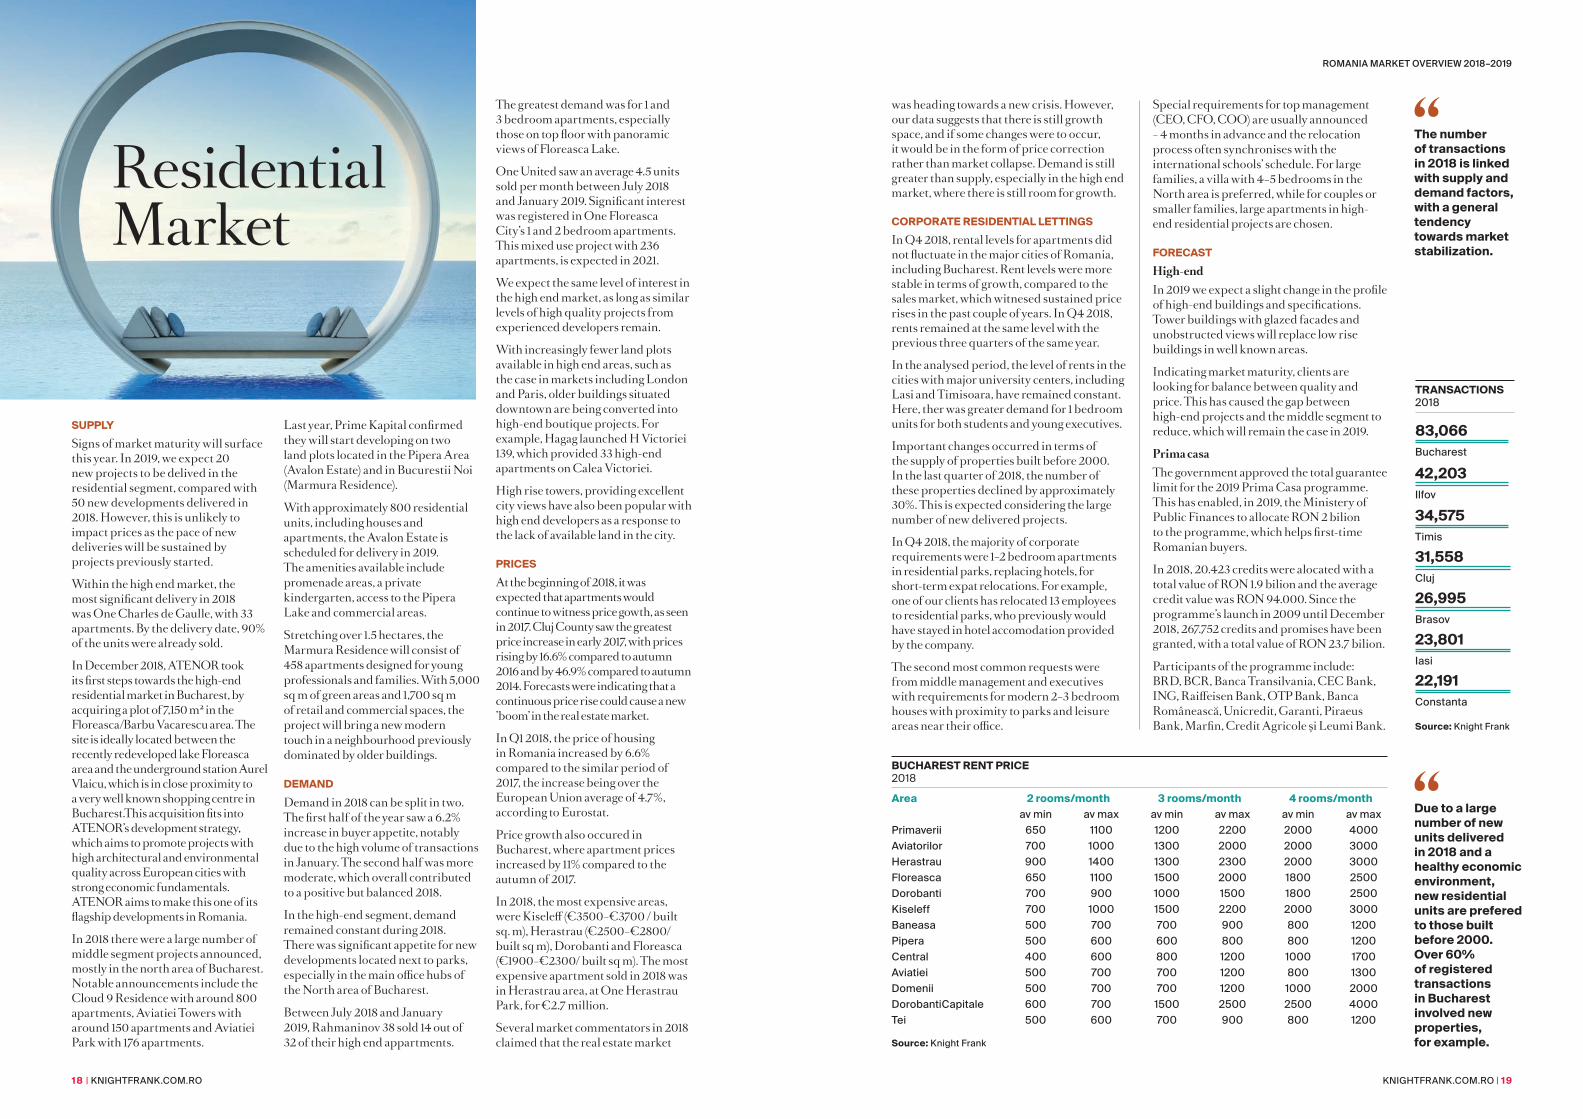
Residential Market
SuPPlySigns of market maturity will surface this year. In 2019, we expect 20 new projects to be delived in the residential segment, compared with 50 new developments delivered in 2018. However, this is unlikely to impact prices as the pace of new deliveries will be sustained by projects previously started.
Within the high end market, the most significant delivery in 2018 was One Charles de Gaulle, with 33 apartments. By the delivery date, 90% of the units were already sold.
In December 2018, ATENOR took its first steps towards the high-end residential market in Bucharest, by acquiring a plot of 7,150 m² in the Floreasca/Barbu Vacarescu area. The site is ideally located between the recently redeveloped lake Floreasca area and the underground station Aurel Vlaicu, which is in close proximity to a very well known shopping centre in Bucharest.This acquisition fits into ATENOR’s development strategy, which aims to promote projects with high architectural and environmental quality across European cities with strong economic fundamentals. ATENOR aims to make this one of its flagship developments in Romania.
In 2018 there were a large number of middle segment projects announced, mostly in the north area of Bucharest. Notable announcements include the Cloud 9 Residence with around 800 apartments, Aviatiei Towers with around 150 apartments and Aviatiei Park with 176 apartments.
Last year, Prime Kapital confirmed they will start developing on two land plots located in the Pipera Area (Avalon Estate) and in Bucurestii Noi (Marmura Residence).
With approximately 800 residential units, including houses and apartments, the Avalon Estate is scheduled for delivery in 2019. The amenities available include promenade areas, a private kindergarten, access to the Pipera Lake and commercial areas.
Stretching over 1.5 hectares, the Marmura Residence will consist of 458 apartments designed for young professionals and families. With 5,000 sq m of green areas and 1,700 sq m of retail and commercial spaces, the project will bring a new modern touch in a neighbourhood previously dominated by older buildings.
DeMAnDDemand in 2018 can be split in two. The first half of the year saw a 6.2% increase in buyer appetite, notably due to the high volume of transactions in January. The second half was more moderate, which overall contributed to a positive but balanced 2018.
In the high-end segment, demand remained constant during 2018. There was significant appetite for new developments located next to parks, especially in the main office hubs of the North area of Bucharest.
Between July 2018 and January 2019, Rahmaninov 38 sold 14 out of 32 of their high end appartments.
“ The number of transactions in 2018 is linked with supply and demand factors, with a general tendency towards market stabilization.
“ Due to a large number of new units delivered in 2018 and a healthy economic environment, new residential units are prefered to those built before 2000. Over 60% of registered transactions in Bucharest involved new properties, for example.
TRAnSACTIOnS 2018
83,066Bucharest
42,203Ilfov
34,575Timis
31,558Cluj
26,995Brasov
23,801Iasi
22,191Constanta
Source: Knight Frank
Source: Knight Frank
Area 2 rooms/month 3 rooms/month 4 rooms/monthav min av max av min av max av min av max
Primaverii 650 1100 1200 2200 2000 4000
Aviatorilor 700 1000 1300 2000 2000 3000
Herastrau 900 1400 1300 2300 2000 3000
Floreasca 650 1100 1500 2000 1800 2500
Dorobanti 700 900 1000 1500 1800 2500
Kiseleff 700 1000 1500 2200 2000 3000
Baneasa 500 700 700 900 800 1200
Pipera 500 600 600 800 800 1200
Central 400 600 800 1200 1000 1700
Aviatiei 500 700 700 1200 800 1300
Domenii 500 700 700 1200 1000 2000
DorobantiCapitale 600 700 1500 2500 2500 4000
Tei 500 600 700 900 800 1200
BuCHAReST RenT PRICe 2018
The greatest demand was for 1 and 3 bedroom apartments, especially those on top floor with panoramic views of Floreasca Lake.
One United saw an average 4.5 units sold per month between July 2018 and January 2019. Significant interest was registered in One Floreasca City’s 1 and 2 bedroom apartments. This mixed use project with 236 apartments, is expected in 2021.
We expect the same level of interest in the high end market, as long as similar levels of high quality projects from experienced developers remain.
With increasingly fewer land plots available in high end areas, such as the case in markets including London and Paris, older buildings situated downtown are being converted into high-end boutique projects. For example, Hagag launched H Victoriei 139, which provided 33 high-end apartments on Calea Victoriei.
High rise towers, providing excellent city views have also been popular with high end developers as a response to the lack of available land in the city.
PRICeSAt the beginning of 2018, it was expected that apartments would continue to witness price gowth, as seen in 2017. Cluj County saw the greatest price increase in early 2017, with prices rising by 16.6% compared to autumn 2016 and by 46.9% compared to autumn 2014. Forecasts were indicating that a continuous price rise could cause a new ’boom’ in the real estate market.
In Q1 2018, the price of housing in Romania increased by 6.6% compared to the similar period of 2017, the increase being over the European Union average of 4.7%, according to Eurostat.
Price growth also occured in Bucharest, where apartment prices increased by 11% compared to the autumn of 2017.
In 2018, the most expensive areas, were Kiseleff (€3500–€3700 / built sq. m), Herastrau (€2500–€2800/ built sq m), Dorobanti and Floreasca (€1900–€2300/ built sq m). The most expensive apartment sold in 2018 was in Herastrau area, at One Herastrau Park, for €2.7 million.
Several market commentators in 2018 claimed that the real estate market
was heading towards a new crisis. However, our data suggests that there is still growth space, and if some changes were to occur, it would be in the form of price correction rather than market collapse. Demand is still greater than supply, especially in the high end market, where there is still room for growth.
CORPORATe ReSIDenTIAl leTTInGS In Q4 2018, rental levels for apartments did not fluctuate in the major cities of Romania, including Bucharest. Rent levels were more stable in terms of growth, compared to the sales market, which witnesed sustained price rises in the past couple of years. In Q4 2018, rents remained at the same level with the previous three quarters of the same year.
In the analysed period, the level of rents in the cities with major university centers, including Lasi and Timisoara, have remained constant. Here, ther was greater demand for 1 bedroom units for both students and young executives.
Important changes occurred in terms of the supply of properties built before 2000. In the last quarter of 2018, the number of these properties declined by approximately 30%. This is expected considering the large number of new delivered projects.
In Q4 2018, the majority of corporate requirements were 1–2 bedroom apartments in residential parks, replacing hotels, for short-term expat relocations. For example, one of our clients has relocated 13 employees to residential parks, who previously would have stayed in hotel accomodation provided by the company.
The second most common requests were from middle management and executives with requirements for modern 2–3 bedroom houses with proximity to parks and leisure areas near their office.
Special requirements for top management (CEO, CFO, COO) are usually announced – 4 months in advance and the relocation process often synchronises with the international schools’ schedule. For large families, a villa with 4–5 bedrooms in the North area is preferred, while for couples or smaller families, large apartments in high-end residential projects are chosen.
FOReCASTHigh-endIn 2019 we expect a slight change in the profile of high-end buildings and specifications. Tower buildings with glazed facades and unobstructed views will replace low rise buildings in well known areas.
Indicating market maturity, clients are looking for balance between quality and price. This has caused the gap between high-end projects and the middle segment to reduce, which will remain the case in 2019.
Prima casaThe government approved the total guarantee limit for the 2019 Prima Casa programme. This has enabled, in 2019, the Ministery of Public Finances to allocate RON 2 bilion to the programme, which helps first-time Romanian buyers.
In 2018, 20.423 credits were alocated with a total value of RON 1.9 bilion and the average credit value was RON 94.000. Since the programme’s launch in 2009 until December 2018, 267.752 credits and promises have been granted, with a total value of RON 23.7 bilion.
Participants of the programme include: BRD, BCR, Banca Transilvania, CEC Bank, ING, Raiffeisen Bank, OTP Bank, Banca Românească, Unicredit, Garanti, Piraeus Bank, Marfin, Credit Agricole și Leumi Bank.
ROMANIA MARket OVeRVIeW 2018–2019
KNIGHTFRANK.COM.RO | 2120 | KNIGHTFRANK.COM.RO
Where does your money go in 2019?
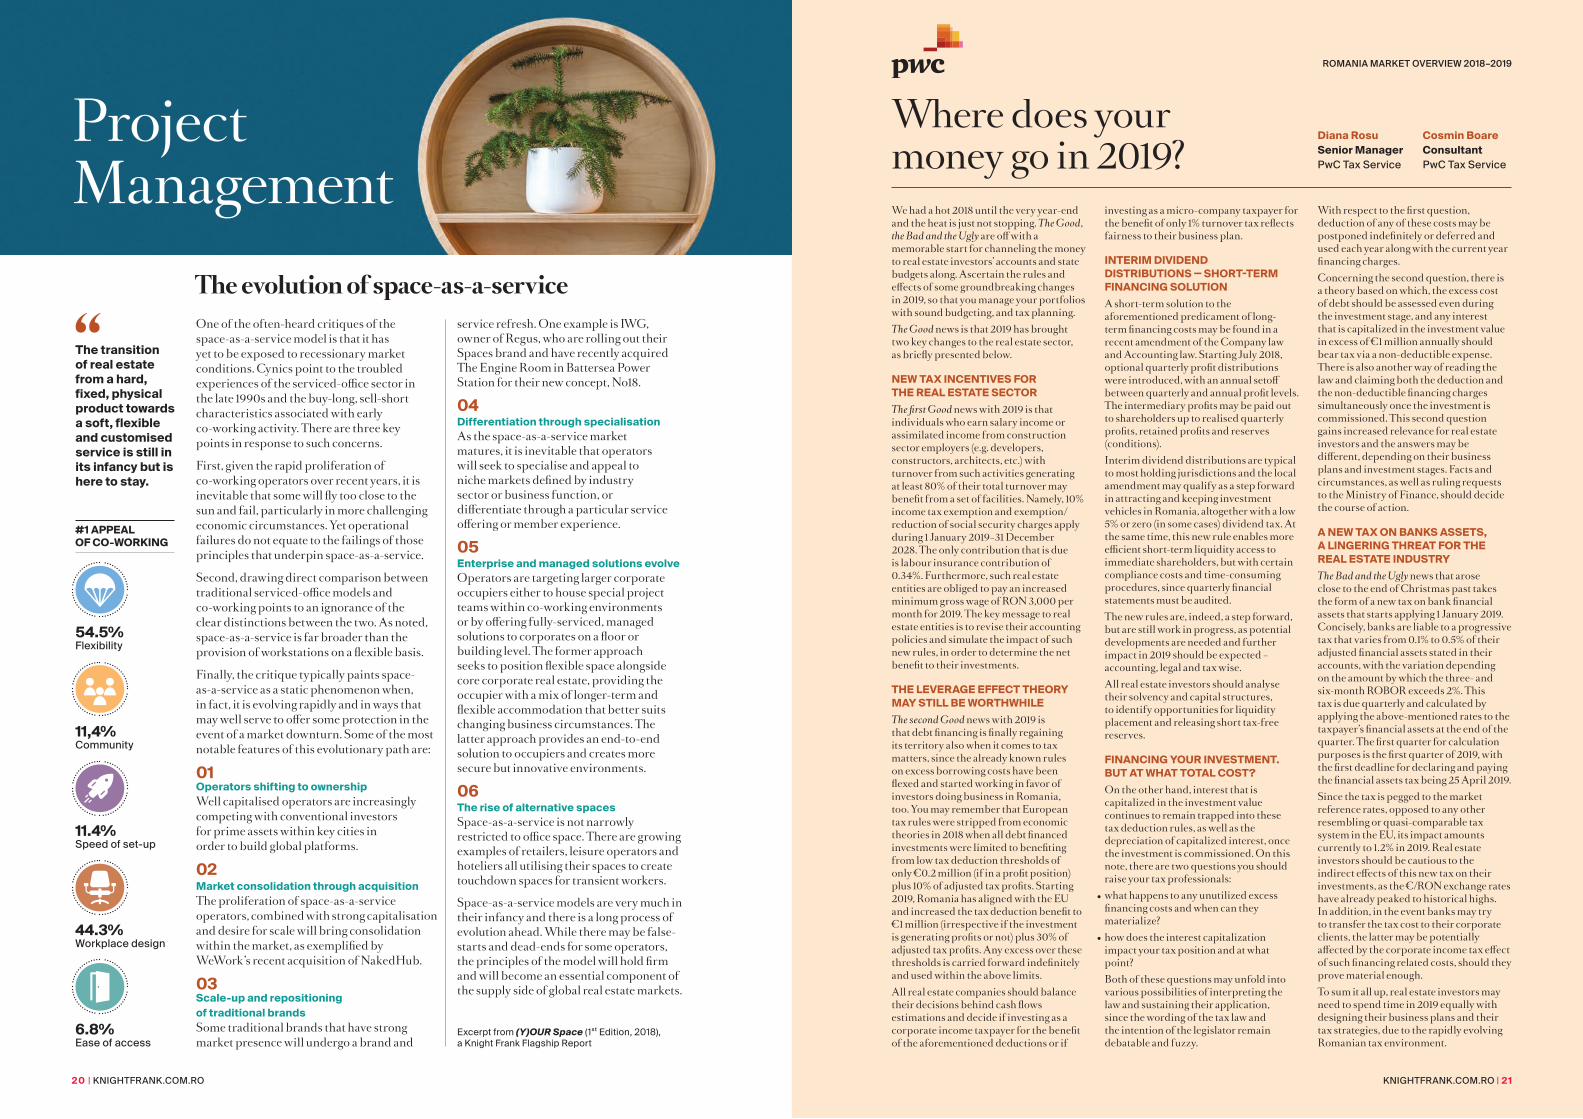
One of the often-heard critiques of the space-as-a-service model is that it has yet to be exposed to recessionary market conditions. Cynics point to the troubled experiences of the serviced-office sector in the late 1990s and the buy-long, sell-short characteristics associated with early co-working activity. There are three key points in response to such concerns.
First, given the rapid proliferation of co-working operators over recent years, it is inevitable that some will fly too close to the sun and fail, particularly in more challenging economic circumstances. Yet operational failures do not equate to the failings of those principles that underpin space-as-a-service.
Second, drawing direct comparison between traditional serviced-office models and co-working points to an ignorance of the clear distinctions between the two. As noted, space-as-a-service is far broader than the provision of workstations on a flexible basis.
Finally, the critique typically paints space-as-a-service as a static phenomenon when, in fact, it is evolving rapidly and in ways that may well serve to offer some protection in the event of a market downturn. Some of the most notable features of this evolutionary path are:
01 Operators shifting to ownershipWell capitalised operators are increasingly competing with conventional investors for prime assets within key cities in order to build global platforms.
02 Market consolidation through acquisitionThe proliferation of space-as-a-service operators, combined with strong capitalisation and desire for scale will bring consolidation within the market, as exemplified by WeWork’s recent acquisition of NakedHub.
03 Scale-up and repositioning of traditional brandsSome traditional brands that have strong market presence will undergo a brand and
Diana Rosu Senior Manager PwC Tax Service
Cosmin Boare Consultant PwC Tax Service
We had a hot 2018 until the very year-end and the heat is just not stopping. The Good, the Bad and the Ugly are off with a memorable start for channeling the money to real estate investors’ accounts and state budgets along. Ascertain the rules and effects of some groundbreaking changes in 2019, so that you manage your portfolios with sound budgeting, and tax planning.The Good news is that 2019 has brought two key changes to the real estate sector, as briefly presented below.
new TAx InCenTIveS FOR THe ReAl eSTATe SeCTORThe first Good news with 2019 is that individuals who earn salary income or assimilated income from construction sector employers (e.g. developers, constructors, architects, etc.) with turnover from such activities generating at least 80% of their total turnover may benefit from a set of facilities. Namely, 10% income tax exemption and exemption/reduction of social security charges apply during 1 January 2019–31 December 2028. The only contribution that is due is labour insurance contribution of 0.34%. Furthermore, such real estate entities are obliged to pay an increased minimum gross wage of RON 3,000 per month for 2019. The key message to real estate entities is to revise their accounting policies and simulate the impact of such new rules, in order to determine the net benefit to their investments.
THe leveRAGe eFFeCT THeORy MAy STIll Be wORTHwHIleThe second Good news with 2019 is that debt financing is finally regaining its territory also when it comes to tax matters, since the already known rules on excess borrowing costs have been flexed and started working in favor of investors doing business in Romania, too. You may remember that European tax rules were stripped from economic theories in 2018 when all debt financed investments were limited to benefiting from low tax deduction thresholds of only €0.2 million (if in a profit position) plus 10% of adjusted tax profits. Starting 2019, Romania has aligned with the EU and increased the tax deduction benefit to €1 million (irrespective if the investment is generating profits or not) plus 30% of adjusted tax profits. Any excess over these thresholds is carried forward indefinitely and used within the above limits.All real estate companies should balance their decisions behind cash flows estimations and decide if investing as a corporate income taxpayer for the benefit of the aforementioned deductions or if
investing as a micro-company taxpayer for the benefit of only 1% turnover tax reflects fairness to their business plan.
InTeRIM DIvIDenD DISTRIBuTIOnS — SHORT-TeRM FInAnCInG SOluTIOnA short-term solution to the aforementioned predicament of long-term financing costs may be found in a recent amendment of the Company law and Accounting law. Starting July 2018, optional quarterly profit distributions were introduced, with an annual setoff between quarterly and annual profit levels. The intermediary profits may be paid out to shareholders up to realised quarterly profits, retained profits and reserves (conditions).Interim dividend distributions are typical to most holding jurisdictions and the local amendment may qualify as a step forward in attracting and keeping investment vehicles in Romania, altogether with a low 5% or zero (in some cases) dividend tax. At the same time, this new rule enables more efficient short-term liquidity access to immediate shareholders, but with certain compliance costs and time-consuming procedures, since quarterly financial statements must be audited.The new rules are, indeed, a step forward, but are still work in progress, as potential developments are needed and further impact in 2019 should be expected – accounting, legal and tax wise.All real estate investors should analyse their solvency and capital structures, to identify opportunities for liquidity placement and releasing short tax-free reserves.
FInAnCInG yOuR InveSTMenT. BuT AT wHAT TOTAl COST?On the other hand, interest that is capitalized in the investment value continues to remain trapped into these tax deduction rules, as well as the depreciation of capitalized interest, once the investment is commissioned. On this note, there are two questions you should raise your tax professionals:what happens to any unutilized excess financing costs and when can they materialize?how does the interest capitalization impact your tax position and at what point?Both of these questions may unfold into various possibilities of interpreting the law and sustaining their application, since the wording of the tax law and the intention of the legislator remain debatable and fuzzy.
With respect to the first question, deduction of any of these costs may be postponed indefinitely or deferred and used each year along with the current year financing charges.Concerning the second question, there is a theory based on which, the excess cost of debt should be assessed even during the investment stage, and any interest that is capitalized in the investment value in excess of €1 million annually should bear tax via a non-deductible expense. There is also another way of reading the law and claiming both the deduction and the non-deductible financing charges simultaneously once the investment is commissioned. This second question gains increased relevance for real estate investors and the answers may be different, depending on their business plans and investment stages. Facts and circumstances, as well as ruling requests to the Ministry of Finance, should decide the course of action.
A new TAx On BAnKS ASSeTS, A lInGeRInG THReAT FOR THe ReAl eSTATe InDuSTRyThe Bad and the Ugly news that arose close to the end of Christmas past takes the form of a new tax on bank financial assets that starts applying 1 January 2019. Concisely, banks are liable to a progressive tax that varies from 0.1% to 0.5% of their adjusted financial assets stated in their accounts, with the variation depending on the amount by which the three- and six-month ROBOR exceeds 2%. This tax is due quarterly and calculated by applying the above-mentioned rates to the taxpayer’s financial assets at the end of the quarter. The first quarter for calculation purposes is the first quarter of 2019, with the first deadline for declaring and paying the financial assets tax being 25 April 2019.Since the tax is pegged to the market reference rates, opposed to any other resembling or quasi-comparable tax system in the EU, its impact amounts currently to 1.2% in 2019. Real estate investors should be cautious to the indirect effects of this new tax on their investments, as the €/RON exchange rates have already peaked to historical highs. In addition, in the event banks may try to transfer the tax cost to their corporate clients, the latter may be potentially affected by the corporate income tax effect of such financing related costs, should they prove material enough.To sum it all up, real estate investors may need to spend time in 2019 equally with designing their business plans and their tax strategies, due to the rapidly evolving Romanian tax environment.
The evolution of space-as-a-service
KNIGHTFRANK.COM.RO | 21
•
•
ROMANIA MARket OVeRVIeW 2018–2019
service refresh. One example is IWG, owner of Regus, who are rolling out their Spaces brand and have recently acquired The Engine Room in Battersea Power Station for their new concept, No18.
04 Differentiation through specialisationAs the space-as-a-service market matures, it is inevitable that operators will seek to specialise and appeal to niche markets defined by industry sector or business function, or differentiate through a particular service offering or member experience.
05 enterprise and managed solutions evolveOperators are targeting larger corporate occupiers either to house special project teams within co-working environments or by offering fully-serviced, managed solutions to corporates on a floor or building level. The former approach seeks to position flexible space alongside core corporate real estate, providing the occupier with a mix of longer-term and flexible accommodation that better suits changing business circumstances. The latter approach provides an end-to-end solution to occupiers and creates more secure but innovative environments.
06 The rise of alternative spacesSpace-as-a-service is not narrowly restricted to office space. There are growing examples of retailers, leisure operators and hoteliers all utilising their spaces to create touchdown spaces for transient workers.
Space-as-a-service models are very much in their infancy and there is a long process of evolution ahead. While there may be false-starts and dead-ends for some operators, the principles of the model will hold firm and will become an essential component of the supply side of global real estate markets.
Excerpt from (Y)OUR Space (1st Edition, 2018), a Knight Frank Flagship Report
“ The transition of real estate from a hard, fixed, physical product towards a soft, flexible and customised service is still in its infancy but is here to stay.
#1 APPeAl OF CO-wORKInG
54.5%Flexibility
11,4%Community
11.4%Speed of set-up
44.3%Workplace design
6.8%Ease of access
Project Management
KNIGHTFRANK.COM.RO | 23
ROMANIA MARket OVeRVIeW 2018–2019
22 | KNIGHTFRANK.COM.RO
FISCAl InCenTIveS In COnSTRuCTIOnS — GeO 114/2018On 29 December 2018, the new Government Emergency Ordinance no. 114/2018 (GEO 114/2018) came into effect. The GEO is supposed to have a significant impact in several key industry sectors. One of such many effects is in the construction industry.
TAx exeMPTIOnS FOR eMPlOyeeS In THe COnSTRuCTIOn SeCTOR Employees hired by employers with business in constructions or in manufacturing construction materials (e.g. construction activities, manufacturing of various construction materials, architecture activities, engineering and technical consultancy services) are exempt of the 10% personal income tax.
The measure is supposed to be a temporary one, applying between 1 January 2019 to 31 December 2028.
The exemption will apply if at least 80% of the employer’s turnover results from the above-mentioned activities. The turnover will be determined from the beginning of the year, including the month when the exemption is applied.
To qualify for this exemption, employees must have a gross income of between RON 3,000 (€638) and RON 30,000 (€6,380 at an exchange rate of RON 4.7/€ 1) received through an employment agreement.
Furthermore, for individuals working in the construction sector under an employment agreement from 1 January 2019 to 31 December 2028, the social security contribution rate will be reduced by 3.75%. Also, during the same period, these individuals are exempt from making health insurance contributions.
This law also affects the labour insurance contribution due by the employer, which has been reduced to approximately 0.34%. The above tax incentives for the construction sector apply from January 2019.
BOOST OF THe MInIMuM wAGe A correlated measure of the Government is setting the level of the minimum wage in the industry to RON 3,000, while the typical minimum wage is between RON 2080 and RON 2350.
IS IT OK? IS IT SuFFICIenT?A similar fiscal incentive had boosted the IT industry in Romania, several years ago. The set of measures was beneficial in various respects and notably the office leasing activity saw a significant growth, not only in Bucharest, but also in other major cities around the country. In the same time, there were also critics for inequalities in levels of labour taxation across the economy, so the Government is publicly aware that there are other sectors with tradition and potential of growth, like the textile industry, who may attempt to get next in line for similar incentives.
For now, like in IT, only time will tell if the new incentives in the construction sector has been actually based on an accurate read of the economy’s existing predisposition to a significant growth in this particular industry, as opposed to others. In addition, there may be practical challenges as regards the bureaucracy (both at the level of companies and of the fiscal authorities) around the monthly submission and verification of the statements regarding the fulfilment of the legal criteria for the application of such incentives.
In any case, such measures combined with a potential change in the legislation around “Prima Casa” scheme that seems to be next on the Government agenda may create certain more favourable premises for the further development of residential sector, including in secondary and tertiary cities where there is quite significant potential for growth.
CMS_LawTax_CMYK_19-27.eps
Roxana Fratila Head of Real estate & ConstructionAndrei Tercu Senior Tax ManagerCMS Cameron McKenna Nabarro Olswang LLP SCP
Connecting people & property, perfectly.
22 | KNIGHTFRANK.COM.RO
“ GeO 114/2018 is supposed to have a significant impact in several key industry sectors
Hot topic: What do GEO 114/2018 incentives mean for the construction sector in Romania?

Knight Frank Research Reports are available at KnightFrank.com/Research
To the Point 2019
Romania Market Overview H1 2018
Wealth Report 2019
RECENT MARKET RESEARCH PUBLICATIONS © Knight Frank LLP 2019This report is published for general information only and not to be relied upon in any way. Although high standards have been used in the preparation of the information, analysis, views and projections presented in this report, no responsibility or liability whatsoever can be accepted by Knight Frank LLP or Knight Frank Romania SRL for any loss or damage resultant from any use of, reliance on or reference to the contents of this document. As a general report, this material does not necessarily represent the view of Knight Frank LLP and Knight Frank Romania SRL in relation to particular properties or projects. Reproduction of this report in whole or in part is not allowed without prior written approval of Knight Frank LLP and Knight Frank Romania SRL to the form and content within which it appears. Knight Frank LLP is a limited liability partnership registered in England with registered number OC305934. Our registered office is 55 Baker Street, London, W1U 8AN, where you may look at a list of members’ names.
KnIGHT FRAnK ROMAnIA
Horatiu Florescu Chairman & CEO T: +40 21 380 85 85 e: [email protected]
Roxana Bencze COO T: +40 21 380 85 85 e: [email protected]
Natalia Gross Head of Marketing and Communications T: +40 21 380 85 85 e: [email protected]
Ileana Stanciu-Necea Head of Research T: +40 21 380 85 85 e: [email protected]
euROPeAn ReSeARCH
Antonia Haralambous Research Analyst T: +44 20 3866 8033 e: [email protected]
KNIGHTFRANK.COM.RO