Corporate Market Power in Romania
50
Policy Research Working Paper 9487 Corporate Market Power in Romania Assessing Recent Trends, Drivers, and Implications for Competition Mariana Iootty Georgiana Pop Jorge Pena Finance, Competitiveness and Innovation Global Practice December 2020 Public Disclosure Authorized Public Disclosure Authorized Public Disclosure Authorized Public Disclosure Authorized
Transcript of Corporate Market Power in Romania

Policy Research Working Paper 9487
Corporate Market Power in Romania
Assessing Recent Trends Drivers and Implications for Competition
Mariana IoottyGeorgiana Pop
Jorge Pena
Finance Competitiveness and Innovation Global Practice December 2020
Pub
lic D
iscl
osur
e A
utho
rized
Pub
lic D
iscl
osur
e A
utho
rized
Pub
lic D
iscl
osur
e A
utho
rized
Pub
lic D
iscl
osur
e A
utho
rized
Produced by the Research Support Team
Abstract
The Policy Research Working Paper Series disseminates the findings of work in progress to encourage the exchange of ideas about development issues An objective of the series is to get the findings out quickly even if the presentations are less than fully polished The papers carry the names of the authors and should be cited accordingly The findings interpretations and conclusions expressed in this paper are entirely those of the authors They do not necessarily represent the views of the International Bank for Reconstruction and DevelopmentWorld Bank and its affiliated organizations or those of the Executive Directors of the World Bank or the governments they represent
Policy Research Working Paper 9487
This paper explores firm-level heterogeneity to identify the underlying drivers of market power trends in Romania and the implications for competition and economic growth The results show that the (sales-weighted) average markup in Romania increased by around 15 percent between 2008 and 2017 A key driving force behind this aggregate trend was the ability of a small fraction of firmsmdashthe top decile firms in the markup distributionmdashto increase their markups These firms do not seem to follow the typical superstar firmsrsquo profile they are smaller less efficient and less likely to invest in intangible assets than other firms in the markup distribution and overrepresented in less knowl-edge-intensive service sectors (for example the retail and trade sector) This suggests that the increase in markups in Romania might be associated with an environment that is less conducive to competition A decomposition exer-cise shows that the increase in aggregate markups has been
driven mostly by incumbents rather than new entrants and exiting firms which could be interpreted as a sign of consolidation of market power among existing firms The paper also finds that certain firm characteristics matter to explain differences in markup performance size age research and development profile export propensity loca-tion and especially ownership Further the paper shows that additional productivity dividends are associated with increased competition in Romania Overall these findings illustrate potential policy angles that need to be tackled to enhance market contestability and boost productivity growth such as addressing regulations that restrict entry and rivalry in the retail trade sector which concentrates a substantial proportion of high-markup firms as well as promoting competitive neutrality across markets where public and private actors compete
This paper is a product of the Finance Competitiveness and Innovation Global Practice It builds on the Technical Assistance on Assessing the Effects of State Aid on Market Outcomes in Romania (2018ndash2020) The project was funded by the European Union via the Structural Reform Support Programme (SRSP) and implemented by the World Bank in cooperation with the European Commissionrsquos Directorate-General for Reform Support (DG REFORM) It is part of a larger effort by the World Bank to provide open access to its research and make a contribution to development policy discussions around the world Policy Research Working Papers are also posted on the Web at httpwwwworldbankorgprwp The authors may be contacted at mioottyworldbankorg and gpopworldbankorg
Corporate Market Power in Romania Assessing Recent Trends Drivers and Implications for Competition
Mariana Iootty Georgiana Popyen and Jorge Penaamp
Originally published in the Policy Research Working Paper Series on December 2020 This version is updated on March 2021
To obtain the originally published version please email prwpworldbankorg
Keywords market power competition productivity resource allocation
JEL codes D22 D24 D40 L22
___________________________________________________________________________
Comments to earlier versions of this paper were provided by a team from Romanian Competition Council thatincluded Alis Barbulescu Daniel Diaconescu Sorina Palan Stefan Popescu Mihai Dragoi Oana Neg PaulPrisecaru Oana Romano Vlad Nerau Ionut Busega and Mihai Busu The authors are equally grateful forcomments from the European Commission provided by Iulia Mirela Serban (DG REFORM) Enrico Pesaresi (DGREFORM) and Daniele Vidoni (DG COMP) Hernan Winkler Richard Record and Catalin Pauna - all from theWorld Bank also provided valuable comments to an earlier version of this paper
The World Bank mioottyworldbankorg yenThe World Bank gpopworldbankorgamp IE Business School Madrid Spain jpifacultyieedu
2
1 INTRODUCTION AND MOTIVATION
A key stylized fact that has emerged in recent years is that corporate market power has increased at the global level Drawing upon different methodologies empirical literature produced in the past 10 years indicates that average levels of market power have been increasing across countries in both developed and emerging economies This trend has been measured through different metrics of market power such as industry sales concentration ratios firm-level profit rates or firm-level price-cost margins For instance Grullon Larkin and Michaely (2018) show that concentration and profit rates have increased across most US industries De Loecker Eeckhout and Unger (2020) estimate firm-level pricendashmarginal cost markups in the United States and find evidence that the revenue-weighted average markup climbed from about 12 in 1980 to 16 in 2014 De Loecker and Eeckhout (2018) apply the same methodology for a sample of 134 countries and find that revenue-weighted markup has been on the rise for decades not only in the United States but also in Europe and (to a lesser extent) in emerging economies in Latin America and Asia Diacuteez Leigh and Tambunlertchai (2018) estimate firm-level markups for publicly traded firms in 74 countries between 1980 and 2016 including both advanced and emerging market economies They find evidence that increased markups are widespread but are more prominent among advanced economies that experienced a 39 percent increase in GDP-weighted average since 1980 More recently IMF (2019) used firm-level data (including both publicly listed and privately held companies) across 27 countriesmdash16 advanced and 11 emerging marketsmdashto estimate firm-level markups between 2000 and 2015 Results indicate that the average markup for the entire sample of countries moderately increased by around 6 percent across the period studied The rise was strongly concentrated among advanced economies but less so among emerging economies (77 percent versus 18 percent respectively)
This trend has triggered an intense public debate about market power and its macroeconomic implications Several authors have tried to link the evidence of rising market power with recent macroeconomic trends such as the declining share of income and sluggish investment rates1 For instance Barkai (2020) documented a negative industry-level relationship between changes in labor share of income and changes in concentration for the US nonfinancial corporate sector during the period 1984ndash2014 Autor et al (2017) find consistent evidence using firm-level data from the US Economic Census between 1982 and 2012 and show that the increase in the concentration of sales experienced in six large sectors of the economy is associated with a decrease in the labor share of value added Still looking at US sectors but using data from publicly traded firms (through Compustat) De Loecker Eeckhout and Unger (2020) find evidence that an increase in markups (aggregated for the whole economy or at the firm level) is negatively correlated with labor share Other authors focused their analyses on corporate investment rate performance and how it is related to increases in corporate market power In this regard Gutieacuterrez and Philippon (2017a 2017b) present evidence that increasing market powermdashcaptured by rising concentration of industry salesmdashpartly explains the low investment rates experienced by the US economy since the 2000s IMF (2019) expands the analysis beyond the United States and runs a cross-country firm-level
1 In principle several factorsmdashbesides rising market powermdashcan contribute to these trends Potential explanatory factors behind declining investment rates include credit constraints weakening demand and a shift in the composition of investment toward intangibles See Gutieacuterrez and Philippon (2017a) and Crouzet and Eberly (2018) for a discussion on this matter
3
analysis covering both advanced and emerging economies to explore the link between markups and physical capital investment and to estimate the extent to which the worldwide average increase in firmsrsquo markups experienced since 2000 is associated with a 04 percentage point decrease in the investment rate
Different strands of empirical literature emphasize distinctmdashbut not necessarily exclusivemdashunderlying mechanisms to explain the overall rise in market power On the one hand authors such as Autor et al (2017) Van Reenen (2018) and Bessen (2017) present results that support the hypothesis that increases in market power have been accompanied by efficiency gains As such changes in the economic environmentmdashcaused by high-tech digital markets engaging in platform competition increases in investment in intangible capital by leading companies and scale-biased technical change provoked by advances in information and communication technology (ICT)mdashhave led to the emergence of large efficient firms Such so-called superstar firms per Autor et al (2017) are able to secure larger market shares in ldquowinner takes mostrdquo markets2 In other words tougher competition (and not less) in these types of markets would reallocate more output toward the high-markup larger and more productive firms In this context superstar firms extract a larger market share which would then explain increases in aggregate (weighted average) market power On the other hand some authors argue that the increase in market power reflects declining competition caused by weakened antitrust enforcement or more stringent regulations that lead to worse allocative efficiency For instance Gutieacuterrez and Philippon (2018) argue that weaker antitrust enforcement in the United States relative to the European Union (EU) explains why market power has risen more in the United States than in EU countries
Against this backdrop this paper presents new evidence regarding the evolution of corporate market power in Romania It goes beyond the average performance of firms and explores firm-level heterogeneity to identify the underlying drivers of aggregate market power trends and the implications for economic growth This paper will explore several questions At the aggregate level the following queries will be assessed Has corporate market power increased How do aggregate trends differ across sectors and across technology intensity and knowledge intensity of sectors Next the analysis will focus on firm-level drivers of aggregate market power trends Regarding the latter the following questions will be assessed Is variation of market power uneven across firms To what extent has firm dynamismmdashthrough incumbents and new entrants or exiting firmsmdashbeen driving markup Does markup performance differ across firms with different attributes Finally to account for economic growth implications the paper will shed light on the potential productivity dividends stemming from fiercer competition across the economy proxied by a reduction in market power
2 METHODOLOGY
The definition of market power is well established Taking output markets as the reference point the standard (theoretical) definition of market power is the ability of a firm to maintain prices above marginal cost which is the level that would prevail under perfect competition The exact magnitude of a firmrsquos market powermdashwhich is tied to the gap between its price and
2 According to this view the dominance of ldquosuperstar firmsrdquomdashsuch as Amazon Apple Facebook Google and Microsoftmdashwould be due to intensified competition ldquofor the marketrdquo rather than anticompetitive mergers or collusion ldquoin the marketrdquo (Van Reenen 2018)
4
marginal costmdashwould depend on the format of the residual demand curve faced by the firm the steeper the inverse demand the larger the price-cost margin difference the higher the market power retained by the firm3
However the actual measurement of market power is not straightforward A commonly used approach is to approximate market power indirectly through market concentration indicators These indicators can assume various formats for instance concentration ratios and the Herfindahl-Hirschman index (HHI) Although these indicators are often relatively easy to computemdashespecially because they require only data on firm revenuesmdashthey have more drawbacks than benefits First and as highlighted in the seminal article of Bresnahan (1989) these indicators do not provide an adequate measure of market power in the presence of product differentiation Second the computation of these indicators requires the definition of a relevant market which usually considers the degree of product substitution geographic location of both producers and consumers transportation costs and so on In this regard it is often harder to define markets in periods of technological change Third the interpretation of results using these indicators can be ambiguous As highlighted by Shapiro (2018) an increase in market concentration could indicate a decline in competition reflecting the existence of less numerous and weaker rivals to dominant incumbent firms on the other hand an increase could equally reflect market competition forces in action making more efficient firms gain larger market shares
Another way to measure market power is to estimate markups Markups capture the ability of firms to charge prices above marginal cost Data availability is the key challenge associated with this methodological alternative as price data at the firm level rarely are accessible let alone data on marginal costs
A common method to estimate markups is the demand approach which involves estimating a demand system and then adding some assumptions on how firms set prices The data requirements associated with this approach are significant The demand method relies on the estimation of a demand system and assumes a fully specified model of consumer choice (see for instance Bresnahan 1989) The estimation itself requires detailed data on prices quantities sold and product characteristics all drawing from retail downstream purchases or consumer-level data Once the own-price and cross-price elasticities across the goods considered are estimated markups can be recovered from first order conditions after specifying a model of competition Overall the main shortcoming of this method is the need to use extremely detailed market-level data As a result the approach has been used only to assess market power in specific sectors for instance see Berry Levinsohn and Pakes (1995)
3 Following this standard approach the gap between price and marginal cost could be approximated by a Lerner index which is calculated as 119871119871119894119894 = 119875119875119894119894minus119872119872119872119872119894119894
119875119875119894119894 reflecting how far a firmrsquos price is from its marginal cost When
specifying a demand function and assuming that firms follow a profit-maximizing behavior it can be shown that for a given firmmdashin a Cournot quantity set case for instancemdashthe first-order condition equals 119871119871119894119894 = 120572120572119894119894
120576120576 where 120572120572119894119894
is the firmrsquos market share and 120598120598 is the demand elasticity of the firm Alternatively in the case of a dominant firm with a competitive fringe that together cover the entire market for a homogeneous good the Lerner index would be approximated as 119871119871119894119894 = 119878119878119894119894
120576120576119889119889+(1minus119878119878119894119894)120576120576119903119903 where 120576120576119889119889 is the marketrsquos elasticity of demand 120576120576119903119903 is the rivalrsquos collective
elasticity of supply and 119878119878119894119894 denotes the dominant firmrsquos market share
5
as well as Berry Levinsohn and Pakes (2004) for cars and more recently Koujianou Goldberg and Hellerstein (2012) for beer
The production approach on the other hand offers more flexibility It relies on simpler assumptions and the data requirements are less rigorous only firmsrsquo financial statements are needed Specifically there is no need to make assumptions on how firms compete in the market there are no restrictions on underlying consumer demand and only firm production data (on inputs and outputs) are needed which can be easily extracted from firmsrsquo financial statements This methodologymdashformally presented in De Loecker and Warzynski (2012)mdashbuilds on the work of Hall (1988) who shows that under cost minimization a firmrsquos markup (price over cost) equals the ratio of two values the output elasticity of a variable input (free of adjustment costs as opposed to quasi-fixed inputs) and the share of expenditures with that input in total revenue that is
120583120583 = 120573120573119881119881119904119904ℎ119886119886119903119903119886119886119881119881
Where 120583120583 is the markup 120573120573119881119881 is the elasticity of output with respect to the variable input and 119904119904ℎ119886119886119886119886119886119886119881119881 is the share of revenue spent on the variable input That said only two pieces of information are needed to estimate the firmrsquos markup the output elasticity which is obtained by estimating a production function of the sector where the firm operates and the revenue share which is directly observed in the data4
Given its flexibility the production approach will be applied to estimate firm-level markups as a proxy for market power in Romania The implementation of this method follows two steps The first is to define and estimate a production function to reflect the technology firms have access to For estimation purposes a firmrsquos i that belongs to sector j (defined at the NACE 2-digit level) production function at year t is represented by a flexible translog technology as follows
(1)
where all the variables are in natural logarithms and yjit is the firmrsquos annual total revenue from operations mjit is the total expenditure in intermediate materials kjit is the capital stock (sum of tangible and intangible assets) and ljit is the total number of hours worked per year (the natural logarithm of the product of the number of employees times the number of months worked times the number of hours worked per month)
TFPR is identified as any change in firmsrsquo revenue not caused by variations in the inputs of production More specifically in equation (1) TFPR (in natural logarithm) is identified by
4 The intuition behind this markup measure is discussed in De Loecker (2011) For a cost-minimizing producer the output elasticity of a variable input equals its expenditure share in total revenue only when price equals marginal cost Any departure from the perfect competitive model will be captured by the difference between the output elasticity and the revenue share as measured by the markup (price over cost)
6
(2)
The term ωjit is known by the firm but not by the econometrician which generates a problem of simultaneity between the inputs and productivity The last term (εjit) is assumed to be a completely random productivity shock not anticipated by the firms when making their input choices The Ackerberg Caves and Frazer (2015) approach is followed to solve the endogeneity problem and the anticipated productivity shock is divided into two terms
(3)
where the first term g(ωjitminus1) is the inertia of the productivity process that is highly productive firms at tminus1 will also have a high productivity level at t (present)5 This is the term that firms know when making their input choices The second term ξjit is the innovation of the productivity process and it is the key of the estimation process It can be interpreted as any change in the level of productivity that is completely new at time t and uncorrelated with past productivity
Since the innovation is uncorrelated with past productivity it is also uncorrelated with the optimal choices of the variable inputs that is materials and labor made at moment tminus1 Moreover since capital is a fixed input and it takes time to change its level one can also assume that the innovation of productivity is uncorrelated with the capital input choices made at moment t This set of assumptions allows one to form a set of moment conditions as follows6
(4)
which states that we can use the lack of correlation between lagged flexible inputs and contemporaneous capital on the one hand and productivity innovation on the other to identify (estimate) the parameters of the production function in equation (1) To account for differences in production technologies across sectors the TFPR estimation as discussed above allows for heterogeneous sector-specific (NACE 2-digit) production functions
Using the estimations of the production function it is possible to compute the output elasticity of the variable input (here assumed as materials) in sector j where firm i operates as follows
(5)
In this regard it should be noted that all firms in the same sector j are assigned a common elasticity The interpretation is that firms in the same sector have access to the same technology but they differ both in terms of TFPRjit and the optimally chosen level of variable input (material)
5 Following the terminology used in the literature the current analysis assumes that productivity follows a first-order Markov process in the sense that it depends only on its own past values The functional form is approximated by a polynomial of degree 3 on the first lag of TFPR This is a quite general procedure see for instance De Loecker (2013) 6 A moment condition is a statistical equality that holds in the population under study
7
Once the output elasticity of the variable input is estimated the second operational step is to use information on expenditures on variable inputs to compute a firmrsquos markup Specifically firmrsquos markup can be directly computed as follows
micro119895119895119894119894119895119895 = 120573120573119872119872119895119895
119872119872119904119904ℎ119886119886119903119903119886119886119895119895119894119894119895119895 (6)
where 120573119872119872119895119895 was estimated in the previous step and 119872119872119904119904ℎ119886119886119886119886119886119886119895119895119894119894119895119895 is the ratio of cost of variable input (materials) to corrected revenue defined as
(7)
where PMMjit is total cost of raw materials Yjit is total revenue and εjit is the unanticipated productivity shock obtained as a residual in the estimation of the production function (see equation 2)
The interpretation of firm-level markups estimated through this production approach must be made with some caution First because markup is recovered through TFPR (and not TFPQ) the estimated result conflates market power itself with differences in product quality and other factors affecting the demand for the product78 Secondmdashand this applies to any methodological procedure not only the production approachmdashmarkup cannot be taken as an absolute value and should not be used to compare different markets since markups will be naturally higher in markets where a large proportion of costs are fixed In this regard it is safer to use markup estimates to illustrate comparisons across firms within markets for instance to shed light on the correlation with other firm characteristics (such as productivity ownership size and location)9 Last but not least it is important to stress that rising markups do not necessarily imply a decline in competition It can reflect vertical differentiation strategies (such as quality upgrading or advertising) or even the implementation of more efficient production processes (or the introduction of innovative products) for which rising markups enable firms to recoup growing fixed costs or to reward high-risk activities such as investment in RampD In this context an in-depth competition assessment would be needed not only to better understand the intrinsic market features (including supply-side and buyer characteristics) but also to identify and assess the potential anticompetitive effects of government intervention in markets
7 To mitigate this conflation risk the analysis tries to some extent to disentangle the sources of markup differences within a sectormdashthat is whether they are derived from higher prices or lower marginal costs (reflected by higher productivity) This is possible because the procedure adopted generates estimates of both TFPR and markup See the results in table A16 in annex 1 8 In a recent article Bond et al (2020) argue that in the absence of information on output quantities to estimate TFPQ as is typically the case (including in the current analysis) it is not possible to obtain consistent estimates of output elasticities when firms have market power and markups are heterogeneous This issue casts doubt over interpretation of markup values especially trends However the production approach for estimating markups is still valid if results are used to assess differences in average markups across different groups of firms (different characteristics) provided one is willing to assume that these groups of firms share the same production function parameters 9 See footnote 8
8
3 DATA SET
The assessment of corporate market power in Romania draws on firm-level data from the Structural Business Survey (SBS) for the period 2008ndash17 The SBS data setmdashprovided by the National Institute of Statistics of Romaniamdashencompasses complete financial information at the headquarters level for the 2008ndash17 period for the surveyed firms This survey is exhaustive for firms with at least 20 employees and provides a representative sample for firms with fewer than 20 employees As such the data set has two strata one completely enumerated covering a census of all enterprises with at least 20 employees and the second a random stratum covering some smaller firms On the basis of this sample design an unbalanced panel is constructed by considering all listed firms (of both strata) for all years In this way the panel allows entry and exit and does not impose any firm size threshold
Firm-level information from SBS is classified at NACE 4-digit level which is considered a proxy for the product market where a firm operates SBS-sampled activities include all sectors except agriculture and banking Therefore the analysis focuses on mining services and manufacturing activities In addition the SBS data assign one NACE 4-digit sector classification for each firm where the firmrsquos main product is classified As such all firms within a NACE 4-digit sector classification are considered to be in one product market In the current analysis the product market definition deliberately does not coincide with the classical definition of ldquorelevant marketrdquo10 which normally considers the degree of product substitution geographic location of both producers and consumers transportation costs and so on11
The SBS data contain all the variables needed to estimate the production function that underlies markup computation The variables needed to estimate TFPR and markups following the production approachmdashas described in the previous section and expressed in equation (1)mdashare firmsrsquo annual total revenue from operations12 total expenditure in intermediate materials capital stock (sum of tangible and intangible assets) and total number of hours worked per year
After deflating nominal accounting data and controlling for outliers the final data set contains 405641 firm-year markup observations for 167756 firms over the 2008ndash17 period All accounting information from the SBS was deflated using the country-level GDP deflator (from World Development Indicators and Eurostat) to express values in Romanian lei for 2000 Once nominal values were deflated additional steps were taken to control for outlier observations in particular observations on revenue employment capital (tangible assets) and costs of raw materials with a value of zero or lower than zero were excluded from the estimation This procedure generated a final (unbalanced panel) data set with 405641 firm-
10 For market power assessment purposes a relevant market is defined by the set of products and geographical areas that exercise competitive constraints on each other (see Motta 2004 for further discussion) 11 In principle this assumptionmdashthat firms under one 4-digit sector classification belong to the same marketmdashcould imply some bias in the case of multiproduct firms that sell goods that are not close substitutes However this bias can be mitigated by using NACE 4-digit sectoral disaggregation In addition in the absence of firm-level information for multiple products it is assumed that the firm-level markup is a weighted average markup across different products within the firm 12 The data set does not contain information on physical quantity produced by each firm Deflated sales are used as a measure of physical quantity to estimate output elasticities and then to recover markups De Loecker and Warzynski (2012) show that using this approach to recover markups potentially affects the level of estimated markup but not the temporal changes in the markup
9
year observations (see table 1) which was then used to estimate markup The final data set contains firm-year markup observations for 167756 firms over 2008ndash17 Table 2 displays the summary statistics for all variables used to compute TFPR and markup for these firms13
13 The original number of firms in the SBS is 484604 405641 firms were considered after removing outliers in markup and TFPR This note defines outliers as those observations with a value greater than Q3+3IQR or lower than Q1minus3IQR where Q1 and Q3 are the first and third quartiles and IQR is the interquartile range
10
Table 1 Final sample of firm-year observations Year Manufacturing Services Mining Total 2008 15056 31346 320 46722 2009 14038 31598 318 45954 2010 12997 29759 317 43073 2011 9492 25942 239 35673 2012 10151 26983 245 37379 2013 9806 29460 229 39495 2014 10381 29872 253 40506 2015 10286 28844 260 39390 2016 10199 28449 249 38897 2017 10018 28280 254 38552 Total 112424 290533 2684 405641
Source World Bank staff calculations based on SBS data set Note Total number of observations by year and sector with production function variables
Table 2 Summary statistics Year Revenue (ln) Employment (ln) Intermediate materials (ln) Capital stock (ln)
Mean SD Mean SD Mean SD Mean SD 2008 1473 229 289 136 1207 267 1168 271 2009 1470 220 282 132 1187 262 1182 269 2010 1470 228 276 135 1202 268 1184 268 2011 1533 200 306 133 1252 260 1228 258 2012 1523 208 304 132 1253 261 1222 259 2013 1503 212 292 133 1232 264 1209 263 2014 1507 213 294 132 1237 262 1204 264 2015 1532 198 307 128 1255 255 1211 264 2016 1540 191 311 126 1244 263 1214 263 2017 1546 189 313 125 1241 270 1220 262 Total 1508 212 297 132 1229 264 1203 265
Source World Bank staff calculations based on SBS data set Note SD = standard deviation
11
4 RESULTS
41 HAS CORPORATE MARKET POWER INCREASED AT THE AGGREGATE LEVEL HOW DO AGGREGATE TRENDS DIFFER ACROSS SECTORS IS THERE A GROUP OF FIRMS DRIVING THE OVERALL TREND
Results show that the average markup in Romania increased by around 15 percent during 2008ndash17 However this expansion was marked by an uneven trend Figure 1 panel a displays the evolution of the (sales-weighted) aggregate markup for the 2008ndash17 period for the whole economy (aggregating manufacturing services and mining) At aggregate level average markups experienced a 15 percent aggregate increase from 2008 to 2017 However three alternating trends are detected in this whole period a sharp increase of more than 15 percent during 2008ndash09 a strong decline after 2009 when markups fell by 23 percent from 2009 to 2012 and a consistent increase of 215 percent from 2012 to 2017
Figure 1 Evolution of (sales‐weighted) average markup by sector 2008ndash17 a All sectors b Manufacturing
c Services d Mining
Source World Bank staff calculations based on SBS data set
Because aggregate numbers mask a lot of heterogeneity it is not surprising to see
92
94
96
98
11
02M
ark-
up in
dex
(200
8 =
1)
2008 2009 2010 2011 2012 2013 2014 2015 2016 2017Year
Manufacturing
11
11
21
31
4M
ark-
up in
dex
(200
8 =
1)
2008 2009 2010 2011 2012 2013 2014 2015 2016 2017Year
Services
51
15
22
5M
ark-
up in
dex
(200
8 =
1)
2008 2009 2010 2011 2012 2013 2014 2015 2016 2017Year
Mining
12
different trends when unraveling markups across sectors Because of their intrinsic characteristics firms are different from each other and contrast in terms of performance even within very narrowly defined sectors (Syverson 2004) These differences could persist either because of supply-side factors such as management skills RampD or investment patterns (Bartelsman and Doms 2000) or because of demand-side factors related to product differentiation customer-producer relationships geographical segmentation among others That said firms across high-level sectorsmdashmanufacturing services and miningmdashhave shown varied performance While the manufacturing (sales-weighted) average markup experienced a decline of minus57 percent over the 2008ndash17 period (figure 1 panel b) there was an opposite and much more rapid trend in services with an aggregate change of 422 percent (see figure 1 panel c) Weighted average markup in mining experienced an uneven trend throughout the same period Nuances are unveiled even within sectors as aggregate markup performance shows different patterns when breaking manufacturing down into groups of sectors according to their technology intensity14 This is also observed when services are broken down into groups of sectors according to their knowledge intensity15 (see figure A11 and figure A12 in annex 1)
Further there is also evidence of changes in the markup firm distribution from 2008 to 2017 revealing an increasing proportion of firms with relatively high markups Figure 2 displays the firm-level distribution of markups in 2008 and 2017 Some changes are noteworthy First both the mean and variance increased over that period But more importantly the upper tail of the distribution became fatter over time suggesting that in 2017 more firms have higher markups than in 2008 This suggests that the rise in average markups is associated with large increases among the firms with the highest markups
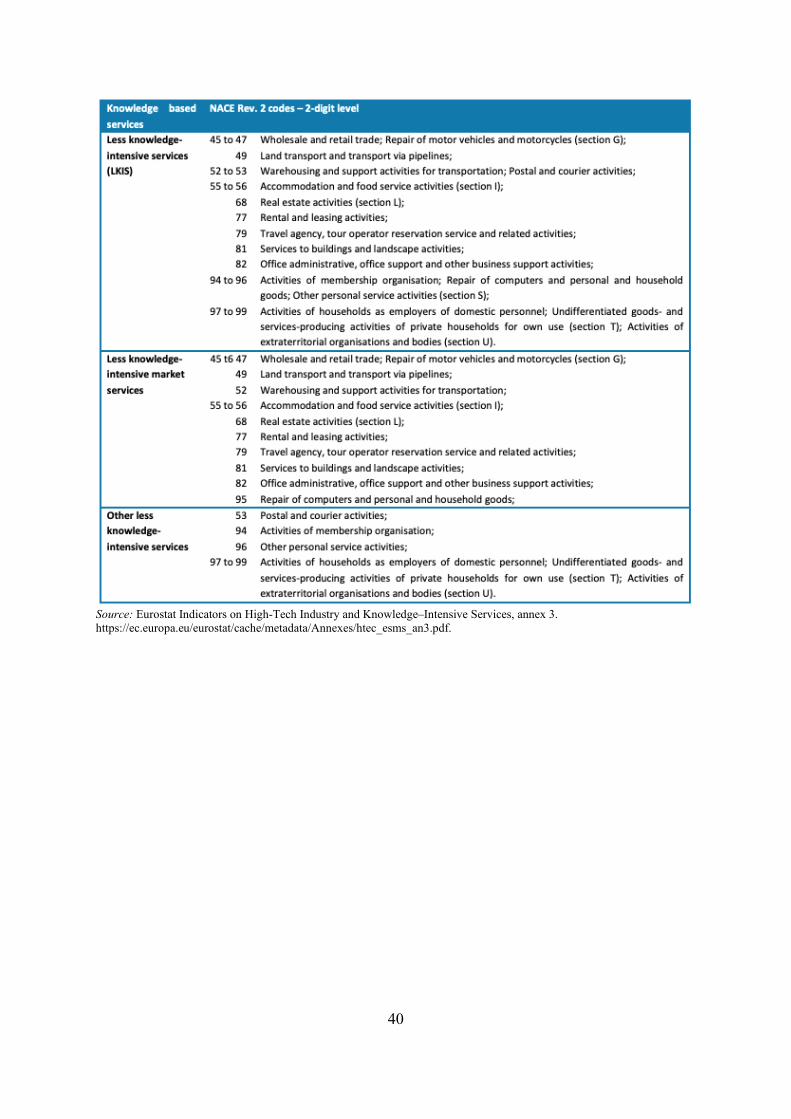
14 As per Eurostat classification manufacturing sectors are classified as high-technology medium-high-technology medium-low-technology and low-technology according to technological intensity (RampD expenditure or value added) and based on the statistical classification of economic activities in the European Community (NACE) at the 2-digit level See table A11 in annex 1 with sector aggregation 15 As per Eurostat classification service sectors are classified as knowledge-intensive services (KIS) and less-knowledge-intensive services (LKIS) KISs comprise knowledge-intensive market services high-tech knowledge-intensive services knowledge-intensive financial services and other knowledge-intensive services LKIS comprise less-knowledge-intensive market services and other less-knowledge-intensive services Both KIS and LKIS are based on the share of tertiary educated persons at the NACE 2-digit level See table A12 in annex 1 with sector aggregation
13
Figure 2 Distribution of firm-level markups all sectors 2008 and 2017
Source World Bank staff calculations based on SBS data set
In fact data show that the rise in average markup has been driven by the ability of a small group of firmsmdashthe top decile firmsmdashto increase their markups over time especially after 2014 Figure 3 panel a shows that markup growth has been progressively uneven across firms with firms in the top decile of the markup distribution increasing their average markup faster than the rest of firms Firms in the 90th percentile increased their (sales-weighted) average markup by 285 percent from 2008 to 2017 while the rest of firmsmdashthose below the top decilemdashexperienced a completely opposite trend their weighted markup contracted by 83 percent over the same period This shows that the increase in the weighted average markupmdashof around 15 percent as shown in figure 3 panel amdashcomes mainly from the group of firms in the top decile of the markup distribution The divergence between the top decile and the rest of firms remains even when results are broken down by sectors it is more pronounced in manufacturing despite some volatility (figure 3 panel b) while in services this happens only after 2014 (panel c) The mining sector experienced the opposite trend (panel d) as most of the time (until 2016) the top decile group of the markup distribution reported lower markup growth than the rest of the firms in the data set
02
46
kden
sity
lnmu
-2 0 2 4 6 8Mark-up (ln)
2008 2017
14
Figure 3 Evolution of (sales-weighted) average markup by sector and by top decile and firm groups (top decile firms versus the rest) 2008ndash17
a All sectors b Manufacturing
c Services d Mining
Source World Bank staff calculations based on SBS data set
Overall these results suggest that any analysis about markup performance in Romania should pay attention to a small group of firms the top decile of firms based on markup distribution These firms have been accounting for increasing shares of value added and employment in the economy Figure 4 shows that the share of value added in the whole economy (including manufacturing services and mining sectors) as accounted for by the firms in the top decile of the markup distribution has been increasing jumping from less than 13 percent in 2008 to 231 percent in 2017 The same applies to employment the sample of the top decile of firms accounts for an increasing share of employment generated in the economy across the 2008ndash17 period (figure 5)
91
11
12
13
Mar
k-up
inde
x (2
008=
1)
2008 2009 2010 2011 2012 2013 2014 2015 2016 2017Year
Average (wgtd)perc 90 (wgtd)Rest of firms (below perc 90) (wgtd)
All firms
15
Figure 4 Share of total value added accounted for by the top decile firms 2008ndash17
Figure 5 Share of employment accounted for by the top decile firms 2008ndash17
Source World Bank staff calculations based on SBS data set
Source World Bank staff calculations based on SBS data set
These top decile firms are also typically smaller less productive and less likely to invest in intangible assets than the rest of the firms As highlighted in the methodological section of this paper the increase of markups cannot be unequivocally interpreted as a decline in competition in a given market it can reflect firmsrsquo efficiency gains or adoption of quality-upgrading strategies To explore this aspect a simple econometric analysis was applied to capture performance differences between the group of firms that is leading the markup increase (the top decile firms) and the rest of the firms based on the markup distribution The following specification was adopted
119862119862ℎ119886119886119886119886119886119886119886119886119886119886119886119886119886119886119886119886119904119904119886119886119886119886119886119886119888119888119895119895119894119894119895119895 = 1205751205750 + 1205751205751119879119879119879119879119879119879_119889119889119886119886119886119886119886119886119889119889119886119886119894119894119895119895 + η119895119895 + ρ119895119895 + γ119888119888 + 120583120583119888119888119895119895119894119894119895119895 (8)
where the dependent variable reflects different firm characteristics (of firm i that operates in sector j county c at year t) to be compared Three dependent variables are tested size (measured in terms of the number of full-time employees) productivity (measured as TFPR discounted for markup16) and intangible assets (measured as a dummy that takes the value of 1 for firms having a positive value of intangible fixed assets17) The key explanatory variable is 119879119879119879119879119879119879_119889119889119886119886119886119886119886119886119889119889119886119886119894119894119895119895 a dummy that takes the value of one firm if i is among the top decile of the markup distribution in year tmdashwhile ηt ρj and γc are respectively time NACE 4-digit sector and county fixed effects The parameters of equation (8) are estimated by OLS (or Probit regression maximum likelihood when the dependent variable is the intangible assets dummy) always using heteroscedasticity-robust standard errors Results displayed in table 3 columns 1 and 2 suggest that firms in the 90th percentile of the markup distribution are on average 468
16 TFPR discounted for markup is computed as TFPR-markup In this regard it is not a perfect measure of the true technical efficiency but just a proxy of productivity that accounts for market share and the effect of materials elasticity while other factors such as the effect of product quality or innovation are not considered 17 Value of intangible assets in the SBS data set is defined as value built on (a) RampD expenditure and (b) franchise patents and other similar rights and values
1015
2025
Perc
enta
ge
2008 2009 2010 2011 2012 2013 2014 2015 2016 2017Year
1012
1416
18Pe
rcen
tage
2008 2009 2010 2011 2012 2013 2014 2015 2016 2017Year
16
percent18 smaller and 91 percent 19 less productive than the rest of the firms even within narrowly defined sectors (at NACE 4-digit level) Results in column 3 captures the differences between these two groups of firms in terms of their willingness to invest in intangible assetsmdashtheir ldquoknowledge capacityrdquomdasha key determinant of firmsrsquo expansion in the long term Results suggest that the sample of top decile firms are almost 33 percent less likely to invest in intangible fixed assets than the remaining firms even within NACE 4-digit sectors20 All these correlations are statistically significant at the 1 percent confidence level
Table 3 Characteristics of top decile firms Conditional correlations between markups and firm characteristics (OLS and Probit results)
(Estimation method) Dependent variable (1)
(OLS) Employment
(ln)
(2) (OLS)
TFPR discounted for markup (ln)
(3) (Probit)
Investment in intangibles
(yesno) Top _decile minus0632 minus2422 minus0386 NACE 4-digit sector fixed effects
Yes Yes Yes
County fixed effects Yes Yes Yes Year fixed effects Yes Yes Yes R2 (pseudo R2)a 0238 0728 0078 Observations 484604 403561 484594
Source World Bank staff calculations based on SBS data set Note All firm-year observations (for the 2008ndash17 period) are pooled together and NACE 4-digit sector and year fixed effects are included OLS = ordinary least squares TFPR = revenue-based total factor productivity a It is worth highlighting that R2 value does not influence the consistency of the estimators of each population parameter which is the objective of the current analysis See for instance Cameron and Trivedi (2010) for a theoretical discussion on this matter Moreover since the analysis draws on a large sample the standard errors of the coefficient estimators are not affected because of the law of large numbers The key issue would be the lack of correlation of omitted variables and the explanatory variables However given that the main (theoretical) determinants of the markup performance are included the omitted variables can be understood to be random Statistically significant at 1 percent
In addition the group of 10 top decile firms in the markup distribution operate mainly in the services sector and are overrepresented in less-knowledge-intensive services sectors with some exceptions Table 4 displays the distribution of top decile firms across NACE 2-digit sectors in 2017 To control for the fact that some sectors might be overrepresented (given the SBS survey sampling) the table shows only those sectors for which the probability of a firm being in the top decile is larger than the sectorrsquos frequency ratio Results show that firms in the 90th percentile of markup distribution are overrepresented in wholesale trade and retail trade sectors the probability of a top decile firm being in these two sectorsmdashclassified as less-knowledge-intensive services according to the Eurostat definition
18 This value results from the following expression 100[exp(beta)minus1] where beta equals estimated top 90 percent dummy coefficients in an OLS regression where size is the dependent variable controlling for 4-digit and county fixed effects (table 3 column 1) 19 This value results from the following expression 100[exp(beta)minus1] where beta equals estimated top 90 percent dummy coefficients in an OLS regression where TFPR is the dependent variable controlling for 4-digit and county fixed effects (table 3 column 2) 20 The odds-ratio is computed as the relative difference between the marginal effects for each category (that is 42 percent for the top decile firms and 56 percent for firms below the 90th percentile) Specifically it is computed as follows (56 percent minus 42 percent)(42 percent)
17
(see table A12 in annex 1)mdashis almost 40 percent21 It is worth highlighting however that these top decile firms also operate in some knowledge-intensive services sectors though the probability is much smaller 387 percent for computer programming and 268 percent for security and investigating activities22
When taken together these results suggest that the small group of firms leading the overall increase in markups in Romania does not seem to follow the typical superstar firmsrsquo profile As discussed by Van Reenen (2018) and Autor et al (2017) superstar firmsmdashtypically with higher markups larger and more productive ndash would be rewarded with larger market shares due to their innovative nature This hypothesis does not seem to be supported by data in Romania As results showed the group of firms who are driving the aggregate rise in markupsmdashthe top decile firms of the markup distributionmdashare typically smaller less productive less likely to invest in intangible assets and are mostly active in services sectors where use and diffusion of knowledge is less important This may suggest that the increase in markups in Romania might reflect a less competition-intensive environment rather than changes in the nature of competition where superstar firms would be rewarded with greater market share because they are more efficient and innovative
Table 4 Probability of a top decile firm (in the markup distribution) being in the following sectors
2-digit sector Probability Wholesale trade 2436 Retail trade 1477 Computer programming 387 Manufacturing of wearing apparel 321 Real estate activities 314 Security and investigation activities 268
Source World Bank staff calculations based on SBS data set Note The table shows only sectors for which the probability of a firm being in the top decile of markup distribution is higher than the sectorrsquos overall frequency ratio
42 HOW HAVE FIRM DYNAMICS INFLUENCED AGGREGATE MARKUP PERFORMANCE ARE THERE SIGNS OF MARKET POWER CONSOLIDATION AMONG INCUMBENT FIRMS
To indirectly assess whether the rise in markups is associated with weakening competition the analysis decomposes the evolution of aggregate markups into that of incumbents and of net entry of firms To do so the Melitz and Polanec (2015) decomposition technique is applied to the aggregate markup changes between 2008 and 2017 This approach follows two steps First the aggregate (ln) markup (μ) at year t is defined as
21 Under the NACE 2-digit wholesale trade sector the group of top decile firms are overrepresented in the following NACE 4-digit sectors sector 4690ndashNon-specialized wholesale trade sector 4673ndashWholesale of wood construction materials and sanitary equipment sector 4621ndashWholesale of grain unmanufactured tobacco seeds and animal feeds sector 4646ndashWholesale of pharmaceutical goods sector 4675ndashWholesale of chemical products and sector 4631ndashWholesale of fruit and vegetables Under the NACE 2-digit retail services sector the sample of top decile firms are overrepresented in the following NACE 4-digit sectors sector 4711ndashRetail sale in non-specialized stores with food beverages or tobacco predominating and sector 4730mdashRetail sale of automotive fuel in specialized stores 22 The same analysis is applied for ownership structure again controlling for overrepresentation Results show that the sample of top decile firms are overrepresented in the fully foreign-owned ownership category
18
120583120583119895119895119895119895 = sum sum 119904119904119895119895119894119894119895119895119894119894isinΩ119895119895 120583120583119895119895119894119894119895119895119894119894isin119896119896119895119895 (9)
where sjit is firm irsquos market share at moment t where the market share is defined in terms of firm irsquos revenue weight over the total revenue of sector j (kj) where sector j is the sector to which firm i belongs Then the change of (ln) markup between moments t and tminus1 is decomposed as
Δ120583120583119895119895119895119895 = Δ120583119878119878119895119895119895119895 + Δ119862119862119879119879119907119907119878119878120583120583119878119878119895119895119894119894119895119895 119904119904119878119878119895119895119894119894119895119895 + 119904119904119864119864119895119895119895119895120583120583119864119864119895119895119895119895 minus 120583120583119878119878119895119895119895119895 + 119904119904119883119883119895119895119895119895120583120583119878119878119895119895119895119895 minus 120583120583119883119883119895119895119895119895 (10)
where the subindex S refers to survivor firms (that is those operating in both years t and tminus1 the subindex X denotes firms exiting the market or those firms present in moment tminus1 but not in moment t and E denotes entrants or those firms operating in moment t but not in moment tminus1 Each component expressed in equation (10) represents different drivers to explain aggregate change in markup over the period The first term is the change of the
unweighted average ln markup of survivors or the ldquowithinrdquo component Likewise is the change in the covariance between ln markup and market share for
survivors only This is the ldquobetweenrdquo component and it measures the reallocation of resources among surviving firms The term is the ldquoentryrdquo component and it measures
the difference of the aggregate ln markup of entrants and that of survivors at moment t weighted by the share of entrants over the total population of firms ( ) The entry component will be
positive if the aggregate markup of those firms entering the market is larger than the aggregate markup of the survivors Finally is the exit component which measures the
difference between the aggregate ln markup of survivors and exiting firms at moment tminus1 likewise weighted by the proportion of firms exiting the market that is This term is
positive if the aggregate ln markup of the exiting firms is lower than the aggregate ln markup of survivors In other words and as displayed in equation (10) aggregate markup can growshrink because (a) incumbent firms have increaseddecreased their markups (the ldquowithinrdquo component) (b) incumbent firms with high markups have gainedlost market share (the ldquobetweenrdquo component) and (c) entrant firms have higherlower markups than exiting firms (the ldquoentryrdquo or ldquoexitrdquo component)23
Results show that the increase in aggregate markups has been driven mostly by incumbents rather than entrants and exiting firms Decomposition results for the full sample of firms are displayed in figure 6 Estimations suggest that a large proportion of the aggregate increase in markup in Romania was driven by increases within incumbent firms (the ldquowithinrdquo bar) And among incumbents results show that the rise in markups reflects mostly a markup increase within firms rather than a reallocation of market share away from low-markup to high-markup companies (the ldquobetweenrdquo bar) Meanwhile the entry of new firms with lower markups pulled the change in aggregate markups down (the ldquoentryrdquo bar) and contribution from
23 SBS tends to underestimate entry and exit (populational) figures as a result of its sampling design In this regard the proposed analysis captures entry and exit in the enumerated stratum (above 20 employees) so results will be representative at least for the population of firms in the enumerated stratum
19
exiting firms was negligible
20
Figure 6 Decomposition of percentage change of (sales-weighted) average markup 2008ndash17
Source World Bank staff calculations based on SBS data set
This result could be interpreted as a sign of consolidation of market power among existing firms enabled by remaining product market regulations that restrict competition despite previous reforms Several policy-related factors can explain this result among them government interventions and regulations that restrict competition by reinforcing dominance or limiting entry facilitating collusive outcomes or increasing the cost to compete in markets and discriminating and protecting vested interests24 In this regard Pop and Ore Monago (2020) provide illustrative examples about the presence of regulations that still restrict competition in Romania drawing from the OECDndashWorld Bank Group (WBG) product market regulation (PMR) indicators data set which provides information across 70 countries25 The assessment uses the latest PMR round for Romania from 2013 and includes Romaniarsquos performance projected on the basis of information updated in 2017 Results suggest that the regulatory framework as it is in the books in Romania is less restrictive than that of countries such as Poland and the total sample average but it is more restrictive than that of the OECD and EU-15 countries However from an economywide perspective the overall restrictiveness of regulations in Romania is mainly associated with the state control of the economy and several remaining barriers to entry and rivalry (see figure 7)
24 In principle greater competition outcomes are enabled through an effective competition policy framework which involves three key pillars (a) fostering pro-competition regulations and government interventions (b) promoting competitive neutrality and non-distortive public aid and (c) enabling effective competition law and antitrust enforcement 25 The current PMR database used for this study includes Argentina Australia Austria Belgium Bolivia Brazil Bulgaria Canada Chile China Colombia Costa Rica Croatia Cyprus the Czech Republic Denmark the Dominican Republic Ecuador Arab Republic of Egypt El Salvador Estonia Finland France Germany Greece Guatemala Honduras Hungary Iceland India Indonesia Ireland Israel Italy Jamaica Japan Kenya the Republic of Korea Kuwait Latvia Lithuania Luxembourg Malta Mexico the Netherlands New Zealand Nicaragua Norway Panama Paraguay Peru the Philippines Poland Portugal Romania the Russian Federation Rwanda Senegal the Slovak Republic Slovenia South Africa Spain Sweden Switzerland Turkey Tunisia Ukraine Uruguay the United Kingdom and the United States
21
Figure 7 Product market regulation in Romania and comparator countries
Source Pop and Ore Monago 2020 Note The top five performers in the overall PMR indicator are the Netherlands United Kingdom Austria Denmark and New Zealand Figure shows 2013 information unless otherwise indicated PMR = product market regulation
Barriers to entry and rivalry still affect some service sectors In fact there are examples of regulations that hamper competition in retail trade which concentrates a substantial proportion of high-markup firms in the Romanian economy as seen previously Drawing from the OECD-WBG PMR data set Pop and Ore Monago (2020) show that although regulations in the retail trade sector are less restrictive than in the EU-15 and OECD there is still room for improvement to make the retail trade market more efficient The authors show that licenses and permit requirements may still be imposing an unnecessary burden on entry and increasing the costs to compete in the sector Companies operating in retail sectors in Romania are subject to requirements that go beyond the general conditions formalities and procedures applicable to any company For instance in Romaniarsquos clothing industry licenses and permits are always required compared with 57 percent of OECD countries and 60 percent of EU-15 countries which do not have such a requirement26 In addition Romania has regulations that impose restrictions on entry or expansion of business activities and constrain strategic options to compete in retail markets For instance most of the PMR countries and all top five performers do not restrict firms from selling below cost (beyond a prohibition of predatory pricing) and restrictions on sales promotions are not a common practice either27 In Romania sales below cost are prohibited or restricted beyond a prohibition of predatory pricing Likewise sales promotions are restricted to a particular time of the year28
43 DO FIRM MARKUPS DIFFER ACROSS FIRMS WITH DIFFERENT ATTRIBUTES
To answer this question the analysis explores how markup performance differs across different types of firms To assess the heterogeneity in markups the analysis relates markups to firm-level characteristics such as size age ownership status RampD status and location
26 In this case the least restrictive countries such as Bulgaria Latvia and Sweden do not have such requirements 27 Among the Central and Eastern Europe comparator countries only the Czech Republic and the Slovak Republic apply restrictions on discounted sales pricing while only Poland applies constraints to sales promotions 28 Government Ordinance no 992000 prohibits sales below costs and provides for the conditions and periods when certain types of promotions can take occur
5156 51 52 47 49 53
62 55
3830 42 40 43 39
4333 41
1114
6 9 10 125 5 4
113129 133 134 141 148 156
165 169
0
05
1
15
2
25
3
0
05
1
15
2
25
3
Top 5 -PMR SlovakRepublic
Hungary EU-15average
CzechRepublic
OECDaverage
2013
Romaniasim 2017
Poland Romania
State control (SC) Barriers to entry and rivalry (BER) Barriers to trade and investment (BTI)
Avg of all countries = 190
22
within narrowly defined product markets proxied by NACE 4-digit sectors The following regression is estimated
120583120583119888119888119895119895119894119894119895119895 = 1205751205750 + sum 12057512057511198961198961198791198791199001199001198991198991198961198961198881198881198951198951198941198941198951198957119896119896=2 + sum 1205751205752119903119903119904119904119886119886119904119904119886119886119903119903119888119888119895119895119894119894119895119895
3119903119903=2 + sum 1205751205752119902119902119886119886119886119886119886119886119902119902119888119888119895119895119894119894119895119895
3119902119902=2 + 1205751205753119889119889119888119888119895119895119894119894119895119895
119864119864119864119864119864119864 +1205751205754119889119889119888119888119895119895119894119894119895119895119877119877119877119877119889119889 + 1205751205755119896119896119888119888119895119895119894119894119895119895 + 120578120578119895119895 + 120588120588119895119895 + 120574120574119888119888 + 119906119906119888119888119895119895119894119894119895119895 (11)
where ownkcjit with k = 23hellip7 comprises a set of dummies defining the type of ownership of the firm Romanian private (omitted category) majority state-owned state-private ownership Romanian private and foreign fully foreign-owned public of national and local interest and other (cooperatives and craft organizations)29 The term sizercjit is a set of three dummies controlling for firmsrsquo sizemdashsmall or fewer than 50 employees (omitted category) medium or 51ndash250 employees and large more than 250 employees The term agercjit is a set of three age dummiesmdashyoung or less than 5 years old mature or 6ndash15 years old and older than 15 years Two dichotomous variables are also defined to capture export and RampD profiles dExp and dRnd which take a value of 1 if a firmrsquos direct exports represent more than 10 percent of a firmrsquos total revenue and if a firmrsquos RampD represents more than 1 percent of a firmrsquos total revenue respectively In addition kcjit is firmsrsquo total capital stock value (sum of tangible and intangible assets)30 Finally ηt ρj and γc are respectively time NACE 4-digit sector and county fixed effects Equation (11) is estimated separately for each 1-digit sector (that is manufacturing services and mining) and for the whole economy while the equation parameters are estimated by OLS always using heteroscedasticity-robust standard errors The complete set of results is displayed in table A15 in annex 1
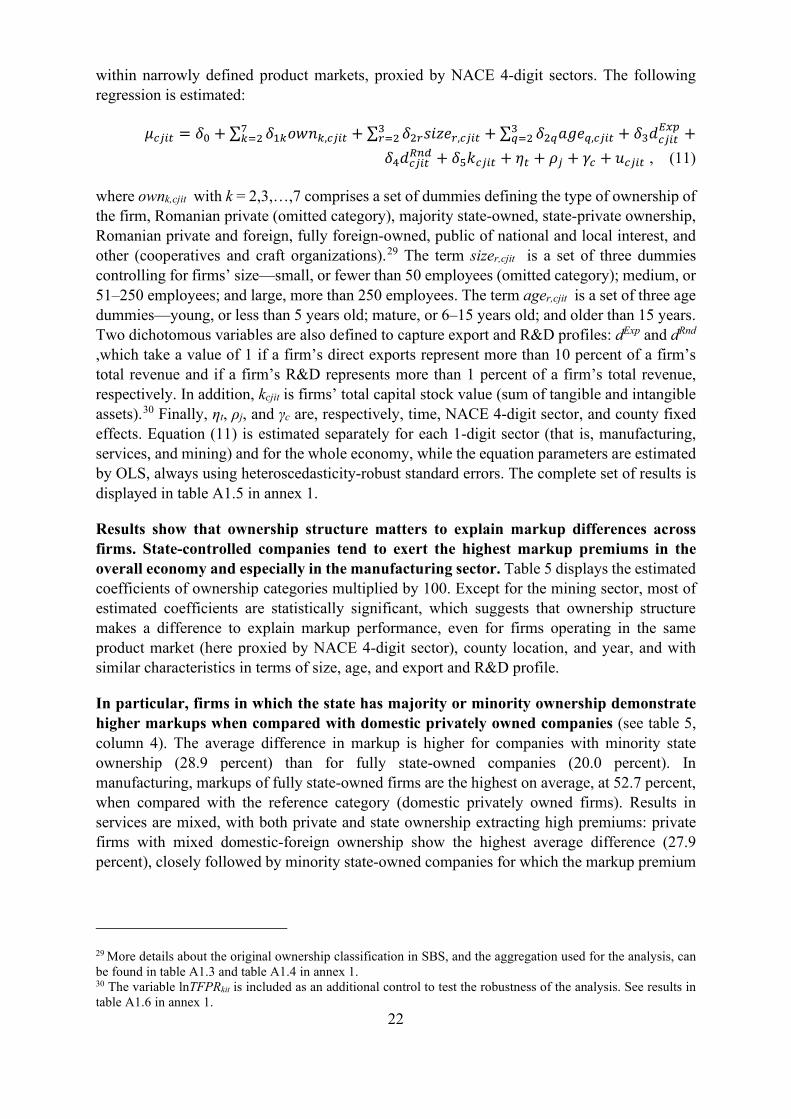
Results show that ownership structure matters to explain markup differences across firms State-controlled companies tend to exert the highest markup premiums in the overall economy and especially in the manufacturing sector Table 5 displays the estimated coefficients of ownership categories multiplied by 100 Except for the mining sector most of estimated coefficients are statistically significant which suggests that ownership structure makes a difference to explain markup performance even for firms operating in the same product market (here proxied by NACE 4-digit sector) county location and year and with similar characteristics in terms of size age and export and RampD profile
In particular firms in which the state has majority or minority ownership demonstrate higher markups when compared with domestic privately owned companies (see table 5 column 4) The average difference in markup is higher for companies with minority state ownership (289 percent) than for fully state-owned companies (200 percent) In manufacturing markups of fully state-owned firms are the highest on average at 527 percent when compared with the reference category (domestic privately owned firms) Results in services are mixed with both private and state ownership extracting high premiums private firms with mixed domestic-foreign ownership show the highest average difference (279 percent) closely followed by minority state-owned companies for which the markup premium
29 More details about the original ownership classification in SBS and the aggregation used for the analysis can be found in table A13 and table A14 in annex 1 30 The variable lnTFPRkit is included as an additional control to test the robustness of the analysis See results in table A16 in annex 1
23
is 275 percent compared with the reference category 31 All results are robust to the inclusion of productivity as an additional control variable (see results in table A16 in annex 1)32
Table 5 Average markup differences by ownership structure relative to domestic privately owned firms
(1) Manufacturing
()
(2) Services
()
(3) Mining
()
(4) All sectors
() Majority state-owned 527 139 772 200 State-private ownership 352 275 ns 289 Domestic private + foreign 161 279 ns 229 Fully foreign-owned 105 263 ns 201 Public of national and local interest
209 149 ns 214
Source World Bank staff calculations based on SBS data set Note Numbers reflect estimated coefficients (multiplied by 100) for ownership dummy categoriesmdashrelative to Romanian private firms the omitted categorymdashin a fixed-effect regression model controlling for firm covariates plus year and NACE 4-digit sector fixed effects as displayed in equation (11) More details about the original ownership classification in SBS and aggregation used for the analysis can be found in table A13 and table A14 in annex 1 See table A15 in annex 1 for the complete set of results ns = not statistically significant
Larger firms and older companies wield higher markups when compared with their counterparts implying that firm size and age are relevant characteristics that influence markup differences As shown in figure 8 old companies (older than 15 years) display higher average markups than young ones (1ndash5 years old) even when they share similar attributes (in terms of ownership structure size and export and RampD profiles) and operate in the same NACE 4-digit sector county and year The estimated average markup premium for old companies (relative to young ones) is 54 percent for the whole economy It varies depending on how data are clustered across large sectors 79 percent in manufacturing 48 percent in services and 228 percent in mining Higher markup premiums for older companies can be interpreted in two ways it can reflect that more experienced firms are able to transpose learning returnsmdashwhich could positively affect their productivity or reduce their marginal costsmdashinto higher markups or that older firms are able to lobby better and create barriers to entry making it more difficult for younger firms to exert competitive pressure Firm size also matters to explain markup performance large companies (with more than 250 full-time employees) tend to display higher markups compared with small companies even when they operate in the same product market and share similar characteristics On average for the whole economy the
31 Results for the category ldquootherrdquo are not shown in table 5 As detailed in table A13 in annex 1 this ldquootherrdquo category refers to SBS ownership answer-codes 40 and 50 respectively ldquocooperativerdquo and ldquopublic of national and local interestrdquo The reason the corresponding results were not highlighted in the main text are twofold First the above-mentioned category accounts for only 006 percent of total companies in the sample Second an in-depth analysis would be needed to understand whether this ldquootherrdquo category reflects potential noise in the way firms self-classify their ownership structures or the way firms report cost expenditures (mainly) or whether this was influenced by SBS sampling design 32 Because the production approach applied in the current analysis delivers both markup and productivity estimates it is possible to further decompose the markup differences across firm characteristics and to verify whether after controlling for differences in marginal costs (that is productivity) certain groups of firms still have higher markups This is precisely one of the mitigating methods employed to reduce the conflation risk as highlighted before Results in table A16 in annex 1 should be interpreted as follows once productivity level is included in the equation differences in marginal cost are accounted for so the coefficient on ldquomajority state-ownedrdquo for instance captures the variation in average prices between majority state-owned and the size reference category (domestic privately owned firms)
24
markup premium for large companies is 122 percent higher than that of small firms (figure 9) Both size and age effects are still present even after controlling for productivity differences (see table A16 in annex 1)33
Figure 8 Average markup differences relative to young firms by age category
Figure 9 Average markup differences relative to small firms by size category
Source World Bank staff calculations based on SBS data set Note Numbers reflect estimated coefficients (multiplied by 100) for age dummy categoriesmdashrelative to young firms (1ndash5 years old) the omitted categorymdashin a fixed-effect regression model controlling for firm covariates plus year county and NACE 4-digit sector fixed effects as displayed in equation (11) All bars reflect statistically significant results See table A15 in annex 1 for the complete set of results
Source World Bank staff calculations based on SBS data set Note Numbers reflect estimated coefficients (multiplied by 100) for size dummy categoriesmdashrelative to small firms (1ndash50 employees) the omitted categorymdashin a fixed-effect regression model controlling for firm covariates plus year county and NACE 4-digit sector fixed effects as displayed in equation (11) All bars reflect statistically significant results See table A15 in annex 1 for the complete set of results
By the same token export intensity also influences markup performance with firms that export earning higher markups Being an exporter is a relevant firm feature to be analyzed when it comes to understanding markup performance Recent models of international trade predict that exporting firms earn higher markups than non-exporting firms either because they are relatively more productive and can thus undercut their rivals (see Melitz and Ottaviano 2008) or because they produce higher-quality goods and rely on higher-quality inputs which allow them to charge higher prices (see Hallak and Sivadasan 2009) In this regard the results summarized in figure 10 are consistent with the literature and suggest that exporting firmsmdashdefined as those whose direct exports represent more than 10 percent of total revenuemdashearn higher markups than non-exporting firms that operate in the same product market (NACE 4-digit sector) the difference ranges from 12 percent to 416 percent depending on how data are clustered across large sectors (manufacturing services and mining)
33 See footnote 32 on how to interpret results in table A16 in annex 1 (after including productivity as an additional control)
22
-160
158
7948
228
54
-505
101520253035
d
iffer
ence
Mature (between 6 and 15 years old)
Old (older than 15)
23
-830
090
327
169122
-15-55
152535
d
iffer
ence
Medium (between 51 and 250)
Large (more than 250 employees)
25
Figure 10 Average markup differences relative to non-exporters by export status
Figure 11 Average markup differences relative to non-RampD performers by RampD status
Source World Bank staff calculations based on SBS data set Note Numbers reflect estimated coefficients (multiplied by 100) for RampD dummy categorymdashrelative to non-RampD performer firms the omitted categorymdashin a fixed-effect regression model controlling for firm covariates plus year county and NACE 4-digit sector fixed effects as displayed in equation (11) All bars reflect statistically significant results See table A15 in annex 1 for the complete set of results
Source World Bank staff calculations based on SBS data set Note Numbers reflect estimated coefficients (multiplied by 100) for export dummy categorymdashrelative to non-exporters the omitted categorymdashin a fixed-effect regression model controlling for firm covariates plus year county and NACE 4-digit sector fixed effects as displayed in equation (11) All bars reflect statistically significant results See table A15 in annex 1 for the complete set of results
Performing RampD activities is positively correlated with markup differences while location proxied by county also matters to explain markup performance Results displayed in figure 11 show that RampD performersmdashidentified by those firms whose RampD expenses surpass more than 1 percent of their total revenuemdashtend to earn higher markups than non-RampD performers The markup premium for RampD performers is always positive suggesting that this group of firms is able to recoup fixed costs associated with RampD activities The magnitude of the premium varies from 16 percent to 46 percent depending how data are clustered across large sectors (manufacturing services and mining) In addition results displayed in figure 12 show that firms in the same product market (at NACE 4-digit level) and with similar characteristics (in terms of ownership age size and export and RampD profiles) charge different markups depending on the county in which they operate Except for Dolj firms in all other counties demonstrate lower average markups than Bucharest the negative markup premium in relation to Bucharest varies from minus154 percent (Vrancea) to minus36 percent (Satu-Mare)
12
258
416
119
05
101520253035404550
d
iffer
ence
160
340
460
273
05
101520253035404550
d
iffer
ence
26
Figure 12 Average markup differences by county relative to Bucharest
Source World Bank staff calculations based on SBS data set Note Numbers reflect estimated coefficients (multiplied by 100) for county fixed effectsmdashrelative to Bucharest the omitted categorymdashin a fixed-effect regression model controlling for firm covariates plus year and NACE 4-digit sector fixed effects as displayed in equation (11) All bars reflect statistically significant results See table A15 in annex 1 for the complete set of results
A variance decomposition analysis suggests that ownership is the most relevant characteristic to explain total variance of markup performance across firms in Romania followed by capital intensity and export status Drawing from estimations of equation (11) it is possible to evaluate the relative importance of each variable to explain the variance of the markup Letting dExp represent any of the explanatory variables of equation (11) the contribution to the variance of the markup of that variable can be defined as
119862119862119879119879119899119899119886119886119889119889119864119864119864119864119864119864 = 12057512057532119881119881119886119886119903119903119889119889119864119864119864119864119864119864+21205751205753119872119872119862119862119862119862(119889119889119864119864119864119864119864119864120583120583minus1205751205753119889119889119864119864119864119864119864119864)119881119881119886119886119903119903(120583120583)
(12)
or as the variance of the variable plus 2 times the covariance of the variable with the part of the markup not explained by that variable A similar expression can be derived for any of the remaining explanatory variables The relative contribution of each variable is computed after discounting the residuals sector and year contributions Results are displayed in figure 13 Ownership structure is shown to be the most relevant feature to explain the variance of markup performance across firms it accounts for 347 percent of the explained variance of markup performance (after removing NACE 4-digit sector and year contributions) The second most important characteristic is capital intensity corresponding to 214 percent of the variance of the markup performance Export status accounts for the third largest share in explained variance 113 percent
d
iffer
ence
27
Figure 13 Contribution by each firm characteristic to explain total variance of markup performance across firms
Source World Bank staff calculations based on SBS data set Note The pie chart reflects markup variance decomposition results It decomposes the variance of markup performance across firms after removing the proportion accounted for by omitted factors NACE 4-digit sector and year contributions
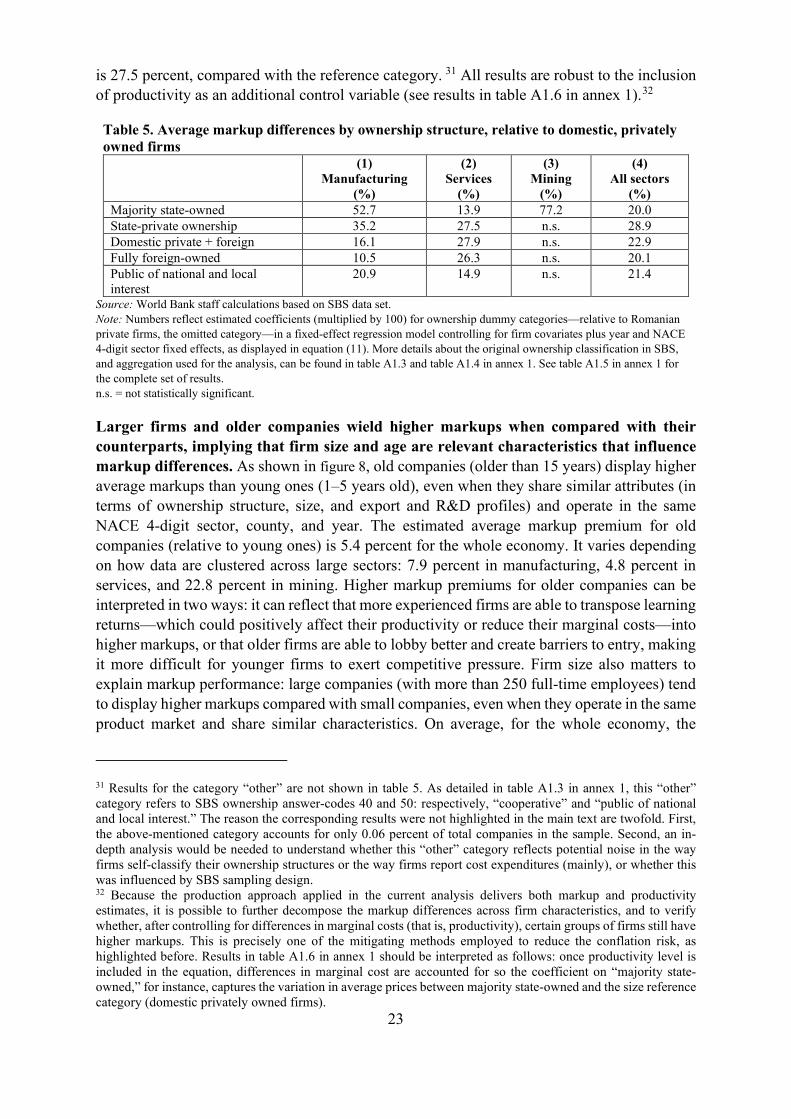
44 WHAT WOULD BE THE PRODUCTIVITY DIVIDENDS FROM MARKUP REDUCTION
While it became evident that aggregate market power in Romania has been rising it is important to analyze its consequences for economic growth An indirect way to measure this is to estimate the productivity dividends that would come from markup reduction The association between markup and productivity can be positive or negative depending on the nature of competition in the specific marketssectors As shown by Autor et al (2017) and Van Reenen (2018) there are marketsmdashsuch as high-tech sectors or knowledge-intensive onesmdashwhere the nature of competition tends to emphasize the importance of network effects economies of scale and scope and intangible assets so the most productive and dynamic firms exert higher markups and obtain larger market shares On the other hand in certain markets where recouping fixed costs (such as RampD) because of higher-risk investments is not that relevant high-markup firms are not necessarily more productive and efficient Another way to look at this contrast is through the inverted-U relationship of innovation and competition to an increase in productivity as explored by Aghion et al (2005) According to this view stronger competition (proxied here by smaller markups) encourages neck-and-neck firms to innovatemdashthe ldquoescape competitionrdquo effectmdashand therefore to increase productivity growth At the same time this view discourages laggard firms from innovating (the Schumpeterian effect) therefore reducing productivity growth The combination of the two effectsmdashescaping competition and discouraging innovationmdashexplains the inverted-U relationship of competition and innovation with productivity growth
To assess the correlation between productivity growth and markups in Romania the analysis uses firm-level estimations of TFPR and markups obtained so far Thus it estimates the specification presented in Aghion Braun and Fedderke (2008) as follows
Δ119889119889119899119899119879119879119897119897119897119897119877119877119888119888119895119895119894119894119895119895 = 1206011206010 + 1206011206011120583120583119888119888119895119895119894119894119895119895 + 120578120578119895119895 + 120588120588119895119895 + 120574120574119888119888 + 120592120592119888119888119895119895119894119894119895119895 (13)
where the left-hand-side variable represents TFPR growth of firm i in NACE 4-digit sector j in year t 120583120583119894119894119895119895119895119895minus1 is the lagged value of firm irsquos markup in sector j in year t ηt ρj and γc are
214
113
79
47
347
64
136
capital intensity Export status RampD status age ownership size region
28
respectively time NACE 4-digit sector and county fixed effects Equation (13) is estimated separately for each 1-digit sector (that is manufacturing services and mining) and for the whole economy while the equation parameters are estimated by OLS always using heteroscedasticity-robust standard errors
Figure 14 Productivity (TFPR) growth dividends from a 10 percent reduction of average markup by sector
Source World Bank staff calculations based on SBS data set Note Results from year county and 4-digit sector fixed effects Coefficient for mining was not statistically significant
Results shows that on average reducing markups would have a positive impact on aggregate productivity expansion Results displayed in table A18 in annex 1 suggest that lower (past) markups are associated with higher (current) productivity growth all coefficients for lagged markups are negative and statistically significant at conventional values for all sectors except mining Overall this negative correlation between past markup level and productivity growth is an indication of a positive association between competition and productivity growth which would be driven by the escape competition effect described by Aghion et al (2008)34
The magnitude of the economic effect of markup reduction on productivity growth is sizable Figure 14 shows that a 10 percent decrease in the average markup of 61 percent for the overall economy in the 2008ndash17 period would imply an increase in productivity (TFPR) growth of 082 percentage point per year The economic effect for the manufacturing sector would be substantially higher reducing the average markup of 403 percent for manufacturing in the same period would imply an increase in TFPR growth of 147 percentage points per year
Further productivity dividends stemming from markup reduction vary substantially across NACE 4-digit sectors The same specification expressed in equation (9) is estimated for each NACE 4-digit sector separately controlling for year and county fixed effects The TFPR growth dividends from markup reduction are computed for each NACE 4-digit sector drawing from the estimated coefficients (see table A18 in annex 1) Results vary substantially
34 An extended specificationmdashwhere the squared value of lagged markup is included as an additional dependent variablemdashwas also estimated The estimated coefficient of the squared term was not statistically significant (see results in table A17 in annex 1)
147
048
082
0
02
04
06
08
1
12
14
16
Manufacturing Services All
Perc
enta
ge p
oint
s per
yea
r
29
across sectors among those 4-digit sectors where the estimated coefficients are statistically significant the productivity growth dividends of a 10 percent decrease in markup vary from 701 percentage points to 016 percentage points respectively for NACE sector 1041ndashManufacture of oil and fats and sector 4649ndashWholesale of other household goods (figure 15)35 Productivity dividends from a potential markup reduction are also positive in sectors where the top decile firms in the markup distribution are overly represented for instance in sector 4711ndashRetail sale in non-specialized stores with food beverages or tobacco predominating a 10 percent decrease of average markup would be associated with an increase in TFPR growth of 022 percentage points per year For sector 4690ndashNon-specialized wholesale trade and sector 4673ndashWholesale of wood construction materials and sanitary equipment the productivity dividends would be 018 and 021 percentage points respectively
Figure 15 Productivity (TFPR) growth dividends from a 10 percent reduction of average markup Results by NACE 4-digit sector
Source World Bank staff calculations based on SBS data set
35 There are however some sectors where markup reduction brings detrimental impacts to productivity expansion See complete set of results in table A18in annex 1 for instance in NACE sector 8010ndashPrivate security activities and sector 2432ndashPrecious metals production where a reduction of average markup in the 2008ndash17 period would imply a decrease of TFPR growth of 030 percentage points and 663 percentage points respectively Following Aghion Braun and Fedderke (2008) the Schumpeterian effect of product market competition would be the underlying driver behind this result in these sectors competition reduces innovation incentives and therefore productivity growth by reducing the rents from innovations of firms below the technological frontier
00
10
20
30
40
50
60
70
80
Perc
enta
ge p
oint
s per
yea
r
30
5 CONCLUSIONS
A stylized fact emerging in the recent empirical literature is the increase in average levels of market power across countries in both developed and emerging economies This paper aims to bring new evidence about the evolution of corporate market power in Romania and the implications for competition dynamics It uses markups as a proxy for market power and explores firm-level heterogeneity to identify the underlying drivers of aggregate trends The paper applies the production approachmdashfollowing De Loecker and Warzynski (2012) De Loecker and Eeckhout (2018) and De Loecker Eeckhout and Unger (2020)mdashto estimate markup at the firm-year level for Romania The Romanian Structural Business Survey data set is used to apply this methodology
Results show that the aggregate markup in Romania increased by around 15 percent between 2008 and 2017 However this aggregate performance masks a lot of heterogeneity the first being heterogeneity of markups across the main sectors While in manufacturing (sales-weighted) average markups experienced a declining pattern of minus57 percent during 2008ndash17 there was an opposite and much more rapid trend in services with an aggregate change of 422 percent
Second at the firm level results suggest that a key driving force behind this aggregate trend was the ability of the top decile of firms in the markup distribution to increase their markups This increase has been faster than for the rest of the firms Firms in the 90th percentile of the markup distribution increased their (sales-weighted) average markup by 285 percent between 2008 and 2017 while the rest of firms (that is those below the top decile firms) experienced a completely opposite trend their weighted markup contracted by 83 percent over the same period
This sample of top decile firms does not seem to follow the typical superstar firmsrsquo profile which suggests that the increase in markups in Romania might be associated with an environment that is less conducive to competition The top decile firms in the markup distribution are 468 percent smaller 910 percent less productive and 33 percent less likely to invest in intangible assets than the rest of the firms in the markup distribution and they are overrepresented in less knowledge-intensive service sectors Therefore they do not seem to follow the typical superstar firmsrsquo profile (typically larger more productive and more likely to invest in intangible assets) This suggests that the increase in markups in Romania might be more due to relatively weak competition rather than to changes in the nature of competition where superstar firms (usually more efficient and innovative) are rewarded with greater market share In fact a decomposition exercise shows that the increase in aggregate markups has been driven mostly by incumbents rather than by new entrants and exiting firms These results could be interpreted as a sign of consolidation of market power among existing firms Several policy-related factors could explain this result among them government interventions and regulations that restrict competition by reinforcing dominance or limiting entry facilitating collusive outcomes or increasing the cost to compete in markets and by discriminating and protecting vested interests In this regard illustrative evidence provided by Pop and Ore Monago (2020) shows that despite reforms regulations that restrict entry and rivalry are still present in the retail trade sector which concentrates a substantial proportion of high-markup firms in the Romanian economy
31
Results also show that certain firm characteristics matter in explaining differences in markup performance size age RampD profile export propensity location and notably ownership State-controlled companies tend to demonstrate the highest markup premiums when compared with domestic privately owned companies 289 percent higher for minority state-owned companies and 20 percent higher for fully state-owned companies Old companies (older than 15 years) display 54 percent higher markups on average than young ones no matter the product market (at NACE 4-digit level) where they operate The markup premium for large companies (with more than 250 full-time employees) is 122 percent higher than that of small firms in the overall economy Exporting firmsmdashthose whose direct exports represent more than 10 percent of total revenuemdashearn 119 percent higher markups than non-exporting firms that operate in the same sector At the same time results show that the markup premium for RampD performers (compared with non-RampD performers) is 273 percent for the whole economy and that firms operating in the same product market charge different markups depending on the county where they operate Overall while all these features matter to explain markup performance a variance decomposition analysis suggests that ownership is the most relevant characteristic to explain total variance of markup performance across firms in Romania
In this context given that ownership assumes a prominent role to explain markup performance it is important to ensure competitively neutral policies across markets where private and public enterprises compete The prominent role of ownership in explaining total variance of markup performance across firms combined with the evidence that state-controlled companies tend to exert the highest markup premiums in the overall economy highlights the importance of ensuring competitive neutrality in Romania so that private and public enterprises compete on a fair basis Analysis presented in Pop and Ore Monago (2020) shows that state-owned enterprises (SOEs) in Romania compete on uneven terms with the private sector because of gaps in terms of both the current regulatory framework as well as its implementation As for the regulatory framework itself lack of competitive neutrality emerges from restrictive SOE governance rules and the exemption of newly setup SOEs from the corporate governance law lack of rules mandating the separation of commercial and noncommercial functions despite legal separation (for example in the railway and energy sectors) and the lack of specific provisions that require SOE investments to show positive rates of returns With regard to implementation of the regulatory framework competitive neutrality gaps stem from (a) the protracted application of corporate governance rules (b) fragmentation of SOE oversight across institutions with frequent overlaps (c) inconsistent reporting of SOE performance that prevents full monitoring and comparability with the private sector performance in comparable situations (d) little clarity in terms of compensation for public service obligations and (e) lack of transparency in state aid allocation
Finally the analysis shows that productivity dividends arise from increased competition in Romania As such lowering markups can boost productivity growth A 10 percent decrease in the average markup for the overall economy during 2008ndash17 would imply an increase in productivity (TFPR) growth of 082 percentage point per year The effect for the manufacturing sector is higher (147 percentage points per year) but lower for services (048 percentage point per year) The ldquoescape competitionrdquo effect described by Aghion Braun and Fedderke (2008)mdashthrough which fiercer competition induces firms to innovate to escape competition with the fringe therefore increasing productivity growthmdashwould be the underlying driver behind these average results for the manufacturing industry Results vary substantially across sectors among
32
those 4-digit sectors where the estimated coefficients are statistically significant the productivity growth dividend of a 10 percent decrease in markup varies from 701 percentage points (sector 1041ndashManufacture of oil and fats) to 016 percentage point (sector 4649ndashWholesale of other household goods)
In this context boosting competition becomes a key part of the engine to drive productivity growth and help consolidate Romaniarsquos convergence to a high-income level Implementing pro-competition policies is instrumental Besides removing anticompetitive regulations and promoting competitive neutrality policy makers should ensure that state aid is allocated in a non-distortive way and enable more effective competition law and antitrust enforcement
33
REFERENCES
Ackerberg D K Caves and G Frazer 2015 ldquoIdentification Properties of Recent Production Function Estimatorsrdquo Econometrica 83 (6) 2411ndash51
Aghion P N Bloom R Blundell R Griffith and P Howitt 2005 ldquoCompetition and Innovation An Inverted-U Relationshiprdquo Quarterly Journal of Economics 120 (2) 701minus28
Aghion P M Braun and J Fedderke 2008 ldquoCompetition and Productivity Growth in South Africardquo Economics of Transition 16 (4) 741ndash68
Autor D D Dorn F Lawrence C Patterson and J Van Reenen 2017 ldquoThe Fall of the Labor Share and the Rise of Superstar Firmsrdquo NBER Working Paper 23396 National Bureau of Economic Research Cambridge MA
Barkai S 2020 ldquoDeclining Labor and Capital Sharesrdquo Journal of Finance 75 (5) 2421ndash63
Bartelsman E J and M Doms 2000 ldquoUnderstanding Productivity Lessons from Longitudinal Microdatardquo Journal of Economic Literature 38 (3) 569ndash94
Berry S J Levinsohn and A Pakes 1995 ldquoAutomobile Prices in Market Equilibriumrdquo Econometrica Journal of the Econometric Society 63 (4) 841ndash90
Berry S J Levinsohn and A Pakes 2004 ldquoDifferentiated Products Demand Systems from a Combination of Micro and Macro Data The New Car Marketrdquo Journal of Political Economy 112 (1) 68ndash105
Bessen J 2017 ldquoInformation Technology and Industry Concentrationrdquo Law and Economics Paper No 17-41 Boston University School of Law Boston
Bond S A Hashemi G Kaplan and P Zoch 2020 ldquoSome Unpleasant Markup Arithmetic Production Function Elasticities and their Estimation from Production Datardquo NBER Working Paper No 27002 National Bureau of Economic Research Cambridge MA
Bresnahan T F 1989 ldquoEmpirical Studies of Industries with Market Powerrdquo In Handbook of Industrial Organization Vol 2 edited by R Schmalensee and R Willig 1011ndash57 Amsterdam Elsevier
Cameron A C and P K Trivedi 2010 Microeconometrics Using Stata (Rev ed) College Station TX Stata Press
Crouzet N and J Eberly 2018 ldquoUnderstanding Weak Capital Investment The Role of Market Concentration and Intangiblesrdquo NBER Working Paper 25869 National Bureau of Economic Research Cambridge MA De Loecker J 2011 ldquoRecovering Markups from Production Datardquo International Journal of Industrial Organization 29 (3) 350ndash55
De Loecker J 2013 ldquoDetecting Learning by Exportingrdquo American Economic Journal Microeconomics 5 (3) 1ndash21
De Loecker J and J Eeckhout 2018 ldquoGlobal Market Powerrdquo NBER Working Paper 24768 National Bureau of Economic Research Cambridge MA
De Loecker J J Eeckhout and G Unger 2020 ldquoThe Rise of Market Power and the Macroeconomic Implicationsrdquo Quarterly Journal of Economics 135 (2) 561ndash644 httpsdoiorg101093qjeqjz041
34
De Loecker J and F Warzynski 2012 ldquoMark-ups and Firm-Level Export Statusrdquo American Economic Review 102 (6) 2437ndash71
Diacuteez F D Leigh and S Tambunlertchai 2018 ldquoGlobal Market Power and Its Macroeconomic Implicationsrdquo IMF Working Paper 18137 International Monetary Fund Washington DC
Grullon G Y Larkin and R Michaely 2018 ldquoAre US Industries Becoming More Concentratedrdquo Swiss Finance Institute Research Paper No 19-41 httpdxdoiorg102139ssrn2612047
Gutieacuterrez G and T Philippon 2017a ldquoDeclining Competition and Investment in the USrdquo NBER Working Paper 23583 National Bureau of Economic Research Cambridge MA Gutieacuterrez G and T Philippon 2017b ldquoInvestment-less Growth An Empirical Investigationrdquo Brookings Papers on Economic Activity (Fall) 89ndash182 Gutieacuterrez G and T Philippon 2018 ldquoHow EU Markets Became More Competitive than US Markets A Study of Institutional Driftrdquo NBER Working Paper 24700 National Bureau of Economic Research Cambridge MA
Hall R 1988 ldquoThe Relation between Price and Marginal Cost in US Industryrdquo Journal of Political Economy 96 (5) 921ndash47
Hallak J and J Sivadasan 2009 ldquoExporting Behavior under Quality Constraintsrdquo NBER Working Paper 14928 National Bureau of Economic Research Cambridge MA
IMF (International Monetary Fund) 2019 World Economic Outlook April 2019 Growth Slowdown Precarious Recovery Washington DC International Monetary Fund
Koujianou Goldberg P and R Hellerstein 2012 A Structural Approach to Identifying the Sources of Local Currency Price Stability Review of Economic Studies 80 (1) 175ndash210
Melitz M J and G Ottaviano 2008 ldquoMarket Size Trade and Productivityrdquo Review of Economic Studies 75 (1) 295ndash316
Melitz M J and S Polanec 2015 ldquoDynamic Olley-Pakes Productivity Decomposition with Entry and Exitrdquo RAND Journal of Economics 46 (2) 362ndash75
Motta M 2004 Competition Policy Theory and Practice Cambridge MA Cambridge University Press
Pop G and T Ore Monago 2020 ldquoCompetition and Government Interventions in Romania An Assessment with Focus on Product Market Regulations and Competitive Neutralityrdquo Background paper for Markets and People Romania Country Economic Memorandum International Development in Focus World Bank Washington DC
Shapiro C 2018 ldquoAntitrust in a Time of Populismrdquo International Journal of Industrial Organization 61 714ndash48
Syverson C 2004 ldquoProduct Substitutability and Productivity Dispersionrdquo Review of Economics and Statistics 86 (2) 534ndash50
Van Reenen J 2018 ldquoIncreasing Differences between Firms Market Power and the Macroeconomyrdquo CEPR Discussion Paper 1576 Center for Economic and Policy Research Washington DC
35
World Bank 2020a ldquoMarkets and People Romania Country Economic Memorandumrdquo International Development in Focus World Bank Washington DC
World Bank 2020b ldquoAssessing the Direct and Indirect Impact of State Aid in Romania An Ex-post Evaluationrdquo World Bank Washington DC
36
ANNEX 1 ADDITIONAL FIGURES AND TABLES
Figure A11 Evolution of (sales-weighted) average markup in manufacturing sector by technology intensity 2008ndash17
Source World Bank staff calculations based on SBS data set
Table A11 Manufacturing industry groups by technology intensity Eurostat classification
85
99
51
Mar
k-up i
ndex
(200
8 = 1
)
2008 2009 2010 2011 2012 2013 2014 2015 2016 2017Year
Manuf High-tech
37
Source Eurostat Indicators on High-Tech Industry and KnowledgendashIntensive Services annex 3 httpseceuropaeueurostatcachemetadataAnnexeshtec_esms_an3pdf
38
Figure A12 Evolution of (sales-weighted) average markup in services sector by knowledge intensity
39
Table A12 Services groups by knowledge intensity Eurostat classification
40
Source Eurostat Indicators on High-Tech Industry and KnowledgendashIntensive Services annex 3 httpseceuropaeueurostatcachemetadataAnnexeshtec_esms_an3pdf
41
Table A13 Original ownership classification from SBS SBS Code Description
10 Fully state-owned Majority state-owned (statepublic capital gt 50 of equity)
21 State + Romanian private 22 State + foreign 23 State + Romanian private + foreign
Majority privately owned (private capital ge 50 of equity) 26 State + Romanian private 27 State + foreign 28 State + Romanian private + foreign
Fully privately owned 31 Romanian private 32 Romanian private + foreign 40 Cooperative 50 Craft organizations 60 Fully foreign-owned 70 Public of national and local interest
Source World Bank staff calculations based on SBS data set
Table A14 Ownership classification adopted in the analysis SBS codes (combined) Description
10 21 22 23 State owned (fully + majority state-owned) 26 27 28 Private-public (majority private)
31 Fully private (domestic) 32 Fully private (domestic + foreign) 60 Fully private (fully foreign) 70 Public of national and local interest
40 50 Other Source World Bank staff calculations based on SBS data set
Table A15 Conditional correlations between firm characteristics and markup performance regression results
Variable Manufacturing Services Mining All Capital stock (ln) minus0150 minus0039 minus0067 minus0066 Export dummy 0120 0258 0416 0119 RampD dummy 0160 0340 0460 0273 Mature 0022 minus0016 0158 minus0005 Old 0079 0048 0228 0054 Majority state-owned 0527 0139 0772 0200 State-private ownership 0352 0275 0111 0289 Romanian private + foreign 0161 0279 0096 0229 Fully foreign-owned 0105 0263 0 0201 Public of national and local interest 0209 0149 (omitted) 0214 Other 0884 0555 (omitted) 0758 Medium 0230 minus0083 0011 0009 Large 0327 0169 minus0015 0122 1 Alba 0106 minus0087 minus0151 minus0042 2 Arad 0038 minus0090 minus0148 minus0077 3 Arges minus0005 minus0053 minus0195 minus0060
42
Variable Manufacturing Services Mining All 4 Bacau 0092 minus0090 minus0194 minus0055 5 Bihor 0036 minus0115 minus0256 minus0088 6 Bistrita-Nasaud minus0064 minus0156 minus0069 minus0144 7 Botosani 0046 minus0089 minus0438 minus0076 8 Brasov 0041 minus0047 0049 minus0040 9 Braila 0133 minus0055 minus0265 minus0025 10 Buzau 0017 minus0123 minus0025 minus0100 11 Caras-Severin 0035 minus0187 minus0005 minus0139 12 Cluj minus0004 minus0094 minus0119 minus0088 13 Constanta 0057 minus0105 0062 minus0088 14 Covasna 0038 minus0056 minus0151 minus0052 15 Dambovita 0005 minus0183 minus0154 minus0144 16 Dolj 0195 0060 minus0042 0079 17 Galati 0106 minus0007 minus0276 0004 18 Gorj 0084 0028 minus0116 0026 19 Harghita 0101 minus0102 minus0007 minus0045 20 Hunedoara 0167 minus0031 minus0057 0011 21 Ialomita 0138 minus0049 minus0265 minus0027 22 Iasi minus0014 minus0038 minus0384 minus0058 23 Ilfov 0011 0009 0314 0010 24 Maramures 0094 minus0020 minus0042 0 25 Mehedinti 0113 minus0136 minus0720 minus0096 26 Mures 0048 minus0063 minus0093 minus0048 27 Neamt 0001 minus0108 minus0428 minus0102 28 Olt 0073 minus0005 minus0397 minus0011 29 Prahova 0018 minus0034 minus0028 minus0043 30 Satu-Mare 0033 minus0024 minus0056 minus0036 31 Salaj 0075 minus0045 minus0448 minus0031 32 Sibiu 0044 minus0038 minus0154 minus0041 33 Suceava 0044 minus0087 minus0111 minus0074 34 Teleorman 0103 minus0099 minus0299 minus0062 35 Timis 0030 minus0020 minus0341 minus0037 36 Tulcea 0142 minus0149 0096 minus0078 37 Vaslui 0091 minus0017 minus0105 minus0007 38 Valcea 0078 minus0008 minus0122 minus0002 39 Vrancea minus0061 minus0163 minus0608 minus0154 51 Calarasi 0080 minus0122 0672 minus0075 52 Giurgiu 0052 minus0064 minus0334 minus0066
_cons 2147 1150 2291 2246 NACE 4-digit fixed effects Yes Yes Yes Yes
Year fixed effects Yes Yes Yes Yes
R2 0345 0235 0254 0279 Source World Bank staff calculations based on SBS data set Note Dependent variable = ln(markup) denotes significance level at 1 percent at 5 percent and at 10 percent
43
44
Table A16 Conditional correlations between firm characteristics (including productivity) and markup performance regression results
Variable Manufacturing Services Mining All Capital stock (ln) minus0149 minus0038 minus0065 minus0066 Export dummy 0116 0257 0400 0118 RampD dummy 0182 0366 0449 0295 Mature 0021 minus0014 0164 minus0003 Old 0079 0052 0228 0057 Majority state-owned 0529 0147 0758 0209 State-private ownership 0351 0274 0118 0288 Romanian private + foreign 0156 0275 0090 0225 Fully foreign-owned 0096 0254 minus0011 0192 Public of national and local interest 0179 0165 (omitted) 0233 Other 0879 0561 (omitted) 0759 Medium 0232 minus0083 0002 0010 Large 0327 0170 minus0016 0122
Productivity (TFPR) 0051 0020 0041 0024 1 Alba 0114 minus0081 minus0156 minus0035 2 Arad 0045 minus0085 minus0135 minus0071 3 Arges 0001 minus0049 minus0196 minus0056 4 Bacau 0098 minus0084 minus0188 minus0049 5 Bihor 0042 minus0111 minus0268 minus0083 6 Bistrita-Nasaud minus0057 minus0150 minus0055 minus0137 7 Botosani 0053 minus0082 minus0443 minus0069 8 Brasov 0045 minus0042 0033 minus0035 9 Braila 0139 minus0048 minus0243 minus0018 10 Buzau 0022 minus0118 minus0002 minus0094 11 Caras-Severin 0042 minus0178 minus0001 minus0131 12 Cluj minus0001 minus0089 minus0120 minus0083 13 Constanta 0067 minus0101 0056 minus0084 14 Covasna 0045 minus0050 minus0166 minus0046 15 Dambovita 0010 minus0180 minus0162 minus0140 16 Dolj 0202 0068 minus0054 0087 17 Galati 0114 minus0001 minus0289 0010 18 Gorj 0091 0037 minus0118 0035 19 Harghita 0108 minus0096 minus0005 minus0039 20 Hunedoara 0173 minus0025 minus0055 0018 21 Ialomita 0144 minus0045 minus0256 minus0023 22 Iasi minus0005 minus0034 minus0394 minus0053 23 Ilfov 0013 0012 0296 0013 24 Maramures 0101 minus0013 minus0038 0007 25 Mehedinti 0128 minus0132 minus0729 minus0090 26 Mures 0053 minus0057 minus0105 minus0042 27 Neamt 0010 minus0101 minus0434 minus0094
45
Variable Manufacturing Services Mining All 28 Olt 0082 0002 minus0402 minus0004 29 Prahova 0023 minus0029 minus0032 minus0039 30 Satu-Mare 0038 minus0018 minus0047 minus0030 31 Salaj 0081 minus0039 minus0433 minus0025 32 Sibiu 0044 minus0034 minus0147 minus0038 33 Suceava 0051 minus0081 minus0105 minus0068 34 Teleorman 0117 minus0092 minus0296 minus0053 35 Timis 0033 minus0014 minus0340 minus0032 36 Tulcea 0147 minus0142 0078 minus0072 37 Vaslui 0101 minus0011 minus0104 0 38 Valcea 0087 minus0002 minus0120 0004 39 Vrancea minus0053 minus0158 minus0602 minus0148 51 Calarasi 0086 minus0118 0673 minus0071 52 Giurgiu 0059 minus0060 minus0334 minus0061
_cons 1632 0993 1934 2036 NACE 4-digit fixed effects Yes Yes Yes Yes
Year fixed effects Yes Yes Yes Yes
R2 0347 0235 0255 0280 Source World Bank staff calculations based on SBS data set Note Dependent variable = ln(markup) denotes significance level at 1 percent at 5 percent and at 10 percent
Table A17 Productivity growth and markup performance regression results
All Manufacturing Services Mining
Lag markup minus0025 minus0028 minus0026 minus0027 minus0025 minus0027 minus0012 minus0024
Lag markup squared 0001 0000 0001 0003 NACE 4-digit sector fixed effects Yes Yes Yes Yes Yes Yes Yes Yes County fixed effects Yes Yes Yes Yes Yes Yes Yes Yes Year fixed effects Yes Yes Yes Yes Yes Yes Yes Yes
Observations 245525 245525 76694 76694 167120 167120 1711 1711 Source World Bank staff calculations based on SBS data set Note Dependent variable = TFPR growth denotes significance level at 1 percent at 5 percent and at 10 percent
46
Table A18 Productivity (TFPR) growth dividends from a 10 reduction of average markup results by NACE 4-digit sector
NACE 4-digit sector Gain in TFPR growth per
year (percentage points)
1041ndashManufacture of oils and fats 7015 4331ndashPlastering 5547 2060ndashManufacture of man-made fibers 5286 2824ndashManufacture of power-driven hand tools 4869 1072ndashManufacture of rusks and biscuits manufacture of preserved pastry goods and cakes
4145
1104ndashManufacture of other non-distilled fermented beverages 3984 1723ndashManufacture of paper stationery 3716 2812ndashManufacture of fluid power equipment 3566 2452ndashCasting of steel 3278 1101ndashDistilling rectifying and blending of spirits 3134 1420ndashRaising of other cattle and buffaloes 3072 2011ndashManufacture of industrial gases 3033 2593ndashManufacture of wire products chain and springs 2689 2829ndashManufacture of other general-purpose machinery nec 2641 4910ndashPassenger rail transport interurban 2629 2451ndashCasting of iron 2615 3821ndashTreatment and disposal of non-hazardous waste 2375 2059ndashManufacture of other chemical products nec 2336 2920ndashManufacture of bodies (coachwork) for motor vehicles manufacture of trailers and semi-trailers
2270
1051ndashOperation of dairies and cheese making 2224 3313ndashRepair of electronic and optical equipment 2160 1081ndashManufacture of sugar 2158 1073ndashManufacture of macaroni noodles couscous and similar farinaceous products 2081 4213ndashConstruction of bridges and tunnels 2077 2223ndashManufacture of buildersrsquo ware of plastic 2011 2550ndashForging pressing stamping and roll-forming of metal powder metallurgy 1949 2313ndashManufacture of hollow glass 1926 2825ndashManufacture of non-domestic cooling and ventilation equipment 1889 2020ndashManufacture of pesticides and other agrochemical products 1818 2571ndashManufacture of cutlery 1758 5914ndashMotion picture projection activities 1691 5920ndashSound recording and music publishing activities 1665 3514ndashTrade of electricity 1653 1310ndashPreparation and spinning of textile fibers 1616 4920ndashFreight rail transport 1613 4339ndashOther building completion and finishing 1586 2620ndashManufacture of computers and peripheral equipment 1543 4311ndashDemolition 1515 3832ndashRecovery of sorted materials 1404 3523ndashTrade of gas through mains 1382 2410ndashManufacture of basic iron and steel and of ferro-alloys 1353 2399ndashManufacture of other non-metallic mineral products nec 1272 2017ndashManufacture of synthetic rubber in primary forms 1258 7711ndashRental and leasing of cars and light motor vehicles 1256 4212ndashConstruction of railways and underground railways 1128 2453ndashCasting of light metals 1080 7410ndashSpecialized design activities 1068 5630ndashBeverage serving activities 1065 4211ndashConstruction of roads and motorways 0989 4677ndashWholesale of waste and scrap 0926 4676ndashWholesale of other intermediate products 0917 4120ndashConstruction of residential and non-residential buildings 0912 4623ndashWholesale of live animals 0890 6820ndashRental and operating of own or leased real estate 0826 4110ndashDevelopment of building projects 0824
47
NACE 4-digit sector Gain in TFPR growth per year
(percentage points) 4613ndashAgents involved in the sale of timber and building materials 0823 4322ndashPlumbing heat and air-conditioning installation 0731 5629ndashOther food service activities 0699 4791ndashRetail sale via mail order houses or via internet 0659 4941ndashFreight transport by road 0659 4618ndashAgents specialized in the sale of other particular products 0646 7219ndashOther research and experimental development on natural sciences and engineering 0623 4617ndashAgents involved in the sale of food beverages and tobacco 0609 5510ndashHotels and similar accommodation 0560 4615ndashAgents involved in the sale of furniture household goods hardware and ironmongery
0541
4633ndashWholesale of dairy products eggs and edible oils and fats 0540 4778ndashOther retail sale of new goods in specialized stores 0527 4621ndashWholesale of grain unmanufactured tobacco seeds and animal feeds 0517 4662ndashWholesale of machine tools 0501 6110ndashWired telecommunications activities 0491 4634ndashWholesale of beverages 0468 5610ndashRestaurants and mobile food service activities 0463 4631ndashWholesale of fruit and vegetables 0426 4532ndashRetail trade of motor vehicle parts and accessories 0394 1411ndashManufacture of leather clothes 0390 4511ndashSale of cars and light motor vehicles 0382 4637ndashWholesale of coffee tea cocoa and spices 0361 4645ndashWholesale of perfume and cosmetics 0354 1419ndashManufacture of other wearing apparel and accessories 0344 4643ndashWholesale of electrical household appliances 0335 4639ndashNon-specialized wholesale of food beverages and tobacco 0285 4619ndashAgents involved in the sale of a variety of goods 0281 4675ndashWholesale of chemical products 0249 4711ndashRetail sale in non-specialized stores with food beverages or tobacco predominating 0223 4673ndashWholesale of wood construction materials and sanitary equipment 0214 4690ndashNon-specialized wholesale trade 0188 4649ndashWholesale of other household goods 0158 8010ndashPrivate security activities minus0300 8220ndashActivities of call centres minus0323 2572ndashManufacture of locks and hinges minus0503 7120ndashTechnical testing and analysis minus0511 3315ndashRepair and maintenance of ships and boats minus0512 3600ndashWater collection treatment and supply minus0547 4754ndashRetail sale of electrical household appliances in specialized stores minus0627 2341ndashManufacture of ceramic household and ornamental articles minus0646 7111ndashArchitectural activities minus0649 6120ndashWireless telecommunications activities minus0746 7312ndashMedia representation minus1023 4334ndashPainting and glazing minus1200 5020ndashSea and coastal freight water transport minus1276 1052ndashManufacture of ice cream minus1367 5911ndashMotion picture video and television programme production activities minus1439 2592ndashManufacture of light metal packaging minus1619 2752ndashManufacture of non-electric domestic appliances minus1729 2521ndashManufacture of central heating radiators and boilers minus1843 4932ndashTaxi operation minus2568 2013ndashManufacture of other inorganic basic chemicals minus3524 1711ndashManufacture of pulp minus3631 4942ndashRemoval services minus4214 1092ndashManufacture of prepared pet foods minus4262 3040ndashManufacture of military fighting vehicles minus5508 2432ndashCold rolling of narrow strip minus6629
Source World Bank staff calculations based on SBS data set Note The table displays only sectors for which estimated coefficients are statistically significant
48
- 1 Introduction and motivation
- 2 Methodology
- 3 Data set
- 4 Results
-
- 41 Has corporate market power increased at the aggregate level How do aggregate trends differ across sectors Is there a group of firms driving the overall trend
- 42 How have firm dynamics influenced aggregate markup performance Are there signs of market power consolidation among incumbent firms
- 43 Do firm markups differ across firms with different attributes
- 44 What would be the productivity dividends from markup reduction
-
- 5 Conclusions
- References
- Annex 1 Additional figures and tables
-

Produced by the Research Support Team
Abstract
The Policy Research Working Paper Series disseminates the findings of work in progress to encourage the exchange of ideas about development issues An objective of the series is to get the findings out quickly even if the presentations are less than fully polished The papers carry the names of the authors and should be cited accordingly The findings interpretations and conclusions expressed in this paper are entirely those of the authors They do not necessarily represent the views of the International Bank for Reconstruction and DevelopmentWorld Bank and its affiliated organizations or those of the Executive Directors of the World Bank or the governments they represent
Policy Research Working Paper 9487
This paper explores firm-level heterogeneity to identify the underlying drivers of market power trends in Romania and the implications for competition and economic growth The results show that the (sales-weighted) average markup in Romania increased by around 15 percent between 2008 and 2017 A key driving force behind this aggregate trend was the ability of a small fraction of firmsmdashthe top decile firms in the markup distributionmdashto increase their markups These firms do not seem to follow the typical superstar firmsrsquo profile they are smaller less efficient and less likely to invest in intangible assets than other firms in the markup distribution and overrepresented in less knowl-edge-intensive service sectors (for example the retail and trade sector) This suggests that the increase in markups in Romania might be associated with an environment that is less conducive to competition A decomposition exer-cise shows that the increase in aggregate markups has been
driven mostly by incumbents rather than new entrants and exiting firms which could be interpreted as a sign of consolidation of market power among existing firms The paper also finds that certain firm characteristics matter to explain differences in markup performance size age research and development profile export propensity loca-tion and especially ownership Further the paper shows that additional productivity dividends are associated with increased competition in Romania Overall these findings illustrate potential policy angles that need to be tackled to enhance market contestability and boost productivity growth such as addressing regulations that restrict entry and rivalry in the retail trade sector which concentrates a substantial proportion of high-markup firms as well as promoting competitive neutrality across markets where public and private actors compete
This paper is a product of the Finance Competitiveness and Innovation Global Practice It builds on the Technical Assistance on Assessing the Effects of State Aid on Market Outcomes in Romania (2018ndash2020) The project was funded by the European Union via the Structural Reform Support Programme (SRSP) and implemented by the World Bank in cooperation with the European Commissionrsquos Directorate-General for Reform Support (DG REFORM) It is part of a larger effort by the World Bank to provide open access to its research and make a contribution to development policy discussions around the world Policy Research Working Papers are also posted on the Web at httpwwwworldbankorgprwp The authors may be contacted at mioottyworldbankorg and gpopworldbankorg
Corporate Market Power in Romania Assessing Recent Trends Drivers and Implications for Competition
Mariana Iootty Georgiana Popyen and Jorge Penaamp
Originally published in the Policy Research Working Paper Series on December 2020 This version is updated on March 2021
To obtain the originally published version please email prwpworldbankorg
Keywords market power competition productivity resource allocation
JEL codes D22 D24 D40 L22
___________________________________________________________________________
Comments to earlier versions of this paper were provided by a team from Romanian Competition Council thatincluded Alis Barbulescu Daniel Diaconescu Sorina Palan Stefan Popescu Mihai Dragoi Oana Neg PaulPrisecaru Oana Romano Vlad Nerau Ionut Busega and Mihai Busu The authors are equally grateful forcomments from the European Commission provided by Iulia Mirela Serban (DG REFORM) Enrico Pesaresi (DGREFORM) and Daniele Vidoni (DG COMP) Hernan Winkler Richard Record and Catalin Pauna - all from theWorld Bank also provided valuable comments to an earlier version of this paper
The World Bank mioottyworldbankorg yenThe World Bank gpopworldbankorgamp IE Business School Madrid Spain jpifacultyieedu
2
1 INTRODUCTION AND MOTIVATION
A key stylized fact that has emerged in recent years is that corporate market power has increased at the global level Drawing upon different methodologies empirical literature produced in the past 10 years indicates that average levels of market power have been increasing across countries in both developed and emerging economies This trend has been measured through different metrics of market power such as industry sales concentration ratios firm-level profit rates or firm-level price-cost margins For instance Grullon Larkin and Michaely (2018) show that concentration and profit rates have increased across most US industries De Loecker Eeckhout and Unger (2020) estimate firm-level pricendashmarginal cost markups in the United States and find evidence that the revenue-weighted average markup climbed from about 12 in 1980 to 16 in 2014 De Loecker and Eeckhout (2018) apply the same methodology for a sample of 134 countries and find that revenue-weighted markup has been on the rise for decades not only in the United States but also in Europe and (to a lesser extent) in emerging economies in Latin America and Asia Diacuteez Leigh and Tambunlertchai (2018) estimate firm-level markups for publicly traded firms in 74 countries between 1980 and 2016 including both advanced and emerging market economies They find evidence that increased markups are widespread but are more prominent among advanced economies that experienced a 39 percent increase in GDP-weighted average since 1980 More recently IMF (2019) used firm-level data (including both publicly listed and privately held companies) across 27 countriesmdash16 advanced and 11 emerging marketsmdashto estimate firm-level markups between 2000 and 2015 Results indicate that the average markup for the entire sample of countries moderately increased by around 6 percent across the period studied The rise was strongly concentrated among advanced economies but less so among emerging economies (77 percent versus 18 percent respectively)
This trend has triggered an intense public debate about market power and its macroeconomic implications Several authors have tried to link the evidence of rising market power with recent macroeconomic trends such as the declining share of income and sluggish investment rates1 For instance Barkai (2020) documented a negative industry-level relationship between changes in labor share of income and changes in concentration for the US nonfinancial corporate sector during the period 1984ndash2014 Autor et al (2017) find consistent evidence using firm-level data from the US Economic Census between 1982 and 2012 and show that the increase in the concentration of sales experienced in six large sectors of the economy is associated with a decrease in the labor share of value added Still looking at US sectors but using data from publicly traded firms (through Compustat) De Loecker Eeckhout and Unger (2020) find evidence that an increase in markups (aggregated for the whole economy or at the firm level) is negatively correlated with labor share Other authors focused their analyses on corporate investment rate performance and how it is related to increases in corporate market power In this regard Gutieacuterrez and Philippon (2017a 2017b) present evidence that increasing market powermdashcaptured by rising concentration of industry salesmdashpartly explains the low investment rates experienced by the US economy since the 2000s IMF (2019) expands the analysis beyond the United States and runs a cross-country firm-level
1 In principle several factorsmdashbesides rising market powermdashcan contribute to these trends Potential explanatory factors behind declining investment rates include credit constraints weakening demand and a shift in the composition of investment toward intangibles See Gutieacuterrez and Philippon (2017a) and Crouzet and Eberly (2018) for a discussion on this matter
3
analysis covering both advanced and emerging economies to explore the link between markups and physical capital investment and to estimate the extent to which the worldwide average increase in firmsrsquo markups experienced since 2000 is associated with a 04 percentage point decrease in the investment rate
Different strands of empirical literature emphasize distinctmdashbut not necessarily exclusivemdashunderlying mechanisms to explain the overall rise in market power On the one hand authors such as Autor et al (2017) Van Reenen (2018) and Bessen (2017) present results that support the hypothesis that increases in market power have been accompanied by efficiency gains As such changes in the economic environmentmdashcaused by high-tech digital markets engaging in platform competition increases in investment in intangible capital by leading companies and scale-biased technical change provoked by advances in information and communication technology (ICT)mdashhave led to the emergence of large efficient firms Such so-called superstar firms per Autor et al (2017) are able to secure larger market shares in ldquowinner takes mostrdquo markets2 In other words tougher competition (and not less) in these types of markets would reallocate more output toward the high-markup larger and more productive firms In this context superstar firms extract a larger market share which would then explain increases in aggregate (weighted average) market power On the other hand some authors argue that the increase in market power reflects declining competition caused by weakened antitrust enforcement or more stringent regulations that lead to worse allocative efficiency For instance Gutieacuterrez and Philippon (2018) argue that weaker antitrust enforcement in the United States relative to the European Union (EU) explains why market power has risen more in the United States than in EU countries
Against this backdrop this paper presents new evidence regarding the evolution of corporate market power in Romania It goes beyond the average performance of firms and explores firm-level heterogeneity to identify the underlying drivers of aggregate market power trends and the implications for economic growth This paper will explore several questions At the aggregate level the following queries will be assessed Has corporate market power increased How do aggregate trends differ across sectors and across technology intensity and knowledge intensity of sectors Next the analysis will focus on firm-level drivers of aggregate market power trends Regarding the latter the following questions will be assessed Is variation of market power uneven across firms To what extent has firm dynamismmdashthrough incumbents and new entrants or exiting firmsmdashbeen driving markup Does markup performance differ across firms with different attributes Finally to account for economic growth implications the paper will shed light on the potential productivity dividends stemming from fiercer competition across the economy proxied by a reduction in market power
2 METHODOLOGY
The definition of market power is well established Taking output markets as the reference point the standard (theoretical) definition of market power is the ability of a firm to maintain prices above marginal cost which is the level that would prevail under perfect competition The exact magnitude of a firmrsquos market powermdashwhich is tied to the gap between its price and
2 According to this view the dominance of ldquosuperstar firmsrdquomdashsuch as Amazon Apple Facebook Google and Microsoftmdashwould be due to intensified competition ldquofor the marketrdquo rather than anticompetitive mergers or collusion ldquoin the marketrdquo (Van Reenen 2018)
4
marginal costmdashwould depend on the format of the residual demand curve faced by the firm the steeper the inverse demand the larger the price-cost margin difference the higher the market power retained by the firm3
However the actual measurement of market power is not straightforward A commonly used approach is to approximate market power indirectly through market concentration indicators These indicators can assume various formats for instance concentration ratios and the Herfindahl-Hirschman index (HHI) Although these indicators are often relatively easy to computemdashespecially because they require only data on firm revenuesmdashthey have more drawbacks than benefits First and as highlighted in the seminal article of Bresnahan (1989) these indicators do not provide an adequate measure of market power in the presence of product differentiation Second the computation of these indicators requires the definition of a relevant market which usually considers the degree of product substitution geographic location of both producers and consumers transportation costs and so on In this regard it is often harder to define markets in periods of technological change Third the interpretation of results using these indicators can be ambiguous As highlighted by Shapiro (2018) an increase in market concentration could indicate a decline in competition reflecting the existence of less numerous and weaker rivals to dominant incumbent firms on the other hand an increase could equally reflect market competition forces in action making more efficient firms gain larger market shares
Another way to measure market power is to estimate markups Markups capture the ability of firms to charge prices above marginal cost Data availability is the key challenge associated with this methodological alternative as price data at the firm level rarely are accessible let alone data on marginal costs
A common method to estimate markups is the demand approach which involves estimating a demand system and then adding some assumptions on how firms set prices The data requirements associated with this approach are significant The demand method relies on the estimation of a demand system and assumes a fully specified model of consumer choice (see for instance Bresnahan 1989) The estimation itself requires detailed data on prices quantities sold and product characteristics all drawing from retail downstream purchases or consumer-level data Once the own-price and cross-price elasticities across the goods considered are estimated markups can be recovered from first order conditions after specifying a model of competition Overall the main shortcoming of this method is the need to use extremely detailed market-level data As a result the approach has been used only to assess market power in specific sectors for instance see Berry Levinsohn and Pakes (1995)
3 Following this standard approach the gap between price and marginal cost could be approximated by a Lerner index which is calculated as 119871119871119894119894 = 119875119875119894119894minus119872119872119872119872119894119894
119875119875119894119894 reflecting how far a firmrsquos price is from its marginal cost When
specifying a demand function and assuming that firms follow a profit-maximizing behavior it can be shown that for a given firmmdashin a Cournot quantity set case for instancemdashthe first-order condition equals 119871119871119894119894 = 120572120572119894119894
120576120576 where 120572120572119894119894
is the firmrsquos market share and 120598120598 is the demand elasticity of the firm Alternatively in the case of a dominant firm with a competitive fringe that together cover the entire market for a homogeneous good the Lerner index would be approximated as 119871119871119894119894 = 119878119878119894119894
120576120576119889119889+(1minus119878119878119894119894)120576120576119903119903 where 120576120576119889119889 is the marketrsquos elasticity of demand 120576120576119903119903 is the rivalrsquos collective
elasticity of supply and 119878119878119894119894 denotes the dominant firmrsquos market share
5
as well as Berry Levinsohn and Pakes (2004) for cars and more recently Koujianou Goldberg and Hellerstein (2012) for beer
The production approach on the other hand offers more flexibility It relies on simpler assumptions and the data requirements are less rigorous only firmsrsquo financial statements are needed Specifically there is no need to make assumptions on how firms compete in the market there are no restrictions on underlying consumer demand and only firm production data (on inputs and outputs) are needed which can be easily extracted from firmsrsquo financial statements This methodologymdashformally presented in De Loecker and Warzynski (2012)mdashbuilds on the work of Hall (1988) who shows that under cost minimization a firmrsquos markup (price over cost) equals the ratio of two values the output elasticity of a variable input (free of adjustment costs as opposed to quasi-fixed inputs) and the share of expenditures with that input in total revenue that is
120583120583 = 120573120573119881119881119904119904ℎ119886119886119903119903119886119886119881119881
Where 120583120583 is the markup 120573120573119881119881 is the elasticity of output with respect to the variable input and 119904119904ℎ119886119886119886119886119886119886119881119881 is the share of revenue spent on the variable input That said only two pieces of information are needed to estimate the firmrsquos markup the output elasticity which is obtained by estimating a production function of the sector where the firm operates and the revenue share which is directly observed in the data4
Given its flexibility the production approach will be applied to estimate firm-level markups as a proxy for market power in Romania The implementation of this method follows two steps The first is to define and estimate a production function to reflect the technology firms have access to For estimation purposes a firmrsquos i that belongs to sector j (defined at the NACE 2-digit level) production function at year t is represented by a flexible translog technology as follows
(1)
where all the variables are in natural logarithms and yjit is the firmrsquos annual total revenue from operations mjit is the total expenditure in intermediate materials kjit is the capital stock (sum of tangible and intangible assets) and ljit is the total number of hours worked per year (the natural logarithm of the product of the number of employees times the number of months worked times the number of hours worked per month)
TFPR is identified as any change in firmsrsquo revenue not caused by variations in the inputs of production More specifically in equation (1) TFPR (in natural logarithm) is identified by
4 The intuition behind this markup measure is discussed in De Loecker (2011) For a cost-minimizing producer the output elasticity of a variable input equals its expenditure share in total revenue only when price equals marginal cost Any departure from the perfect competitive model will be captured by the difference between the output elasticity and the revenue share as measured by the markup (price over cost)
6
(2)
The term ωjit is known by the firm but not by the econometrician which generates a problem of simultaneity between the inputs and productivity The last term (εjit) is assumed to be a completely random productivity shock not anticipated by the firms when making their input choices The Ackerberg Caves and Frazer (2015) approach is followed to solve the endogeneity problem and the anticipated productivity shock is divided into two terms
(3)
where the first term g(ωjitminus1) is the inertia of the productivity process that is highly productive firms at tminus1 will also have a high productivity level at t (present)5 This is the term that firms know when making their input choices The second term ξjit is the innovation of the productivity process and it is the key of the estimation process It can be interpreted as any change in the level of productivity that is completely new at time t and uncorrelated with past productivity
Since the innovation is uncorrelated with past productivity it is also uncorrelated with the optimal choices of the variable inputs that is materials and labor made at moment tminus1 Moreover since capital is a fixed input and it takes time to change its level one can also assume that the innovation of productivity is uncorrelated with the capital input choices made at moment t This set of assumptions allows one to form a set of moment conditions as follows6
(4)
which states that we can use the lack of correlation between lagged flexible inputs and contemporaneous capital on the one hand and productivity innovation on the other to identify (estimate) the parameters of the production function in equation (1) To account for differences in production technologies across sectors the TFPR estimation as discussed above allows for heterogeneous sector-specific (NACE 2-digit) production functions
Using the estimations of the production function it is possible to compute the output elasticity of the variable input (here assumed as materials) in sector j where firm i operates as follows
(5)
In this regard it should be noted that all firms in the same sector j are assigned a common elasticity The interpretation is that firms in the same sector have access to the same technology but they differ both in terms of TFPRjit and the optimally chosen level of variable input (material)
5 Following the terminology used in the literature the current analysis assumes that productivity follows a first-order Markov process in the sense that it depends only on its own past values The functional form is approximated by a polynomial of degree 3 on the first lag of TFPR This is a quite general procedure see for instance De Loecker (2013) 6 A moment condition is a statistical equality that holds in the population under study
7
Once the output elasticity of the variable input is estimated the second operational step is to use information on expenditures on variable inputs to compute a firmrsquos markup Specifically firmrsquos markup can be directly computed as follows
micro119895119895119894119894119895119895 = 120573120573119872119872119895119895
119872119872119904119904ℎ119886119886119903119903119886119886119895119895119894119894119895119895 (6)
where 120573119872119872119895119895 was estimated in the previous step and 119872119872119904119904ℎ119886119886119886119886119886119886119895119895119894119894119895119895 is the ratio of cost of variable input (materials) to corrected revenue defined as
(7)
where PMMjit is total cost of raw materials Yjit is total revenue and εjit is the unanticipated productivity shock obtained as a residual in the estimation of the production function (see equation 2)
The interpretation of firm-level markups estimated through this production approach must be made with some caution First because markup is recovered through TFPR (and not TFPQ) the estimated result conflates market power itself with differences in product quality and other factors affecting the demand for the product78 Secondmdashand this applies to any methodological procedure not only the production approachmdashmarkup cannot be taken as an absolute value and should not be used to compare different markets since markups will be naturally higher in markets where a large proportion of costs are fixed In this regard it is safer to use markup estimates to illustrate comparisons across firms within markets for instance to shed light on the correlation with other firm characteristics (such as productivity ownership size and location)9 Last but not least it is important to stress that rising markups do not necessarily imply a decline in competition It can reflect vertical differentiation strategies (such as quality upgrading or advertising) or even the implementation of more efficient production processes (or the introduction of innovative products) for which rising markups enable firms to recoup growing fixed costs or to reward high-risk activities such as investment in RampD In this context an in-depth competition assessment would be needed not only to better understand the intrinsic market features (including supply-side and buyer characteristics) but also to identify and assess the potential anticompetitive effects of government intervention in markets
7 To mitigate this conflation risk the analysis tries to some extent to disentangle the sources of markup differences within a sectormdashthat is whether they are derived from higher prices or lower marginal costs (reflected by higher productivity) This is possible because the procedure adopted generates estimates of both TFPR and markup See the results in table A16 in annex 1 8 In a recent article Bond et al (2020) argue that in the absence of information on output quantities to estimate TFPQ as is typically the case (including in the current analysis) it is not possible to obtain consistent estimates of output elasticities when firms have market power and markups are heterogeneous This issue casts doubt over interpretation of markup values especially trends However the production approach for estimating markups is still valid if results are used to assess differences in average markups across different groups of firms (different characteristics) provided one is willing to assume that these groups of firms share the same production function parameters 9 See footnote 8
8
3 DATA SET
The assessment of corporate market power in Romania draws on firm-level data from the Structural Business Survey (SBS) for the period 2008ndash17 The SBS data setmdashprovided by the National Institute of Statistics of Romaniamdashencompasses complete financial information at the headquarters level for the 2008ndash17 period for the surveyed firms This survey is exhaustive for firms with at least 20 employees and provides a representative sample for firms with fewer than 20 employees As such the data set has two strata one completely enumerated covering a census of all enterprises with at least 20 employees and the second a random stratum covering some smaller firms On the basis of this sample design an unbalanced panel is constructed by considering all listed firms (of both strata) for all years In this way the panel allows entry and exit and does not impose any firm size threshold
Firm-level information from SBS is classified at NACE 4-digit level which is considered a proxy for the product market where a firm operates SBS-sampled activities include all sectors except agriculture and banking Therefore the analysis focuses on mining services and manufacturing activities In addition the SBS data assign one NACE 4-digit sector classification for each firm where the firmrsquos main product is classified As such all firms within a NACE 4-digit sector classification are considered to be in one product market In the current analysis the product market definition deliberately does not coincide with the classical definition of ldquorelevant marketrdquo10 which normally considers the degree of product substitution geographic location of both producers and consumers transportation costs and so on11
The SBS data contain all the variables needed to estimate the production function that underlies markup computation The variables needed to estimate TFPR and markups following the production approachmdashas described in the previous section and expressed in equation (1)mdashare firmsrsquo annual total revenue from operations12 total expenditure in intermediate materials capital stock (sum of tangible and intangible assets) and total number of hours worked per year
After deflating nominal accounting data and controlling for outliers the final data set contains 405641 firm-year markup observations for 167756 firms over the 2008ndash17 period All accounting information from the SBS was deflated using the country-level GDP deflator (from World Development Indicators and Eurostat) to express values in Romanian lei for 2000 Once nominal values were deflated additional steps were taken to control for outlier observations in particular observations on revenue employment capital (tangible assets) and costs of raw materials with a value of zero or lower than zero were excluded from the estimation This procedure generated a final (unbalanced panel) data set with 405641 firm-
10 For market power assessment purposes a relevant market is defined by the set of products and geographical areas that exercise competitive constraints on each other (see Motta 2004 for further discussion) 11 In principle this assumptionmdashthat firms under one 4-digit sector classification belong to the same marketmdashcould imply some bias in the case of multiproduct firms that sell goods that are not close substitutes However this bias can be mitigated by using NACE 4-digit sectoral disaggregation In addition in the absence of firm-level information for multiple products it is assumed that the firm-level markup is a weighted average markup across different products within the firm 12 The data set does not contain information on physical quantity produced by each firm Deflated sales are used as a measure of physical quantity to estimate output elasticities and then to recover markups De Loecker and Warzynski (2012) show that using this approach to recover markups potentially affects the level of estimated markup but not the temporal changes in the markup
9
year observations (see table 1) which was then used to estimate markup The final data set contains firm-year markup observations for 167756 firms over 2008ndash17 Table 2 displays the summary statistics for all variables used to compute TFPR and markup for these firms13
13 The original number of firms in the SBS is 484604 405641 firms were considered after removing outliers in markup and TFPR This note defines outliers as those observations with a value greater than Q3+3IQR or lower than Q1minus3IQR where Q1 and Q3 are the first and third quartiles and IQR is the interquartile range
10
Table 1 Final sample of firm-year observations Year Manufacturing Services Mining Total 2008 15056 31346 320 46722 2009 14038 31598 318 45954 2010 12997 29759 317 43073 2011 9492 25942 239 35673 2012 10151 26983 245 37379 2013 9806 29460 229 39495 2014 10381 29872 253 40506 2015 10286 28844 260 39390 2016 10199 28449 249 38897 2017 10018 28280 254 38552 Total 112424 290533 2684 405641
Source World Bank staff calculations based on SBS data set Note Total number of observations by year and sector with production function variables
Table 2 Summary statistics Year Revenue (ln) Employment (ln) Intermediate materials (ln) Capital stock (ln)
Mean SD Mean SD Mean SD Mean SD 2008 1473 229 289 136 1207 267 1168 271 2009 1470 220 282 132 1187 262 1182 269 2010 1470 228 276 135 1202 268 1184 268 2011 1533 200 306 133 1252 260 1228 258 2012 1523 208 304 132 1253 261 1222 259 2013 1503 212 292 133 1232 264 1209 263 2014 1507 213 294 132 1237 262 1204 264 2015 1532 198 307 128 1255 255 1211 264 2016 1540 191 311 126 1244 263 1214 263 2017 1546 189 313 125 1241 270 1220 262 Total 1508 212 297 132 1229 264 1203 265
Source World Bank staff calculations based on SBS data set Note SD = standard deviation
11
4 RESULTS
41 HAS CORPORATE MARKET POWER INCREASED AT THE AGGREGATE LEVEL HOW DO AGGREGATE TRENDS DIFFER ACROSS SECTORS IS THERE A GROUP OF FIRMS DRIVING THE OVERALL TREND
Results show that the average markup in Romania increased by around 15 percent during 2008ndash17 However this expansion was marked by an uneven trend Figure 1 panel a displays the evolution of the (sales-weighted) aggregate markup for the 2008ndash17 period for the whole economy (aggregating manufacturing services and mining) At aggregate level average markups experienced a 15 percent aggregate increase from 2008 to 2017 However three alternating trends are detected in this whole period a sharp increase of more than 15 percent during 2008ndash09 a strong decline after 2009 when markups fell by 23 percent from 2009 to 2012 and a consistent increase of 215 percent from 2012 to 2017
Figure 1 Evolution of (sales‐weighted) average markup by sector 2008ndash17 a All sectors b Manufacturing
c Services d Mining
Source World Bank staff calculations based on SBS data set
Because aggregate numbers mask a lot of heterogeneity it is not surprising to see
92
94
96
98
11
02M
ark-
up in
dex
(200
8 =
1)
2008 2009 2010 2011 2012 2013 2014 2015 2016 2017Year
Manufacturing
11
11
21
31
4M
ark-
up in
dex
(200
8 =
1)
2008 2009 2010 2011 2012 2013 2014 2015 2016 2017Year
Services
51
15
22
5M
ark-
up in
dex
(200
8 =
1)
2008 2009 2010 2011 2012 2013 2014 2015 2016 2017Year
Mining
12
different trends when unraveling markups across sectors Because of their intrinsic characteristics firms are different from each other and contrast in terms of performance even within very narrowly defined sectors (Syverson 2004) These differences could persist either because of supply-side factors such as management skills RampD or investment patterns (Bartelsman and Doms 2000) or because of demand-side factors related to product differentiation customer-producer relationships geographical segmentation among others That said firms across high-level sectorsmdashmanufacturing services and miningmdashhave shown varied performance While the manufacturing (sales-weighted) average markup experienced a decline of minus57 percent over the 2008ndash17 period (figure 1 panel b) there was an opposite and much more rapid trend in services with an aggregate change of 422 percent (see figure 1 panel c) Weighted average markup in mining experienced an uneven trend throughout the same period Nuances are unveiled even within sectors as aggregate markup performance shows different patterns when breaking manufacturing down into groups of sectors according to their technology intensity14 This is also observed when services are broken down into groups of sectors according to their knowledge intensity15 (see figure A11 and figure A12 in annex 1)
Further there is also evidence of changes in the markup firm distribution from 2008 to 2017 revealing an increasing proportion of firms with relatively high markups Figure 2 displays the firm-level distribution of markups in 2008 and 2017 Some changes are noteworthy First both the mean and variance increased over that period But more importantly the upper tail of the distribution became fatter over time suggesting that in 2017 more firms have higher markups than in 2008 This suggests that the rise in average markups is associated with large increases among the firms with the highest markups
14 As per Eurostat classification manufacturing sectors are classified as high-technology medium-high-technology medium-low-technology and low-technology according to technological intensity (RampD expenditure or value added) and based on the statistical classification of economic activities in the European Community (NACE) at the 2-digit level See table A11 in annex 1 with sector aggregation 15 As per Eurostat classification service sectors are classified as knowledge-intensive services (KIS) and less-knowledge-intensive services (LKIS) KISs comprise knowledge-intensive market services high-tech knowledge-intensive services knowledge-intensive financial services and other knowledge-intensive services LKIS comprise less-knowledge-intensive market services and other less-knowledge-intensive services Both KIS and LKIS are based on the share of tertiary educated persons at the NACE 2-digit level See table A12 in annex 1 with sector aggregation
13
Figure 2 Distribution of firm-level markups all sectors 2008 and 2017
Source World Bank staff calculations based on SBS data set
In fact data show that the rise in average markup has been driven by the ability of a small group of firmsmdashthe top decile firmsmdashto increase their markups over time especially after 2014 Figure 3 panel a shows that markup growth has been progressively uneven across firms with firms in the top decile of the markup distribution increasing their average markup faster than the rest of firms Firms in the 90th percentile increased their (sales-weighted) average markup by 285 percent from 2008 to 2017 while the rest of firmsmdashthose below the top decilemdashexperienced a completely opposite trend their weighted markup contracted by 83 percent over the same period This shows that the increase in the weighted average markupmdashof around 15 percent as shown in figure 3 panel amdashcomes mainly from the group of firms in the top decile of the markup distribution The divergence between the top decile and the rest of firms remains even when results are broken down by sectors it is more pronounced in manufacturing despite some volatility (figure 3 panel b) while in services this happens only after 2014 (panel c) The mining sector experienced the opposite trend (panel d) as most of the time (until 2016) the top decile group of the markup distribution reported lower markup growth than the rest of the firms in the data set
02
46
kden
sity
lnmu
-2 0 2 4 6 8Mark-up (ln)
2008 2017
14
Figure 3 Evolution of (sales-weighted) average markup by sector and by top decile and firm groups (top decile firms versus the rest) 2008ndash17
a All sectors b Manufacturing
c Services d Mining
Source World Bank staff calculations based on SBS data set
Overall these results suggest that any analysis about markup performance in Romania should pay attention to a small group of firms the top decile of firms based on markup distribution These firms have been accounting for increasing shares of value added and employment in the economy Figure 4 shows that the share of value added in the whole economy (including manufacturing services and mining sectors) as accounted for by the firms in the top decile of the markup distribution has been increasing jumping from less than 13 percent in 2008 to 231 percent in 2017 The same applies to employment the sample of the top decile of firms accounts for an increasing share of employment generated in the economy across the 2008ndash17 period (figure 5)
91
11
12
13
Mar
k-up
inde
x (2
008=
1)
2008 2009 2010 2011 2012 2013 2014 2015 2016 2017Year
Average (wgtd)perc 90 (wgtd)Rest of firms (below perc 90) (wgtd)
All firms
15
Figure 4 Share of total value added accounted for by the top decile firms 2008ndash17
Figure 5 Share of employment accounted for by the top decile firms 2008ndash17
Source World Bank staff calculations based on SBS data set
Source World Bank staff calculations based on SBS data set
These top decile firms are also typically smaller less productive and less likely to invest in intangible assets than the rest of the firms As highlighted in the methodological section of this paper the increase of markups cannot be unequivocally interpreted as a decline in competition in a given market it can reflect firmsrsquo efficiency gains or adoption of quality-upgrading strategies To explore this aspect a simple econometric analysis was applied to capture performance differences between the group of firms that is leading the markup increase (the top decile firms) and the rest of the firms based on the markup distribution The following specification was adopted
119862119862ℎ119886119886119886119886119886119886119886119886119886119886119886119886119886119886119886119886119904119904119886119886119886119886119886119886119888119888119895119895119894119894119895119895 = 1205751205750 + 1205751205751119879119879119879119879119879119879_119889119889119886119886119886119886119886119886119889119889119886119886119894119894119895119895 + η119895119895 + ρ119895119895 + γ119888119888 + 120583120583119888119888119895119895119894119894119895119895 (8)
where the dependent variable reflects different firm characteristics (of firm i that operates in sector j county c at year t) to be compared Three dependent variables are tested size (measured in terms of the number of full-time employees) productivity (measured as TFPR discounted for markup16) and intangible assets (measured as a dummy that takes the value of 1 for firms having a positive value of intangible fixed assets17) The key explanatory variable is 119879119879119879119879119879119879_119889119889119886119886119886119886119886119886119889119889119886119886119894119894119895119895 a dummy that takes the value of one firm if i is among the top decile of the markup distribution in year tmdashwhile ηt ρj and γc are respectively time NACE 4-digit sector and county fixed effects The parameters of equation (8) are estimated by OLS (or Probit regression maximum likelihood when the dependent variable is the intangible assets dummy) always using heteroscedasticity-robust standard errors Results displayed in table 3 columns 1 and 2 suggest that firms in the 90th percentile of the markup distribution are on average 468
16 TFPR discounted for markup is computed as TFPR-markup In this regard it is not a perfect measure of the true technical efficiency but just a proxy of productivity that accounts for market share and the effect of materials elasticity while other factors such as the effect of product quality or innovation are not considered 17 Value of intangible assets in the SBS data set is defined as value built on (a) RampD expenditure and (b) franchise patents and other similar rights and values
1015
2025
Perc
enta
ge
2008 2009 2010 2011 2012 2013 2014 2015 2016 2017Year
1012
1416
18Pe
rcen
tage
2008 2009 2010 2011 2012 2013 2014 2015 2016 2017Year
16
percent18 smaller and 91 percent 19 less productive than the rest of the firms even within narrowly defined sectors (at NACE 4-digit level) Results in column 3 captures the differences between these two groups of firms in terms of their willingness to invest in intangible assetsmdashtheir ldquoknowledge capacityrdquomdasha key determinant of firmsrsquo expansion in the long term Results suggest that the sample of top decile firms are almost 33 percent less likely to invest in intangible fixed assets than the remaining firms even within NACE 4-digit sectors20 All these correlations are statistically significant at the 1 percent confidence level
Table 3 Characteristics of top decile firms Conditional correlations between markups and firm characteristics (OLS and Probit results)
(Estimation method) Dependent variable (1)
(OLS) Employment
(ln)
(2) (OLS)
TFPR discounted for markup (ln)
(3) (Probit)
Investment in intangibles
(yesno) Top _decile minus0632 minus2422 minus0386 NACE 4-digit sector fixed effects
Yes Yes Yes
County fixed effects Yes Yes Yes Year fixed effects Yes Yes Yes R2 (pseudo R2)a 0238 0728 0078 Observations 484604 403561 484594
Source World Bank staff calculations based on SBS data set Note All firm-year observations (for the 2008ndash17 period) are pooled together and NACE 4-digit sector and year fixed effects are included OLS = ordinary least squares TFPR = revenue-based total factor productivity a It is worth highlighting that R2 value does not influence the consistency of the estimators of each population parameter which is the objective of the current analysis See for instance Cameron and Trivedi (2010) for a theoretical discussion on this matter Moreover since the analysis draws on a large sample the standard errors of the coefficient estimators are not affected because of the law of large numbers The key issue would be the lack of correlation of omitted variables and the explanatory variables However given that the main (theoretical) determinants of the markup performance are included the omitted variables can be understood to be random Statistically significant at 1 percent
In addition the group of 10 top decile firms in the markup distribution operate mainly in the services sector and are overrepresented in less-knowledge-intensive services sectors with some exceptions Table 4 displays the distribution of top decile firms across NACE 2-digit sectors in 2017 To control for the fact that some sectors might be overrepresented (given the SBS survey sampling) the table shows only those sectors for which the probability of a firm being in the top decile is larger than the sectorrsquos frequency ratio Results show that firms in the 90th percentile of markup distribution are overrepresented in wholesale trade and retail trade sectors the probability of a top decile firm being in these two sectorsmdashclassified as less-knowledge-intensive services according to the Eurostat definition
18 This value results from the following expression 100[exp(beta)minus1] where beta equals estimated top 90 percent dummy coefficients in an OLS regression where size is the dependent variable controlling for 4-digit and county fixed effects (table 3 column 1) 19 This value results from the following expression 100[exp(beta)minus1] where beta equals estimated top 90 percent dummy coefficients in an OLS regression where TFPR is the dependent variable controlling for 4-digit and county fixed effects (table 3 column 2) 20 The odds-ratio is computed as the relative difference between the marginal effects for each category (that is 42 percent for the top decile firms and 56 percent for firms below the 90th percentile) Specifically it is computed as follows (56 percent minus 42 percent)(42 percent)
17
(see table A12 in annex 1)mdashis almost 40 percent21 It is worth highlighting however that these top decile firms also operate in some knowledge-intensive services sectors though the probability is much smaller 387 percent for computer programming and 268 percent for security and investigating activities22
When taken together these results suggest that the small group of firms leading the overall increase in markups in Romania does not seem to follow the typical superstar firmsrsquo profile As discussed by Van Reenen (2018) and Autor et al (2017) superstar firmsmdashtypically with higher markups larger and more productive ndash would be rewarded with larger market shares due to their innovative nature This hypothesis does not seem to be supported by data in Romania As results showed the group of firms who are driving the aggregate rise in markupsmdashthe top decile firms of the markup distributionmdashare typically smaller less productive less likely to invest in intangible assets and are mostly active in services sectors where use and diffusion of knowledge is less important This may suggest that the increase in markups in Romania might reflect a less competition-intensive environment rather than changes in the nature of competition where superstar firms would be rewarded with greater market share because they are more efficient and innovative
Table 4 Probability of a top decile firm (in the markup distribution) being in the following sectors
2-digit sector Probability Wholesale trade 2436 Retail trade 1477 Computer programming 387 Manufacturing of wearing apparel 321 Real estate activities 314 Security and investigation activities 268
Source World Bank staff calculations based on SBS data set Note The table shows only sectors for which the probability of a firm being in the top decile of markup distribution is higher than the sectorrsquos overall frequency ratio
42 HOW HAVE FIRM DYNAMICS INFLUENCED AGGREGATE MARKUP PERFORMANCE ARE THERE SIGNS OF MARKET POWER CONSOLIDATION AMONG INCUMBENT FIRMS
To indirectly assess whether the rise in markups is associated with weakening competition the analysis decomposes the evolution of aggregate markups into that of incumbents and of net entry of firms To do so the Melitz and Polanec (2015) decomposition technique is applied to the aggregate markup changes between 2008 and 2017 This approach follows two steps First the aggregate (ln) markup (μ) at year t is defined as
21 Under the NACE 2-digit wholesale trade sector the group of top decile firms are overrepresented in the following NACE 4-digit sectors sector 4690ndashNon-specialized wholesale trade sector 4673ndashWholesale of wood construction materials and sanitary equipment sector 4621ndashWholesale of grain unmanufactured tobacco seeds and animal feeds sector 4646ndashWholesale of pharmaceutical goods sector 4675ndashWholesale of chemical products and sector 4631ndashWholesale of fruit and vegetables Under the NACE 2-digit retail services sector the sample of top decile firms are overrepresented in the following NACE 4-digit sectors sector 4711ndashRetail sale in non-specialized stores with food beverages or tobacco predominating and sector 4730mdashRetail sale of automotive fuel in specialized stores 22 The same analysis is applied for ownership structure again controlling for overrepresentation Results show that the sample of top decile firms are overrepresented in the fully foreign-owned ownership category
18
120583120583119895119895119895119895 = sum sum 119904119904119895119895119894119894119895119895119894119894isinΩ119895119895 120583120583119895119895119894119894119895119895119894119894isin119896119896119895119895 (9)
where sjit is firm irsquos market share at moment t where the market share is defined in terms of firm irsquos revenue weight over the total revenue of sector j (kj) where sector j is the sector to which firm i belongs Then the change of (ln) markup between moments t and tminus1 is decomposed as
Δ120583120583119895119895119895119895 = Δ120583119878119878119895119895119895119895 + Δ119862119862119879119879119907119907119878119878120583120583119878119878119895119895119894119894119895119895 119904119904119878119878119895119895119894119894119895119895 + 119904119904119864119864119895119895119895119895120583120583119864119864119895119895119895119895 minus 120583120583119878119878119895119895119895119895 + 119904119904119883119883119895119895119895119895120583120583119878119878119895119895119895119895 minus 120583120583119883119883119895119895119895119895 (10)
where the subindex S refers to survivor firms (that is those operating in both years t and tminus1 the subindex X denotes firms exiting the market or those firms present in moment tminus1 but not in moment t and E denotes entrants or those firms operating in moment t but not in moment tminus1 Each component expressed in equation (10) represents different drivers to explain aggregate change in markup over the period The first term is the change of the
unweighted average ln markup of survivors or the ldquowithinrdquo component Likewise is the change in the covariance between ln markup and market share for
survivors only This is the ldquobetweenrdquo component and it measures the reallocation of resources among surviving firms The term is the ldquoentryrdquo component and it measures
the difference of the aggregate ln markup of entrants and that of survivors at moment t weighted by the share of entrants over the total population of firms ( ) The entry component will be
positive if the aggregate markup of those firms entering the market is larger than the aggregate markup of the survivors Finally is the exit component which measures the
difference between the aggregate ln markup of survivors and exiting firms at moment tminus1 likewise weighted by the proportion of firms exiting the market that is This term is
positive if the aggregate ln markup of the exiting firms is lower than the aggregate ln markup of survivors In other words and as displayed in equation (10) aggregate markup can growshrink because (a) incumbent firms have increaseddecreased their markups (the ldquowithinrdquo component) (b) incumbent firms with high markups have gainedlost market share (the ldquobetweenrdquo component) and (c) entrant firms have higherlower markups than exiting firms (the ldquoentryrdquo or ldquoexitrdquo component)23
Results show that the increase in aggregate markups has been driven mostly by incumbents rather than entrants and exiting firms Decomposition results for the full sample of firms are displayed in figure 6 Estimations suggest that a large proportion of the aggregate increase in markup in Romania was driven by increases within incumbent firms (the ldquowithinrdquo bar) And among incumbents results show that the rise in markups reflects mostly a markup increase within firms rather than a reallocation of market share away from low-markup to high-markup companies (the ldquobetweenrdquo bar) Meanwhile the entry of new firms with lower markups pulled the change in aggregate markups down (the ldquoentryrdquo bar) and contribution from
23 SBS tends to underestimate entry and exit (populational) figures as a result of its sampling design In this regard the proposed analysis captures entry and exit in the enumerated stratum (above 20 employees) so results will be representative at least for the population of firms in the enumerated stratum
19
exiting firms was negligible
20
Figure 6 Decomposition of percentage change of (sales-weighted) average markup 2008ndash17
Source World Bank staff calculations based on SBS data set
This result could be interpreted as a sign of consolidation of market power among existing firms enabled by remaining product market regulations that restrict competition despite previous reforms Several policy-related factors can explain this result among them government interventions and regulations that restrict competition by reinforcing dominance or limiting entry facilitating collusive outcomes or increasing the cost to compete in markets and discriminating and protecting vested interests24 In this regard Pop and Ore Monago (2020) provide illustrative examples about the presence of regulations that still restrict competition in Romania drawing from the OECDndashWorld Bank Group (WBG) product market regulation (PMR) indicators data set which provides information across 70 countries25 The assessment uses the latest PMR round for Romania from 2013 and includes Romaniarsquos performance projected on the basis of information updated in 2017 Results suggest that the regulatory framework as it is in the books in Romania is less restrictive than that of countries such as Poland and the total sample average but it is more restrictive than that of the OECD and EU-15 countries However from an economywide perspective the overall restrictiveness of regulations in Romania is mainly associated with the state control of the economy and several remaining barriers to entry and rivalry (see figure 7)
24 In principle greater competition outcomes are enabled through an effective competition policy framework which involves three key pillars (a) fostering pro-competition regulations and government interventions (b) promoting competitive neutrality and non-distortive public aid and (c) enabling effective competition law and antitrust enforcement 25 The current PMR database used for this study includes Argentina Australia Austria Belgium Bolivia Brazil Bulgaria Canada Chile China Colombia Costa Rica Croatia Cyprus the Czech Republic Denmark the Dominican Republic Ecuador Arab Republic of Egypt El Salvador Estonia Finland France Germany Greece Guatemala Honduras Hungary Iceland India Indonesia Ireland Israel Italy Jamaica Japan Kenya the Republic of Korea Kuwait Latvia Lithuania Luxembourg Malta Mexico the Netherlands New Zealand Nicaragua Norway Panama Paraguay Peru the Philippines Poland Portugal Romania the Russian Federation Rwanda Senegal the Slovak Republic Slovenia South Africa Spain Sweden Switzerland Turkey Tunisia Ukraine Uruguay the United Kingdom and the United States
21
Figure 7 Product market regulation in Romania and comparator countries
Source Pop and Ore Monago 2020 Note The top five performers in the overall PMR indicator are the Netherlands United Kingdom Austria Denmark and New Zealand Figure shows 2013 information unless otherwise indicated PMR = product market regulation
Barriers to entry and rivalry still affect some service sectors In fact there are examples of regulations that hamper competition in retail trade which concentrates a substantial proportion of high-markup firms in the Romanian economy as seen previously Drawing from the OECD-WBG PMR data set Pop and Ore Monago (2020) show that although regulations in the retail trade sector are less restrictive than in the EU-15 and OECD there is still room for improvement to make the retail trade market more efficient The authors show that licenses and permit requirements may still be imposing an unnecessary burden on entry and increasing the costs to compete in the sector Companies operating in retail sectors in Romania are subject to requirements that go beyond the general conditions formalities and procedures applicable to any company For instance in Romaniarsquos clothing industry licenses and permits are always required compared with 57 percent of OECD countries and 60 percent of EU-15 countries which do not have such a requirement26 In addition Romania has regulations that impose restrictions on entry or expansion of business activities and constrain strategic options to compete in retail markets For instance most of the PMR countries and all top five performers do not restrict firms from selling below cost (beyond a prohibition of predatory pricing) and restrictions on sales promotions are not a common practice either27 In Romania sales below cost are prohibited or restricted beyond a prohibition of predatory pricing Likewise sales promotions are restricted to a particular time of the year28
43 DO FIRM MARKUPS DIFFER ACROSS FIRMS WITH DIFFERENT ATTRIBUTES
To answer this question the analysis explores how markup performance differs across different types of firms To assess the heterogeneity in markups the analysis relates markups to firm-level characteristics such as size age ownership status RampD status and location
26 In this case the least restrictive countries such as Bulgaria Latvia and Sweden do not have such requirements 27 Among the Central and Eastern Europe comparator countries only the Czech Republic and the Slovak Republic apply restrictions on discounted sales pricing while only Poland applies constraints to sales promotions 28 Government Ordinance no 992000 prohibits sales below costs and provides for the conditions and periods when certain types of promotions can take occur
5156 51 52 47 49 53
62 55
3830 42 40 43 39
4333 41
1114
6 9 10 125 5 4
113129 133 134 141 148 156
165 169
0
05
1
15
2
25
3
0
05
1
15
2
25
3
Top 5 -PMR SlovakRepublic
Hungary EU-15average
CzechRepublic
OECDaverage
2013
Romaniasim 2017
Poland Romania
State control (SC) Barriers to entry and rivalry (BER) Barriers to trade and investment (BTI)
Avg of all countries = 190
22
within narrowly defined product markets proxied by NACE 4-digit sectors The following regression is estimated
120583120583119888119888119895119895119894119894119895119895 = 1205751205750 + sum 12057512057511198961198961198791198791199001199001198991198991198961198961198881198881198951198951198941198941198951198957119896119896=2 + sum 1205751205752119903119903119904119904119886119886119904119904119886119886119903119903119888119888119895119895119894119894119895119895
3119903119903=2 + sum 1205751205752119902119902119886119886119886119886119886119886119902119902119888119888119895119895119894119894119895119895
3119902119902=2 + 1205751205753119889119889119888119888119895119895119894119894119895119895
119864119864119864119864119864119864 +1205751205754119889119889119888119888119895119895119894119894119895119895119877119877119877119877119889119889 + 1205751205755119896119896119888119888119895119895119894119894119895119895 + 120578120578119895119895 + 120588120588119895119895 + 120574120574119888119888 + 119906119906119888119888119895119895119894119894119895119895 (11)
where ownkcjit with k = 23hellip7 comprises a set of dummies defining the type of ownership of the firm Romanian private (omitted category) majority state-owned state-private ownership Romanian private and foreign fully foreign-owned public of national and local interest and other (cooperatives and craft organizations)29 The term sizercjit is a set of three dummies controlling for firmsrsquo sizemdashsmall or fewer than 50 employees (omitted category) medium or 51ndash250 employees and large more than 250 employees The term agercjit is a set of three age dummiesmdashyoung or less than 5 years old mature or 6ndash15 years old and older than 15 years Two dichotomous variables are also defined to capture export and RampD profiles dExp and dRnd which take a value of 1 if a firmrsquos direct exports represent more than 10 percent of a firmrsquos total revenue and if a firmrsquos RampD represents more than 1 percent of a firmrsquos total revenue respectively In addition kcjit is firmsrsquo total capital stock value (sum of tangible and intangible assets)30 Finally ηt ρj and γc are respectively time NACE 4-digit sector and county fixed effects Equation (11) is estimated separately for each 1-digit sector (that is manufacturing services and mining) and for the whole economy while the equation parameters are estimated by OLS always using heteroscedasticity-robust standard errors The complete set of results is displayed in table A15 in annex 1
Results show that ownership structure matters to explain markup differences across firms State-controlled companies tend to exert the highest markup premiums in the overall economy and especially in the manufacturing sector Table 5 displays the estimated coefficients of ownership categories multiplied by 100 Except for the mining sector most of estimated coefficients are statistically significant which suggests that ownership structure makes a difference to explain markup performance even for firms operating in the same product market (here proxied by NACE 4-digit sector) county location and year and with similar characteristics in terms of size age and export and RampD profile
In particular firms in which the state has majority or minority ownership demonstrate higher markups when compared with domestic privately owned companies (see table 5 column 4) The average difference in markup is higher for companies with minority state ownership (289 percent) than for fully state-owned companies (200 percent) In manufacturing markups of fully state-owned firms are the highest on average at 527 percent when compared with the reference category (domestic privately owned firms) Results in services are mixed with both private and state ownership extracting high premiums private firms with mixed domestic-foreign ownership show the highest average difference (279 percent) closely followed by minority state-owned companies for which the markup premium
29 More details about the original ownership classification in SBS and the aggregation used for the analysis can be found in table A13 and table A14 in annex 1 30 The variable lnTFPRkit is included as an additional control to test the robustness of the analysis See results in table A16 in annex 1
23
is 275 percent compared with the reference category 31 All results are robust to the inclusion of productivity as an additional control variable (see results in table A16 in annex 1)32
Table 5 Average markup differences by ownership structure relative to domestic privately owned firms
(1) Manufacturing
()
(2) Services
()
(3) Mining
()
(4) All sectors
() Majority state-owned 527 139 772 200 State-private ownership 352 275 ns 289 Domestic private + foreign 161 279 ns 229 Fully foreign-owned 105 263 ns 201 Public of national and local interest
209 149 ns 214
Source World Bank staff calculations based on SBS data set Note Numbers reflect estimated coefficients (multiplied by 100) for ownership dummy categoriesmdashrelative to Romanian private firms the omitted categorymdashin a fixed-effect regression model controlling for firm covariates plus year and NACE 4-digit sector fixed effects as displayed in equation (11) More details about the original ownership classification in SBS and aggregation used for the analysis can be found in table A13 and table A14 in annex 1 See table A15 in annex 1 for the complete set of results ns = not statistically significant
Larger firms and older companies wield higher markups when compared with their counterparts implying that firm size and age are relevant characteristics that influence markup differences As shown in figure 8 old companies (older than 15 years) display higher average markups than young ones (1ndash5 years old) even when they share similar attributes (in terms of ownership structure size and export and RampD profiles) and operate in the same NACE 4-digit sector county and year The estimated average markup premium for old companies (relative to young ones) is 54 percent for the whole economy It varies depending on how data are clustered across large sectors 79 percent in manufacturing 48 percent in services and 228 percent in mining Higher markup premiums for older companies can be interpreted in two ways it can reflect that more experienced firms are able to transpose learning returnsmdashwhich could positively affect their productivity or reduce their marginal costsmdashinto higher markups or that older firms are able to lobby better and create barriers to entry making it more difficult for younger firms to exert competitive pressure Firm size also matters to explain markup performance large companies (with more than 250 full-time employees) tend to display higher markups compared with small companies even when they operate in the same product market and share similar characteristics On average for the whole economy the
31 Results for the category ldquootherrdquo are not shown in table 5 As detailed in table A13 in annex 1 this ldquootherrdquo category refers to SBS ownership answer-codes 40 and 50 respectively ldquocooperativerdquo and ldquopublic of national and local interestrdquo The reason the corresponding results were not highlighted in the main text are twofold First the above-mentioned category accounts for only 006 percent of total companies in the sample Second an in-depth analysis would be needed to understand whether this ldquootherrdquo category reflects potential noise in the way firms self-classify their ownership structures or the way firms report cost expenditures (mainly) or whether this was influenced by SBS sampling design 32 Because the production approach applied in the current analysis delivers both markup and productivity estimates it is possible to further decompose the markup differences across firm characteristics and to verify whether after controlling for differences in marginal costs (that is productivity) certain groups of firms still have higher markups This is precisely one of the mitigating methods employed to reduce the conflation risk as highlighted before Results in table A16 in annex 1 should be interpreted as follows once productivity level is included in the equation differences in marginal cost are accounted for so the coefficient on ldquomajority state-ownedrdquo for instance captures the variation in average prices between majority state-owned and the size reference category (domestic privately owned firms)
24
markup premium for large companies is 122 percent higher than that of small firms (figure 9) Both size and age effects are still present even after controlling for productivity differences (see table A16 in annex 1)33
Figure 8 Average markup differences relative to young firms by age category
Figure 9 Average markup differences relative to small firms by size category
Source World Bank staff calculations based on SBS data set Note Numbers reflect estimated coefficients (multiplied by 100) for age dummy categoriesmdashrelative to young firms (1ndash5 years old) the omitted categorymdashin a fixed-effect regression model controlling for firm covariates plus year county and NACE 4-digit sector fixed effects as displayed in equation (11) All bars reflect statistically significant results See table A15 in annex 1 for the complete set of results
Source World Bank staff calculations based on SBS data set Note Numbers reflect estimated coefficients (multiplied by 100) for size dummy categoriesmdashrelative to small firms (1ndash50 employees) the omitted categorymdashin a fixed-effect regression model controlling for firm covariates plus year county and NACE 4-digit sector fixed effects as displayed in equation (11) All bars reflect statistically significant results See table A15 in annex 1 for the complete set of results
By the same token export intensity also influences markup performance with firms that export earning higher markups Being an exporter is a relevant firm feature to be analyzed when it comes to understanding markup performance Recent models of international trade predict that exporting firms earn higher markups than non-exporting firms either because they are relatively more productive and can thus undercut their rivals (see Melitz and Ottaviano 2008) or because they produce higher-quality goods and rely on higher-quality inputs which allow them to charge higher prices (see Hallak and Sivadasan 2009) In this regard the results summarized in figure 10 are consistent with the literature and suggest that exporting firmsmdashdefined as those whose direct exports represent more than 10 percent of total revenuemdashearn higher markups than non-exporting firms that operate in the same product market (NACE 4-digit sector) the difference ranges from 12 percent to 416 percent depending on how data are clustered across large sectors (manufacturing services and mining)
33 See footnote 32 on how to interpret results in table A16 in annex 1 (after including productivity as an additional control)
22
-160
158
7948
228
54
-505
101520253035
d
iffer
ence
Mature (between 6 and 15 years old)
Old (older than 15)
23
-830
090
327
169122
-15-55
152535
d
iffer
ence
Medium (between 51 and 250)
Large (more than 250 employees)
25
Figure 10 Average markup differences relative to non-exporters by export status
Figure 11 Average markup differences relative to non-RampD performers by RampD status
Source World Bank staff calculations based on SBS data set Note Numbers reflect estimated coefficients (multiplied by 100) for RampD dummy categorymdashrelative to non-RampD performer firms the omitted categorymdashin a fixed-effect regression model controlling for firm covariates plus year county and NACE 4-digit sector fixed effects as displayed in equation (11) All bars reflect statistically significant results See table A15 in annex 1 for the complete set of results
Source World Bank staff calculations based on SBS data set Note Numbers reflect estimated coefficients (multiplied by 100) for export dummy categorymdashrelative to non-exporters the omitted categorymdashin a fixed-effect regression model controlling for firm covariates plus year county and NACE 4-digit sector fixed effects as displayed in equation (11) All bars reflect statistically significant results See table A15 in annex 1 for the complete set of results
Performing RampD activities is positively correlated with markup differences while location proxied by county also matters to explain markup performance Results displayed in figure 11 show that RampD performersmdashidentified by those firms whose RampD expenses surpass more than 1 percent of their total revenuemdashtend to earn higher markups than non-RampD performers The markup premium for RampD performers is always positive suggesting that this group of firms is able to recoup fixed costs associated with RampD activities The magnitude of the premium varies from 16 percent to 46 percent depending how data are clustered across large sectors (manufacturing services and mining) In addition results displayed in figure 12 show that firms in the same product market (at NACE 4-digit level) and with similar characteristics (in terms of ownership age size and export and RampD profiles) charge different markups depending on the county in which they operate Except for Dolj firms in all other counties demonstrate lower average markups than Bucharest the negative markup premium in relation to Bucharest varies from minus154 percent (Vrancea) to minus36 percent (Satu-Mare)
12
258
416
119
05
101520253035404550
d
iffer
ence
160
340
460
273
05
101520253035404550
d
iffer
ence
26
Figure 12 Average markup differences by county relative to Bucharest
Source World Bank staff calculations based on SBS data set Note Numbers reflect estimated coefficients (multiplied by 100) for county fixed effectsmdashrelative to Bucharest the omitted categorymdashin a fixed-effect regression model controlling for firm covariates plus year and NACE 4-digit sector fixed effects as displayed in equation (11) All bars reflect statistically significant results See table A15 in annex 1 for the complete set of results
A variance decomposition analysis suggests that ownership is the most relevant characteristic to explain total variance of markup performance across firms in Romania followed by capital intensity and export status Drawing from estimations of equation (11) it is possible to evaluate the relative importance of each variable to explain the variance of the markup Letting dExp represent any of the explanatory variables of equation (11) the contribution to the variance of the markup of that variable can be defined as
119862119862119879119879119899119899119886119886119889119889119864119864119864119864119864119864 = 12057512057532119881119881119886119886119903119903119889119889119864119864119864119864119864119864+21205751205753119872119872119862119862119862119862(119889119889119864119864119864119864119864119864120583120583minus1205751205753119889119889119864119864119864119864119864119864)119881119881119886119886119903119903(120583120583)
(12)
or as the variance of the variable plus 2 times the covariance of the variable with the part of the markup not explained by that variable A similar expression can be derived for any of the remaining explanatory variables The relative contribution of each variable is computed after discounting the residuals sector and year contributions Results are displayed in figure 13 Ownership structure is shown to be the most relevant feature to explain the variance of markup performance across firms it accounts for 347 percent of the explained variance of markup performance (after removing NACE 4-digit sector and year contributions) The second most important characteristic is capital intensity corresponding to 214 percent of the variance of the markup performance Export status accounts for the third largest share in explained variance 113 percent
d
iffer
ence
27
Figure 13 Contribution by each firm characteristic to explain total variance of markup performance across firms
Source World Bank staff calculations based on SBS data set Note The pie chart reflects markup variance decomposition results It decomposes the variance of markup performance across firms after removing the proportion accounted for by omitted factors NACE 4-digit sector and year contributions
44 WHAT WOULD BE THE PRODUCTIVITY DIVIDENDS FROM MARKUP REDUCTION
While it became evident that aggregate market power in Romania has been rising it is important to analyze its consequences for economic growth An indirect way to measure this is to estimate the productivity dividends that would come from markup reduction The association between markup and productivity can be positive or negative depending on the nature of competition in the specific marketssectors As shown by Autor et al (2017) and Van Reenen (2018) there are marketsmdashsuch as high-tech sectors or knowledge-intensive onesmdashwhere the nature of competition tends to emphasize the importance of network effects economies of scale and scope and intangible assets so the most productive and dynamic firms exert higher markups and obtain larger market shares On the other hand in certain markets where recouping fixed costs (such as RampD) because of higher-risk investments is not that relevant high-markup firms are not necessarily more productive and efficient Another way to look at this contrast is through the inverted-U relationship of innovation and competition to an increase in productivity as explored by Aghion et al (2005) According to this view stronger competition (proxied here by smaller markups) encourages neck-and-neck firms to innovatemdashthe ldquoescape competitionrdquo effectmdashand therefore to increase productivity growth At the same time this view discourages laggard firms from innovating (the Schumpeterian effect) therefore reducing productivity growth The combination of the two effectsmdashescaping competition and discouraging innovationmdashexplains the inverted-U relationship of competition and innovation with productivity growth
To assess the correlation between productivity growth and markups in Romania the analysis uses firm-level estimations of TFPR and markups obtained so far Thus it estimates the specification presented in Aghion Braun and Fedderke (2008) as follows
Δ119889119889119899119899119879119879119897119897119897119897119877119877119888119888119895119895119894119894119895119895 = 1206011206010 + 1206011206011120583120583119888119888119895119895119894119894119895119895 + 120578120578119895119895 + 120588120588119895119895 + 120574120574119888119888 + 120592120592119888119888119895119895119894119894119895119895 (13)
where the left-hand-side variable represents TFPR growth of firm i in NACE 4-digit sector j in year t 120583120583119894119894119895119895119895119895minus1 is the lagged value of firm irsquos markup in sector j in year t ηt ρj and γc are
214
113
79
47
347
64
136
capital intensity Export status RampD status age ownership size region
28
respectively time NACE 4-digit sector and county fixed effects Equation (13) is estimated separately for each 1-digit sector (that is manufacturing services and mining) and for the whole economy while the equation parameters are estimated by OLS always using heteroscedasticity-robust standard errors
Figure 14 Productivity (TFPR) growth dividends from a 10 percent reduction of average markup by sector
Source World Bank staff calculations based on SBS data set Note Results from year county and 4-digit sector fixed effects Coefficient for mining was not statistically significant
Results shows that on average reducing markups would have a positive impact on aggregate productivity expansion Results displayed in table A18 in annex 1 suggest that lower (past) markups are associated with higher (current) productivity growth all coefficients for lagged markups are negative and statistically significant at conventional values for all sectors except mining Overall this negative correlation between past markup level and productivity growth is an indication of a positive association between competition and productivity growth which would be driven by the escape competition effect described by Aghion et al (2008)34
The magnitude of the economic effect of markup reduction on productivity growth is sizable Figure 14 shows that a 10 percent decrease in the average markup of 61 percent for the overall economy in the 2008ndash17 period would imply an increase in productivity (TFPR) growth of 082 percentage point per year The economic effect for the manufacturing sector would be substantially higher reducing the average markup of 403 percent for manufacturing in the same period would imply an increase in TFPR growth of 147 percentage points per year
Further productivity dividends stemming from markup reduction vary substantially across NACE 4-digit sectors The same specification expressed in equation (9) is estimated for each NACE 4-digit sector separately controlling for year and county fixed effects The TFPR growth dividends from markup reduction are computed for each NACE 4-digit sector drawing from the estimated coefficients (see table A18 in annex 1) Results vary substantially
34 An extended specificationmdashwhere the squared value of lagged markup is included as an additional dependent variablemdashwas also estimated The estimated coefficient of the squared term was not statistically significant (see results in table A17 in annex 1)
147
048
082
0
02
04
06
08
1
12
14
16
Manufacturing Services All
Perc
enta
ge p
oint
s per
yea
r
29
across sectors among those 4-digit sectors where the estimated coefficients are statistically significant the productivity growth dividends of a 10 percent decrease in markup vary from 701 percentage points to 016 percentage points respectively for NACE sector 1041ndashManufacture of oil and fats and sector 4649ndashWholesale of other household goods (figure 15)35 Productivity dividends from a potential markup reduction are also positive in sectors where the top decile firms in the markup distribution are overly represented for instance in sector 4711ndashRetail sale in non-specialized stores with food beverages or tobacco predominating a 10 percent decrease of average markup would be associated with an increase in TFPR growth of 022 percentage points per year For sector 4690ndashNon-specialized wholesale trade and sector 4673ndashWholesale of wood construction materials and sanitary equipment the productivity dividends would be 018 and 021 percentage points respectively
Figure 15 Productivity (TFPR) growth dividends from a 10 percent reduction of average markup Results by NACE 4-digit sector
Source World Bank staff calculations based on SBS data set
35 There are however some sectors where markup reduction brings detrimental impacts to productivity expansion See complete set of results in table A18in annex 1 for instance in NACE sector 8010ndashPrivate security activities and sector 2432ndashPrecious metals production where a reduction of average markup in the 2008ndash17 period would imply a decrease of TFPR growth of 030 percentage points and 663 percentage points respectively Following Aghion Braun and Fedderke (2008) the Schumpeterian effect of product market competition would be the underlying driver behind this result in these sectors competition reduces innovation incentives and therefore productivity growth by reducing the rents from innovations of firms below the technological frontier
00
10
20
30
40
50
60
70
80
Perc
enta
ge p
oint
s per
yea
r
30
5 CONCLUSIONS
A stylized fact emerging in the recent empirical literature is the increase in average levels of market power across countries in both developed and emerging economies This paper aims to bring new evidence about the evolution of corporate market power in Romania and the implications for competition dynamics It uses markups as a proxy for market power and explores firm-level heterogeneity to identify the underlying drivers of aggregate trends The paper applies the production approachmdashfollowing De Loecker and Warzynski (2012) De Loecker and Eeckhout (2018) and De Loecker Eeckhout and Unger (2020)mdashto estimate markup at the firm-year level for Romania The Romanian Structural Business Survey data set is used to apply this methodology
Results show that the aggregate markup in Romania increased by around 15 percent between 2008 and 2017 However this aggregate performance masks a lot of heterogeneity the first being heterogeneity of markups across the main sectors While in manufacturing (sales-weighted) average markups experienced a declining pattern of minus57 percent during 2008ndash17 there was an opposite and much more rapid trend in services with an aggregate change of 422 percent
Second at the firm level results suggest that a key driving force behind this aggregate trend was the ability of the top decile of firms in the markup distribution to increase their markups This increase has been faster than for the rest of the firms Firms in the 90th percentile of the markup distribution increased their (sales-weighted) average markup by 285 percent between 2008 and 2017 while the rest of firms (that is those below the top decile firms) experienced a completely opposite trend their weighted markup contracted by 83 percent over the same period
This sample of top decile firms does not seem to follow the typical superstar firmsrsquo profile which suggests that the increase in markups in Romania might be associated with an environment that is less conducive to competition The top decile firms in the markup distribution are 468 percent smaller 910 percent less productive and 33 percent less likely to invest in intangible assets than the rest of the firms in the markup distribution and they are overrepresented in less knowledge-intensive service sectors Therefore they do not seem to follow the typical superstar firmsrsquo profile (typically larger more productive and more likely to invest in intangible assets) This suggests that the increase in markups in Romania might be more due to relatively weak competition rather than to changes in the nature of competition where superstar firms (usually more efficient and innovative) are rewarded with greater market share In fact a decomposition exercise shows that the increase in aggregate markups has been driven mostly by incumbents rather than by new entrants and exiting firms These results could be interpreted as a sign of consolidation of market power among existing firms Several policy-related factors could explain this result among them government interventions and regulations that restrict competition by reinforcing dominance or limiting entry facilitating collusive outcomes or increasing the cost to compete in markets and by discriminating and protecting vested interests In this regard illustrative evidence provided by Pop and Ore Monago (2020) shows that despite reforms regulations that restrict entry and rivalry are still present in the retail trade sector which concentrates a substantial proportion of high-markup firms in the Romanian economy
31
Results also show that certain firm characteristics matter in explaining differences in markup performance size age RampD profile export propensity location and notably ownership State-controlled companies tend to demonstrate the highest markup premiums when compared with domestic privately owned companies 289 percent higher for minority state-owned companies and 20 percent higher for fully state-owned companies Old companies (older than 15 years) display 54 percent higher markups on average than young ones no matter the product market (at NACE 4-digit level) where they operate The markup premium for large companies (with more than 250 full-time employees) is 122 percent higher than that of small firms in the overall economy Exporting firmsmdashthose whose direct exports represent more than 10 percent of total revenuemdashearn 119 percent higher markups than non-exporting firms that operate in the same sector At the same time results show that the markup premium for RampD performers (compared with non-RampD performers) is 273 percent for the whole economy and that firms operating in the same product market charge different markups depending on the county where they operate Overall while all these features matter to explain markup performance a variance decomposition analysis suggests that ownership is the most relevant characteristic to explain total variance of markup performance across firms in Romania
In this context given that ownership assumes a prominent role to explain markup performance it is important to ensure competitively neutral policies across markets where private and public enterprises compete The prominent role of ownership in explaining total variance of markup performance across firms combined with the evidence that state-controlled companies tend to exert the highest markup premiums in the overall economy highlights the importance of ensuring competitive neutrality in Romania so that private and public enterprises compete on a fair basis Analysis presented in Pop and Ore Monago (2020) shows that state-owned enterprises (SOEs) in Romania compete on uneven terms with the private sector because of gaps in terms of both the current regulatory framework as well as its implementation As for the regulatory framework itself lack of competitive neutrality emerges from restrictive SOE governance rules and the exemption of newly setup SOEs from the corporate governance law lack of rules mandating the separation of commercial and noncommercial functions despite legal separation (for example in the railway and energy sectors) and the lack of specific provisions that require SOE investments to show positive rates of returns With regard to implementation of the regulatory framework competitive neutrality gaps stem from (a) the protracted application of corporate governance rules (b) fragmentation of SOE oversight across institutions with frequent overlaps (c) inconsistent reporting of SOE performance that prevents full monitoring and comparability with the private sector performance in comparable situations (d) little clarity in terms of compensation for public service obligations and (e) lack of transparency in state aid allocation
Finally the analysis shows that productivity dividends arise from increased competition in Romania As such lowering markups can boost productivity growth A 10 percent decrease in the average markup for the overall economy during 2008ndash17 would imply an increase in productivity (TFPR) growth of 082 percentage point per year The effect for the manufacturing sector is higher (147 percentage points per year) but lower for services (048 percentage point per year) The ldquoescape competitionrdquo effect described by Aghion Braun and Fedderke (2008)mdashthrough which fiercer competition induces firms to innovate to escape competition with the fringe therefore increasing productivity growthmdashwould be the underlying driver behind these average results for the manufacturing industry Results vary substantially across sectors among
32
those 4-digit sectors where the estimated coefficients are statistically significant the productivity growth dividend of a 10 percent decrease in markup varies from 701 percentage points (sector 1041ndashManufacture of oil and fats) to 016 percentage point (sector 4649ndashWholesale of other household goods)
In this context boosting competition becomes a key part of the engine to drive productivity growth and help consolidate Romaniarsquos convergence to a high-income level Implementing pro-competition policies is instrumental Besides removing anticompetitive regulations and promoting competitive neutrality policy makers should ensure that state aid is allocated in a non-distortive way and enable more effective competition law and antitrust enforcement
33
REFERENCES
Ackerberg D K Caves and G Frazer 2015 ldquoIdentification Properties of Recent Production Function Estimatorsrdquo Econometrica 83 (6) 2411ndash51
Aghion P N Bloom R Blundell R Griffith and P Howitt 2005 ldquoCompetition and Innovation An Inverted-U Relationshiprdquo Quarterly Journal of Economics 120 (2) 701minus28
Aghion P M Braun and J Fedderke 2008 ldquoCompetition and Productivity Growth in South Africardquo Economics of Transition 16 (4) 741ndash68
Autor D D Dorn F Lawrence C Patterson and J Van Reenen 2017 ldquoThe Fall of the Labor Share and the Rise of Superstar Firmsrdquo NBER Working Paper 23396 National Bureau of Economic Research Cambridge MA
Barkai S 2020 ldquoDeclining Labor and Capital Sharesrdquo Journal of Finance 75 (5) 2421ndash63
Bartelsman E J and M Doms 2000 ldquoUnderstanding Productivity Lessons from Longitudinal Microdatardquo Journal of Economic Literature 38 (3) 569ndash94
Berry S J Levinsohn and A Pakes 1995 ldquoAutomobile Prices in Market Equilibriumrdquo Econometrica Journal of the Econometric Society 63 (4) 841ndash90
Berry S J Levinsohn and A Pakes 2004 ldquoDifferentiated Products Demand Systems from a Combination of Micro and Macro Data The New Car Marketrdquo Journal of Political Economy 112 (1) 68ndash105
Bessen J 2017 ldquoInformation Technology and Industry Concentrationrdquo Law and Economics Paper No 17-41 Boston University School of Law Boston
Bond S A Hashemi G Kaplan and P Zoch 2020 ldquoSome Unpleasant Markup Arithmetic Production Function Elasticities and their Estimation from Production Datardquo NBER Working Paper No 27002 National Bureau of Economic Research Cambridge MA
Bresnahan T F 1989 ldquoEmpirical Studies of Industries with Market Powerrdquo In Handbook of Industrial Organization Vol 2 edited by R Schmalensee and R Willig 1011ndash57 Amsterdam Elsevier
Cameron A C and P K Trivedi 2010 Microeconometrics Using Stata (Rev ed) College Station TX Stata Press
Crouzet N and J Eberly 2018 ldquoUnderstanding Weak Capital Investment The Role of Market Concentration and Intangiblesrdquo NBER Working Paper 25869 National Bureau of Economic Research Cambridge MA De Loecker J 2011 ldquoRecovering Markups from Production Datardquo International Journal of Industrial Organization 29 (3) 350ndash55
De Loecker J 2013 ldquoDetecting Learning by Exportingrdquo American Economic Journal Microeconomics 5 (3) 1ndash21
De Loecker J and J Eeckhout 2018 ldquoGlobal Market Powerrdquo NBER Working Paper 24768 National Bureau of Economic Research Cambridge MA
De Loecker J J Eeckhout and G Unger 2020 ldquoThe Rise of Market Power and the Macroeconomic Implicationsrdquo Quarterly Journal of Economics 135 (2) 561ndash644 httpsdoiorg101093qjeqjz041
34
De Loecker J and F Warzynski 2012 ldquoMark-ups and Firm-Level Export Statusrdquo American Economic Review 102 (6) 2437ndash71
Diacuteez F D Leigh and S Tambunlertchai 2018 ldquoGlobal Market Power and Its Macroeconomic Implicationsrdquo IMF Working Paper 18137 International Monetary Fund Washington DC
Grullon G Y Larkin and R Michaely 2018 ldquoAre US Industries Becoming More Concentratedrdquo Swiss Finance Institute Research Paper No 19-41 httpdxdoiorg102139ssrn2612047
Gutieacuterrez G and T Philippon 2017a ldquoDeclining Competition and Investment in the USrdquo NBER Working Paper 23583 National Bureau of Economic Research Cambridge MA Gutieacuterrez G and T Philippon 2017b ldquoInvestment-less Growth An Empirical Investigationrdquo Brookings Papers on Economic Activity (Fall) 89ndash182 Gutieacuterrez G and T Philippon 2018 ldquoHow EU Markets Became More Competitive than US Markets A Study of Institutional Driftrdquo NBER Working Paper 24700 National Bureau of Economic Research Cambridge MA
Hall R 1988 ldquoThe Relation between Price and Marginal Cost in US Industryrdquo Journal of Political Economy 96 (5) 921ndash47
Hallak J and J Sivadasan 2009 ldquoExporting Behavior under Quality Constraintsrdquo NBER Working Paper 14928 National Bureau of Economic Research Cambridge MA
IMF (International Monetary Fund) 2019 World Economic Outlook April 2019 Growth Slowdown Precarious Recovery Washington DC International Monetary Fund
Koujianou Goldberg P and R Hellerstein 2012 A Structural Approach to Identifying the Sources of Local Currency Price Stability Review of Economic Studies 80 (1) 175ndash210
Melitz M J and G Ottaviano 2008 ldquoMarket Size Trade and Productivityrdquo Review of Economic Studies 75 (1) 295ndash316
Melitz M J and S Polanec 2015 ldquoDynamic Olley-Pakes Productivity Decomposition with Entry and Exitrdquo RAND Journal of Economics 46 (2) 362ndash75
Motta M 2004 Competition Policy Theory and Practice Cambridge MA Cambridge University Press
Pop G and T Ore Monago 2020 ldquoCompetition and Government Interventions in Romania An Assessment with Focus on Product Market Regulations and Competitive Neutralityrdquo Background paper for Markets and People Romania Country Economic Memorandum International Development in Focus World Bank Washington DC
Shapiro C 2018 ldquoAntitrust in a Time of Populismrdquo International Journal of Industrial Organization 61 714ndash48
Syverson C 2004 ldquoProduct Substitutability and Productivity Dispersionrdquo Review of Economics and Statistics 86 (2) 534ndash50
Van Reenen J 2018 ldquoIncreasing Differences between Firms Market Power and the Macroeconomyrdquo CEPR Discussion Paper 1576 Center for Economic and Policy Research Washington DC
35
World Bank 2020a ldquoMarkets and People Romania Country Economic Memorandumrdquo International Development in Focus World Bank Washington DC
World Bank 2020b ldquoAssessing the Direct and Indirect Impact of State Aid in Romania An Ex-post Evaluationrdquo World Bank Washington DC
36
ANNEX 1 ADDITIONAL FIGURES AND TABLES
Figure A11 Evolution of (sales-weighted) average markup in manufacturing sector by technology intensity 2008ndash17
Source World Bank staff calculations based on SBS data set
Table A11 Manufacturing industry groups by technology intensity Eurostat classification
85
99
51
Mar
k-up i
ndex
(200
8 = 1
)
2008 2009 2010 2011 2012 2013 2014 2015 2016 2017Year
Manuf High-tech
37
Source Eurostat Indicators on High-Tech Industry and KnowledgendashIntensive Services annex 3 httpseceuropaeueurostatcachemetadataAnnexeshtec_esms_an3pdf
38
Figure A12 Evolution of (sales-weighted) average markup in services sector by knowledge intensity
39
Table A12 Services groups by knowledge intensity Eurostat classification
40
Source Eurostat Indicators on High-Tech Industry and KnowledgendashIntensive Services annex 3 httpseceuropaeueurostatcachemetadataAnnexeshtec_esms_an3pdf
41
Table A13 Original ownership classification from SBS SBS Code Description
10 Fully state-owned Majority state-owned (statepublic capital gt 50 of equity)
21 State + Romanian private 22 State + foreign 23 State + Romanian private + foreign
Majority privately owned (private capital ge 50 of equity) 26 State + Romanian private 27 State + foreign 28 State + Romanian private + foreign
Fully privately owned 31 Romanian private 32 Romanian private + foreign 40 Cooperative 50 Craft organizations 60 Fully foreign-owned 70 Public of national and local interest
Source World Bank staff calculations based on SBS data set
Table A14 Ownership classification adopted in the analysis SBS codes (combined) Description
10 21 22 23 State owned (fully + majority state-owned) 26 27 28 Private-public (majority private)
31 Fully private (domestic) 32 Fully private (domestic + foreign) 60 Fully private (fully foreign) 70 Public of national and local interest
40 50 Other Source World Bank staff calculations based on SBS data set
Table A15 Conditional correlations between firm characteristics and markup performance regression results
Variable Manufacturing Services Mining All Capital stock (ln) minus0150 minus0039 minus0067 minus0066 Export dummy 0120 0258 0416 0119 RampD dummy 0160 0340 0460 0273 Mature 0022 minus0016 0158 minus0005 Old 0079 0048 0228 0054 Majority state-owned 0527 0139 0772 0200 State-private ownership 0352 0275 0111 0289 Romanian private + foreign 0161 0279 0096 0229 Fully foreign-owned 0105 0263 0 0201 Public of national and local interest 0209 0149 (omitted) 0214 Other 0884 0555 (omitted) 0758 Medium 0230 minus0083 0011 0009 Large 0327 0169 minus0015 0122 1 Alba 0106 minus0087 minus0151 minus0042 2 Arad 0038 minus0090 minus0148 minus0077 3 Arges minus0005 minus0053 minus0195 minus0060
42
Variable Manufacturing Services Mining All 4 Bacau 0092 minus0090 minus0194 minus0055 5 Bihor 0036 minus0115 minus0256 minus0088 6 Bistrita-Nasaud minus0064 minus0156 minus0069 minus0144 7 Botosani 0046 minus0089 minus0438 minus0076 8 Brasov 0041 minus0047 0049 minus0040 9 Braila 0133 minus0055 minus0265 minus0025 10 Buzau 0017 minus0123 minus0025 minus0100 11 Caras-Severin 0035 minus0187 minus0005 minus0139 12 Cluj minus0004 minus0094 minus0119 minus0088 13 Constanta 0057 minus0105 0062 minus0088 14 Covasna 0038 minus0056 minus0151 minus0052 15 Dambovita 0005 minus0183 minus0154 minus0144 16 Dolj 0195 0060 minus0042 0079 17 Galati 0106 minus0007 minus0276 0004 18 Gorj 0084 0028 minus0116 0026 19 Harghita 0101 minus0102 minus0007 minus0045 20 Hunedoara 0167 minus0031 minus0057 0011 21 Ialomita 0138 minus0049 minus0265 minus0027 22 Iasi minus0014 minus0038 minus0384 minus0058 23 Ilfov 0011 0009 0314 0010 24 Maramures 0094 minus0020 minus0042 0 25 Mehedinti 0113 minus0136 minus0720 minus0096 26 Mures 0048 minus0063 minus0093 minus0048 27 Neamt 0001 minus0108 minus0428 minus0102 28 Olt 0073 minus0005 minus0397 minus0011 29 Prahova 0018 minus0034 minus0028 minus0043 30 Satu-Mare 0033 minus0024 minus0056 minus0036 31 Salaj 0075 minus0045 minus0448 minus0031 32 Sibiu 0044 minus0038 minus0154 minus0041 33 Suceava 0044 minus0087 minus0111 minus0074 34 Teleorman 0103 minus0099 minus0299 minus0062 35 Timis 0030 minus0020 minus0341 minus0037 36 Tulcea 0142 minus0149 0096 minus0078 37 Vaslui 0091 minus0017 minus0105 minus0007 38 Valcea 0078 minus0008 minus0122 minus0002 39 Vrancea minus0061 minus0163 minus0608 minus0154 51 Calarasi 0080 minus0122 0672 minus0075 52 Giurgiu 0052 minus0064 minus0334 minus0066
_cons 2147 1150 2291 2246 NACE 4-digit fixed effects Yes Yes Yes Yes
Year fixed effects Yes Yes Yes Yes
R2 0345 0235 0254 0279 Source World Bank staff calculations based on SBS data set Note Dependent variable = ln(markup) denotes significance level at 1 percent at 5 percent and at 10 percent
43
44
Table A16 Conditional correlations between firm characteristics (including productivity) and markup performance regression results
Variable Manufacturing Services Mining All Capital stock (ln) minus0149 minus0038 minus0065 minus0066 Export dummy 0116 0257 0400 0118 RampD dummy 0182 0366 0449 0295 Mature 0021 minus0014 0164 minus0003 Old 0079 0052 0228 0057 Majority state-owned 0529 0147 0758 0209 State-private ownership 0351 0274 0118 0288 Romanian private + foreign 0156 0275 0090 0225 Fully foreign-owned 0096 0254 minus0011 0192 Public of national and local interest 0179 0165 (omitted) 0233 Other 0879 0561 (omitted) 0759 Medium 0232 minus0083 0002 0010 Large 0327 0170 minus0016 0122
Productivity (TFPR) 0051 0020 0041 0024 1 Alba 0114 minus0081 minus0156 minus0035 2 Arad 0045 minus0085 minus0135 minus0071 3 Arges 0001 minus0049 minus0196 minus0056 4 Bacau 0098 minus0084 minus0188 minus0049 5 Bihor 0042 minus0111 minus0268 minus0083 6 Bistrita-Nasaud minus0057 minus0150 minus0055 minus0137 7 Botosani 0053 minus0082 minus0443 minus0069 8 Brasov 0045 minus0042 0033 minus0035 9 Braila 0139 minus0048 minus0243 minus0018 10 Buzau 0022 minus0118 minus0002 minus0094 11 Caras-Severin 0042 minus0178 minus0001 minus0131 12 Cluj minus0001 minus0089 minus0120 minus0083 13 Constanta 0067 minus0101 0056 minus0084 14 Covasna 0045 minus0050 minus0166 minus0046 15 Dambovita 0010 minus0180 minus0162 minus0140 16 Dolj 0202 0068 minus0054 0087 17 Galati 0114 minus0001 minus0289 0010 18 Gorj 0091 0037 minus0118 0035 19 Harghita 0108 minus0096 minus0005 minus0039 20 Hunedoara 0173 minus0025 minus0055 0018 21 Ialomita 0144 minus0045 minus0256 minus0023 22 Iasi minus0005 minus0034 minus0394 minus0053 23 Ilfov 0013 0012 0296 0013 24 Maramures 0101 minus0013 minus0038 0007 25 Mehedinti 0128 minus0132 minus0729 minus0090 26 Mures 0053 minus0057 minus0105 minus0042 27 Neamt 0010 minus0101 minus0434 minus0094
45
Variable Manufacturing Services Mining All 28 Olt 0082 0002 minus0402 minus0004 29 Prahova 0023 minus0029 minus0032 minus0039 30 Satu-Mare 0038 minus0018 minus0047 minus0030 31 Salaj 0081 minus0039 minus0433 minus0025 32 Sibiu 0044 minus0034 minus0147 minus0038 33 Suceava 0051 minus0081 minus0105 minus0068 34 Teleorman 0117 minus0092 minus0296 minus0053 35 Timis 0033 minus0014 minus0340 minus0032 36 Tulcea 0147 minus0142 0078 minus0072 37 Vaslui 0101 minus0011 minus0104 0 38 Valcea 0087 minus0002 minus0120 0004 39 Vrancea minus0053 minus0158 minus0602 minus0148 51 Calarasi 0086 minus0118 0673 minus0071 52 Giurgiu 0059 minus0060 minus0334 minus0061
_cons 1632 0993 1934 2036 NACE 4-digit fixed effects Yes Yes Yes Yes
Year fixed effects Yes Yes Yes Yes
R2 0347 0235 0255 0280 Source World Bank staff calculations based on SBS data set Note Dependent variable = ln(markup) denotes significance level at 1 percent at 5 percent and at 10 percent
Table A17 Productivity growth and markup performance regression results
All Manufacturing Services Mining
Lag markup minus0025 minus0028 minus0026 minus0027 minus0025 minus0027 minus0012 minus0024
Lag markup squared 0001 0000 0001 0003 NACE 4-digit sector fixed effects Yes Yes Yes Yes Yes Yes Yes Yes County fixed effects Yes Yes Yes Yes Yes Yes Yes Yes Year fixed effects Yes Yes Yes Yes Yes Yes Yes Yes
Observations 245525 245525 76694 76694 167120 167120 1711 1711 Source World Bank staff calculations based on SBS data set Note Dependent variable = TFPR growth denotes significance level at 1 percent at 5 percent and at 10 percent
46
Table A18 Productivity (TFPR) growth dividends from a 10 reduction of average markup results by NACE 4-digit sector
NACE 4-digit sector Gain in TFPR growth per
year (percentage points)
1041ndashManufacture of oils and fats 7015 4331ndashPlastering 5547 2060ndashManufacture of man-made fibers 5286 2824ndashManufacture of power-driven hand tools 4869 1072ndashManufacture of rusks and biscuits manufacture of preserved pastry goods and cakes
4145
1104ndashManufacture of other non-distilled fermented beverages 3984 1723ndashManufacture of paper stationery 3716 2812ndashManufacture of fluid power equipment 3566 2452ndashCasting of steel 3278 1101ndashDistilling rectifying and blending of spirits 3134 1420ndashRaising of other cattle and buffaloes 3072 2011ndashManufacture of industrial gases 3033 2593ndashManufacture of wire products chain and springs 2689 2829ndashManufacture of other general-purpose machinery nec 2641 4910ndashPassenger rail transport interurban 2629 2451ndashCasting of iron 2615 3821ndashTreatment and disposal of non-hazardous waste 2375 2059ndashManufacture of other chemical products nec 2336 2920ndashManufacture of bodies (coachwork) for motor vehicles manufacture of trailers and semi-trailers
2270
1051ndashOperation of dairies and cheese making 2224 3313ndashRepair of electronic and optical equipment 2160 1081ndashManufacture of sugar 2158 1073ndashManufacture of macaroni noodles couscous and similar farinaceous products 2081 4213ndashConstruction of bridges and tunnels 2077 2223ndashManufacture of buildersrsquo ware of plastic 2011 2550ndashForging pressing stamping and roll-forming of metal powder metallurgy 1949 2313ndashManufacture of hollow glass 1926 2825ndashManufacture of non-domestic cooling and ventilation equipment 1889 2020ndashManufacture of pesticides and other agrochemical products 1818 2571ndashManufacture of cutlery 1758 5914ndashMotion picture projection activities 1691 5920ndashSound recording and music publishing activities 1665 3514ndashTrade of electricity 1653 1310ndashPreparation and spinning of textile fibers 1616 4920ndashFreight rail transport 1613 4339ndashOther building completion and finishing 1586 2620ndashManufacture of computers and peripheral equipment 1543 4311ndashDemolition 1515 3832ndashRecovery of sorted materials 1404 3523ndashTrade of gas through mains 1382 2410ndashManufacture of basic iron and steel and of ferro-alloys 1353 2399ndashManufacture of other non-metallic mineral products nec 1272 2017ndashManufacture of synthetic rubber in primary forms 1258 7711ndashRental and leasing of cars and light motor vehicles 1256 4212ndashConstruction of railways and underground railways 1128 2453ndashCasting of light metals 1080 7410ndashSpecialized design activities 1068 5630ndashBeverage serving activities 1065 4211ndashConstruction of roads and motorways 0989 4677ndashWholesale of waste and scrap 0926 4676ndashWholesale of other intermediate products 0917 4120ndashConstruction of residential and non-residential buildings 0912 4623ndashWholesale of live animals 0890 6820ndashRental and operating of own or leased real estate 0826 4110ndashDevelopment of building projects 0824
47
NACE 4-digit sector Gain in TFPR growth per year
(percentage points) 4613ndashAgents involved in the sale of timber and building materials 0823 4322ndashPlumbing heat and air-conditioning installation 0731 5629ndashOther food service activities 0699 4791ndashRetail sale via mail order houses or via internet 0659 4941ndashFreight transport by road 0659 4618ndashAgents specialized in the sale of other particular products 0646 7219ndashOther research and experimental development on natural sciences and engineering 0623 4617ndashAgents involved in the sale of food beverages and tobacco 0609 5510ndashHotels and similar accommodation 0560 4615ndashAgents involved in the sale of furniture household goods hardware and ironmongery
0541
4633ndashWholesale of dairy products eggs and edible oils and fats 0540 4778ndashOther retail sale of new goods in specialized stores 0527 4621ndashWholesale of grain unmanufactured tobacco seeds and animal feeds 0517 4662ndashWholesale of machine tools 0501 6110ndashWired telecommunications activities 0491 4634ndashWholesale of beverages 0468 5610ndashRestaurants and mobile food service activities 0463 4631ndashWholesale of fruit and vegetables 0426 4532ndashRetail trade of motor vehicle parts and accessories 0394 1411ndashManufacture of leather clothes 0390 4511ndashSale of cars and light motor vehicles 0382 4637ndashWholesale of coffee tea cocoa and spices 0361 4645ndashWholesale of perfume and cosmetics 0354 1419ndashManufacture of other wearing apparel and accessories 0344 4643ndashWholesale of electrical household appliances 0335 4639ndashNon-specialized wholesale of food beverages and tobacco 0285 4619ndashAgents involved in the sale of a variety of goods 0281 4675ndashWholesale of chemical products 0249 4711ndashRetail sale in non-specialized stores with food beverages or tobacco predominating 0223 4673ndashWholesale of wood construction materials and sanitary equipment 0214 4690ndashNon-specialized wholesale trade 0188 4649ndashWholesale of other household goods 0158 8010ndashPrivate security activities minus0300 8220ndashActivities of call centres minus0323 2572ndashManufacture of locks and hinges minus0503 7120ndashTechnical testing and analysis minus0511 3315ndashRepair and maintenance of ships and boats minus0512 3600ndashWater collection treatment and supply minus0547 4754ndashRetail sale of electrical household appliances in specialized stores minus0627 2341ndashManufacture of ceramic household and ornamental articles minus0646 7111ndashArchitectural activities minus0649 6120ndashWireless telecommunications activities minus0746 7312ndashMedia representation minus1023 4334ndashPainting and glazing minus1200 5020ndashSea and coastal freight water transport minus1276 1052ndashManufacture of ice cream minus1367 5911ndashMotion picture video and television programme production activities minus1439 2592ndashManufacture of light metal packaging minus1619 2752ndashManufacture of non-electric domestic appliances minus1729 2521ndashManufacture of central heating radiators and boilers minus1843 4932ndashTaxi operation minus2568 2013ndashManufacture of other inorganic basic chemicals minus3524 1711ndashManufacture of pulp minus3631 4942ndashRemoval services minus4214 1092ndashManufacture of prepared pet foods minus4262 3040ndashManufacture of military fighting vehicles minus5508 2432ndashCold rolling of narrow strip minus6629
Source World Bank staff calculations based on SBS data set Note The table displays only sectors for which estimated coefficients are statistically significant
48
- 1 Introduction and motivation
- 2 Methodology
- 3 Data set
- 4 Results
-
- 41 Has corporate market power increased at the aggregate level How do aggregate trends differ across sectors Is there a group of firms driving the overall trend
- 42 How have firm dynamics influenced aggregate markup performance Are there signs of market power consolidation among incumbent firms
- 43 Do firm markups differ across firms with different attributes
- 44 What would be the productivity dividends from markup reduction
-
- 5 Conclusions
- References
- Annex 1 Additional figures and tables
-

2
1 INTRODUCTION AND MOTIVATION
A key stylized fact that has emerged in recent years is that corporate market power has increased at the global level Drawing upon different methodologies empirical literature produced in the past 10 years indicates that average levels of market power have been increasing across countries in both developed and emerging economies This trend has been measured through different metrics of market power such as industry sales concentration ratios firm-level profit rates or firm-level price-cost margins For instance Grullon Larkin and Michaely (2018) show that concentration and profit rates have increased across most US industries De Loecker Eeckhout and Unger (2020) estimate firm-level pricendashmarginal cost markups in the United States and find evidence that the revenue-weighted average markup climbed from about 12 in 1980 to 16 in 2014 De Loecker and Eeckhout (2018) apply the same methodology for a sample of 134 countries and find that revenue-weighted markup has been on the rise for decades not only in the United States but also in Europe and (to a lesser extent) in emerging economies in Latin America and Asia Diacuteez Leigh and Tambunlertchai (2018) estimate firm-level markups for publicly traded firms in 74 countries between 1980 and 2016 including both advanced and emerging market economies They find evidence that increased markups are widespread but are more prominent among advanced economies that experienced a 39 percent increase in GDP-weighted average since 1980 More recently IMF (2019) used firm-level data (including both publicly listed and privately held companies) across 27 countriesmdash16 advanced and 11 emerging marketsmdashto estimate firm-level markups between 2000 and 2015 Results indicate that the average markup for the entire sample of countries moderately increased by around 6 percent across the period studied The rise was strongly concentrated among advanced economies but less so among emerging economies (77 percent versus 18 percent respectively)
This trend has triggered an intense public debate about market power and its macroeconomic implications Several authors have tried to link the evidence of rising market power with recent macroeconomic trends such as the declining share of income and sluggish investment rates1 For instance Barkai (2020) documented a negative industry-level relationship between changes in labor share of income and changes in concentration for the US nonfinancial corporate sector during the period 1984ndash2014 Autor et al (2017) find consistent evidence using firm-level data from the US Economic Census between 1982 and 2012 and show that the increase in the concentration of sales experienced in six large sectors of the economy is associated with a decrease in the labor share of value added Still looking at US sectors but using data from publicly traded firms (through Compustat) De Loecker Eeckhout and Unger (2020) find evidence that an increase in markups (aggregated for the whole economy or at the firm level) is negatively correlated with labor share Other authors focused their analyses on corporate investment rate performance and how it is related to increases in corporate market power In this regard Gutieacuterrez and Philippon (2017a 2017b) present evidence that increasing market powermdashcaptured by rising concentration of industry salesmdashpartly explains the low investment rates experienced by the US economy since the 2000s IMF (2019) expands the analysis beyond the United States and runs a cross-country firm-level
1 In principle several factorsmdashbesides rising market powermdashcan contribute to these trends Potential explanatory factors behind declining investment rates include credit constraints weakening demand and a shift in the composition of investment toward intangibles See Gutieacuterrez and Philippon (2017a) and Crouzet and Eberly (2018) for a discussion on this matter
3
analysis covering both advanced and emerging economies to explore the link between markups and physical capital investment and to estimate the extent to which the worldwide average increase in firmsrsquo markups experienced since 2000 is associated with a 04 percentage point decrease in the investment rate
Different strands of empirical literature emphasize distinctmdashbut not necessarily exclusivemdashunderlying mechanisms to explain the overall rise in market power On the one hand authors such as Autor et al (2017) Van Reenen (2018) and Bessen (2017) present results that support the hypothesis that increases in market power have been accompanied by efficiency gains As such changes in the economic environmentmdashcaused by high-tech digital markets engaging in platform competition increases in investment in intangible capital by leading companies and scale-biased technical change provoked by advances in information and communication technology (ICT)mdashhave led to the emergence of large efficient firms Such so-called superstar firms per Autor et al (2017) are able to secure larger market shares in ldquowinner takes mostrdquo markets2 In other words tougher competition (and not less) in these types of markets would reallocate more output toward the high-markup larger and more productive firms In this context superstar firms extract a larger market share which would then explain increases in aggregate (weighted average) market power On the other hand some authors argue that the increase in market power reflects declining competition caused by weakened antitrust enforcement or more stringent regulations that lead to worse allocative efficiency For instance Gutieacuterrez and Philippon (2018) argue that weaker antitrust enforcement in the United States relative to the European Union (EU) explains why market power has risen more in the United States than in EU countries
Against this backdrop this paper presents new evidence regarding the evolution of corporate market power in Romania It goes beyond the average performance of firms and explores firm-level heterogeneity to identify the underlying drivers of aggregate market power trends and the implications for economic growth This paper will explore several questions At the aggregate level the following queries will be assessed Has corporate market power increased How do aggregate trends differ across sectors and across technology intensity and knowledge intensity of sectors Next the analysis will focus on firm-level drivers of aggregate market power trends Regarding the latter the following questions will be assessed Is variation of market power uneven across firms To what extent has firm dynamismmdashthrough incumbents and new entrants or exiting firmsmdashbeen driving markup Does markup performance differ across firms with different attributes Finally to account for economic growth implications the paper will shed light on the potential productivity dividends stemming from fiercer competition across the economy proxied by a reduction in market power
2 METHODOLOGY
The definition of market power is well established Taking output markets as the reference point the standard (theoretical) definition of market power is the ability of a firm to maintain prices above marginal cost which is the level that would prevail under perfect competition The exact magnitude of a firmrsquos market powermdashwhich is tied to the gap between its price and
2 According to this view the dominance of ldquosuperstar firmsrdquomdashsuch as Amazon Apple Facebook Google and Microsoftmdashwould be due to intensified competition ldquofor the marketrdquo rather than anticompetitive mergers or collusion ldquoin the marketrdquo (Van Reenen 2018)
4
marginal costmdashwould depend on the format of the residual demand curve faced by the firm the steeper the inverse demand the larger the price-cost margin difference the higher the market power retained by the firm3
However the actual measurement of market power is not straightforward A commonly used approach is to approximate market power indirectly through market concentration indicators These indicators can assume various formats for instance concentration ratios and the Herfindahl-Hirschman index (HHI) Although these indicators are often relatively easy to computemdashespecially because they require only data on firm revenuesmdashthey have more drawbacks than benefits First and as highlighted in the seminal article of Bresnahan (1989) these indicators do not provide an adequate measure of market power in the presence of product differentiation Second the computation of these indicators requires the definition of a relevant market which usually considers the degree of product substitution geographic location of both producers and consumers transportation costs and so on In this regard it is often harder to define markets in periods of technological change Third the interpretation of results using these indicators can be ambiguous As highlighted by Shapiro (2018) an increase in market concentration could indicate a decline in competition reflecting the existence of less numerous and weaker rivals to dominant incumbent firms on the other hand an increase could equally reflect market competition forces in action making more efficient firms gain larger market shares
Another way to measure market power is to estimate markups Markups capture the ability of firms to charge prices above marginal cost Data availability is the key challenge associated with this methodological alternative as price data at the firm level rarely are accessible let alone data on marginal costs
A common method to estimate markups is the demand approach which involves estimating a demand system and then adding some assumptions on how firms set prices The data requirements associated with this approach are significant The demand method relies on the estimation of a demand system and assumes a fully specified model of consumer choice (see for instance Bresnahan 1989) The estimation itself requires detailed data on prices quantities sold and product characteristics all drawing from retail downstream purchases or consumer-level data Once the own-price and cross-price elasticities across the goods considered are estimated markups can be recovered from first order conditions after specifying a model of competition Overall the main shortcoming of this method is the need to use extremely detailed market-level data As a result the approach has been used only to assess market power in specific sectors for instance see Berry Levinsohn and Pakes (1995)
3 Following this standard approach the gap between price and marginal cost could be approximated by a Lerner index which is calculated as 119871119871119894119894 = 119875119875119894119894minus119872119872119872119872119894119894
119875119875119894119894 reflecting how far a firmrsquos price is from its marginal cost When
specifying a demand function and assuming that firms follow a profit-maximizing behavior it can be shown that for a given firmmdashin a Cournot quantity set case for instancemdashthe first-order condition equals 119871119871119894119894 = 120572120572119894119894
120576120576 where 120572120572119894119894
is the firmrsquos market share and 120598120598 is the demand elasticity of the firm Alternatively in the case of a dominant firm with a competitive fringe that together cover the entire market for a homogeneous good the Lerner index would be approximated as 119871119871119894119894 = 119878119878119894119894
120576120576119889119889+(1minus119878119878119894119894)120576120576119903119903 where 120576120576119889119889 is the marketrsquos elasticity of demand 120576120576119903119903 is the rivalrsquos collective
elasticity of supply and 119878119878119894119894 denotes the dominant firmrsquos market share
5
as well as Berry Levinsohn and Pakes (2004) for cars and more recently Koujianou Goldberg and Hellerstein (2012) for beer
The production approach on the other hand offers more flexibility It relies on simpler assumptions and the data requirements are less rigorous only firmsrsquo financial statements are needed Specifically there is no need to make assumptions on how firms compete in the market there are no restrictions on underlying consumer demand and only firm production data (on inputs and outputs) are needed which can be easily extracted from firmsrsquo financial statements This methodologymdashformally presented in De Loecker and Warzynski (2012)mdashbuilds on the work of Hall (1988) who shows that under cost minimization a firmrsquos markup (price over cost) equals the ratio of two values the output elasticity of a variable input (free of adjustment costs as opposed to quasi-fixed inputs) and the share of expenditures with that input in total revenue that is
120583120583 = 120573120573119881119881119904119904ℎ119886119886119903119903119886119886119881119881
Where 120583120583 is the markup 120573120573119881119881 is the elasticity of output with respect to the variable input and 119904119904ℎ119886119886119886119886119886119886119881119881 is the share of revenue spent on the variable input That said only two pieces of information are needed to estimate the firmrsquos markup the output elasticity which is obtained by estimating a production function of the sector where the firm operates and the revenue share which is directly observed in the data4
Given its flexibility the production approach will be applied to estimate firm-level markups as a proxy for market power in Romania The implementation of this method follows two steps The first is to define and estimate a production function to reflect the technology firms have access to For estimation purposes a firmrsquos i that belongs to sector j (defined at the NACE 2-digit level) production function at year t is represented by a flexible translog technology as follows
(1)
where all the variables are in natural logarithms and yjit is the firmrsquos annual total revenue from operations mjit is the total expenditure in intermediate materials kjit is the capital stock (sum of tangible and intangible assets) and ljit is the total number of hours worked per year (the natural logarithm of the product of the number of employees times the number of months worked times the number of hours worked per month)
TFPR is identified as any change in firmsrsquo revenue not caused by variations in the inputs of production More specifically in equation (1) TFPR (in natural logarithm) is identified by
4 The intuition behind this markup measure is discussed in De Loecker (2011) For a cost-minimizing producer the output elasticity of a variable input equals its expenditure share in total revenue only when price equals marginal cost Any departure from the perfect competitive model will be captured by the difference between the output elasticity and the revenue share as measured by the markup (price over cost)
6
(2)
The term ωjit is known by the firm but not by the econometrician which generates a problem of simultaneity between the inputs and productivity The last term (εjit) is assumed to be a completely random productivity shock not anticipated by the firms when making their input choices The Ackerberg Caves and Frazer (2015) approach is followed to solve the endogeneity problem and the anticipated productivity shock is divided into two terms
(3)
where the first term g(ωjitminus1) is the inertia of the productivity process that is highly productive firms at tminus1 will also have a high productivity level at t (present)5 This is the term that firms know when making their input choices The second term ξjit is the innovation of the productivity process and it is the key of the estimation process It can be interpreted as any change in the level of productivity that is completely new at time t and uncorrelated with past productivity
Since the innovation is uncorrelated with past productivity it is also uncorrelated with the optimal choices of the variable inputs that is materials and labor made at moment tminus1 Moreover since capital is a fixed input and it takes time to change its level one can also assume that the innovation of productivity is uncorrelated with the capital input choices made at moment t This set of assumptions allows one to form a set of moment conditions as follows6
(4)
which states that we can use the lack of correlation between lagged flexible inputs and contemporaneous capital on the one hand and productivity innovation on the other to identify (estimate) the parameters of the production function in equation (1) To account for differences in production technologies across sectors the TFPR estimation as discussed above allows for heterogeneous sector-specific (NACE 2-digit) production functions
Using the estimations of the production function it is possible to compute the output elasticity of the variable input (here assumed as materials) in sector j where firm i operates as follows
(5)
In this regard it should be noted that all firms in the same sector j are assigned a common elasticity The interpretation is that firms in the same sector have access to the same technology but they differ both in terms of TFPRjit and the optimally chosen level of variable input (material)
5 Following the terminology used in the literature the current analysis assumes that productivity follows a first-order Markov process in the sense that it depends only on its own past values The functional form is approximated by a polynomial of degree 3 on the first lag of TFPR This is a quite general procedure see for instance De Loecker (2013) 6 A moment condition is a statistical equality that holds in the population under study
7
Once the output elasticity of the variable input is estimated the second operational step is to use information on expenditures on variable inputs to compute a firmrsquos markup Specifically firmrsquos markup can be directly computed as follows
micro119895119895119894119894119895119895 = 120573120573119872119872119895119895
119872119872119904119904ℎ119886119886119903119903119886119886119895119895119894119894119895119895 (6)
where 120573119872119872119895119895 was estimated in the previous step and 119872119872119904119904ℎ119886119886119886119886119886119886119895119895119894119894119895119895 is the ratio of cost of variable input (materials) to corrected revenue defined as
(7)
where PMMjit is total cost of raw materials Yjit is total revenue and εjit is the unanticipated productivity shock obtained as a residual in the estimation of the production function (see equation 2)
The interpretation of firm-level markups estimated through this production approach must be made with some caution First because markup is recovered through TFPR (and not TFPQ) the estimated result conflates market power itself with differences in product quality and other factors affecting the demand for the product78 Secondmdashand this applies to any methodological procedure not only the production approachmdashmarkup cannot be taken as an absolute value and should not be used to compare different markets since markups will be naturally higher in markets where a large proportion of costs are fixed In this regard it is safer to use markup estimates to illustrate comparisons across firms within markets for instance to shed light on the correlation with other firm characteristics (such as productivity ownership size and location)9 Last but not least it is important to stress that rising markups do not necessarily imply a decline in competition It can reflect vertical differentiation strategies (such as quality upgrading or advertising) or even the implementation of more efficient production processes (or the introduction of innovative products) for which rising markups enable firms to recoup growing fixed costs or to reward high-risk activities such as investment in RampD In this context an in-depth competition assessment would be needed not only to better understand the intrinsic market features (including supply-side and buyer characteristics) but also to identify and assess the potential anticompetitive effects of government intervention in markets
7 To mitigate this conflation risk the analysis tries to some extent to disentangle the sources of markup differences within a sectormdashthat is whether they are derived from higher prices or lower marginal costs (reflected by higher productivity) This is possible because the procedure adopted generates estimates of both TFPR and markup See the results in table A16 in annex 1 8 In a recent article Bond et al (2020) argue that in the absence of information on output quantities to estimate TFPQ as is typically the case (including in the current analysis) it is not possible to obtain consistent estimates of output elasticities when firms have market power and markups are heterogeneous This issue casts doubt over interpretation of markup values especially trends However the production approach for estimating markups is still valid if results are used to assess differences in average markups across different groups of firms (different characteristics) provided one is willing to assume that these groups of firms share the same production function parameters 9 See footnote 8
8
3 DATA SET
The assessment of corporate market power in Romania draws on firm-level data from the Structural Business Survey (SBS) for the period 2008ndash17 The SBS data setmdashprovided by the National Institute of Statistics of Romaniamdashencompasses complete financial information at the headquarters level for the 2008ndash17 period for the surveyed firms This survey is exhaustive for firms with at least 20 employees and provides a representative sample for firms with fewer than 20 employees As such the data set has two strata one completely enumerated covering a census of all enterprises with at least 20 employees and the second a random stratum covering some smaller firms On the basis of this sample design an unbalanced panel is constructed by considering all listed firms (of both strata) for all years In this way the panel allows entry and exit and does not impose any firm size threshold
Firm-level information from SBS is classified at NACE 4-digit level which is considered a proxy for the product market where a firm operates SBS-sampled activities include all sectors except agriculture and banking Therefore the analysis focuses on mining services and manufacturing activities In addition the SBS data assign one NACE 4-digit sector classification for each firm where the firmrsquos main product is classified As such all firms within a NACE 4-digit sector classification are considered to be in one product market In the current analysis the product market definition deliberately does not coincide with the classical definition of ldquorelevant marketrdquo10 which normally considers the degree of product substitution geographic location of both producers and consumers transportation costs and so on11
The SBS data contain all the variables needed to estimate the production function that underlies markup computation The variables needed to estimate TFPR and markups following the production approachmdashas described in the previous section and expressed in equation (1)mdashare firmsrsquo annual total revenue from operations12 total expenditure in intermediate materials capital stock (sum of tangible and intangible assets) and total number of hours worked per year
After deflating nominal accounting data and controlling for outliers the final data set contains 405641 firm-year markup observations for 167756 firms over the 2008ndash17 period All accounting information from the SBS was deflated using the country-level GDP deflator (from World Development Indicators and Eurostat) to express values in Romanian lei for 2000 Once nominal values were deflated additional steps were taken to control for outlier observations in particular observations on revenue employment capital (tangible assets) and costs of raw materials with a value of zero or lower than zero were excluded from the estimation This procedure generated a final (unbalanced panel) data set with 405641 firm-
10 For market power assessment purposes a relevant market is defined by the set of products and geographical areas that exercise competitive constraints on each other (see Motta 2004 for further discussion) 11 In principle this assumptionmdashthat firms under one 4-digit sector classification belong to the same marketmdashcould imply some bias in the case of multiproduct firms that sell goods that are not close substitutes However this bias can be mitigated by using NACE 4-digit sectoral disaggregation In addition in the absence of firm-level information for multiple products it is assumed that the firm-level markup is a weighted average markup across different products within the firm 12 The data set does not contain information on physical quantity produced by each firm Deflated sales are used as a measure of physical quantity to estimate output elasticities and then to recover markups De Loecker and Warzynski (2012) show that using this approach to recover markups potentially affects the level of estimated markup but not the temporal changes in the markup
9
year observations (see table 1) which was then used to estimate markup The final data set contains firm-year markup observations for 167756 firms over 2008ndash17 Table 2 displays the summary statistics for all variables used to compute TFPR and markup for these firms13
13 The original number of firms in the SBS is 484604 405641 firms were considered after removing outliers in markup and TFPR This note defines outliers as those observations with a value greater than Q3+3IQR or lower than Q1minus3IQR where Q1 and Q3 are the first and third quartiles and IQR is the interquartile range
10
Table 1 Final sample of firm-year observations Year Manufacturing Services Mining Total 2008 15056 31346 320 46722 2009 14038 31598 318 45954 2010 12997 29759 317 43073 2011 9492 25942 239 35673 2012 10151 26983 245 37379 2013 9806 29460 229 39495 2014 10381 29872 253 40506 2015 10286 28844 260 39390 2016 10199 28449 249 38897 2017 10018 28280 254 38552 Total 112424 290533 2684 405641
Source World Bank staff calculations based on SBS data set Note Total number of observations by year and sector with production function variables
Table 2 Summary statistics Year Revenue (ln) Employment (ln) Intermediate materials (ln) Capital stock (ln)
Mean SD Mean SD Mean SD Mean SD 2008 1473 229 289 136 1207 267 1168 271 2009 1470 220 282 132 1187 262 1182 269 2010 1470 228 276 135 1202 268 1184 268 2011 1533 200 306 133 1252 260 1228 258 2012 1523 208 304 132 1253 261 1222 259 2013 1503 212 292 133 1232 264 1209 263 2014 1507 213 294 132 1237 262 1204 264 2015 1532 198 307 128 1255 255 1211 264 2016 1540 191 311 126 1244 263 1214 263 2017 1546 189 313 125 1241 270 1220 262 Total 1508 212 297 132 1229 264 1203 265
Source World Bank staff calculations based on SBS data set Note SD = standard deviation
11
4 RESULTS
41 HAS CORPORATE MARKET POWER INCREASED AT THE AGGREGATE LEVEL HOW DO AGGREGATE TRENDS DIFFER ACROSS SECTORS IS THERE A GROUP OF FIRMS DRIVING THE OVERALL TREND
Results show that the average markup in Romania increased by around 15 percent during 2008ndash17 However this expansion was marked by an uneven trend Figure 1 panel a displays the evolution of the (sales-weighted) aggregate markup for the 2008ndash17 period for the whole economy (aggregating manufacturing services and mining) At aggregate level average markups experienced a 15 percent aggregate increase from 2008 to 2017 However three alternating trends are detected in this whole period a sharp increase of more than 15 percent during 2008ndash09 a strong decline after 2009 when markups fell by 23 percent from 2009 to 2012 and a consistent increase of 215 percent from 2012 to 2017
Figure 1 Evolution of (sales‐weighted) average markup by sector 2008ndash17 a All sectors b Manufacturing
c Services d Mining
Source World Bank staff calculations based on SBS data set
Because aggregate numbers mask a lot of heterogeneity it is not surprising to see
92
94
96
98
11
02M
ark-
up in
dex
(200
8 =
1)
2008 2009 2010 2011 2012 2013 2014 2015 2016 2017Year
Manufacturing
11
11
21
31
4M
ark-
up in
dex
(200
8 =
1)
2008 2009 2010 2011 2012 2013 2014 2015 2016 2017Year
Services
51
15
22
5M
ark-
up in
dex
(200
8 =
1)
2008 2009 2010 2011 2012 2013 2014 2015 2016 2017Year
Mining
12
different trends when unraveling markups across sectors Because of their intrinsic characteristics firms are different from each other and contrast in terms of performance even within very narrowly defined sectors (Syverson 2004) These differences could persist either because of supply-side factors such as management skills RampD or investment patterns (Bartelsman and Doms 2000) or because of demand-side factors related to product differentiation customer-producer relationships geographical segmentation among others That said firms across high-level sectorsmdashmanufacturing services and miningmdashhave shown varied performance While the manufacturing (sales-weighted) average markup experienced a decline of minus57 percent over the 2008ndash17 period (figure 1 panel b) there was an opposite and much more rapid trend in services with an aggregate change of 422 percent (see figure 1 panel c) Weighted average markup in mining experienced an uneven trend throughout the same period Nuances are unveiled even within sectors as aggregate markup performance shows different patterns when breaking manufacturing down into groups of sectors according to their technology intensity14 This is also observed when services are broken down into groups of sectors according to their knowledge intensity15 (see figure A11 and figure A12 in annex 1)
Further there is also evidence of changes in the markup firm distribution from 2008 to 2017 revealing an increasing proportion of firms with relatively high markups Figure 2 displays the firm-level distribution of markups in 2008 and 2017 Some changes are noteworthy First both the mean and variance increased over that period But more importantly the upper tail of the distribution became fatter over time suggesting that in 2017 more firms have higher markups than in 2008 This suggests that the rise in average markups is associated with large increases among the firms with the highest markups
14 As per Eurostat classification manufacturing sectors are classified as high-technology medium-high-technology medium-low-technology and low-technology according to technological intensity (RampD expenditure or value added) and based on the statistical classification of economic activities in the European Community (NACE) at the 2-digit level See table A11 in annex 1 with sector aggregation 15 As per Eurostat classification service sectors are classified as knowledge-intensive services (KIS) and less-knowledge-intensive services (LKIS) KISs comprise knowledge-intensive market services high-tech knowledge-intensive services knowledge-intensive financial services and other knowledge-intensive services LKIS comprise less-knowledge-intensive market services and other less-knowledge-intensive services Both KIS and LKIS are based on the share of tertiary educated persons at the NACE 2-digit level See table A12 in annex 1 with sector aggregation
13
Figure 2 Distribution of firm-level markups all sectors 2008 and 2017
Source World Bank staff calculations based on SBS data set
In fact data show that the rise in average markup has been driven by the ability of a small group of firmsmdashthe top decile firmsmdashto increase their markups over time especially after 2014 Figure 3 panel a shows that markup growth has been progressively uneven across firms with firms in the top decile of the markup distribution increasing their average markup faster than the rest of firms Firms in the 90th percentile increased their (sales-weighted) average markup by 285 percent from 2008 to 2017 while the rest of firmsmdashthose below the top decilemdashexperienced a completely opposite trend their weighted markup contracted by 83 percent over the same period This shows that the increase in the weighted average markupmdashof around 15 percent as shown in figure 3 panel amdashcomes mainly from the group of firms in the top decile of the markup distribution The divergence between the top decile and the rest of firms remains even when results are broken down by sectors it is more pronounced in manufacturing despite some volatility (figure 3 panel b) while in services this happens only after 2014 (panel c) The mining sector experienced the opposite trend (panel d) as most of the time (until 2016) the top decile group of the markup distribution reported lower markup growth than the rest of the firms in the data set
02
46
kden
sity
lnmu
-2 0 2 4 6 8Mark-up (ln)
2008 2017
14
Figure 3 Evolution of (sales-weighted) average markup by sector and by top decile and firm groups (top decile firms versus the rest) 2008ndash17
a All sectors b Manufacturing
c Services d Mining
Source World Bank staff calculations based on SBS data set
Overall these results suggest that any analysis about markup performance in Romania should pay attention to a small group of firms the top decile of firms based on markup distribution These firms have been accounting for increasing shares of value added and employment in the economy Figure 4 shows that the share of value added in the whole economy (including manufacturing services and mining sectors) as accounted for by the firms in the top decile of the markup distribution has been increasing jumping from less than 13 percent in 2008 to 231 percent in 2017 The same applies to employment the sample of the top decile of firms accounts for an increasing share of employment generated in the economy across the 2008ndash17 period (figure 5)
91
11
12
13
Mar
k-up
inde
x (2
008=
1)
2008 2009 2010 2011 2012 2013 2014 2015 2016 2017Year
Average (wgtd)perc 90 (wgtd)Rest of firms (below perc 90) (wgtd)
All firms
15
Figure 4 Share of total value added accounted for by the top decile firms 2008ndash17
Figure 5 Share of employment accounted for by the top decile firms 2008ndash17
Source World Bank staff calculations based on SBS data set
Source World Bank staff calculations based on SBS data set
These top decile firms are also typically smaller less productive and less likely to invest in intangible assets than the rest of the firms As highlighted in the methodological section of this paper the increase of markups cannot be unequivocally interpreted as a decline in competition in a given market it can reflect firmsrsquo efficiency gains or adoption of quality-upgrading strategies To explore this aspect a simple econometric analysis was applied to capture performance differences between the group of firms that is leading the markup increase (the top decile firms) and the rest of the firms based on the markup distribution The following specification was adopted
119862119862ℎ119886119886119886119886119886119886119886119886119886119886119886119886119886119886119886119886119904119904119886119886119886119886119886119886119888119888119895119895119894119894119895119895 = 1205751205750 + 1205751205751119879119879119879119879119879119879_119889119889119886119886119886119886119886119886119889119889119886119886119894119894119895119895 + η119895119895 + ρ119895119895 + γ119888119888 + 120583120583119888119888119895119895119894119894119895119895 (8)
where the dependent variable reflects different firm characteristics (of firm i that operates in sector j county c at year t) to be compared Three dependent variables are tested size (measured in terms of the number of full-time employees) productivity (measured as TFPR discounted for markup16) and intangible assets (measured as a dummy that takes the value of 1 for firms having a positive value of intangible fixed assets17) The key explanatory variable is 119879119879119879119879119879119879_119889119889119886119886119886119886119886119886119889119889119886119886119894119894119895119895 a dummy that takes the value of one firm if i is among the top decile of the markup distribution in year tmdashwhile ηt ρj and γc are respectively time NACE 4-digit sector and county fixed effects The parameters of equation (8) are estimated by OLS (or Probit regression maximum likelihood when the dependent variable is the intangible assets dummy) always using heteroscedasticity-robust standard errors Results displayed in table 3 columns 1 and 2 suggest that firms in the 90th percentile of the markup distribution are on average 468
16 TFPR discounted for markup is computed as TFPR-markup In this regard it is not a perfect measure of the true technical efficiency but just a proxy of productivity that accounts for market share and the effect of materials elasticity while other factors such as the effect of product quality or innovation are not considered 17 Value of intangible assets in the SBS data set is defined as value built on (a) RampD expenditure and (b) franchise patents and other similar rights and values
1015
2025
Perc
enta
ge
2008 2009 2010 2011 2012 2013 2014 2015 2016 2017Year
1012
1416
18Pe
rcen
tage
2008 2009 2010 2011 2012 2013 2014 2015 2016 2017Year
16
percent18 smaller and 91 percent 19 less productive than the rest of the firms even within narrowly defined sectors (at NACE 4-digit level) Results in column 3 captures the differences between these two groups of firms in terms of their willingness to invest in intangible assetsmdashtheir ldquoknowledge capacityrdquomdasha key determinant of firmsrsquo expansion in the long term Results suggest that the sample of top decile firms are almost 33 percent less likely to invest in intangible fixed assets than the remaining firms even within NACE 4-digit sectors20 All these correlations are statistically significant at the 1 percent confidence level
Table 3 Characteristics of top decile firms Conditional correlations between markups and firm characteristics (OLS and Probit results)
(Estimation method) Dependent variable (1)
(OLS) Employment
(ln)
(2) (OLS)
TFPR discounted for markup (ln)
(3) (Probit)
Investment in intangibles
(yesno) Top _decile minus0632 minus2422 minus0386 NACE 4-digit sector fixed effects
Yes Yes Yes
County fixed effects Yes Yes Yes Year fixed effects Yes Yes Yes R2 (pseudo R2)a 0238 0728 0078 Observations 484604 403561 484594
Source World Bank staff calculations based on SBS data set Note All firm-year observations (for the 2008ndash17 period) are pooled together and NACE 4-digit sector and year fixed effects are included OLS = ordinary least squares TFPR = revenue-based total factor productivity a It is worth highlighting that R2 value does not influence the consistency of the estimators of each population parameter which is the objective of the current analysis See for instance Cameron and Trivedi (2010) for a theoretical discussion on this matter Moreover since the analysis draws on a large sample the standard errors of the coefficient estimators are not affected because of the law of large numbers The key issue would be the lack of correlation of omitted variables and the explanatory variables However given that the main (theoretical) determinants of the markup performance are included the omitted variables can be understood to be random Statistically significant at 1 percent
In addition the group of 10 top decile firms in the markup distribution operate mainly in the services sector and are overrepresented in less-knowledge-intensive services sectors with some exceptions Table 4 displays the distribution of top decile firms across NACE 2-digit sectors in 2017 To control for the fact that some sectors might be overrepresented (given the SBS survey sampling) the table shows only those sectors for which the probability of a firm being in the top decile is larger than the sectorrsquos frequency ratio Results show that firms in the 90th percentile of markup distribution are overrepresented in wholesale trade and retail trade sectors the probability of a top decile firm being in these two sectorsmdashclassified as less-knowledge-intensive services according to the Eurostat definition
18 This value results from the following expression 100[exp(beta)minus1] where beta equals estimated top 90 percent dummy coefficients in an OLS regression where size is the dependent variable controlling for 4-digit and county fixed effects (table 3 column 1) 19 This value results from the following expression 100[exp(beta)minus1] where beta equals estimated top 90 percent dummy coefficients in an OLS regression where TFPR is the dependent variable controlling for 4-digit and county fixed effects (table 3 column 2) 20 The odds-ratio is computed as the relative difference between the marginal effects for each category (that is 42 percent for the top decile firms and 56 percent for firms below the 90th percentile) Specifically it is computed as follows (56 percent minus 42 percent)(42 percent)
17
(see table A12 in annex 1)mdashis almost 40 percent21 It is worth highlighting however that these top decile firms also operate in some knowledge-intensive services sectors though the probability is much smaller 387 percent for computer programming and 268 percent for security and investigating activities22
When taken together these results suggest that the small group of firms leading the overall increase in markups in Romania does not seem to follow the typical superstar firmsrsquo profile As discussed by Van Reenen (2018) and Autor et al (2017) superstar firmsmdashtypically with higher markups larger and more productive ndash would be rewarded with larger market shares due to their innovative nature This hypothesis does not seem to be supported by data in Romania As results showed the group of firms who are driving the aggregate rise in markupsmdashthe top decile firms of the markup distributionmdashare typically smaller less productive less likely to invest in intangible assets and are mostly active in services sectors where use and diffusion of knowledge is less important This may suggest that the increase in markups in Romania might reflect a less competition-intensive environment rather than changes in the nature of competition where superstar firms would be rewarded with greater market share because they are more efficient and innovative
Table 4 Probability of a top decile firm (in the markup distribution) being in the following sectors
2-digit sector Probability Wholesale trade 2436 Retail trade 1477 Computer programming 387 Manufacturing of wearing apparel 321 Real estate activities 314 Security and investigation activities 268
Source World Bank staff calculations based on SBS data set Note The table shows only sectors for which the probability of a firm being in the top decile of markup distribution is higher than the sectorrsquos overall frequency ratio
42 HOW HAVE FIRM DYNAMICS INFLUENCED AGGREGATE MARKUP PERFORMANCE ARE THERE SIGNS OF MARKET POWER CONSOLIDATION AMONG INCUMBENT FIRMS
To indirectly assess whether the rise in markups is associated with weakening competition the analysis decomposes the evolution of aggregate markups into that of incumbents and of net entry of firms To do so the Melitz and Polanec (2015) decomposition technique is applied to the aggregate markup changes between 2008 and 2017 This approach follows two steps First the aggregate (ln) markup (μ) at year t is defined as
21 Under the NACE 2-digit wholesale trade sector the group of top decile firms are overrepresented in the following NACE 4-digit sectors sector 4690ndashNon-specialized wholesale trade sector 4673ndashWholesale of wood construction materials and sanitary equipment sector 4621ndashWholesale of grain unmanufactured tobacco seeds and animal feeds sector 4646ndashWholesale of pharmaceutical goods sector 4675ndashWholesale of chemical products and sector 4631ndashWholesale of fruit and vegetables Under the NACE 2-digit retail services sector the sample of top decile firms are overrepresented in the following NACE 4-digit sectors sector 4711ndashRetail sale in non-specialized stores with food beverages or tobacco predominating and sector 4730mdashRetail sale of automotive fuel in specialized stores 22 The same analysis is applied for ownership structure again controlling for overrepresentation Results show that the sample of top decile firms are overrepresented in the fully foreign-owned ownership category
18
120583120583119895119895119895119895 = sum sum 119904119904119895119895119894119894119895119895119894119894isinΩ119895119895 120583120583119895119895119894119894119895119895119894119894isin119896119896119895119895 (9)
where sjit is firm irsquos market share at moment t where the market share is defined in terms of firm irsquos revenue weight over the total revenue of sector j (kj) where sector j is the sector to which firm i belongs Then the change of (ln) markup between moments t and tminus1 is decomposed as
Δ120583120583119895119895119895119895 = Δ120583119878119878119895119895119895119895 + Δ119862119862119879119879119907119907119878119878120583120583119878119878119895119895119894119894119895119895 119904119904119878119878119895119895119894119894119895119895 + 119904119904119864119864119895119895119895119895120583120583119864119864119895119895119895119895 minus 120583120583119878119878119895119895119895119895 + 119904119904119883119883119895119895119895119895120583120583119878119878119895119895119895119895 minus 120583120583119883119883119895119895119895119895 (10)
where the subindex S refers to survivor firms (that is those operating in both years t and tminus1 the subindex X denotes firms exiting the market or those firms present in moment tminus1 but not in moment t and E denotes entrants or those firms operating in moment t but not in moment tminus1 Each component expressed in equation (10) represents different drivers to explain aggregate change in markup over the period The first term is the change of the
unweighted average ln markup of survivors or the ldquowithinrdquo component Likewise is the change in the covariance between ln markup and market share for
survivors only This is the ldquobetweenrdquo component and it measures the reallocation of resources among surviving firms The term is the ldquoentryrdquo component and it measures
the difference of the aggregate ln markup of entrants and that of survivors at moment t weighted by the share of entrants over the total population of firms ( ) The entry component will be
positive if the aggregate markup of those firms entering the market is larger than the aggregate markup of the survivors Finally is the exit component which measures the
difference between the aggregate ln markup of survivors and exiting firms at moment tminus1 likewise weighted by the proportion of firms exiting the market that is This term is
positive if the aggregate ln markup of the exiting firms is lower than the aggregate ln markup of survivors In other words and as displayed in equation (10) aggregate markup can growshrink because (a) incumbent firms have increaseddecreased their markups (the ldquowithinrdquo component) (b) incumbent firms with high markups have gainedlost market share (the ldquobetweenrdquo component) and (c) entrant firms have higherlower markups than exiting firms (the ldquoentryrdquo or ldquoexitrdquo component)23
Results show that the increase in aggregate markups has been driven mostly by incumbents rather than entrants and exiting firms Decomposition results for the full sample of firms are displayed in figure 6 Estimations suggest that a large proportion of the aggregate increase in markup in Romania was driven by increases within incumbent firms (the ldquowithinrdquo bar) And among incumbents results show that the rise in markups reflects mostly a markup increase within firms rather than a reallocation of market share away from low-markup to high-markup companies (the ldquobetweenrdquo bar) Meanwhile the entry of new firms with lower markups pulled the change in aggregate markups down (the ldquoentryrdquo bar) and contribution from
23 SBS tends to underestimate entry and exit (populational) figures as a result of its sampling design In this regard the proposed analysis captures entry and exit in the enumerated stratum (above 20 employees) so results will be representative at least for the population of firms in the enumerated stratum
19
exiting firms was negligible
20
Figure 6 Decomposition of percentage change of (sales-weighted) average markup 2008ndash17
Source World Bank staff calculations based on SBS data set
This result could be interpreted as a sign of consolidation of market power among existing firms enabled by remaining product market regulations that restrict competition despite previous reforms Several policy-related factors can explain this result among them government interventions and regulations that restrict competition by reinforcing dominance or limiting entry facilitating collusive outcomes or increasing the cost to compete in markets and discriminating and protecting vested interests24 In this regard Pop and Ore Monago (2020) provide illustrative examples about the presence of regulations that still restrict competition in Romania drawing from the OECDndashWorld Bank Group (WBG) product market regulation (PMR) indicators data set which provides information across 70 countries25 The assessment uses the latest PMR round for Romania from 2013 and includes Romaniarsquos performance projected on the basis of information updated in 2017 Results suggest that the regulatory framework as it is in the books in Romania is less restrictive than that of countries such as Poland and the total sample average but it is more restrictive than that of the OECD and EU-15 countries However from an economywide perspective the overall restrictiveness of regulations in Romania is mainly associated with the state control of the economy and several remaining barriers to entry and rivalry (see figure 7)
24 In principle greater competition outcomes are enabled through an effective competition policy framework which involves three key pillars (a) fostering pro-competition regulations and government interventions (b) promoting competitive neutrality and non-distortive public aid and (c) enabling effective competition law and antitrust enforcement 25 The current PMR database used for this study includes Argentina Australia Austria Belgium Bolivia Brazil Bulgaria Canada Chile China Colombia Costa Rica Croatia Cyprus the Czech Republic Denmark the Dominican Republic Ecuador Arab Republic of Egypt El Salvador Estonia Finland France Germany Greece Guatemala Honduras Hungary Iceland India Indonesia Ireland Israel Italy Jamaica Japan Kenya the Republic of Korea Kuwait Latvia Lithuania Luxembourg Malta Mexico the Netherlands New Zealand Nicaragua Norway Panama Paraguay Peru the Philippines Poland Portugal Romania the Russian Federation Rwanda Senegal the Slovak Republic Slovenia South Africa Spain Sweden Switzerland Turkey Tunisia Ukraine Uruguay the United Kingdom and the United States
21
Figure 7 Product market regulation in Romania and comparator countries
Source Pop and Ore Monago 2020 Note The top five performers in the overall PMR indicator are the Netherlands United Kingdom Austria Denmark and New Zealand Figure shows 2013 information unless otherwise indicated PMR = product market regulation
Barriers to entry and rivalry still affect some service sectors In fact there are examples of regulations that hamper competition in retail trade which concentrates a substantial proportion of high-markup firms in the Romanian economy as seen previously Drawing from the OECD-WBG PMR data set Pop and Ore Monago (2020) show that although regulations in the retail trade sector are less restrictive than in the EU-15 and OECD there is still room for improvement to make the retail trade market more efficient The authors show that licenses and permit requirements may still be imposing an unnecessary burden on entry and increasing the costs to compete in the sector Companies operating in retail sectors in Romania are subject to requirements that go beyond the general conditions formalities and procedures applicable to any company For instance in Romaniarsquos clothing industry licenses and permits are always required compared with 57 percent of OECD countries and 60 percent of EU-15 countries which do not have such a requirement26 In addition Romania has regulations that impose restrictions on entry or expansion of business activities and constrain strategic options to compete in retail markets For instance most of the PMR countries and all top five performers do not restrict firms from selling below cost (beyond a prohibition of predatory pricing) and restrictions on sales promotions are not a common practice either27 In Romania sales below cost are prohibited or restricted beyond a prohibition of predatory pricing Likewise sales promotions are restricted to a particular time of the year28
43 DO FIRM MARKUPS DIFFER ACROSS FIRMS WITH DIFFERENT ATTRIBUTES
To answer this question the analysis explores how markup performance differs across different types of firms To assess the heterogeneity in markups the analysis relates markups to firm-level characteristics such as size age ownership status RampD status and location
26 In this case the least restrictive countries such as Bulgaria Latvia and Sweden do not have such requirements 27 Among the Central and Eastern Europe comparator countries only the Czech Republic and the Slovak Republic apply restrictions on discounted sales pricing while only Poland applies constraints to sales promotions 28 Government Ordinance no 992000 prohibits sales below costs and provides for the conditions and periods when certain types of promotions can take occur
5156 51 52 47 49 53
62 55
3830 42 40 43 39
4333 41
1114
6 9 10 125 5 4
113129 133 134 141 148 156
165 169
0
05
1
15
2
25
3
0
05
1
15
2
25
3
Top 5 -PMR SlovakRepublic
Hungary EU-15average
CzechRepublic
OECDaverage
2013
Romaniasim 2017
Poland Romania
State control (SC) Barriers to entry and rivalry (BER) Barriers to trade and investment (BTI)
Avg of all countries = 190
22
within narrowly defined product markets proxied by NACE 4-digit sectors The following regression is estimated
120583120583119888119888119895119895119894119894119895119895 = 1205751205750 + sum 12057512057511198961198961198791198791199001199001198991198991198961198961198881198881198951198951198941198941198951198957119896119896=2 + sum 1205751205752119903119903119904119904119886119886119904119904119886119886119903119903119888119888119895119895119894119894119895119895
3119903119903=2 + sum 1205751205752119902119902119886119886119886119886119886119886119902119902119888119888119895119895119894119894119895119895
3119902119902=2 + 1205751205753119889119889119888119888119895119895119894119894119895119895
119864119864119864119864119864119864 +1205751205754119889119889119888119888119895119895119894119894119895119895119877119877119877119877119889119889 + 1205751205755119896119896119888119888119895119895119894119894119895119895 + 120578120578119895119895 + 120588120588119895119895 + 120574120574119888119888 + 119906119906119888119888119895119895119894119894119895119895 (11)
where ownkcjit with k = 23hellip7 comprises a set of dummies defining the type of ownership of the firm Romanian private (omitted category) majority state-owned state-private ownership Romanian private and foreign fully foreign-owned public of national and local interest and other (cooperatives and craft organizations)29 The term sizercjit is a set of three dummies controlling for firmsrsquo sizemdashsmall or fewer than 50 employees (omitted category) medium or 51ndash250 employees and large more than 250 employees The term agercjit is a set of three age dummiesmdashyoung or less than 5 years old mature or 6ndash15 years old and older than 15 years Two dichotomous variables are also defined to capture export and RampD profiles dExp and dRnd which take a value of 1 if a firmrsquos direct exports represent more than 10 percent of a firmrsquos total revenue and if a firmrsquos RampD represents more than 1 percent of a firmrsquos total revenue respectively In addition kcjit is firmsrsquo total capital stock value (sum of tangible and intangible assets)30 Finally ηt ρj and γc are respectively time NACE 4-digit sector and county fixed effects Equation (11) is estimated separately for each 1-digit sector (that is manufacturing services and mining) and for the whole economy while the equation parameters are estimated by OLS always using heteroscedasticity-robust standard errors The complete set of results is displayed in table A15 in annex 1
Results show that ownership structure matters to explain markup differences across firms State-controlled companies tend to exert the highest markup premiums in the overall economy and especially in the manufacturing sector Table 5 displays the estimated coefficients of ownership categories multiplied by 100 Except for the mining sector most of estimated coefficients are statistically significant which suggests that ownership structure makes a difference to explain markup performance even for firms operating in the same product market (here proxied by NACE 4-digit sector) county location and year and with similar characteristics in terms of size age and export and RampD profile
In particular firms in which the state has majority or minority ownership demonstrate higher markups when compared with domestic privately owned companies (see table 5 column 4) The average difference in markup is higher for companies with minority state ownership (289 percent) than for fully state-owned companies (200 percent) In manufacturing markups of fully state-owned firms are the highest on average at 527 percent when compared with the reference category (domestic privately owned firms) Results in services are mixed with both private and state ownership extracting high premiums private firms with mixed domestic-foreign ownership show the highest average difference (279 percent) closely followed by minority state-owned companies for which the markup premium
29 More details about the original ownership classification in SBS and the aggregation used for the analysis can be found in table A13 and table A14 in annex 1 30 The variable lnTFPRkit is included as an additional control to test the robustness of the analysis See results in table A16 in annex 1
23
is 275 percent compared with the reference category 31 All results are robust to the inclusion of productivity as an additional control variable (see results in table A16 in annex 1)32
Table 5 Average markup differences by ownership structure relative to domestic privately owned firms
(1) Manufacturing
()
(2) Services
()
(3) Mining
()
(4) All sectors
() Majority state-owned 527 139 772 200 State-private ownership 352 275 ns 289 Domestic private + foreign 161 279 ns 229 Fully foreign-owned 105 263 ns 201 Public of national and local interest
209 149 ns 214
Source World Bank staff calculations based on SBS data set Note Numbers reflect estimated coefficients (multiplied by 100) for ownership dummy categoriesmdashrelative to Romanian private firms the omitted categorymdashin a fixed-effect regression model controlling for firm covariates plus year and NACE 4-digit sector fixed effects as displayed in equation (11) More details about the original ownership classification in SBS and aggregation used for the analysis can be found in table A13 and table A14 in annex 1 See table A15 in annex 1 for the complete set of results ns = not statistically significant
Larger firms and older companies wield higher markups when compared with their counterparts implying that firm size and age are relevant characteristics that influence markup differences As shown in figure 8 old companies (older than 15 years) display higher average markups than young ones (1ndash5 years old) even when they share similar attributes (in terms of ownership structure size and export and RampD profiles) and operate in the same NACE 4-digit sector county and year The estimated average markup premium for old companies (relative to young ones) is 54 percent for the whole economy It varies depending on how data are clustered across large sectors 79 percent in manufacturing 48 percent in services and 228 percent in mining Higher markup premiums for older companies can be interpreted in two ways it can reflect that more experienced firms are able to transpose learning returnsmdashwhich could positively affect their productivity or reduce their marginal costsmdashinto higher markups or that older firms are able to lobby better and create barriers to entry making it more difficult for younger firms to exert competitive pressure Firm size also matters to explain markup performance large companies (with more than 250 full-time employees) tend to display higher markups compared with small companies even when they operate in the same product market and share similar characteristics On average for the whole economy the
31 Results for the category ldquootherrdquo are not shown in table 5 As detailed in table A13 in annex 1 this ldquootherrdquo category refers to SBS ownership answer-codes 40 and 50 respectively ldquocooperativerdquo and ldquopublic of national and local interestrdquo The reason the corresponding results were not highlighted in the main text are twofold First the above-mentioned category accounts for only 006 percent of total companies in the sample Second an in-depth analysis would be needed to understand whether this ldquootherrdquo category reflects potential noise in the way firms self-classify their ownership structures or the way firms report cost expenditures (mainly) or whether this was influenced by SBS sampling design 32 Because the production approach applied in the current analysis delivers both markup and productivity estimates it is possible to further decompose the markup differences across firm characteristics and to verify whether after controlling for differences in marginal costs (that is productivity) certain groups of firms still have higher markups This is precisely one of the mitigating methods employed to reduce the conflation risk as highlighted before Results in table A16 in annex 1 should be interpreted as follows once productivity level is included in the equation differences in marginal cost are accounted for so the coefficient on ldquomajority state-ownedrdquo for instance captures the variation in average prices between majority state-owned and the size reference category (domestic privately owned firms)
24
markup premium for large companies is 122 percent higher than that of small firms (figure 9) Both size and age effects are still present even after controlling for productivity differences (see table A16 in annex 1)33
Figure 8 Average markup differences relative to young firms by age category
Figure 9 Average markup differences relative to small firms by size category
Source World Bank staff calculations based on SBS data set Note Numbers reflect estimated coefficients (multiplied by 100) for age dummy categoriesmdashrelative to young firms (1ndash5 years old) the omitted categorymdashin a fixed-effect regression model controlling for firm covariates plus year county and NACE 4-digit sector fixed effects as displayed in equation (11) All bars reflect statistically significant results See table A15 in annex 1 for the complete set of results
Source World Bank staff calculations based on SBS data set Note Numbers reflect estimated coefficients (multiplied by 100) for size dummy categoriesmdashrelative to small firms (1ndash50 employees) the omitted categorymdashin a fixed-effect regression model controlling for firm covariates plus year county and NACE 4-digit sector fixed effects as displayed in equation (11) All bars reflect statistically significant results See table A15 in annex 1 for the complete set of results
By the same token export intensity also influences markup performance with firms that export earning higher markups Being an exporter is a relevant firm feature to be analyzed when it comes to understanding markup performance Recent models of international trade predict that exporting firms earn higher markups than non-exporting firms either because they are relatively more productive and can thus undercut their rivals (see Melitz and Ottaviano 2008) or because they produce higher-quality goods and rely on higher-quality inputs which allow them to charge higher prices (see Hallak and Sivadasan 2009) In this regard the results summarized in figure 10 are consistent with the literature and suggest that exporting firmsmdashdefined as those whose direct exports represent more than 10 percent of total revenuemdashearn higher markups than non-exporting firms that operate in the same product market (NACE 4-digit sector) the difference ranges from 12 percent to 416 percent depending on how data are clustered across large sectors (manufacturing services and mining)
33 See footnote 32 on how to interpret results in table A16 in annex 1 (after including productivity as an additional control)
22
-160
158
7948
228
54
-505
101520253035
d
iffer
ence
Mature (between 6 and 15 years old)
Old (older than 15)
23
-830
090
327
169122
-15-55
152535
d
iffer
ence
Medium (between 51 and 250)
Large (more than 250 employees)
25
Figure 10 Average markup differences relative to non-exporters by export status
Figure 11 Average markup differences relative to non-RampD performers by RampD status
Source World Bank staff calculations based on SBS data set Note Numbers reflect estimated coefficients (multiplied by 100) for RampD dummy categorymdashrelative to non-RampD performer firms the omitted categorymdashin a fixed-effect regression model controlling for firm covariates plus year county and NACE 4-digit sector fixed effects as displayed in equation (11) All bars reflect statistically significant results See table A15 in annex 1 for the complete set of results
Source World Bank staff calculations based on SBS data set Note Numbers reflect estimated coefficients (multiplied by 100) for export dummy categorymdashrelative to non-exporters the omitted categorymdashin a fixed-effect regression model controlling for firm covariates plus year county and NACE 4-digit sector fixed effects as displayed in equation (11) All bars reflect statistically significant results See table A15 in annex 1 for the complete set of results
Performing RampD activities is positively correlated with markup differences while location proxied by county also matters to explain markup performance Results displayed in figure 11 show that RampD performersmdashidentified by those firms whose RampD expenses surpass more than 1 percent of their total revenuemdashtend to earn higher markups than non-RampD performers The markup premium for RampD performers is always positive suggesting that this group of firms is able to recoup fixed costs associated with RampD activities The magnitude of the premium varies from 16 percent to 46 percent depending how data are clustered across large sectors (manufacturing services and mining) In addition results displayed in figure 12 show that firms in the same product market (at NACE 4-digit level) and with similar characteristics (in terms of ownership age size and export and RampD profiles) charge different markups depending on the county in which they operate Except for Dolj firms in all other counties demonstrate lower average markups than Bucharest the negative markup premium in relation to Bucharest varies from minus154 percent (Vrancea) to minus36 percent (Satu-Mare)
12
258
416
119
05
101520253035404550
d
iffer
ence
160
340
460
273
05
101520253035404550
d
iffer
ence
26
Figure 12 Average markup differences by county relative to Bucharest
Source World Bank staff calculations based on SBS data set Note Numbers reflect estimated coefficients (multiplied by 100) for county fixed effectsmdashrelative to Bucharest the omitted categorymdashin a fixed-effect regression model controlling for firm covariates plus year and NACE 4-digit sector fixed effects as displayed in equation (11) All bars reflect statistically significant results See table A15 in annex 1 for the complete set of results
A variance decomposition analysis suggests that ownership is the most relevant characteristic to explain total variance of markup performance across firms in Romania followed by capital intensity and export status Drawing from estimations of equation (11) it is possible to evaluate the relative importance of each variable to explain the variance of the markup Letting dExp represent any of the explanatory variables of equation (11) the contribution to the variance of the markup of that variable can be defined as
119862119862119879119879119899119899119886119886119889119889119864119864119864119864119864119864 = 12057512057532119881119881119886119886119903119903119889119889119864119864119864119864119864119864+21205751205753119872119872119862119862119862119862(119889119889119864119864119864119864119864119864120583120583minus1205751205753119889119889119864119864119864119864119864119864)119881119881119886119886119903119903(120583120583)
(12)
or as the variance of the variable plus 2 times the covariance of the variable with the part of the markup not explained by that variable A similar expression can be derived for any of the remaining explanatory variables The relative contribution of each variable is computed after discounting the residuals sector and year contributions Results are displayed in figure 13 Ownership structure is shown to be the most relevant feature to explain the variance of markup performance across firms it accounts for 347 percent of the explained variance of markup performance (after removing NACE 4-digit sector and year contributions) The second most important characteristic is capital intensity corresponding to 214 percent of the variance of the markup performance Export status accounts for the third largest share in explained variance 113 percent
d
iffer
ence
27
Figure 13 Contribution by each firm characteristic to explain total variance of markup performance across firms
Source World Bank staff calculations based on SBS data set Note The pie chart reflects markup variance decomposition results It decomposes the variance of markup performance across firms after removing the proportion accounted for by omitted factors NACE 4-digit sector and year contributions
44 WHAT WOULD BE THE PRODUCTIVITY DIVIDENDS FROM MARKUP REDUCTION
While it became evident that aggregate market power in Romania has been rising it is important to analyze its consequences for economic growth An indirect way to measure this is to estimate the productivity dividends that would come from markup reduction The association between markup and productivity can be positive or negative depending on the nature of competition in the specific marketssectors As shown by Autor et al (2017) and Van Reenen (2018) there are marketsmdashsuch as high-tech sectors or knowledge-intensive onesmdashwhere the nature of competition tends to emphasize the importance of network effects economies of scale and scope and intangible assets so the most productive and dynamic firms exert higher markups and obtain larger market shares On the other hand in certain markets where recouping fixed costs (such as RampD) because of higher-risk investments is not that relevant high-markup firms are not necessarily more productive and efficient Another way to look at this contrast is through the inverted-U relationship of innovation and competition to an increase in productivity as explored by Aghion et al (2005) According to this view stronger competition (proxied here by smaller markups) encourages neck-and-neck firms to innovatemdashthe ldquoescape competitionrdquo effectmdashand therefore to increase productivity growth At the same time this view discourages laggard firms from innovating (the Schumpeterian effect) therefore reducing productivity growth The combination of the two effectsmdashescaping competition and discouraging innovationmdashexplains the inverted-U relationship of competition and innovation with productivity growth
To assess the correlation between productivity growth and markups in Romania the analysis uses firm-level estimations of TFPR and markups obtained so far Thus it estimates the specification presented in Aghion Braun and Fedderke (2008) as follows
Δ119889119889119899119899119879119879119897119897119897119897119877119877119888119888119895119895119894119894119895119895 = 1206011206010 + 1206011206011120583120583119888119888119895119895119894119894119895119895 + 120578120578119895119895 + 120588120588119895119895 + 120574120574119888119888 + 120592120592119888119888119895119895119894119894119895119895 (13)
where the left-hand-side variable represents TFPR growth of firm i in NACE 4-digit sector j in year t 120583120583119894119894119895119895119895119895minus1 is the lagged value of firm irsquos markup in sector j in year t ηt ρj and γc are
214
113
79
47
347
64
136
capital intensity Export status RampD status age ownership size region
28
respectively time NACE 4-digit sector and county fixed effects Equation (13) is estimated separately for each 1-digit sector (that is manufacturing services and mining) and for the whole economy while the equation parameters are estimated by OLS always using heteroscedasticity-robust standard errors
Figure 14 Productivity (TFPR) growth dividends from a 10 percent reduction of average markup by sector
Source World Bank staff calculations based on SBS data set Note Results from year county and 4-digit sector fixed effects Coefficient for mining was not statistically significant
Results shows that on average reducing markups would have a positive impact on aggregate productivity expansion Results displayed in table A18 in annex 1 suggest that lower (past) markups are associated with higher (current) productivity growth all coefficients for lagged markups are negative and statistically significant at conventional values for all sectors except mining Overall this negative correlation between past markup level and productivity growth is an indication of a positive association between competition and productivity growth which would be driven by the escape competition effect described by Aghion et al (2008)34
The magnitude of the economic effect of markup reduction on productivity growth is sizable Figure 14 shows that a 10 percent decrease in the average markup of 61 percent for the overall economy in the 2008ndash17 period would imply an increase in productivity (TFPR) growth of 082 percentage point per year The economic effect for the manufacturing sector would be substantially higher reducing the average markup of 403 percent for manufacturing in the same period would imply an increase in TFPR growth of 147 percentage points per year
Further productivity dividends stemming from markup reduction vary substantially across NACE 4-digit sectors The same specification expressed in equation (9) is estimated for each NACE 4-digit sector separately controlling for year and county fixed effects The TFPR growth dividends from markup reduction are computed for each NACE 4-digit sector drawing from the estimated coefficients (see table A18 in annex 1) Results vary substantially
34 An extended specificationmdashwhere the squared value of lagged markup is included as an additional dependent variablemdashwas also estimated The estimated coefficient of the squared term was not statistically significant (see results in table A17 in annex 1)
147
048
082
0
02
04
06
08
1
12
14
16
Manufacturing Services All
Perc
enta
ge p
oint
s per
yea
r
29
across sectors among those 4-digit sectors where the estimated coefficients are statistically significant the productivity growth dividends of a 10 percent decrease in markup vary from 701 percentage points to 016 percentage points respectively for NACE sector 1041ndashManufacture of oil and fats and sector 4649ndashWholesale of other household goods (figure 15)35 Productivity dividends from a potential markup reduction are also positive in sectors where the top decile firms in the markup distribution are overly represented for instance in sector 4711ndashRetail sale in non-specialized stores with food beverages or tobacco predominating a 10 percent decrease of average markup would be associated with an increase in TFPR growth of 022 percentage points per year For sector 4690ndashNon-specialized wholesale trade and sector 4673ndashWholesale of wood construction materials and sanitary equipment the productivity dividends would be 018 and 021 percentage points respectively
Figure 15 Productivity (TFPR) growth dividends from a 10 percent reduction of average markup Results by NACE 4-digit sector
Source World Bank staff calculations based on SBS data set
35 There are however some sectors where markup reduction brings detrimental impacts to productivity expansion See complete set of results in table A18in annex 1 for instance in NACE sector 8010ndashPrivate security activities and sector 2432ndashPrecious metals production where a reduction of average markup in the 2008ndash17 period would imply a decrease of TFPR growth of 030 percentage points and 663 percentage points respectively Following Aghion Braun and Fedderke (2008) the Schumpeterian effect of product market competition would be the underlying driver behind this result in these sectors competition reduces innovation incentives and therefore productivity growth by reducing the rents from innovations of firms below the technological frontier
00
10
20
30
40
50
60
70
80
Perc
enta
ge p
oint
s per
yea
r
30
5 CONCLUSIONS
A stylized fact emerging in the recent empirical literature is the increase in average levels of market power across countries in both developed and emerging economies This paper aims to bring new evidence about the evolution of corporate market power in Romania and the implications for competition dynamics It uses markups as a proxy for market power and explores firm-level heterogeneity to identify the underlying drivers of aggregate trends The paper applies the production approachmdashfollowing De Loecker and Warzynski (2012) De Loecker and Eeckhout (2018) and De Loecker Eeckhout and Unger (2020)mdashto estimate markup at the firm-year level for Romania The Romanian Structural Business Survey data set is used to apply this methodology
Results show that the aggregate markup in Romania increased by around 15 percent between 2008 and 2017 However this aggregate performance masks a lot of heterogeneity the first being heterogeneity of markups across the main sectors While in manufacturing (sales-weighted) average markups experienced a declining pattern of minus57 percent during 2008ndash17 there was an opposite and much more rapid trend in services with an aggregate change of 422 percent
Second at the firm level results suggest that a key driving force behind this aggregate trend was the ability of the top decile of firms in the markup distribution to increase their markups This increase has been faster than for the rest of the firms Firms in the 90th percentile of the markup distribution increased their (sales-weighted) average markup by 285 percent between 2008 and 2017 while the rest of firms (that is those below the top decile firms) experienced a completely opposite trend their weighted markup contracted by 83 percent over the same period
This sample of top decile firms does not seem to follow the typical superstar firmsrsquo profile which suggests that the increase in markups in Romania might be associated with an environment that is less conducive to competition The top decile firms in the markup distribution are 468 percent smaller 910 percent less productive and 33 percent less likely to invest in intangible assets than the rest of the firms in the markup distribution and they are overrepresented in less knowledge-intensive service sectors Therefore they do not seem to follow the typical superstar firmsrsquo profile (typically larger more productive and more likely to invest in intangible assets) This suggests that the increase in markups in Romania might be more due to relatively weak competition rather than to changes in the nature of competition where superstar firms (usually more efficient and innovative) are rewarded with greater market share In fact a decomposition exercise shows that the increase in aggregate markups has been driven mostly by incumbents rather than by new entrants and exiting firms These results could be interpreted as a sign of consolidation of market power among existing firms Several policy-related factors could explain this result among them government interventions and regulations that restrict competition by reinforcing dominance or limiting entry facilitating collusive outcomes or increasing the cost to compete in markets and by discriminating and protecting vested interests In this regard illustrative evidence provided by Pop and Ore Monago (2020) shows that despite reforms regulations that restrict entry and rivalry are still present in the retail trade sector which concentrates a substantial proportion of high-markup firms in the Romanian economy
31
Results also show that certain firm characteristics matter in explaining differences in markup performance size age RampD profile export propensity location and notably ownership State-controlled companies tend to demonstrate the highest markup premiums when compared with domestic privately owned companies 289 percent higher for minority state-owned companies and 20 percent higher for fully state-owned companies Old companies (older than 15 years) display 54 percent higher markups on average than young ones no matter the product market (at NACE 4-digit level) where they operate The markup premium for large companies (with more than 250 full-time employees) is 122 percent higher than that of small firms in the overall economy Exporting firmsmdashthose whose direct exports represent more than 10 percent of total revenuemdashearn 119 percent higher markups than non-exporting firms that operate in the same sector At the same time results show that the markup premium for RampD performers (compared with non-RampD performers) is 273 percent for the whole economy and that firms operating in the same product market charge different markups depending on the county where they operate Overall while all these features matter to explain markup performance a variance decomposition analysis suggests that ownership is the most relevant characteristic to explain total variance of markup performance across firms in Romania
In this context given that ownership assumes a prominent role to explain markup performance it is important to ensure competitively neutral policies across markets where private and public enterprises compete The prominent role of ownership in explaining total variance of markup performance across firms combined with the evidence that state-controlled companies tend to exert the highest markup premiums in the overall economy highlights the importance of ensuring competitive neutrality in Romania so that private and public enterprises compete on a fair basis Analysis presented in Pop and Ore Monago (2020) shows that state-owned enterprises (SOEs) in Romania compete on uneven terms with the private sector because of gaps in terms of both the current regulatory framework as well as its implementation As for the regulatory framework itself lack of competitive neutrality emerges from restrictive SOE governance rules and the exemption of newly setup SOEs from the corporate governance law lack of rules mandating the separation of commercial and noncommercial functions despite legal separation (for example in the railway and energy sectors) and the lack of specific provisions that require SOE investments to show positive rates of returns With regard to implementation of the regulatory framework competitive neutrality gaps stem from (a) the protracted application of corporate governance rules (b) fragmentation of SOE oversight across institutions with frequent overlaps (c) inconsistent reporting of SOE performance that prevents full monitoring and comparability with the private sector performance in comparable situations (d) little clarity in terms of compensation for public service obligations and (e) lack of transparency in state aid allocation
Finally the analysis shows that productivity dividends arise from increased competition in Romania As such lowering markups can boost productivity growth A 10 percent decrease in the average markup for the overall economy during 2008ndash17 would imply an increase in productivity (TFPR) growth of 082 percentage point per year The effect for the manufacturing sector is higher (147 percentage points per year) but lower for services (048 percentage point per year) The ldquoescape competitionrdquo effect described by Aghion Braun and Fedderke (2008)mdashthrough which fiercer competition induces firms to innovate to escape competition with the fringe therefore increasing productivity growthmdashwould be the underlying driver behind these average results for the manufacturing industry Results vary substantially across sectors among
32
those 4-digit sectors where the estimated coefficients are statistically significant the productivity growth dividend of a 10 percent decrease in markup varies from 701 percentage points (sector 1041ndashManufacture of oil and fats) to 016 percentage point (sector 4649ndashWholesale of other household goods)
In this context boosting competition becomes a key part of the engine to drive productivity growth and help consolidate Romaniarsquos convergence to a high-income level Implementing pro-competition policies is instrumental Besides removing anticompetitive regulations and promoting competitive neutrality policy makers should ensure that state aid is allocated in a non-distortive way and enable more effective competition law and antitrust enforcement
33
REFERENCES
Ackerberg D K Caves and G Frazer 2015 ldquoIdentification Properties of Recent Production Function Estimatorsrdquo Econometrica 83 (6) 2411ndash51
Aghion P N Bloom R Blundell R Griffith and P Howitt 2005 ldquoCompetition and Innovation An Inverted-U Relationshiprdquo Quarterly Journal of Economics 120 (2) 701minus28
Aghion P M Braun and J Fedderke 2008 ldquoCompetition and Productivity Growth in South Africardquo Economics of Transition 16 (4) 741ndash68
Autor D D Dorn F Lawrence C Patterson and J Van Reenen 2017 ldquoThe Fall of the Labor Share and the Rise of Superstar Firmsrdquo NBER Working Paper 23396 National Bureau of Economic Research Cambridge MA
Barkai S 2020 ldquoDeclining Labor and Capital Sharesrdquo Journal of Finance 75 (5) 2421ndash63
Bartelsman E J and M Doms 2000 ldquoUnderstanding Productivity Lessons from Longitudinal Microdatardquo Journal of Economic Literature 38 (3) 569ndash94
Berry S J Levinsohn and A Pakes 1995 ldquoAutomobile Prices in Market Equilibriumrdquo Econometrica Journal of the Econometric Society 63 (4) 841ndash90
Berry S J Levinsohn and A Pakes 2004 ldquoDifferentiated Products Demand Systems from a Combination of Micro and Macro Data The New Car Marketrdquo Journal of Political Economy 112 (1) 68ndash105
Bessen J 2017 ldquoInformation Technology and Industry Concentrationrdquo Law and Economics Paper No 17-41 Boston University School of Law Boston
Bond S A Hashemi G Kaplan and P Zoch 2020 ldquoSome Unpleasant Markup Arithmetic Production Function Elasticities and their Estimation from Production Datardquo NBER Working Paper No 27002 National Bureau of Economic Research Cambridge MA
Bresnahan T F 1989 ldquoEmpirical Studies of Industries with Market Powerrdquo In Handbook of Industrial Organization Vol 2 edited by R Schmalensee and R Willig 1011ndash57 Amsterdam Elsevier
Cameron A C and P K Trivedi 2010 Microeconometrics Using Stata (Rev ed) College Station TX Stata Press
Crouzet N and J Eberly 2018 ldquoUnderstanding Weak Capital Investment The Role of Market Concentration and Intangiblesrdquo NBER Working Paper 25869 National Bureau of Economic Research Cambridge MA De Loecker J 2011 ldquoRecovering Markups from Production Datardquo International Journal of Industrial Organization 29 (3) 350ndash55
De Loecker J 2013 ldquoDetecting Learning by Exportingrdquo American Economic Journal Microeconomics 5 (3) 1ndash21
De Loecker J and J Eeckhout 2018 ldquoGlobal Market Powerrdquo NBER Working Paper 24768 National Bureau of Economic Research Cambridge MA
De Loecker J J Eeckhout and G Unger 2020 ldquoThe Rise of Market Power and the Macroeconomic Implicationsrdquo Quarterly Journal of Economics 135 (2) 561ndash644 httpsdoiorg101093qjeqjz041
34
De Loecker J and F Warzynski 2012 ldquoMark-ups and Firm-Level Export Statusrdquo American Economic Review 102 (6) 2437ndash71
Diacuteez F D Leigh and S Tambunlertchai 2018 ldquoGlobal Market Power and Its Macroeconomic Implicationsrdquo IMF Working Paper 18137 International Monetary Fund Washington DC
Grullon G Y Larkin and R Michaely 2018 ldquoAre US Industries Becoming More Concentratedrdquo Swiss Finance Institute Research Paper No 19-41 httpdxdoiorg102139ssrn2612047
Gutieacuterrez G and T Philippon 2017a ldquoDeclining Competition and Investment in the USrdquo NBER Working Paper 23583 National Bureau of Economic Research Cambridge MA Gutieacuterrez G and T Philippon 2017b ldquoInvestment-less Growth An Empirical Investigationrdquo Brookings Papers on Economic Activity (Fall) 89ndash182 Gutieacuterrez G and T Philippon 2018 ldquoHow EU Markets Became More Competitive than US Markets A Study of Institutional Driftrdquo NBER Working Paper 24700 National Bureau of Economic Research Cambridge MA
Hall R 1988 ldquoThe Relation between Price and Marginal Cost in US Industryrdquo Journal of Political Economy 96 (5) 921ndash47
Hallak J and J Sivadasan 2009 ldquoExporting Behavior under Quality Constraintsrdquo NBER Working Paper 14928 National Bureau of Economic Research Cambridge MA
IMF (International Monetary Fund) 2019 World Economic Outlook April 2019 Growth Slowdown Precarious Recovery Washington DC International Monetary Fund
Koujianou Goldberg P and R Hellerstein 2012 A Structural Approach to Identifying the Sources of Local Currency Price Stability Review of Economic Studies 80 (1) 175ndash210
Melitz M J and G Ottaviano 2008 ldquoMarket Size Trade and Productivityrdquo Review of Economic Studies 75 (1) 295ndash316
Melitz M J and S Polanec 2015 ldquoDynamic Olley-Pakes Productivity Decomposition with Entry and Exitrdquo RAND Journal of Economics 46 (2) 362ndash75
Motta M 2004 Competition Policy Theory and Practice Cambridge MA Cambridge University Press
Pop G and T Ore Monago 2020 ldquoCompetition and Government Interventions in Romania An Assessment with Focus on Product Market Regulations and Competitive Neutralityrdquo Background paper for Markets and People Romania Country Economic Memorandum International Development in Focus World Bank Washington DC
Shapiro C 2018 ldquoAntitrust in a Time of Populismrdquo International Journal of Industrial Organization 61 714ndash48
Syverson C 2004 ldquoProduct Substitutability and Productivity Dispersionrdquo Review of Economics and Statistics 86 (2) 534ndash50
Van Reenen J 2018 ldquoIncreasing Differences between Firms Market Power and the Macroeconomyrdquo CEPR Discussion Paper 1576 Center for Economic and Policy Research Washington DC
35
World Bank 2020a ldquoMarkets and People Romania Country Economic Memorandumrdquo International Development in Focus World Bank Washington DC
World Bank 2020b ldquoAssessing the Direct and Indirect Impact of State Aid in Romania An Ex-post Evaluationrdquo World Bank Washington DC
36
ANNEX 1 ADDITIONAL FIGURES AND TABLES
Figure A11 Evolution of (sales-weighted) average markup in manufacturing sector by technology intensity 2008ndash17
Source World Bank staff calculations based on SBS data set
Table A11 Manufacturing industry groups by technology intensity Eurostat classification
85
99
51
Mar
k-up i
ndex
(200
8 = 1
)
2008 2009 2010 2011 2012 2013 2014 2015 2016 2017Year
Manuf High-tech
37
Source Eurostat Indicators on High-Tech Industry and KnowledgendashIntensive Services annex 3 httpseceuropaeueurostatcachemetadataAnnexeshtec_esms_an3pdf
38
Figure A12 Evolution of (sales-weighted) average markup in services sector by knowledge intensity
39
Table A12 Services groups by knowledge intensity Eurostat classification
40
Source Eurostat Indicators on High-Tech Industry and KnowledgendashIntensive Services annex 3 httpseceuropaeueurostatcachemetadataAnnexeshtec_esms_an3pdf
41
Table A13 Original ownership classification from SBS SBS Code Description
10 Fully state-owned Majority state-owned (statepublic capital gt 50 of equity)
21 State + Romanian private 22 State + foreign 23 State + Romanian private + foreign
Majority privately owned (private capital ge 50 of equity) 26 State + Romanian private 27 State + foreign 28 State + Romanian private + foreign
Fully privately owned 31 Romanian private 32 Romanian private + foreign 40 Cooperative 50 Craft organizations 60 Fully foreign-owned 70 Public of national and local interest
Source World Bank staff calculations based on SBS data set
Table A14 Ownership classification adopted in the analysis SBS codes (combined) Description
10 21 22 23 State owned (fully + majority state-owned) 26 27 28 Private-public (majority private)
31 Fully private (domestic) 32 Fully private (domestic + foreign) 60 Fully private (fully foreign) 70 Public of national and local interest
40 50 Other Source World Bank staff calculations based on SBS data set
Table A15 Conditional correlations between firm characteristics and markup performance regression results
Variable Manufacturing Services Mining All Capital stock (ln) minus0150 minus0039 minus0067 minus0066 Export dummy 0120 0258 0416 0119 RampD dummy 0160 0340 0460 0273 Mature 0022 minus0016 0158 minus0005 Old 0079 0048 0228 0054 Majority state-owned 0527 0139 0772 0200 State-private ownership 0352 0275 0111 0289 Romanian private + foreign 0161 0279 0096 0229 Fully foreign-owned 0105 0263 0 0201 Public of national and local interest 0209 0149 (omitted) 0214 Other 0884 0555 (omitted) 0758 Medium 0230 minus0083 0011 0009 Large 0327 0169 minus0015 0122 1 Alba 0106 minus0087 minus0151 minus0042 2 Arad 0038 minus0090 minus0148 minus0077 3 Arges minus0005 minus0053 minus0195 minus0060
42
Variable Manufacturing Services Mining All 4 Bacau 0092 minus0090 minus0194 minus0055 5 Bihor 0036 minus0115 minus0256 minus0088 6 Bistrita-Nasaud minus0064 minus0156 minus0069 minus0144 7 Botosani 0046 minus0089 minus0438 minus0076 8 Brasov 0041 minus0047 0049 minus0040 9 Braila 0133 minus0055 minus0265 minus0025 10 Buzau 0017 minus0123 minus0025 minus0100 11 Caras-Severin 0035 minus0187 minus0005 minus0139 12 Cluj minus0004 minus0094 minus0119 minus0088 13 Constanta 0057 minus0105 0062 minus0088 14 Covasna 0038 minus0056 minus0151 minus0052 15 Dambovita 0005 minus0183 minus0154 minus0144 16 Dolj 0195 0060 minus0042 0079 17 Galati 0106 minus0007 minus0276 0004 18 Gorj 0084 0028 minus0116 0026 19 Harghita 0101 minus0102 minus0007 minus0045 20 Hunedoara 0167 minus0031 minus0057 0011 21 Ialomita 0138 minus0049 minus0265 minus0027 22 Iasi minus0014 minus0038 minus0384 minus0058 23 Ilfov 0011 0009 0314 0010 24 Maramures 0094 minus0020 minus0042 0 25 Mehedinti 0113 minus0136 minus0720 minus0096 26 Mures 0048 minus0063 minus0093 minus0048 27 Neamt 0001 minus0108 minus0428 minus0102 28 Olt 0073 minus0005 minus0397 minus0011 29 Prahova 0018 minus0034 minus0028 minus0043 30 Satu-Mare 0033 minus0024 minus0056 minus0036 31 Salaj 0075 minus0045 minus0448 minus0031 32 Sibiu 0044 minus0038 minus0154 minus0041 33 Suceava 0044 minus0087 minus0111 minus0074 34 Teleorman 0103 minus0099 minus0299 minus0062 35 Timis 0030 minus0020 minus0341 minus0037 36 Tulcea 0142 minus0149 0096 minus0078 37 Vaslui 0091 minus0017 minus0105 minus0007 38 Valcea 0078 minus0008 minus0122 minus0002 39 Vrancea minus0061 minus0163 minus0608 minus0154 51 Calarasi 0080 minus0122 0672 minus0075 52 Giurgiu 0052 minus0064 minus0334 minus0066
_cons 2147 1150 2291 2246 NACE 4-digit fixed effects Yes Yes Yes Yes
Year fixed effects Yes Yes Yes Yes
R2 0345 0235 0254 0279 Source World Bank staff calculations based on SBS data set Note Dependent variable = ln(markup) denotes significance level at 1 percent at 5 percent and at 10 percent
43
44
Table A16 Conditional correlations between firm characteristics (including productivity) and markup performance regression results
Variable Manufacturing Services Mining All Capital stock (ln) minus0149 minus0038 minus0065 minus0066 Export dummy 0116 0257 0400 0118 RampD dummy 0182 0366 0449 0295 Mature 0021 minus0014 0164 minus0003 Old 0079 0052 0228 0057 Majority state-owned 0529 0147 0758 0209 State-private ownership 0351 0274 0118 0288 Romanian private + foreign 0156 0275 0090 0225 Fully foreign-owned 0096 0254 minus0011 0192 Public of national and local interest 0179 0165 (omitted) 0233 Other 0879 0561 (omitted) 0759 Medium 0232 minus0083 0002 0010 Large 0327 0170 minus0016 0122
Productivity (TFPR) 0051 0020 0041 0024 1 Alba 0114 minus0081 minus0156 minus0035 2 Arad 0045 minus0085 minus0135 minus0071 3 Arges 0001 minus0049 minus0196 minus0056 4 Bacau 0098 minus0084 minus0188 minus0049 5 Bihor 0042 minus0111 minus0268 minus0083 6 Bistrita-Nasaud minus0057 minus0150 minus0055 minus0137 7 Botosani 0053 minus0082 minus0443 minus0069 8 Brasov 0045 minus0042 0033 minus0035 9 Braila 0139 minus0048 minus0243 minus0018 10 Buzau 0022 minus0118 minus0002 minus0094 11 Caras-Severin 0042 minus0178 minus0001 minus0131 12 Cluj minus0001 minus0089 minus0120 minus0083 13 Constanta 0067 minus0101 0056 minus0084 14 Covasna 0045 minus0050 minus0166 minus0046 15 Dambovita 0010 minus0180 minus0162 minus0140 16 Dolj 0202 0068 minus0054 0087 17 Galati 0114 minus0001 minus0289 0010 18 Gorj 0091 0037 minus0118 0035 19 Harghita 0108 minus0096 minus0005 minus0039 20 Hunedoara 0173 minus0025 minus0055 0018 21 Ialomita 0144 minus0045 minus0256 minus0023 22 Iasi minus0005 minus0034 minus0394 minus0053 23 Ilfov 0013 0012 0296 0013 24 Maramures 0101 minus0013 minus0038 0007 25 Mehedinti 0128 minus0132 minus0729 minus0090 26 Mures 0053 minus0057 minus0105 minus0042 27 Neamt 0010 minus0101 minus0434 minus0094
45
Variable Manufacturing Services Mining All 28 Olt 0082 0002 minus0402 minus0004 29 Prahova 0023 minus0029 minus0032 minus0039 30 Satu-Mare 0038 minus0018 minus0047 minus0030 31 Salaj 0081 minus0039 minus0433 minus0025 32 Sibiu 0044 minus0034 minus0147 minus0038 33 Suceava 0051 minus0081 minus0105 minus0068 34 Teleorman 0117 minus0092 minus0296 minus0053 35 Timis 0033 minus0014 minus0340 minus0032 36 Tulcea 0147 minus0142 0078 minus0072 37 Vaslui 0101 minus0011 minus0104 0 38 Valcea 0087 minus0002 minus0120 0004 39 Vrancea minus0053 minus0158 minus0602 minus0148 51 Calarasi 0086 minus0118 0673 minus0071 52 Giurgiu 0059 minus0060 minus0334 minus0061
_cons 1632 0993 1934 2036 NACE 4-digit fixed effects Yes Yes Yes Yes
Year fixed effects Yes Yes Yes Yes
R2 0347 0235 0255 0280 Source World Bank staff calculations based on SBS data set Note Dependent variable = ln(markup) denotes significance level at 1 percent at 5 percent and at 10 percent
Table A17 Productivity growth and markup performance regression results
All Manufacturing Services Mining
Lag markup minus0025 minus0028 minus0026 minus0027 minus0025 minus0027 minus0012 minus0024
Lag markup squared 0001 0000 0001 0003 NACE 4-digit sector fixed effects Yes Yes Yes Yes Yes Yes Yes Yes County fixed effects Yes Yes Yes Yes Yes Yes Yes Yes Year fixed effects Yes Yes Yes Yes Yes Yes Yes Yes
Observations 245525 245525 76694 76694 167120 167120 1711 1711 Source World Bank staff calculations based on SBS data set Note Dependent variable = TFPR growth denotes significance level at 1 percent at 5 percent and at 10 percent
46
Table A18 Productivity (TFPR) growth dividends from a 10 reduction of average markup results by NACE 4-digit sector
NACE 4-digit sector Gain in TFPR growth per
year (percentage points)
1041ndashManufacture of oils and fats 7015 4331ndashPlastering 5547 2060ndashManufacture of man-made fibers 5286 2824ndashManufacture of power-driven hand tools 4869 1072ndashManufacture of rusks and biscuits manufacture of preserved pastry goods and cakes
4145
1104ndashManufacture of other non-distilled fermented beverages 3984 1723ndashManufacture of paper stationery 3716 2812ndashManufacture of fluid power equipment 3566 2452ndashCasting of steel 3278 1101ndashDistilling rectifying and blending of spirits 3134 1420ndashRaising of other cattle and buffaloes 3072 2011ndashManufacture of industrial gases 3033 2593ndashManufacture of wire products chain and springs 2689 2829ndashManufacture of other general-purpose machinery nec 2641 4910ndashPassenger rail transport interurban 2629 2451ndashCasting of iron 2615 3821ndashTreatment and disposal of non-hazardous waste 2375 2059ndashManufacture of other chemical products nec 2336 2920ndashManufacture of bodies (coachwork) for motor vehicles manufacture of trailers and semi-trailers
2270
1051ndashOperation of dairies and cheese making 2224 3313ndashRepair of electronic and optical equipment 2160 1081ndashManufacture of sugar 2158 1073ndashManufacture of macaroni noodles couscous and similar farinaceous products 2081 4213ndashConstruction of bridges and tunnels 2077 2223ndashManufacture of buildersrsquo ware of plastic 2011 2550ndashForging pressing stamping and roll-forming of metal powder metallurgy 1949 2313ndashManufacture of hollow glass 1926 2825ndashManufacture of non-domestic cooling and ventilation equipment 1889 2020ndashManufacture of pesticides and other agrochemical products 1818 2571ndashManufacture of cutlery 1758 5914ndashMotion picture projection activities 1691 5920ndashSound recording and music publishing activities 1665 3514ndashTrade of electricity 1653 1310ndashPreparation and spinning of textile fibers 1616 4920ndashFreight rail transport 1613 4339ndashOther building completion and finishing 1586 2620ndashManufacture of computers and peripheral equipment 1543 4311ndashDemolition 1515 3832ndashRecovery of sorted materials 1404 3523ndashTrade of gas through mains 1382 2410ndashManufacture of basic iron and steel and of ferro-alloys 1353 2399ndashManufacture of other non-metallic mineral products nec 1272 2017ndashManufacture of synthetic rubber in primary forms 1258 7711ndashRental and leasing of cars and light motor vehicles 1256 4212ndashConstruction of railways and underground railways 1128 2453ndashCasting of light metals 1080 7410ndashSpecialized design activities 1068 5630ndashBeverage serving activities 1065 4211ndashConstruction of roads and motorways 0989 4677ndashWholesale of waste and scrap 0926 4676ndashWholesale of other intermediate products 0917 4120ndashConstruction of residential and non-residential buildings 0912 4623ndashWholesale of live animals 0890 6820ndashRental and operating of own or leased real estate 0826 4110ndashDevelopment of building projects 0824
47
NACE 4-digit sector Gain in TFPR growth per year
(percentage points) 4613ndashAgents involved in the sale of timber and building materials 0823 4322ndashPlumbing heat and air-conditioning installation 0731 5629ndashOther food service activities 0699 4791ndashRetail sale via mail order houses or via internet 0659 4941ndashFreight transport by road 0659 4618ndashAgents specialized in the sale of other particular products 0646 7219ndashOther research and experimental development on natural sciences and engineering 0623 4617ndashAgents involved in the sale of food beverages and tobacco 0609 5510ndashHotels and similar accommodation 0560 4615ndashAgents involved in the sale of furniture household goods hardware and ironmongery
0541
4633ndashWholesale of dairy products eggs and edible oils and fats 0540 4778ndashOther retail sale of new goods in specialized stores 0527 4621ndashWholesale of grain unmanufactured tobacco seeds and animal feeds 0517 4662ndashWholesale of machine tools 0501 6110ndashWired telecommunications activities 0491 4634ndashWholesale of beverages 0468 5610ndashRestaurants and mobile food service activities 0463 4631ndashWholesale of fruit and vegetables 0426 4532ndashRetail trade of motor vehicle parts and accessories 0394 1411ndashManufacture of leather clothes 0390 4511ndashSale of cars and light motor vehicles 0382 4637ndashWholesale of coffee tea cocoa and spices 0361 4645ndashWholesale of perfume and cosmetics 0354 1419ndashManufacture of other wearing apparel and accessories 0344 4643ndashWholesale of electrical household appliances 0335 4639ndashNon-specialized wholesale of food beverages and tobacco 0285 4619ndashAgents involved in the sale of a variety of goods 0281 4675ndashWholesale of chemical products 0249 4711ndashRetail sale in non-specialized stores with food beverages or tobacco predominating 0223 4673ndashWholesale of wood construction materials and sanitary equipment 0214 4690ndashNon-specialized wholesale trade 0188 4649ndashWholesale of other household goods 0158 8010ndashPrivate security activities minus0300 8220ndashActivities of call centres minus0323 2572ndashManufacture of locks and hinges minus0503 7120ndashTechnical testing and analysis minus0511 3315ndashRepair and maintenance of ships and boats minus0512 3600ndashWater collection treatment and supply minus0547 4754ndashRetail sale of electrical household appliances in specialized stores minus0627 2341ndashManufacture of ceramic household and ornamental articles minus0646 7111ndashArchitectural activities minus0649 6120ndashWireless telecommunications activities minus0746 7312ndashMedia representation minus1023 4334ndashPainting and glazing minus1200 5020ndashSea and coastal freight water transport minus1276 1052ndashManufacture of ice cream minus1367 5911ndashMotion picture video and television programme production activities minus1439 2592ndashManufacture of light metal packaging minus1619 2752ndashManufacture of non-electric domestic appliances minus1729 2521ndashManufacture of central heating radiators and boilers minus1843 4932ndashTaxi operation minus2568 2013ndashManufacture of other inorganic basic chemicals minus3524 1711ndashManufacture of pulp minus3631 4942ndashRemoval services minus4214 1092ndashManufacture of prepared pet foods minus4262 3040ndashManufacture of military fighting vehicles minus5508 2432ndashCold rolling of narrow strip minus6629
Source World Bank staff calculations based on SBS data set Note The table displays only sectors for which estimated coefficients are statistically significant
48
- 1 Introduction and motivation
- 2 Methodology
- 3 Data set
- 4 Results
-
- 41 Has corporate market power increased at the aggregate level How do aggregate trends differ across sectors Is there a group of firms driving the overall trend
- 42 How have firm dynamics influenced aggregate markup performance Are there signs of market power consolidation among incumbent firms
- 43 Do firm markups differ across firms with different attributes
- 44 What would be the productivity dividends from markup reduction
-
- 5 Conclusions
- References
- Annex 1 Additional figures and tables
-

3
analysis covering both advanced and emerging economies to explore the link between markups and physical capital investment and to estimate the extent to which the worldwide average increase in firmsrsquo markups experienced since 2000 is associated with a 04 percentage point decrease in the investment rate
Different strands of empirical literature emphasize distinctmdashbut not necessarily exclusivemdashunderlying mechanisms to explain the overall rise in market power On the one hand authors such as Autor et al (2017) Van Reenen (2018) and Bessen (2017) present results that support the hypothesis that increases in market power have been accompanied by efficiency gains As such changes in the economic environmentmdashcaused by high-tech digital markets engaging in platform competition increases in investment in intangible capital by leading companies and scale-biased technical change provoked by advances in information and communication technology (ICT)mdashhave led to the emergence of large efficient firms Such so-called superstar firms per Autor et al (2017) are able to secure larger market shares in ldquowinner takes mostrdquo markets2 In other words tougher competition (and not less) in these types of markets would reallocate more output toward the high-markup larger and more productive firms In this context superstar firms extract a larger market share which would then explain increases in aggregate (weighted average) market power On the other hand some authors argue that the increase in market power reflects declining competition caused by weakened antitrust enforcement or more stringent regulations that lead to worse allocative efficiency For instance Gutieacuterrez and Philippon (2018) argue that weaker antitrust enforcement in the United States relative to the European Union (EU) explains why market power has risen more in the United States than in EU countries
Against this backdrop this paper presents new evidence regarding the evolution of corporate market power in Romania It goes beyond the average performance of firms and explores firm-level heterogeneity to identify the underlying drivers of aggregate market power trends and the implications for economic growth This paper will explore several questions At the aggregate level the following queries will be assessed Has corporate market power increased How do aggregate trends differ across sectors and across technology intensity and knowledge intensity of sectors Next the analysis will focus on firm-level drivers of aggregate market power trends Regarding the latter the following questions will be assessed Is variation of market power uneven across firms To what extent has firm dynamismmdashthrough incumbents and new entrants or exiting firmsmdashbeen driving markup Does markup performance differ across firms with different attributes Finally to account for economic growth implications the paper will shed light on the potential productivity dividends stemming from fiercer competition across the economy proxied by a reduction in market power
2 METHODOLOGY
The definition of market power is well established Taking output markets as the reference point the standard (theoretical) definition of market power is the ability of a firm to maintain prices above marginal cost which is the level that would prevail under perfect competition The exact magnitude of a firmrsquos market powermdashwhich is tied to the gap between its price and
2 According to this view the dominance of ldquosuperstar firmsrdquomdashsuch as Amazon Apple Facebook Google and Microsoftmdashwould be due to intensified competition ldquofor the marketrdquo rather than anticompetitive mergers or collusion ldquoin the marketrdquo (Van Reenen 2018)
4
marginal costmdashwould depend on the format of the residual demand curve faced by the firm the steeper the inverse demand the larger the price-cost margin difference the higher the market power retained by the firm3
However the actual measurement of market power is not straightforward A commonly used approach is to approximate market power indirectly through market concentration indicators These indicators can assume various formats for instance concentration ratios and the Herfindahl-Hirschman index (HHI) Although these indicators are often relatively easy to computemdashespecially because they require only data on firm revenuesmdashthey have more drawbacks than benefits First and as highlighted in the seminal article of Bresnahan (1989) these indicators do not provide an adequate measure of market power in the presence of product differentiation Second the computation of these indicators requires the definition of a relevant market which usually considers the degree of product substitution geographic location of both producers and consumers transportation costs and so on In this regard it is often harder to define markets in periods of technological change Third the interpretation of results using these indicators can be ambiguous As highlighted by Shapiro (2018) an increase in market concentration could indicate a decline in competition reflecting the existence of less numerous and weaker rivals to dominant incumbent firms on the other hand an increase could equally reflect market competition forces in action making more efficient firms gain larger market shares
Another way to measure market power is to estimate markups Markups capture the ability of firms to charge prices above marginal cost Data availability is the key challenge associated with this methodological alternative as price data at the firm level rarely are accessible let alone data on marginal costs
A common method to estimate markups is the demand approach which involves estimating a demand system and then adding some assumptions on how firms set prices The data requirements associated with this approach are significant The demand method relies on the estimation of a demand system and assumes a fully specified model of consumer choice (see for instance Bresnahan 1989) The estimation itself requires detailed data on prices quantities sold and product characteristics all drawing from retail downstream purchases or consumer-level data Once the own-price and cross-price elasticities across the goods considered are estimated markups can be recovered from first order conditions after specifying a model of competition Overall the main shortcoming of this method is the need to use extremely detailed market-level data As a result the approach has been used only to assess market power in specific sectors for instance see Berry Levinsohn and Pakes (1995)
3 Following this standard approach the gap between price and marginal cost could be approximated by a Lerner index which is calculated as 119871119871119894119894 = 119875119875119894119894minus119872119872119872119872119894119894
119875119875119894119894 reflecting how far a firmrsquos price is from its marginal cost When
specifying a demand function and assuming that firms follow a profit-maximizing behavior it can be shown that for a given firmmdashin a Cournot quantity set case for instancemdashthe first-order condition equals 119871119871119894119894 = 120572120572119894119894
120576120576 where 120572120572119894119894
is the firmrsquos market share and 120598120598 is the demand elasticity of the firm Alternatively in the case of a dominant firm with a competitive fringe that together cover the entire market for a homogeneous good the Lerner index would be approximated as 119871119871119894119894 = 119878119878119894119894
120576120576119889119889+(1minus119878119878119894119894)120576120576119903119903 where 120576120576119889119889 is the marketrsquos elasticity of demand 120576120576119903119903 is the rivalrsquos collective
elasticity of supply and 119878119878119894119894 denotes the dominant firmrsquos market share
5
as well as Berry Levinsohn and Pakes (2004) for cars and more recently Koujianou Goldberg and Hellerstein (2012) for beer
The production approach on the other hand offers more flexibility It relies on simpler assumptions and the data requirements are less rigorous only firmsrsquo financial statements are needed Specifically there is no need to make assumptions on how firms compete in the market there are no restrictions on underlying consumer demand and only firm production data (on inputs and outputs) are needed which can be easily extracted from firmsrsquo financial statements This methodologymdashformally presented in De Loecker and Warzynski (2012)mdashbuilds on the work of Hall (1988) who shows that under cost minimization a firmrsquos markup (price over cost) equals the ratio of two values the output elasticity of a variable input (free of adjustment costs as opposed to quasi-fixed inputs) and the share of expenditures with that input in total revenue that is
120583120583 = 120573120573119881119881119904119904ℎ119886119886119903119903119886119886119881119881
Where 120583120583 is the markup 120573120573119881119881 is the elasticity of output with respect to the variable input and 119904119904ℎ119886119886119886119886119886119886119881119881 is the share of revenue spent on the variable input That said only two pieces of information are needed to estimate the firmrsquos markup the output elasticity which is obtained by estimating a production function of the sector where the firm operates and the revenue share which is directly observed in the data4
Given its flexibility the production approach will be applied to estimate firm-level markups as a proxy for market power in Romania The implementation of this method follows two steps The first is to define and estimate a production function to reflect the technology firms have access to For estimation purposes a firmrsquos i that belongs to sector j (defined at the NACE 2-digit level) production function at year t is represented by a flexible translog technology as follows
(1)
where all the variables are in natural logarithms and yjit is the firmrsquos annual total revenue from operations mjit is the total expenditure in intermediate materials kjit is the capital stock (sum of tangible and intangible assets) and ljit is the total number of hours worked per year (the natural logarithm of the product of the number of employees times the number of months worked times the number of hours worked per month)
TFPR is identified as any change in firmsrsquo revenue not caused by variations in the inputs of production More specifically in equation (1) TFPR (in natural logarithm) is identified by
4 The intuition behind this markup measure is discussed in De Loecker (2011) For a cost-minimizing producer the output elasticity of a variable input equals its expenditure share in total revenue only when price equals marginal cost Any departure from the perfect competitive model will be captured by the difference between the output elasticity and the revenue share as measured by the markup (price over cost)
6
(2)
The term ωjit is known by the firm but not by the econometrician which generates a problem of simultaneity between the inputs and productivity The last term (εjit) is assumed to be a completely random productivity shock not anticipated by the firms when making their input choices The Ackerberg Caves and Frazer (2015) approach is followed to solve the endogeneity problem and the anticipated productivity shock is divided into two terms
(3)
where the first term g(ωjitminus1) is the inertia of the productivity process that is highly productive firms at tminus1 will also have a high productivity level at t (present)5 This is the term that firms know when making their input choices The second term ξjit is the innovation of the productivity process and it is the key of the estimation process It can be interpreted as any change in the level of productivity that is completely new at time t and uncorrelated with past productivity
Since the innovation is uncorrelated with past productivity it is also uncorrelated with the optimal choices of the variable inputs that is materials and labor made at moment tminus1 Moreover since capital is a fixed input and it takes time to change its level one can also assume that the innovation of productivity is uncorrelated with the capital input choices made at moment t This set of assumptions allows one to form a set of moment conditions as follows6
(4)
which states that we can use the lack of correlation between lagged flexible inputs and contemporaneous capital on the one hand and productivity innovation on the other to identify (estimate) the parameters of the production function in equation (1) To account for differences in production technologies across sectors the TFPR estimation as discussed above allows for heterogeneous sector-specific (NACE 2-digit) production functions
Using the estimations of the production function it is possible to compute the output elasticity of the variable input (here assumed as materials) in sector j where firm i operates as follows
(5)
In this regard it should be noted that all firms in the same sector j are assigned a common elasticity The interpretation is that firms in the same sector have access to the same technology but they differ both in terms of TFPRjit and the optimally chosen level of variable input (material)
5 Following the terminology used in the literature the current analysis assumes that productivity follows a first-order Markov process in the sense that it depends only on its own past values The functional form is approximated by a polynomial of degree 3 on the first lag of TFPR This is a quite general procedure see for instance De Loecker (2013) 6 A moment condition is a statistical equality that holds in the population under study
7
Once the output elasticity of the variable input is estimated the second operational step is to use information on expenditures on variable inputs to compute a firmrsquos markup Specifically firmrsquos markup can be directly computed as follows
micro119895119895119894119894119895119895 = 120573120573119872119872119895119895
119872119872119904119904ℎ119886119886119903119903119886119886119895119895119894119894119895119895 (6)
where 120573119872119872119895119895 was estimated in the previous step and 119872119872119904119904ℎ119886119886119886119886119886119886119895119895119894119894119895119895 is the ratio of cost of variable input (materials) to corrected revenue defined as
(7)
where PMMjit is total cost of raw materials Yjit is total revenue and εjit is the unanticipated productivity shock obtained as a residual in the estimation of the production function (see equation 2)
The interpretation of firm-level markups estimated through this production approach must be made with some caution First because markup is recovered through TFPR (and not TFPQ) the estimated result conflates market power itself with differences in product quality and other factors affecting the demand for the product78 Secondmdashand this applies to any methodological procedure not only the production approachmdashmarkup cannot be taken as an absolute value and should not be used to compare different markets since markups will be naturally higher in markets where a large proportion of costs are fixed In this regard it is safer to use markup estimates to illustrate comparisons across firms within markets for instance to shed light on the correlation with other firm characteristics (such as productivity ownership size and location)9 Last but not least it is important to stress that rising markups do not necessarily imply a decline in competition It can reflect vertical differentiation strategies (such as quality upgrading or advertising) or even the implementation of more efficient production processes (or the introduction of innovative products) for which rising markups enable firms to recoup growing fixed costs or to reward high-risk activities such as investment in RampD In this context an in-depth competition assessment would be needed not only to better understand the intrinsic market features (including supply-side and buyer characteristics) but also to identify and assess the potential anticompetitive effects of government intervention in markets
7 To mitigate this conflation risk the analysis tries to some extent to disentangle the sources of markup differences within a sectormdashthat is whether they are derived from higher prices or lower marginal costs (reflected by higher productivity) This is possible because the procedure adopted generates estimates of both TFPR and markup See the results in table A16 in annex 1 8 In a recent article Bond et al (2020) argue that in the absence of information on output quantities to estimate TFPQ as is typically the case (including in the current analysis) it is not possible to obtain consistent estimates of output elasticities when firms have market power and markups are heterogeneous This issue casts doubt over interpretation of markup values especially trends However the production approach for estimating markups is still valid if results are used to assess differences in average markups across different groups of firms (different characteristics) provided one is willing to assume that these groups of firms share the same production function parameters 9 See footnote 8
8
3 DATA SET
The assessment of corporate market power in Romania draws on firm-level data from the Structural Business Survey (SBS) for the period 2008ndash17 The SBS data setmdashprovided by the National Institute of Statistics of Romaniamdashencompasses complete financial information at the headquarters level for the 2008ndash17 period for the surveyed firms This survey is exhaustive for firms with at least 20 employees and provides a representative sample for firms with fewer than 20 employees As such the data set has two strata one completely enumerated covering a census of all enterprises with at least 20 employees and the second a random stratum covering some smaller firms On the basis of this sample design an unbalanced panel is constructed by considering all listed firms (of both strata) for all years In this way the panel allows entry and exit and does not impose any firm size threshold
Firm-level information from SBS is classified at NACE 4-digit level which is considered a proxy for the product market where a firm operates SBS-sampled activities include all sectors except agriculture and banking Therefore the analysis focuses on mining services and manufacturing activities In addition the SBS data assign one NACE 4-digit sector classification for each firm where the firmrsquos main product is classified As such all firms within a NACE 4-digit sector classification are considered to be in one product market In the current analysis the product market definition deliberately does not coincide with the classical definition of ldquorelevant marketrdquo10 which normally considers the degree of product substitution geographic location of both producers and consumers transportation costs and so on11
The SBS data contain all the variables needed to estimate the production function that underlies markup computation The variables needed to estimate TFPR and markups following the production approachmdashas described in the previous section and expressed in equation (1)mdashare firmsrsquo annual total revenue from operations12 total expenditure in intermediate materials capital stock (sum of tangible and intangible assets) and total number of hours worked per year
After deflating nominal accounting data and controlling for outliers the final data set contains 405641 firm-year markup observations for 167756 firms over the 2008ndash17 period All accounting information from the SBS was deflated using the country-level GDP deflator (from World Development Indicators and Eurostat) to express values in Romanian lei for 2000 Once nominal values were deflated additional steps were taken to control for outlier observations in particular observations on revenue employment capital (tangible assets) and costs of raw materials with a value of zero or lower than zero were excluded from the estimation This procedure generated a final (unbalanced panel) data set with 405641 firm-
10 For market power assessment purposes a relevant market is defined by the set of products and geographical areas that exercise competitive constraints on each other (see Motta 2004 for further discussion) 11 In principle this assumptionmdashthat firms under one 4-digit sector classification belong to the same marketmdashcould imply some bias in the case of multiproduct firms that sell goods that are not close substitutes However this bias can be mitigated by using NACE 4-digit sectoral disaggregation In addition in the absence of firm-level information for multiple products it is assumed that the firm-level markup is a weighted average markup across different products within the firm 12 The data set does not contain information on physical quantity produced by each firm Deflated sales are used as a measure of physical quantity to estimate output elasticities and then to recover markups De Loecker and Warzynski (2012) show that using this approach to recover markups potentially affects the level of estimated markup but not the temporal changes in the markup
9
year observations (see table 1) which was then used to estimate markup The final data set contains firm-year markup observations for 167756 firms over 2008ndash17 Table 2 displays the summary statistics for all variables used to compute TFPR and markup for these firms13
13 The original number of firms in the SBS is 484604 405641 firms were considered after removing outliers in markup and TFPR This note defines outliers as those observations with a value greater than Q3+3IQR or lower than Q1minus3IQR where Q1 and Q3 are the first and third quartiles and IQR is the interquartile range
10
Table 1 Final sample of firm-year observations Year Manufacturing Services Mining Total 2008 15056 31346 320 46722 2009 14038 31598 318 45954 2010 12997 29759 317 43073 2011 9492 25942 239 35673 2012 10151 26983 245 37379 2013 9806 29460 229 39495 2014 10381 29872 253 40506 2015 10286 28844 260 39390 2016 10199 28449 249 38897 2017 10018 28280 254 38552 Total 112424 290533 2684 405641
Source World Bank staff calculations based on SBS data set Note Total number of observations by year and sector with production function variables
Table 2 Summary statistics Year Revenue (ln) Employment (ln) Intermediate materials (ln) Capital stock (ln)
Mean SD Mean SD Mean SD Mean SD 2008 1473 229 289 136 1207 267 1168 271 2009 1470 220 282 132 1187 262 1182 269 2010 1470 228 276 135 1202 268 1184 268 2011 1533 200 306 133 1252 260 1228 258 2012 1523 208 304 132 1253 261 1222 259 2013 1503 212 292 133 1232 264 1209 263 2014 1507 213 294 132 1237 262 1204 264 2015 1532 198 307 128 1255 255 1211 264 2016 1540 191 311 126 1244 263 1214 263 2017 1546 189 313 125 1241 270 1220 262 Total 1508 212 297 132 1229 264 1203 265
Source World Bank staff calculations based on SBS data set Note SD = standard deviation
11
4 RESULTS
41 HAS CORPORATE MARKET POWER INCREASED AT THE AGGREGATE LEVEL HOW DO AGGREGATE TRENDS DIFFER ACROSS SECTORS IS THERE A GROUP OF FIRMS DRIVING THE OVERALL TREND
Results show that the average markup in Romania increased by around 15 percent during 2008ndash17 However this expansion was marked by an uneven trend Figure 1 panel a displays the evolution of the (sales-weighted) aggregate markup for the 2008ndash17 period for the whole economy (aggregating manufacturing services and mining) At aggregate level average markups experienced a 15 percent aggregate increase from 2008 to 2017 However three alternating trends are detected in this whole period a sharp increase of more than 15 percent during 2008ndash09 a strong decline after 2009 when markups fell by 23 percent from 2009 to 2012 and a consistent increase of 215 percent from 2012 to 2017
Figure 1 Evolution of (sales‐weighted) average markup by sector 2008ndash17 a All sectors b Manufacturing
c Services d Mining
Source World Bank staff calculations based on SBS data set
Because aggregate numbers mask a lot of heterogeneity it is not surprising to see
92
94
96
98
11
02M
ark-
up in
dex
(200
8 =
1)
2008 2009 2010 2011 2012 2013 2014 2015 2016 2017Year
Manufacturing
11
11
21
31
4M
ark-
up in
dex
(200
8 =
1)
2008 2009 2010 2011 2012 2013 2014 2015 2016 2017Year
Services
51
15
22
5M
ark-
up in
dex
(200
8 =
1)
2008 2009 2010 2011 2012 2013 2014 2015 2016 2017Year
Mining
12
different trends when unraveling markups across sectors Because of their intrinsic characteristics firms are different from each other and contrast in terms of performance even within very narrowly defined sectors (Syverson 2004) These differences could persist either because of supply-side factors such as management skills RampD or investment patterns (Bartelsman and Doms 2000) or because of demand-side factors related to product differentiation customer-producer relationships geographical segmentation among others That said firms across high-level sectorsmdashmanufacturing services and miningmdashhave shown varied performance While the manufacturing (sales-weighted) average markup experienced a decline of minus57 percent over the 2008ndash17 period (figure 1 panel b) there was an opposite and much more rapid trend in services with an aggregate change of 422 percent (see figure 1 panel c) Weighted average markup in mining experienced an uneven trend throughout the same period Nuances are unveiled even within sectors as aggregate markup performance shows different patterns when breaking manufacturing down into groups of sectors according to their technology intensity14 This is also observed when services are broken down into groups of sectors according to their knowledge intensity15 (see figure A11 and figure A12 in annex 1)
Further there is also evidence of changes in the markup firm distribution from 2008 to 2017 revealing an increasing proportion of firms with relatively high markups Figure 2 displays the firm-level distribution of markups in 2008 and 2017 Some changes are noteworthy First both the mean and variance increased over that period But more importantly the upper tail of the distribution became fatter over time suggesting that in 2017 more firms have higher markups than in 2008 This suggests that the rise in average markups is associated with large increases among the firms with the highest markups
14 As per Eurostat classification manufacturing sectors are classified as high-technology medium-high-technology medium-low-technology and low-technology according to technological intensity (RampD expenditure or value added) and based on the statistical classification of economic activities in the European Community (NACE) at the 2-digit level See table A11 in annex 1 with sector aggregation 15 As per Eurostat classification service sectors are classified as knowledge-intensive services (KIS) and less-knowledge-intensive services (LKIS) KISs comprise knowledge-intensive market services high-tech knowledge-intensive services knowledge-intensive financial services and other knowledge-intensive services LKIS comprise less-knowledge-intensive market services and other less-knowledge-intensive services Both KIS and LKIS are based on the share of tertiary educated persons at the NACE 2-digit level See table A12 in annex 1 with sector aggregation
13
Figure 2 Distribution of firm-level markups all sectors 2008 and 2017
Source World Bank staff calculations based on SBS data set
In fact data show that the rise in average markup has been driven by the ability of a small group of firmsmdashthe top decile firmsmdashto increase their markups over time especially after 2014 Figure 3 panel a shows that markup growth has been progressively uneven across firms with firms in the top decile of the markup distribution increasing their average markup faster than the rest of firms Firms in the 90th percentile increased their (sales-weighted) average markup by 285 percent from 2008 to 2017 while the rest of firmsmdashthose below the top decilemdashexperienced a completely opposite trend their weighted markup contracted by 83 percent over the same period This shows that the increase in the weighted average markupmdashof around 15 percent as shown in figure 3 panel amdashcomes mainly from the group of firms in the top decile of the markup distribution The divergence between the top decile and the rest of firms remains even when results are broken down by sectors it is more pronounced in manufacturing despite some volatility (figure 3 panel b) while in services this happens only after 2014 (panel c) The mining sector experienced the opposite trend (panel d) as most of the time (until 2016) the top decile group of the markup distribution reported lower markup growth than the rest of the firms in the data set
02
46
kden
sity
lnmu
-2 0 2 4 6 8Mark-up (ln)
2008 2017
14
Figure 3 Evolution of (sales-weighted) average markup by sector and by top decile and firm groups (top decile firms versus the rest) 2008ndash17
a All sectors b Manufacturing
c Services d Mining
Source World Bank staff calculations based on SBS data set
Overall these results suggest that any analysis about markup performance in Romania should pay attention to a small group of firms the top decile of firms based on markup distribution These firms have been accounting for increasing shares of value added and employment in the economy Figure 4 shows that the share of value added in the whole economy (including manufacturing services and mining sectors) as accounted for by the firms in the top decile of the markup distribution has been increasing jumping from less than 13 percent in 2008 to 231 percent in 2017 The same applies to employment the sample of the top decile of firms accounts for an increasing share of employment generated in the economy across the 2008ndash17 period (figure 5)
91
11
12
13
Mar
k-up
inde
x (2
008=
1)
2008 2009 2010 2011 2012 2013 2014 2015 2016 2017Year
Average (wgtd)perc 90 (wgtd)Rest of firms (below perc 90) (wgtd)
All firms
15
Figure 4 Share of total value added accounted for by the top decile firms 2008ndash17
Figure 5 Share of employment accounted for by the top decile firms 2008ndash17
Source World Bank staff calculations based on SBS data set
Source World Bank staff calculations based on SBS data set
These top decile firms are also typically smaller less productive and less likely to invest in intangible assets than the rest of the firms As highlighted in the methodological section of this paper the increase of markups cannot be unequivocally interpreted as a decline in competition in a given market it can reflect firmsrsquo efficiency gains or adoption of quality-upgrading strategies To explore this aspect a simple econometric analysis was applied to capture performance differences between the group of firms that is leading the markup increase (the top decile firms) and the rest of the firms based on the markup distribution The following specification was adopted
119862119862ℎ119886119886119886119886119886119886119886119886119886119886119886119886119886119886119886119886119904119904119886119886119886119886119886119886119888119888119895119895119894119894119895119895 = 1205751205750 + 1205751205751119879119879119879119879119879119879_119889119889119886119886119886119886119886119886119889119889119886119886119894119894119895119895 + η119895119895 + ρ119895119895 + γ119888119888 + 120583120583119888119888119895119895119894119894119895119895 (8)
where the dependent variable reflects different firm characteristics (of firm i that operates in sector j county c at year t) to be compared Three dependent variables are tested size (measured in terms of the number of full-time employees) productivity (measured as TFPR discounted for markup16) and intangible assets (measured as a dummy that takes the value of 1 for firms having a positive value of intangible fixed assets17) The key explanatory variable is 119879119879119879119879119879119879_119889119889119886119886119886119886119886119886119889119889119886119886119894119894119895119895 a dummy that takes the value of one firm if i is among the top decile of the markup distribution in year tmdashwhile ηt ρj and γc are respectively time NACE 4-digit sector and county fixed effects The parameters of equation (8) are estimated by OLS (or Probit regression maximum likelihood when the dependent variable is the intangible assets dummy) always using heteroscedasticity-robust standard errors Results displayed in table 3 columns 1 and 2 suggest that firms in the 90th percentile of the markup distribution are on average 468
16 TFPR discounted for markup is computed as TFPR-markup In this regard it is not a perfect measure of the true technical efficiency but just a proxy of productivity that accounts for market share and the effect of materials elasticity while other factors such as the effect of product quality or innovation are not considered 17 Value of intangible assets in the SBS data set is defined as value built on (a) RampD expenditure and (b) franchise patents and other similar rights and values
1015
2025
Perc
enta
ge
2008 2009 2010 2011 2012 2013 2014 2015 2016 2017Year
1012
1416
18Pe
rcen
tage
2008 2009 2010 2011 2012 2013 2014 2015 2016 2017Year
16
percent18 smaller and 91 percent 19 less productive than the rest of the firms even within narrowly defined sectors (at NACE 4-digit level) Results in column 3 captures the differences between these two groups of firms in terms of their willingness to invest in intangible assetsmdashtheir ldquoknowledge capacityrdquomdasha key determinant of firmsrsquo expansion in the long term Results suggest that the sample of top decile firms are almost 33 percent less likely to invest in intangible fixed assets than the remaining firms even within NACE 4-digit sectors20 All these correlations are statistically significant at the 1 percent confidence level
Table 3 Characteristics of top decile firms Conditional correlations between markups and firm characteristics (OLS and Probit results)
(Estimation method) Dependent variable (1)
(OLS) Employment
(ln)
(2) (OLS)
TFPR discounted for markup (ln)
(3) (Probit)
Investment in intangibles
(yesno) Top _decile minus0632 minus2422 minus0386 NACE 4-digit sector fixed effects
Yes Yes Yes
County fixed effects Yes Yes Yes Year fixed effects Yes Yes Yes R2 (pseudo R2)a 0238 0728 0078 Observations 484604 403561 484594
Source World Bank staff calculations based on SBS data set Note All firm-year observations (for the 2008ndash17 period) are pooled together and NACE 4-digit sector and year fixed effects are included OLS = ordinary least squares TFPR = revenue-based total factor productivity a It is worth highlighting that R2 value does not influence the consistency of the estimators of each population parameter which is the objective of the current analysis See for instance Cameron and Trivedi (2010) for a theoretical discussion on this matter Moreover since the analysis draws on a large sample the standard errors of the coefficient estimators are not affected because of the law of large numbers The key issue would be the lack of correlation of omitted variables and the explanatory variables However given that the main (theoretical) determinants of the markup performance are included the omitted variables can be understood to be random Statistically significant at 1 percent
In addition the group of 10 top decile firms in the markup distribution operate mainly in the services sector and are overrepresented in less-knowledge-intensive services sectors with some exceptions Table 4 displays the distribution of top decile firms across NACE 2-digit sectors in 2017 To control for the fact that some sectors might be overrepresented (given the SBS survey sampling) the table shows only those sectors for which the probability of a firm being in the top decile is larger than the sectorrsquos frequency ratio Results show that firms in the 90th percentile of markup distribution are overrepresented in wholesale trade and retail trade sectors the probability of a top decile firm being in these two sectorsmdashclassified as less-knowledge-intensive services according to the Eurostat definition
18 This value results from the following expression 100[exp(beta)minus1] where beta equals estimated top 90 percent dummy coefficients in an OLS regression where size is the dependent variable controlling for 4-digit and county fixed effects (table 3 column 1) 19 This value results from the following expression 100[exp(beta)minus1] where beta equals estimated top 90 percent dummy coefficients in an OLS regression where TFPR is the dependent variable controlling for 4-digit and county fixed effects (table 3 column 2) 20 The odds-ratio is computed as the relative difference between the marginal effects for each category (that is 42 percent for the top decile firms and 56 percent for firms below the 90th percentile) Specifically it is computed as follows (56 percent minus 42 percent)(42 percent)
17
(see table A12 in annex 1)mdashis almost 40 percent21 It is worth highlighting however that these top decile firms also operate in some knowledge-intensive services sectors though the probability is much smaller 387 percent for computer programming and 268 percent for security and investigating activities22
When taken together these results suggest that the small group of firms leading the overall increase in markups in Romania does not seem to follow the typical superstar firmsrsquo profile As discussed by Van Reenen (2018) and Autor et al (2017) superstar firmsmdashtypically with higher markups larger and more productive ndash would be rewarded with larger market shares due to their innovative nature This hypothesis does not seem to be supported by data in Romania As results showed the group of firms who are driving the aggregate rise in markupsmdashthe top decile firms of the markup distributionmdashare typically smaller less productive less likely to invest in intangible assets and are mostly active in services sectors where use and diffusion of knowledge is less important This may suggest that the increase in markups in Romania might reflect a less competition-intensive environment rather than changes in the nature of competition where superstar firms would be rewarded with greater market share because they are more efficient and innovative
Table 4 Probability of a top decile firm (in the markup distribution) being in the following sectors
2-digit sector Probability Wholesale trade 2436 Retail trade 1477 Computer programming 387 Manufacturing of wearing apparel 321 Real estate activities 314 Security and investigation activities 268
Source World Bank staff calculations based on SBS data set Note The table shows only sectors for which the probability of a firm being in the top decile of markup distribution is higher than the sectorrsquos overall frequency ratio
42 HOW HAVE FIRM DYNAMICS INFLUENCED AGGREGATE MARKUP PERFORMANCE ARE THERE SIGNS OF MARKET POWER CONSOLIDATION AMONG INCUMBENT FIRMS
To indirectly assess whether the rise in markups is associated with weakening competition the analysis decomposes the evolution of aggregate markups into that of incumbents and of net entry of firms To do so the Melitz and Polanec (2015) decomposition technique is applied to the aggregate markup changes between 2008 and 2017 This approach follows two steps First the aggregate (ln) markup (μ) at year t is defined as
21 Under the NACE 2-digit wholesale trade sector the group of top decile firms are overrepresented in the following NACE 4-digit sectors sector 4690ndashNon-specialized wholesale trade sector 4673ndashWholesale of wood construction materials and sanitary equipment sector 4621ndashWholesale of grain unmanufactured tobacco seeds and animal feeds sector 4646ndashWholesale of pharmaceutical goods sector 4675ndashWholesale of chemical products and sector 4631ndashWholesale of fruit and vegetables Under the NACE 2-digit retail services sector the sample of top decile firms are overrepresented in the following NACE 4-digit sectors sector 4711ndashRetail sale in non-specialized stores with food beverages or tobacco predominating and sector 4730mdashRetail sale of automotive fuel in specialized stores 22 The same analysis is applied for ownership structure again controlling for overrepresentation Results show that the sample of top decile firms are overrepresented in the fully foreign-owned ownership category
18
120583120583119895119895119895119895 = sum sum 119904119904119895119895119894119894119895119895119894119894isinΩ119895119895 120583120583119895119895119894119894119895119895119894119894isin119896119896119895119895 (9)
where sjit is firm irsquos market share at moment t where the market share is defined in terms of firm irsquos revenue weight over the total revenue of sector j (kj) where sector j is the sector to which firm i belongs Then the change of (ln) markup between moments t and tminus1 is decomposed as
Δ120583120583119895119895119895119895 = Δ120583119878119878119895119895119895119895 + Δ119862119862119879119879119907119907119878119878120583120583119878119878119895119895119894119894119895119895 119904119904119878119878119895119895119894119894119895119895 + 119904119904119864119864119895119895119895119895120583120583119864119864119895119895119895119895 minus 120583120583119878119878119895119895119895119895 + 119904119904119883119883119895119895119895119895120583120583119878119878119895119895119895119895 minus 120583120583119883119883119895119895119895119895 (10)
where the subindex S refers to survivor firms (that is those operating in both years t and tminus1 the subindex X denotes firms exiting the market or those firms present in moment tminus1 but not in moment t and E denotes entrants or those firms operating in moment t but not in moment tminus1 Each component expressed in equation (10) represents different drivers to explain aggregate change in markup over the period The first term is the change of the
unweighted average ln markup of survivors or the ldquowithinrdquo component Likewise is the change in the covariance between ln markup and market share for
survivors only This is the ldquobetweenrdquo component and it measures the reallocation of resources among surviving firms The term is the ldquoentryrdquo component and it measures
the difference of the aggregate ln markup of entrants and that of survivors at moment t weighted by the share of entrants over the total population of firms ( ) The entry component will be
positive if the aggregate markup of those firms entering the market is larger than the aggregate markup of the survivors Finally is the exit component which measures the
difference between the aggregate ln markup of survivors and exiting firms at moment tminus1 likewise weighted by the proportion of firms exiting the market that is This term is
positive if the aggregate ln markup of the exiting firms is lower than the aggregate ln markup of survivors In other words and as displayed in equation (10) aggregate markup can growshrink because (a) incumbent firms have increaseddecreased their markups (the ldquowithinrdquo component) (b) incumbent firms with high markups have gainedlost market share (the ldquobetweenrdquo component) and (c) entrant firms have higherlower markups than exiting firms (the ldquoentryrdquo or ldquoexitrdquo component)23
Results show that the increase in aggregate markups has been driven mostly by incumbents rather than entrants and exiting firms Decomposition results for the full sample of firms are displayed in figure 6 Estimations suggest that a large proportion of the aggregate increase in markup in Romania was driven by increases within incumbent firms (the ldquowithinrdquo bar) And among incumbents results show that the rise in markups reflects mostly a markup increase within firms rather than a reallocation of market share away from low-markup to high-markup companies (the ldquobetweenrdquo bar) Meanwhile the entry of new firms with lower markups pulled the change in aggregate markups down (the ldquoentryrdquo bar) and contribution from
23 SBS tends to underestimate entry and exit (populational) figures as a result of its sampling design In this regard the proposed analysis captures entry and exit in the enumerated stratum (above 20 employees) so results will be representative at least for the population of firms in the enumerated stratum
19
exiting firms was negligible
20
Figure 6 Decomposition of percentage change of (sales-weighted) average markup 2008ndash17
Source World Bank staff calculations based on SBS data set
This result could be interpreted as a sign of consolidation of market power among existing firms enabled by remaining product market regulations that restrict competition despite previous reforms Several policy-related factors can explain this result among them government interventions and regulations that restrict competition by reinforcing dominance or limiting entry facilitating collusive outcomes or increasing the cost to compete in markets and discriminating and protecting vested interests24 In this regard Pop and Ore Monago (2020) provide illustrative examples about the presence of regulations that still restrict competition in Romania drawing from the OECDndashWorld Bank Group (WBG) product market regulation (PMR) indicators data set which provides information across 70 countries25 The assessment uses the latest PMR round for Romania from 2013 and includes Romaniarsquos performance projected on the basis of information updated in 2017 Results suggest that the regulatory framework as it is in the books in Romania is less restrictive than that of countries such as Poland and the total sample average but it is more restrictive than that of the OECD and EU-15 countries However from an economywide perspective the overall restrictiveness of regulations in Romania is mainly associated with the state control of the economy and several remaining barriers to entry and rivalry (see figure 7)
24 In principle greater competition outcomes are enabled through an effective competition policy framework which involves three key pillars (a) fostering pro-competition regulations and government interventions (b) promoting competitive neutrality and non-distortive public aid and (c) enabling effective competition law and antitrust enforcement 25 The current PMR database used for this study includes Argentina Australia Austria Belgium Bolivia Brazil Bulgaria Canada Chile China Colombia Costa Rica Croatia Cyprus the Czech Republic Denmark the Dominican Republic Ecuador Arab Republic of Egypt El Salvador Estonia Finland France Germany Greece Guatemala Honduras Hungary Iceland India Indonesia Ireland Israel Italy Jamaica Japan Kenya the Republic of Korea Kuwait Latvia Lithuania Luxembourg Malta Mexico the Netherlands New Zealand Nicaragua Norway Panama Paraguay Peru the Philippines Poland Portugal Romania the Russian Federation Rwanda Senegal the Slovak Republic Slovenia South Africa Spain Sweden Switzerland Turkey Tunisia Ukraine Uruguay the United Kingdom and the United States
21
Figure 7 Product market regulation in Romania and comparator countries
Source Pop and Ore Monago 2020 Note The top five performers in the overall PMR indicator are the Netherlands United Kingdom Austria Denmark and New Zealand Figure shows 2013 information unless otherwise indicated PMR = product market regulation
Barriers to entry and rivalry still affect some service sectors In fact there are examples of regulations that hamper competition in retail trade which concentrates a substantial proportion of high-markup firms in the Romanian economy as seen previously Drawing from the OECD-WBG PMR data set Pop and Ore Monago (2020) show that although regulations in the retail trade sector are less restrictive than in the EU-15 and OECD there is still room for improvement to make the retail trade market more efficient The authors show that licenses and permit requirements may still be imposing an unnecessary burden on entry and increasing the costs to compete in the sector Companies operating in retail sectors in Romania are subject to requirements that go beyond the general conditions formalities and procedures applicable to any company For instance in Romaniarsquos clothing industry licenses and permits are always required compared with 57 percent of OECD countries and 60 percent of EU-15 countries which do not have such a requirement26 In addition Romania has regulations that impose restrictions on entry or expansion of business activities and constrain strategic options to compete in retail markets For instance most of the PMR countries and all top five performers do not restrict firms from selling below cost (beyond a prohibition of predatory pricing) and restrictions on sales promotions are not a common practice either27 In Romania sales below cost are prohibited or restricted beyond a prohibition of predatory pricing Likewise sales promotions are restricted to a particular time of the year28
43 DO FIRM MARKUPS DIFFER ACROSS FIRMS WITH DIFFERENT ATTRIBUTES
To answer this question the analysis explores how markup performance differs across different types of firms To assess the heterogeneity in markups the analysis relates markups to firm-level characteristics such as size age ownership status RampD status and location
26 In this case the least restrictive countries such as Bulgaria Latvia and Sweden do not have such requirements 27 Among the Central and Eastern Europe comparator countries only the Czech Republic and the Slovak Republic apply restrictions on discounted sales pricing while only Poland applies constraints to sales promotions 28 Government Ordinance no 992000 prohibits sales below costs and provides for the conditions and periods when certain types of promotions can take occur
5156 51 52 47 49 53
62 55
3830 42 40 43 39
4333 41
1114
6 9 10 125 5 4
113129 133 134 141 148 156
165 169
0
05
1
15
2
25
3
0
05
1
15
2
25
3
Top 5 -PMR SlovakRepublic
Hungary EU-15average
CzechRepublic
OECDaverage
2013
Romaniasim 2017
Poland Romania
State control (SC) Barriers to entry and rivalry (BER) Barriers to trade and investment (BTI)
Avg of all countries = 190
22
within narrowly defined product markets proxied by NACE 4-digit sectors The following regression is estimated
120583120583119888119888119895119895119894119894119895119895 = 1205751205750 + sum 12057512057511198961198961198791198791199001199001198991198991198961198961198881198881198951198951198941198941198951198957119896119896=2 + sum 1205751205752119903119903119904119904119886119886119904119904119886119886119903119903119888119888119895119895119894119894119895119895
3119903119903=2 + sum 1205751205752119902119902119886119886119886119886119886119886119902119902119888119888119895119895119894119894119895119895
3119902119902=2 + 1205751205753119889119889119888119888119895119895119894119894119895119895
119864119864119864119864119864119864 +1205751205754119889119889119888119888119895119895119894119894119895119895119877119877119877119877119889119889 + 1205751205755119896119896119888119888119895119895119894119894119895119895 + 120578120578119895119895 + 120588120588119895119895 + 120574120574119888119888 + 119906119906119888119888119895119895119894119894119895119895 (11)
where ownkcjit with k = 23hellip7 comprises a set of dummies defining the type of ownership of the firm Romanian private (omitted category) majority state-owned state-private ownership Romanian private and foreign fully foreign-owned public of national and local interest and other (cooperatives and craft organizations)29 The term sizercjit is a set of three dummies controlling for firmsrsquo sizemdashsmall or fewer than 50 employees (omitted category) medium or 51ndash250 employees and large more than 250 employees The term agercjit is a set of three age dummiesmdashyoung or less than 5 years old mature or 6ndash15 years old and older than 15 years Two dichotomous variables are also defined to capture export and RampD profiles dExp and dRnd which take a value of 1 if a firmrsquos direct exports represent more than 10 percent of a firmrsquos total revenue and if a firmrsquos RampD represents more than 1 percent of a firmrsquos total revenue respectively In addition kcjit is firmsrsquo total capital stock value (sum of tangible and intangible assets)30 Finally ηt ρj and γc are respectively time NACE 4-digit sector and county fixed effects Equation (11) is estimated separately for each 1-digit sector (that is manufacturing services and mining) and for the whole economy while the equation parameters are estimated by OLS always using heteroscedasticity-robust standard errors The complete set of results is displayed in table A15 in annex 1
Results show that ownership structure matters to explain markup differences across firms State-controlled companies tend to exert the highest markup premiums in the overall economy and especially in the manufacturing sector Table 5 displays the estimated coefficients of ownership categories multiplied by 100 Except for the mining sector most of estimated coefficients are statistically significant which suggests that ownership structure makes a difference to explain markup performance even for firms operating in the same product market (here proxied by NACE 4-digit sector) county location and year and with similar characteristics in terms of size age and export and RampD profile
In particular firms in which the state has majority or minority ownership demonstrate higher markups when compared with domestic privately owned companies (see table 5 column 4) The average difference in markup is higher for companies with minority state ownership (289 percent) than for fully state-owned companies (200 percent) In manufacturing markups of fully state-owned firms are the highest on average at 527 percent when compared with the reference category (domestic privately owned firms) Results in services are mixed with both private and state ownership extracting high premiums private firms with mixed domestic-foreign ownership show the highest average difference (279 percent) closely followed by minority state-owned companies for which the markup premium
29 More details about the original ownership classification in SBS and the aggregation used for the analysis can be found in table A13 and table A14 in annex 1 30 The variable lnTFPRkit is included as an additional control to test the robustness of the analysis See results in table A16 in annex 1
23
is 275 percent compared with the reference category 31 All results are robust to the inclusion of productivity as an additional control variable (see results in table A16 in annex 1)32
Table 5 Average markup differences by ownership structure relative to domestic privately owned firms
(1) Manufacturing
()
(2) Services
()
(3) Mining
()
(4) All sectors
() Majority state-owned 527 139 772 200 State-private ownership 352 275 ns 289 Domestic private + foreign 161 279 ns 229 Fully foreign-owned 105 263 ns 201 Public of national and local interest
209 149 ns 214
Source World Bank staff calculations based on SBS data set Note Numbers reflect estimated coefficients (multiplied by 100) for ownership dummy categoriesmdashrelative to Romanian private firms the omitted categorymdashin a fixed-effect regression model controlling for firm covariates plus year and NACE 4-digit sector fixed effects as displayed in equation (11) More details about the original ownership classification in SBS and aggregation used for the analysis can be found in table A13 and table A14 in annex 1 See table A15 in annex 1 for the complete set of results ns = not statistically significant
Larger firms and older companies wield higher markups when compared with their counterparts implying that firm size and age are relevant characteristics that influence markup differences As shown in figure 8 old companies (older than 15 years) display higher average markups than young ones (1ndash5 years old) even when they share similar attributes (in terms of ownership structure size and export and RampD profiles) and operate in the same NACE 4-digit sector county and year The estimated average markup premium for old companies (relative to young ones) is 54 percent for the whole economy It varies depending on how data are clustered across large sectors 79 percent in manufacturing 48 percent in services and 228 percent in mining Higher markup premiums for older companies can be interpreted in two ways it can reflect that more experienced firms are able to transpose learning returnsmdashwhich could positively affect their productivity or reduce their marginal costsmdashinto higher markups or that older firms are able to lobby better and create barriers to entry making it more difficult for younger firms to exert competitive pressure Firm size also matters to explain markup performance large companies (with more than 250 full-time employees) tend to display higher markups compared with small companies even when they operate in the same product market and share similar characteristics On average for the whole economy the
31 Results for the category ldquootherrdquo are not shown in table 5 As detailed in table A13 in annex 1 this ldquootherrdquo category refers to SBS ownership answer-codes 40 and 50 respectively ldquocooperativerdquo and ldquopublic of national and local interestrdquo The reason the corresponding results were not highlighted in the main text are twofold First the above-mentioned category accounts for only 006 percent of total companies in the sample Second an in-depth analysis would be needed to understand whether this ldquootherrdquo category reflects potential noise in the way firms self-classify their ownership structures or the way firms report cost expenditures (mainly) or whether this was influenced by SBS sampling design 32 Because the production approach applied in the current analysis delivers both markup and productivity estimates it is possible to further decompose the markup differences across firm characteristics and to verify whether after controlling for differences in marginal costs (that is productivity) certain groups of firms still have higher markups This is precisely one of the mitigating methods employed to reduce the conflation risk as highlighted before Results in table A16 in annex 1 should be interpreted as follows once productivity level is included in the equation differences in marginal cost are accounted for so the coefficient on ldquomajority state-ownedrdquo for instance captures the variation in average prices between majority state-owned and the size reference category (domestic privately owned firms)
24
markup premium for large companies is 122 percent higher than that of small firms (figure 9) Both size and age effects are still present even after controlling for productivity differences (see table A16 in annex 1)33
Figure 8 Average markup differences relative to young firms by age category
Figure 9 Average markup differences relative to small firms by size category
Source World Bank staff calculations based on SBS data set Note Numbers reflect estimated coefficients (multiplied by 100) for age dummy categoriesmdashrelative to young firms (1ndash5 years old) the omitted categorymdashin a fixed-effect regression model controlling for firm covariates plus year county and NACE 4-digit sector fixed effects as displayed in equation (11) All bars reflect statistically significant results See table A15 in annex 1 for the complete set of results
Source World Bank staff calculations based on SBS data set Note Numbers reflect estimated coefficients (multiplied by 100) for size dummy categoriesmdashrelative to small firms (1ndash50 employees) the omitted categorymdashin a fixed-effect regression model controlling for firm covariates plus year county and NACE 4-digit sector fixed effects as displayed in equation (11) All bars reflect statistically significant results See table A15 in annex 1 for the complete set of results
By the same token export intensity also influences markup performance with firms that export earning higher markups Being an exporter is a relevant firm feature to be analyzed when it comes to understanding markup performance Recent models of international trade predict that exporting firms earn higher markups than non-exporting firms either because they are relatively more productive and can thus undercut their rivals (see Melitz and Ottaviano 2008) or because they produce higher-quality goods and rely on higher-quality inputs which allow them to charge higher prices (see Hallak and Sivadasan 2009) In this regard the results summarized in figure 10 are consistent with the literature and suggest that exporting firmsmdashdefined as those whose direct exports represent more than 10 percent of total revenuemdashearn higher markups than non-exporting firms that operate in the same product market (NACE 4-digit sector) the difference ranges from 12 percent to 416 percent depending on how data are clustered across large sectors (manufacturing services and mining)
33 See footnote 32 on how to interpret results in table A16 in annex 1 (after including productivity as an additional control)
22
-160
158
7948
228
54
-505
101520253035
d
iffer
ence
Mature (between 6 and 15 years old)
Old (older than 15)
23
-830
090
327
169122
-15-55
152535
d
iffer
ence
Medium (between 51 and 250)
Large (more than 250 employees)
25
Figure 10 Average markup differences relative to non-exporters by export status
Figure 11 Average markup differences relative to non-RampD performers by RampD status
Source World Bank staff calculations based on SBS data set Note Numbers reflect estimated coefficients (multiplied by 100) for RampD dummy categorymdashrelative to non-RampD performer firms the omitted categorymdashin a fixed-effect regression model controlling for firm covariates plus year county and NACE 4-digit sector fixed effects as displayed in equation (11) All bars reflect statistically significant results See table A15 in annex 1 for the complete set of results
Source World Bank staff calculations based on SBS data set Note Numbers reflect estimated coefficients (multiplied by 100) for export dummy categorymdashrelative to non-exporters the omitted categorymdashin a fixed-effect regression model controlling for firm covariates plus year county and NACE 4-digit sector fixed effects as displayed in equation (11) All bars reflect statistically significant results See table A15 in annex 1 for the complete set of results
Performing RampD activities is positively correlated with markup differences while location proxied by county also matters to explain markup performance Results displayed in figure 11 show that RampD performersmdashidentified by those firms whose RampD expenses surpass more than 1 percent of their total revenuemdashtend to earn higher markups than non-RampD performers The markup premium for RampD performers is always positive suggesting that this group of firms is able to recoup fixed costs associated with RampD activities The magnitude of the premium varies from 16 percent to 46 percent depending how data are clustered across large sectors (manufacturing services and mining) In addition results displayed in figure 12 show that firms in the same product market (at NACE 4-digit level) and with similar characteristics (in terms of ownership age size and export and RampD profiles) charge different markups depending on the county in which they operate Except for Dolj firms in all other counties demonstrate lower average markups than Bucharest the negative markup premium in relation to Bucharest varies from minus154 percent (Vrancea) to minus36 percent (Satu-Mare)
12
258
416
119
05
101520253035404550
d
iffer
ence
160
340
460
273
05
101520253035404550
d
iffer
ence
26
Figure 12 Average markup differences by county relative to Bucharest
Source World Bank staff calculations based on SBS data set Note Numbers reflect estimated coefficients (multiplied by 100) for county fixed effectsmdashrelative to Bucharest the omitted categorymdashin a fixed-effect regression model controlling for firm covariates plus year and NACE 4-digit sector fixed effects as displayed in equation (11) All bars reflect statistically significant results See table A15 in annex 1 for the complete set of results
A variance decomposition analysis suggests that ownership is the most relevant characteristic to explain total variance of markup performance across firms in Romania followed by capital intensity and export status Drawing from estimations of equation (11) it is possible to evaluate the relative importance of each variable to explain the variance of the markup Letting dExp represent any of the explanatory variables of equation (11) the contribution to the variance of the markup of that variable can be defined as
119862119862119879119879119899119899119886119886119889119889119864119864119864119864119864119864 = 12057512057532119881119881119886119886119903119903119889119889119864119864119864119864119864119864+21205751205753119872119872119862119862119862119862(119889119889119864119864119864119864119864119864120583120583minus1205751205753119889119889119864119864119864119864119864119864)119881119881119886119886119903119903(120583120583)
(12)
or as the variance of the variable plus 2 times the covariance of the variable with the part of the markup not explained by that variable A similar expression can be derived for any of the remaining explanatory variables The relative contribution of each variable is computed after discounting the residuals sector and year contributions Results are displayed in figure 13 Ownership structure is shown to be the most relevant feature to explain the variance of markup performance across firms it accounts for 347 percent of the explained variance of markup performance (after removing NACE 4-digit sector and year contributions) The second most important characteristic is capital intensity corresponding to 214 percent of the variance of the markup performance Export status accounts for the third largest share in explained variance 113 percent
d
iffer
ence
27
Figure 13 Contribution by each firm characteristic to explain total variance of markup performance across firms
Source World Bank staff calculations based on SBS data set Note The pie chart reflects markup variance decomposition results It decomposes the variance of markup performance across firms after removing the proportion accounted for by omitted factors NACE 4-digit sector and year contributions
44 WHAT WOULD BE THE PRODUCTIVITY DIVIDENDS FROM MARKUP REDUCTION
While it became evident that aggregate market power in Romania has been rising it is important to analyze its consequences for economic growth An indirect way to measure this is to estimate the productivity dividends that would come from markup reduction The association between markup and productivity can be positive or negative depending on the nature of competition in the specific marketssectors As shown by Autor et al (2017) and Van Reenen (2018) there are marketsmdashsuch as high-tech sectors or knowledge-intensive onesmdashwhere the nature of competition tends to emphasize the importance of network effects economies of scale and scope and intangible assets so the most productive and dynamic firms exert higher markups and obtain larger market shares On the other hand in certain markets where recouping fixed costs (such as RampD) because of higher-risk investments is not that relevant high-markup firms are not necessarily more productive and efficient Another way to look at this contrast is through the inverted-U relationship of innovation and competition to an increase in productivity as explored by Aghion et al (2005) According to this view stronger competition (proxied here by smaller markups) encourages neck-and-neck firms to innovatemdashthe ldquoescape competitionrdquo effectmdashand therefore to increase productivity growth At the same time this view discourages laggard firms from innovating (the Schumpeterian effect) therefore reducing productivity growth The combination of the two effectsmdashescaping competition and discouraging innovationmdashexplains the inverted-U relationship of competition and innovation with productivity growth
To assess the correlation between productivity growth and markups in Romania the analysis uses firm-level estimations of TFPR and markups obtained so far Thus it estimates the specification presented in Aghion Braun and Fedderke (2008) as follows
Δ119889119889119899119899119879119879119897119897119897119897119877119877119888119888119895119895119894119894119895119895 = 1206011206010 + 1206011206011120583120583119888119888119895119895119894119894119895119895 + 120578120578119895119895 + 120588120588119895119895 + 120574120574119888119888 + 120592120592119888119888119895119895119894119894119895119895 (13)
where the left-hand-side variable represents TFPR growth of firm i in NACE 4-digit sector j in year t 120583120583119894119894119895119895119895119895minus1 is the lagged value of firm irsquos markup in sector j in year t ηt ρj and γc are
214
113
79
47
347
64
136
capital intensity Export status RampD status age ownership size region
28
respectively time NACE 4-digit sector and county fixed effects Equation (13) is estimated separately for each 1-digit sector (that is manufacturing services and mining) and for the whole economy while the equation parameters are estimated by OLS always using heteroscedasticity-robust standard errors
Figure 14 Productivity (TFPR) growth dividends from a 10 percent reduction of average markup by sector
Source World Bank staff calculations based on SBS data set Note Results from year county and 4-digit sector fixed effects Coefficient for mining was not statistically significant
Results shows that on average reducing markups would have a positive impact on aggregate productivity expansion Results displayed in table A18 in annex 1 suggest that lower (past) markups are associated with higher (current) productivity growth all coefficients for lagged markups are negative and statistically significant at conventional values for all sectors except mining Overall this negative correlation between past markup level and productivity growth is an indication of a positive association between competition and productivity growth which would be driven by the escape competition effect described by Aghion et al (2008)34
The magnitude of the economic effect of markup reduction on productivity growth is sizable Figure 14 shows that a 10 percent decrease in the average markup of 61 percent for the overall economy in the 2008ndash17 period would imply an increase in productivity (TFPR) growth of 082 percentage point per year The economic effect for the manufacturing sector would be substantially higher reducing the average markup of 403 percent for manufacturing in the same period would imply an increase in TFPR growth of 147 percentage points per year
Further productivity dividends stemming from markup reduction vary substantially across NACE 4-digit sectors The same specification expressed in equation (9) is estimated for each NACE 4-digit sector separately controlling for year and county fixed effects The TFPR growth dividends from markup reduction are computed for each NACE 4-digit sector drawing from the estimated coefficients (see table A18 in annex 1) Results vary substantially
34 An extended specificationmdashwhere the squared value of lagged markup is included as an additional dependent variablemdashwas also estimated The estimated coefficient of the squared term was not statistically significant (see results in table A17 in annex 1)
147
048
082
0
02
04
06
08
1
12
14
16
Manufacturing Services All
Perc
enta
ge p
oint
s per
yea
r
29
across sectors among those 4-digit sectors where the estimated coefficients are statistically significant the productivity growth dividends of a 10 percent decrease in markup vary from 701 percentage points to 016 percentage points respectively for NACE sector 1041ndashManufacture of oil and fats and sector 4649ndashWholesale of other household goods (figure 15)35 Productivity dividends from a potential markup reduction are also positive in sectors where the top decile firms in the markup distribution are overly represented for instance in sector 4711ndashRetail sale in non-specialized stores with food beverages or tobacco predominating a 10 percent decrease of average markup would be associated with an increase in TFPR growth of 022 percentage points per year For sector 4690ndashNon-specialized wholesale trade and sector 4673ndashWholesale of wood construction materials and sanitary equipment the productivity dividends would be 018 and 021 percentage points respectively
Figure 15 Productivity (TFPR) growth dividends from a 10 percent reduction of average markup Results by NACE 4-digit sector
Source World Bank staff calculations based on SBS data set
35 There are however some sectors where markup reduction brings detrimental impacts to productivity expansion See complete set of results in table A18in annex 1 for instance in NACE sector 8010ndashPrivate security activities and sector 2432ndashPrecious metals production where a reduction of average markup in the 2008ndash17 period would imply a decrease of TFPR growth of 030 percentage points and 663 percentage points respectively Following Aghion Braun and Fedderke (2008) the Schumpeterian effect of product market competition would be the underlying driver behind this result in these sectors competition reduces innovation incentives and therefore productivity growth by reducing the rents from innovations of firms below the technological frontier
00
10
20
30
40
50
60
70
80
Perc
enta
ge p
oint
s per
yea
r
30
5 CONCLUSIONS
A stylized fact emerging in the recent empirical literature is the increase in average levels of market power across countries in both developed and emerging economies This paper aims to bring new evidence about the evolution of corporate market power in Romania and the implications for competition dynamics It uses markups as a proxy for market power and explores firm-level heterogeneity to identify the underlying drivers of aggregate trends The paper applies the production approachmdashfollowing De Loecker and Warzynski (2012) De Loecker and Eeckhout (2018) and De Loecker Eeckhout and Unger (2020)mdashto estimate markup at the firm-year level for Romania The Romanian Structural Business Survey data set is used to apply this methodology
Results show that the aggregate markup in Romania increased by around 15 percent between 2008 and 2017 However this aggregate performance masks a lot of heterogeneity the first being heterogeneity of markups across the main sectors While in manufacturing (sales-weighted) average markups experienced a declining pattern of minus57 percent during 2008ndash17 there was an opposite and much more rapid trend in services with an aggregate change of 422 percent
Second at the firm level results suggest that a key driving force behind this aggregate trend was the ability of the top decile of firms in the markup distribution to increase their markups This increase has been faster than for the rest of the firms Firms in the 90th percentile of the markup distribution increased their (sales-weighted) average markup by 285 percent between 2008 and 2017 while the rest of firms (that is those below the top decile firms) experienced a completely opposite trend their weighted markup contracted by 83 percent over the same period
This sample of top decile firms does not seem to follow the typical superstar firmsrsquo profile which suggests that the increase in markups in Romania might be associated with an environment that is less conducive to competition The top decile firms in the markup distribution are 468 percent smaller 910 percent less productive and 33 percent less likely to invest in intangible assets than the rest of the firms in the markup distribution and they are overrepresented in less knowledge-intensive service sectors Therefore they do not seem to follow the typical superstar firmsrsquo profile (typically larger more productive and more likely to invest in intangible assets) This suggests that the increase in markups in Romania might be more due to relatively weak competition rather than to changes in the nature of competition where superstar firms (usually more efficient and innovative) are rewarded with greater market share In fact a decomposition exercise shows that the increase in aggregate markups has been driven mostly by incumbents rather than by new entrants and exiting firms These results could be interpreted as a sign of consolidation of market power among existing firms Several policy-related factors could explain this result among them government interventions and regulations that restrict competition by reinforcing dominance or limiting entry facilitating collusive outcomes or increasing the cost to compete in markets and by discriminating and protecting vested interests In this regard illustrative evidence provided by Pop and Ore Monago (2020) shows that despite reforms regulations that restrict entry and rivalry are still present in the retail trade sector which concentrates a substantial proportion of high-markup firms in the Romanian economy
31
Results also show that certain firm characteristics matter in explaining differences in markup performance size age RampD profile export propensity location and notably ownership State-controlled companies tend to demonstrate the highest markup premiums when compared with domestic privately owned companies 289 percent higher for minority state-owned companies and 20 percent higher for fully state-owned companies Old companies (older than 15 years) display 54 percent higher markups on average than young ones no matter the product market (at NACE 4-digit level) where they operate The markup premium for large companies (with more than 250 full-time employees) is 122 percent higher than that of small firms in the overall economy Exporting firmsmdashthose whose direct exports represent more than 10 percent of total revenuemdashearn 119 percent higher markups than non-exporting firms that operate in the same sector At the same time results show that the markup premium for RampD performers (compared with non-RampD performers) is 273 percent for the whole economy and that firms operating in the same product market charge different markups depending on the county where they operate Overall while all these features matter to explain markup performance a variance decomposition analysis suggests that ownership is the most relevant characteristic to explain total variance of markup performance across firms in Romania
In this context given that ownership assumes a prominent role to explain markup performance it is important to ensure competitively neutral policies across markets where private and public enterprises compete The prominent role of ownership in explaining total variance of markup performance across firms combined with the evidence that state-controlled companies tend to exert the highest markup premiums in the overall economy highlights the importance of ensuring competitive neutrality in Romania so that private and public enterprises compete on a fair basis Analysis presented in Pop and Ore Monago (2020) shows that state-owned enterprises (SOEs) in Romania compete on uneven terms with the private sector because of gaps in terms of both the current regulatory framework as well as its implementation As for the regulatory framework itself lack of competitive neutrality emerges from restrictive SOE governance rules and the exemption of newly setup SOEs from the corporate governance law lack of rules mandating the separation of commercial and noncommercial functions despite legal separation (for example in the railway and energy sectors) and the lack of specific provisions that require SOE investments to show positive rates of returns With regard to implementation of the regulatory framework competitive neutrality gaps stem from (a) the protracted application of corporate governance rules (b) fragmentation of SOE oversight across institutions with frequent overlaps (c) inconsistent reporting of SOE performance that prevents full monitoring and comparability with the private sector performance in comparable situations (d) little clarity in terms of compensation for public service obligations and (e) lack of transparency in state aid allocation
Finally the analysis shows that productivity dividends arise from increased competition in Romania As such lowering markups can boost productivity growth A 10 percent decrease in the average markup for the overall economy during 2008ndash17 would imply an increase in productivity (TFPR) growth of 082 percentage point per year The effect for the manufacturing sector is higher (147 percentage points per year) but lower for services (048 percentage point per year) The ldquoescape competitionrdquo effect described by Aghion Braun and Fedderke (2008)mdashthrough which fiercer competition induces firms to innovate to escape competition with the fringe therefore increasing productivity growthmdashwould be the underlying driver behind these average results for the manufacturing industry Results vary substantially across sectors among
32
those 4-digit sectors where the estimated coefficients are statistically significant the productivity growth dividend of a 10 percent decrease in markup varies from 701 percentage points (sector 1041ndashManufacture of oil and fats) to 016 percentage point (sector 4649ndashWholesale of other household goods)
In this context boosting competition becomes a key part of the engine to drive productivity growth and help consolidate Romaniarsquos convergence to a high-income level Implementing pro-competition policies is instrumental Besides removing anticompetitive regulations and promoting competitive neutrality policy makers should ensure that state aid is allocated in a non-distortive way and enable more effective competition law and antitrust enforcement
33
REFERENCES
Ackerberg D K Caves and G Frazer 2015 ldquoIdentification Properties of Recent Production Function Estimatorsrdquo Econometrica 83 (6) 2411ndash51
Aghion P N Bloom R Blundell R Griffith and P Howitt 2005 ldquoCompetition and Innovation An Inverted-U Relationshiprdquo Quarterly Journal of Economics 120 (2) 701minus28
Aghion P M Braun and J Fedderke 2008 ldquoCompetition and Productivity Growth in South Africardquo Economics of Transition 16 (4) 741ndash68
Autor D D Dorn F Lawrence C Patterson and J Van Reenen 2017 ldquoThe Fall of the Labor Share and the Rise of Superstar Firmsrdquo NBER Working Paper 23396 National Bureau of Economic Research Cambridge MA
Barkai S 2020 ldquoDeclining Labor and Capital Sharesrdquo Journal of Finance 75 (5) 2421ndash63
Bartelsman E J and M Doms 2000 ldquoUnderstanding Productivity Lessons from Longitudinal Microdatardquo Journal of Economic Literature 38 (3) 569ndash94
Berry S J Levinsohn and A Pakes 1995 ldquoAutomobile Prices in Market Equilibriumrdquo Econometrica Journal of the Econometric Society 63 (4) 841ndash90
Berry S J Levinsohn and A Pakes 2004 ldquoDifferentiated Products Demand Systems from a Combination of Micro and Macro Data The New Car Marketrdquo Journal of Political Economy 112 (1) 68ndash105
Bessen J 2017 ldquoInformation Technology and Industry Concentrationrdquo Law and Economics Paper No 17-41 Boston University School of Law Boston
Bond S A Hashemi G Kaplan and P Zoch 2020 ldquoSome Unpleasant Markup Arithmetic Production Function Elasticities and their Estimation from Production Datardquo NBER Working Paper No 27002 National Bureau of Economic Research Cambridge MA
Bresnahan T F 1989 ldquoEmpirical Studies of Industries with Market Powerrdquo In Handbook of Industrial Organization Vol 2 edited by R Schmalensee and R Willig 1011ndash57 Amsterdam Elsevier
Cameron A C and P K Trivedi 2010 Microeconometrics Using Stata (Rev ed) College Station TX Stata Press
Crouzet N and J Eberly 2018 ldquoUnderstanding Weak Capital Investment The Role of Market Concentration and Intangiblesrdquo NBER Working Paper 25869 National Bureau of Economic Research Cambridge MA De Loecker J 2011 ldquoRecovering Markups from Production Datardquo International Journal of Industrial Organization 29 (3) 350ndash55
De Loecker J 2013 ldquoDetecting Learning by Exportingrdquo American Economic Journal Microeconomics 5 (3) 1ndash21
De Loecker J and J Eeckhout 2018 ldquoGlobal Market Powerrdquo NBER Working Paper 24768 National Bureau of Economic Research Cambridge MA
De Loecker J J Eeckhout and G Unger 2020 ldquoThe Rise of Market Power and the Macroeconomic Implicationsrdquo Quarterly Journal of Economics 135 (2) 561ndash644 httpsdoiorg101093qjeqjz041
34
De Loecker J and F Warzynski 2012 ldquoMark-ups and Firm-Level Export Statusrdquo American Economic Review 102 (6) 2437ndash71
Diacuteez F D Leigh and S Tambunlertchai 2018 ldquoGlobal Market Power and Its Macroeconomic Implicationsrdquo IMF Working Paper 18137 International Monetary Fund Washington DC
Grullon G Y Larkin and R Michaely 2018 ldquoAre US Industries Becoming More Concentratedrdquo Swiss Finance Institute Research Paper No 19-41 httpdxdoiorg102139ssrn2612047
Gutieacuterrez G and T Philippon 2017a ldquoDeclining Competition and Investment in the USrdquo NBER Working Paper 23583 National Bureau of Economic Research Cambridge MA Gutieacuterrez G and T Philippon 2017b ldquoInvestment-less Growth An Empirical Investigationrdquo Brookings Papers on Economic Activity (Fall) 89ndash182 Gutieacuterrez G and T Philippon 2018 ldquoHow EU Markets Became More Competitive than US Markets A Study of Institutional Driftrdquo NBER Working Paper 24700 National Bureau of Economic Research Cambridge MA
Hall R 1988 ldquoThe Relation between Price and Marginal Cost in US Industryrdquo Journal of Political Economy 96 (5) 921ndash47
Hallak J and J Sivadasan 2009 ldquoExporting Behavior under Quality Constraintsrdquo NBER Working Paper 14928 National Bureau of Economic Research Cambridge MA
IMF (International Monetary Fund) 2019 World Economic Outlook April 2019 Growth Slowdown Precarious Recovery Washington DC International Monetary Fund
Koujianou Goldberg P and R Hellerstein 2012 A Structural Approach to Identifying the Sources of Local Currency Price Stability Review of Economic Studies 80 (1) 175ndash210
Melitz M J and G Ottaviano 2008 ldquoMarket Size Trade and Productivityrdquo Review of Economic Studies 75 (1) 295ndash316
Melitz M J and S Polanec 2015 ldquoDynamic Olley-Pakes Productivity Decomposition with Entry and Exitrdquo RAND Journal of Economics 46 (2) 362ndash75
Motta M 2004 Competition Policy Theory and Practice Cambridge MA Cambridge University Press
Pop G and T Ore Monago 2020 ldquoCompetition and Government Interventions in Romania An Assessment with Focus on Product Market Regulations and Competitive Neutralityrdquo Background paper for Markets and People Romania Country Economic Memorandum International Development in Focus World Bank Washington DC
Shapiro C 2018 ldquoAntitrust in a Time of Populismrdquo International Journal of Industrial Organization 61 714ndash48
Syverson C 2004 ldquoProduct Substitutability and Productivity Dispersionrdquo Review of Economics and Statistics 86 (2) 534ndash50
Van Reenen J 2018 ldquoIncreasing Differences between Firms Market Power and the Macroeconomyrdquo CEPR Discussion Paper 1576 Center for Economic and Policy Research Washington DC
35
World Bank 2020a ldquoMarkets and People Romania Country Economic Memorandumrdquo International Development in Focus World Bank Washington DC
World Bank 2020b ldquoAssessing the Direct and Indirect Impact of State Aid in Romania An Ex-post Evaluationrdquo World Bank Washington DC
36
ANNEX 1 ADDITIONAL FIGURES AND TABLES
Figure A11 Evolution of (sales-weighted) average markup in manufacturing sector by technology intensity 2008ndash17
Source World Bank staff calculations based on SBS data set
Table A11 Manufacturing industry groups by technology intensity Eurostat classification
85
99
51
Mar
k-up i
ndex
(200
8 = 1
)
2008 2009 2010 2011 2012 2013 2014 2015 2016 2017Year
Manuf High-tech
37
Source Eurostat Indicators on High-Tech Industry and KnowledgendashIntensive Services annex 3 httpseceuropaeueurostatcachemetadataAnnexeshtec_esms_an3pdf
38
Figure A12 Evolution of (sales-weighted) average markup in services sector by knowledge intensity
39
Table A12 Services groups by knowledge intensity Eurostat classification
40
Source Eurostat Indicators on High-Tech Industry and KnowledgendashIntensive Services annex 3 httpseceuropaeueurostatcachemetadataAnnexeshtec_esms_an3pdf
41
Table A13 Original ownership classification from SBS SBS Code Description
10 Fully state-owned Majority state-owned (statepublic capital gt 50 of equity)
21 State + Romanian private 22 State + foreign 23 State + Romanian private + foreign
Majority privately owned (private capital ge 50 of equity) 26 State + Romanian private 27 State + foreign 28 State + Romanian private + foreign
Fully privately owned 31 Romanian private 32 Romanian private + foreign 40 Cooperative 50 Craft organizations 60 Fully foreign-owned 70 Public of national and local interest
Source World Bank staff calculations based on SBS data set
Table A14 Ownership classification adopted in the analysis SBS codes (combined) Description
10 21 22 23 State owned (fully + majority state-owned) 26 27 28 Private-public (majority private)
31 Fully private (domestic) 32 Fully private (domestic + foreign) 60 Fully private (fully foreign) 70 Public of national and local interest
40 50 Other Source World Bank staff calculations based on SBS data set
Table A15 Conditional correlations between firm characteristics and markup performance regression results
Variable Manufacturing Services Mining All Capital stock (ln) minus0150 minus0039 minus0067 minus0066 Export dummy 0120 0258 0416 0119 RampD dummy 0160 0340 0460 0273 Mature 0022 minus0016 0158 minus0005 Old 0079 0048 0228 0054 Majority state-owned 0527 0139 0772 0200 State-private ownership 0352 0275 0111 0289 Romanian private + foreign 0161 0279 0096 0229 Fully foreign-owned 0105 0263 0 0201 Public of national and local interest 0209 0149 (omitted) 0214 Other 0884 0555 (omitted) 0758 Medium 0230 minus0083 0011 0009 Large 0327 0169 minus0015 0122 1 Alba 0106 minus0087 minus0151 minus0042 2 Arad 0038 minus0090 minus0148 minus0077 3 Arges minus0005 minus0053 minus0195 minus0060
42
Variable Manufacturing Services Mining All 4 Bacau 0092 minus0090 minus0194 minus0055 5 Bihor 0036 minus0115 minus0256 minus0088 6 Bistrita-Nasaud minus0064 minus0156 minus0069 minus0144 7 Botosani 0046 minus0089 minus0438 minus0076 8 Brasov 0041 minus0047 0049 minus0040 9 Braila 0133 minus0055 minus0265 minus0025 10 Buzau 0017 minus0123 minus0025 minus0100 11 Caras-Severin 0035 minus0187 minus0005 minus0139 12 Cluj minus0004 minus0094 minus0119 minus0088 13 Constanta 0057 minus0105 0062 minus0088 14 Covasna 0038 minus0056 minus0151 minus0052 15 Dambovita 0005 minus0183 minus0154 minus0144 16 Dolj 0195 0060 minus0042 0079 17 Galati 0106 minus0007 minus0276 0004 18 Gorj 0084 0028 minus0116 0026 19 Harghita 0101 minus0102 minus0007 minus0045 20 Hunedoara 0167 minus0031 minus0057 0011 21 Ialomita 0138 minus0049 minus0265 minus0027 22 Iasi minus0014 minus0038 minus0384 minus0058 23 Ilfov 0011 0009 0314 0010 24 Maramures 0094 minus0020 minus0042 0 25 Mehedinti 0113 minus0136 minus0720 minus0096 26 Mures 0048 minus0063 minus0093 minus0048 27 Neamt 0001 minus0108 minus0428 minus0102 28 Olt 0073 minus0005 minus0397 minus0011 29 Prahova 0018 minus0034 minus0028 minus0043 30 Satu-Mare 0033 minus0024 minus0056 minus0036 31 Salaj 0075 minus0045 minus0448 minus0031 32 Sibiu 0044 minus0038 minus0154 minus0041 33 Suceava 0044 minus0087 minus0111 minus0074 34 Teleorman 0103 minus0099 minus0299 minus0062 35 Timis 0030 minus0020 minus0341 minus0037 36 Tulcea 0142 minus0149 0096 minus0078 37 Vaslui 0091 minus0017 minus0105 minus0007 38 Valcea 0078 minus0008 minus0122 minus0002 39 Vrancea minus0061 minus0163 minus0608 minus0154 51 Calarasi 0080 minus0122 0672 minus0075 52 Giurgiu 0052 minus0064 minus0334 minus0066
_cons 2147 1150 2291 2246 NACE 4-digit fixed effects Yes Yes Yes Yes
Year fixed effects Yes Yes Yes Yes
R2 0345 0235 0254 0279 Source World Bank staff calculations based on SBS data set Note Dependent variable = ln(markup) denotes significance level at 1 percent at 5 percent and at 10 percent
43
44
Table A16 Conditional correlations between firm characteristics (including productivity) and markup performance regression results
Variable Manufacturing Services Mining All Capital stock (ln) minus0149 minus0038 minus0065 minus0066 Export dummy 0116 0257 0400 0118 RampD dummy 0182 0366 0449 0295 Mature 0021 minus0014 0164 minus0003 Old 0079 0052 0228 0057 Majority state-owned 0529 0147 0758 0209 State-private ownership 0351 0274 0118 0288 Romanian private + foreign 0156 0275 0090 0225 Fully foreign-owned 0096 0254 minus0011 0192 Public of national and local interest 0179 0165 (omitted) 0233 Other 0879 0561 (omitted) 0759 Medium 0232 minus0083 0002 0010 Large 0327 0170 minus0016 0122
Productivity (TFPR) 0051 0020 0041 0024 1 Alba 0114 minus0081 minus0156 minus0035 2 Arad 0045 minus0085 minus0135 minus0071 3 Arges 0001 minus0049 minus0196 minus0056 4 Bacau 0098 minus0084 minus0188 minus0049 5 Bihor 0042 minus0111 minus0268 minus0083 6 Bistrita-Nasaud minus0057 minus0150 minus0055 minus0137 7 Botosani 0053 minus0082 minus0443 minus0069 8 Brasov 0045 minus0042 0033 minus0035 9 Braila 0139 minus0048 minus0243 minus0018 10 Buzau 0022 minus0118 minus0002 minus0094 11 Caras-Severin 0042 minus0178 minus0001 minus0131 12 Cluj minus0001 minus0089 minus0120 minus0083 13 Constanta 0067 minus0101 0056 minus0084 14 Covasna 0045 minus0050 minus0166 minus0046 15 Dambovita 0010 minus0180 minus0162 minus0140 16 Dolj 0202 0068 minus0054 0087 17 Galati 0114 minus0001 minus0289 0010 18 Gorj 0091 0037 minus0118 0035 19 Harghita 0108 minus0096 minus0005 minus0039 20 Hunedoara 0173 minus0025 minus0055 0018 21 Ialomita 0144 minus0045 minus0256 minus0023 22 Iasi minus0005 minus0034 minus0394 minus0053 23 Ilfov 0013 0012 0296 0013 24 Maramures 0101 minus0013 minus0038 0007 25 Mehedinti 0128 minus0132 minus0729 minus0090 26 Mures 0053 minus0057 minus0105 minus0042 27 Neamt 0010 minus0101 minus0434 minus0094
45
Variable Manufacturing Services Mining All 28 Olt 0082 0002 minus0402 minus0004 29 Prahova 0023 minus0029 minus0032 minus0039 30 Satu-Mare 0038 minus0018 minus0047 minus0030 31 Salaj 0081 minus0039 minus0433 minus0025 32 Sibiu 0044 minus0034 minus0147 minus0038 33 Suceava 0051 minus0081 minus0105 minus0068 34 Teleorman 0117 minus0092 minus0296 minus0053 35 Timis 0033 minus0014 minus0340 minus0032 36 Tulcea 0147 minus0142 0078 minus0072 37 Vaslui 0101 minus0011 minus0104 0 38 Valcea 0087 minus0002 minus0120 0004 39 Vrancea minus0053 minus0158 minus0602 minus0148 51 Calarasi 0086 minus0118 0673 minus0071 52 Giurgiu 0059 minus0060 minus0334 minus0061
_cons 1632 0993 1934 2036 NACE 4-digit fixed effects Yes Yes Yes Yes
Year fixed effects Yes Yes Yes Yes
R2 0347 0235 0255 0280 Source World Bank staff calculations based on SBS data set Note Dependent variable = ln(markup) denotes significance level at 1 percent at 5 percent and at 10 percent
Table A17 Productivity growth and markup performance regression results
All Manufacturing Services Mining
Lag markup minus0025 minus0028 minus0026 minus0027 minus0025 minus0027 minus0012 minus0024
Lag markup squared 0001 0000 0001 0003 NACE 4-digit sector fixed effects Yes Yes Yes Yes Yes Yes Yes Yes County fixed effects Yes Yes Yes Yes Yes Yes Yes Yes Year fixed effects Yes Yes Yes Yes Yes Yes Yes Yes
Observations 245525 245525 76694 76694 167120 167120 1711 1711 Source World Bank staff calculations based on SBS data set Note Dependent variable = TFPR growth denotes significance level at 1 percent at 5 percent and at 10 percent
46
Table A18 Productivity (TFPR) growth dividends from a 10 reduction of average markup results by NACE 4-digit sector
NACE 4-digit sector Gain in TFPR growth per
year (percentage points)
1041ndashManufacture of oils and fats 7015 4331ndashPlastering 5547 2060ndashManufacture of man-made fibers 5286 2824ndashManufacture of power-driven hand tools 4869 1072ndashManufacture of rusks and biscuits manufacture of preserved pastry goods and cakes
4145
1104ndashManufacture of other non-distilled fermented beverages 3984 1723ndashManufacture of paper stationery 3716 2812ndashManufacture of fluid power equipment 3566 2452ndashCasting of steel 3278 1101ndashDistilling rectifying and blending of spirits 3134 1420ndashRaising of other cattle and buffaloes 3072 2011ndashManufacture of industrial gases 3033 2593ndashManufacture of wire products chain and springs 2689 2829ndashManufacture of other general-purpose machinery nec 2641 4910ndashPassenger rail transport interurban 2629 2451ndashCasting of iron 2615 3821ndashTreatment and disposal of non-hazardous waste 2375 2059ndashManufacture of other chemical products nec 2336 2920ndashManufacture of bodies (coachwork) for motor vehicles manufacture of trailers and semi-trailers
2270
1051ndashOperation of dairies and cheese making 2224 3313ndashRepair of electronic and optical equipment 2160 1081ndashManufacture of sugar 2158 1073ndashManufacture of macaroni noodles couscous and similar farinaceous products 2081 4213ndashConstruction of bridges and tunnels 2077 2223ndashManufacture of buildersrsquo ware of plastic 2011 2550ndashForging pressing stamping and roll-forming of metal powder metallurgy 1949 2313ndashManufacture of hollow glass 1926 2825ndashManufacture of non-domestic cooling and ventilation equipment 1889 2020ndashManufacture of pesticides and other agrochemical products 1818 2571ndashManufacture of cutlery 1758 5914ndashMotion picture projection activities 1691 5920ndashSound recording and music publishing activities 1665 3514ndashTrade of electricity 1653 1310ndashPreparation and spinning of textile fibers 1616 4920ndashFreight rail transport 1613 4339ndashOther building completion and finishing 1586 2620ndashManufacture of computers and peripheral equipment 1543 4311ndashDemolition 1515 3832ndashRecovery of sorted materials 1404 3523ndashTrade of gas through mains 1382 2410ndashManufacture of basic iron and steel and of ferro-alloys 1353 2399ndashManufacture of other non-metallic mineral products nec 1272 2017ndashManufacture of synthetic rubber in primary forms 1258 7711ndashRental and leasing of cars and light motor vehicles 1256 4212ndashConstruction of railways and underground railways 1128 2453ndashCasting of light metals 1080 7410ndashSpecialized design activities 1068 5630ndashBeverage serving activities 1065 4211ndashConstruction of roads and motorways 0989 4677ndashWholesale of waste and scrap 0926 4676ndashWholesale of other intermediate products 0917 4120ndashConstruction of residential and non-residential buildings 0912 4623ndashWholesale of live animals 0890 6820ndashRental and operating of own or leased real estate 0826 4110ndashDevelopment of building projects 0824
47
NACE 4-digit sector Gain in TFPR growth per year
(percentage points) 4613ndashAgents involved in the sale of timber and building materials 0823 4322ndashPlumbing heat and air-conditioning installation 0731 5629ndashOther food service activities 0699 4791ndashRetail sale via mail order houses or via internet 0659 4941ndashFreight transport by road 0659 4618ndashAgents specialized in the sale of other particular products 0646 7219ndashOther research and experimental development on natural sciences and engineering 0623 4617ndashAgents involved in the sale of food beverages and tobacco 0609 5510ndashHotels and similar accommodation 0560 4615ndashAgents involved in the sale of furniture household goods hardware and ironmongery
0541
4633ndashWholesale of dairy products eggs and edible oils and fats 0540 4778ndashOther retail sale of new goods in specialized stores 0527 4621ndashWholesale of grain unmanufactured tobacco seeds and animal feeds 0517 4662ndashWholesale of machine tools 0501 6110ndashWired telecommunications activities 0491 4634ndashWholesale of beverages 0468 5610ndashRestaurants and mobile food service activities 0463 4631ndashWholesale of fruit and vegetables 0426 4532ndashRetail trade of motor vehicle parts and accessories 0394 1411ndashManufacture of leather clothes 0390 4511ndashSale of cars and light motor vehicles 0382 4637ndashWholesale of coffee tea cocoa and spices 0361 4645ndashWholesale of perfume and cosmetics 0354 1419ndashManufacture of other wearing apparel and accessories 0344 4643ndashWholesale of electrical household appliances 0335 4639ndashNon-specialized wholesale of food beverages and tobacco 0285 4619ndashAgents involved in the sale of a variety of goods 0281 4675ndashWholesale of chemical products 0249 4711ndashRetail sale in non-specialized stores with food beverages or tobacco predominating 0223 4673ndashWholesale of wood construction materials and sanitary equipment 0214 4690ndashNon-specialized wholesale trade 0188 4649ndashWholesale of other household goods 0158 8010ndashPrivate security activities minus0300 8220ndashActivities of call centres minus0323 2572ndashManufacture of locks and hinges minus0503 7120ndashTechnical testing and analysis minus0511 3315ndashRepair and maintenance of ships and boats minus0512 3600ndashWater collection treatment and supply minus0547 4754ndashRetail sale of electrical household appliances in specialized stores minus0627 2341ndashManufacture of ceramic household and ornamental articles minus0646 7111ndashArchitectural activities minus0649 6120ndashWireless telecommunications activities minus0746 7312ndashMedia representation minus1023 4334ndashPainting and glazing minus1200 5020ndashSea and coastal freight water transport minus1276 1052ndashManufacture of ice cream minus1367 5911ndashMotion picture video and television programme production activities minus1439 2592ndashManufacture of light metal packaging minus1619 2752ndashManufacture of non-electric domestic appliances minus1729 2521ndashManufacture of central heating radiators and boilers minus1843 4932ndashTaxi operation minus2568 2013ndashManufacture of other inorganic basic chemicals minus3524 1711ndashManufacture of pulp minus3631 4942ndashRemoval services minus4214 1092ndashManufacture of prepared pet foods minus4262 3040ndashManufacture of military fighting vehicles minus5508 2432ndashCold rolling of narrow strip minus6629
Source World Bank staff calculations based on SBS data set Note The table displays only sectors for which estimated coefficients are statistically significant
48
- 1 Introduction and motivation
- 2 Methodology
- 3 Data set
- 4 Results
-
- 41 Has corporate market power increased at the aggregate level How do aggregate trends differ across sectors Is there a group of firms driving the overall trend
- 42 How have firm dynamics influenced aggregate markup performance Are there signs of market power consolidation among incumbent firms
- 43 Do firm markups differ across firms with different attributes
- 44 What would be the productivity dividends from markup reduction
-
- 5 Conclusions
- References
- Annex 1 Additional figures and tables
-
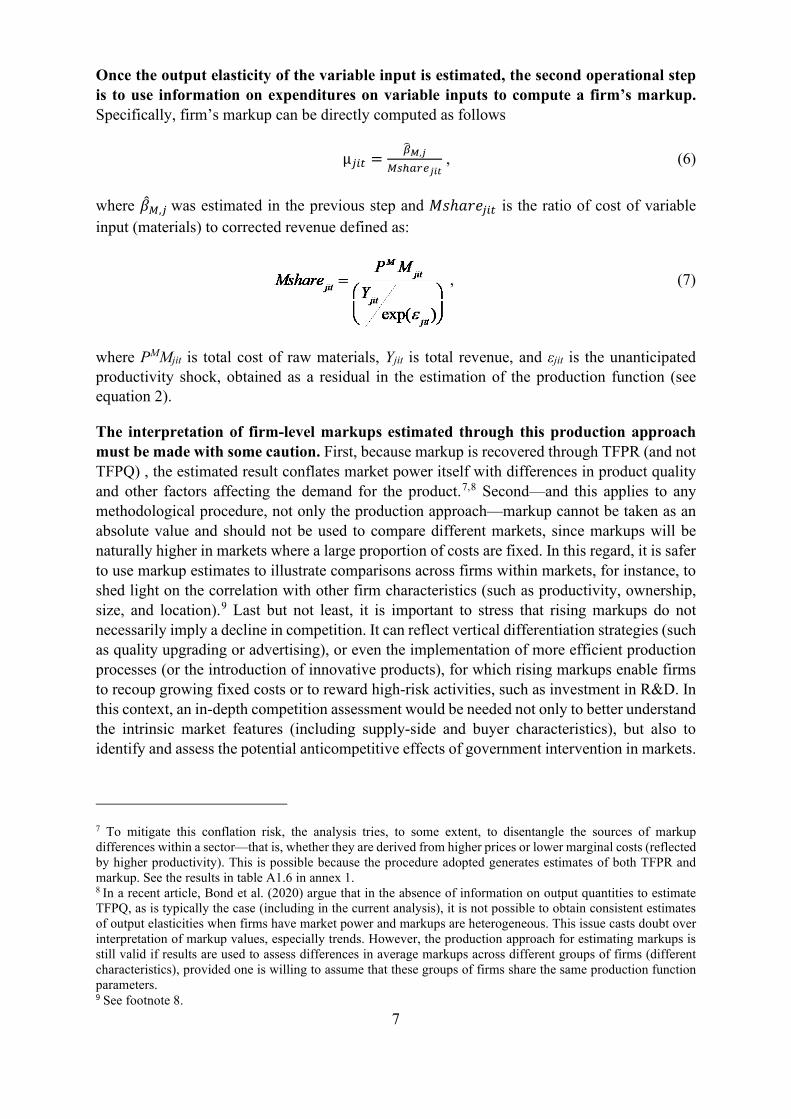
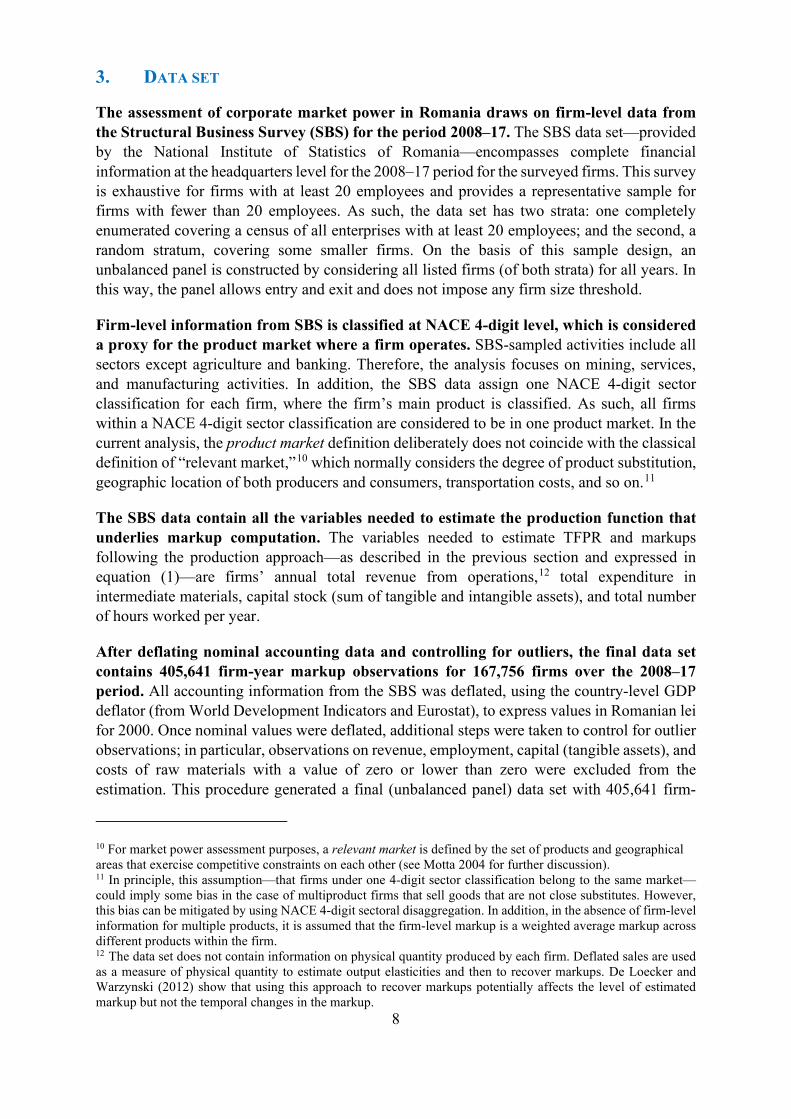

10
Table 1 Final sample of firm-year observations Year Manufacturing Services Mining Total 2008 15056 31346 320 46722 2009 14038 31598 318 45954 2010 12997 29759 317 43073 2011 9492 25942 239 35673 2012 10151 26983 245 37379 2013 9806 29460 229 39495 2014 10381 29872 253 40506 2015 10286 28844 260 39390 2016 10199 28449 249 38897 2017 10018 28280 254 38552 Total 112424 290533 2684 405641
Source World Bank staff calculations based on SBS data set Note Total number of observations by year and sector with production function variables
Table 2 Summary statistics Year Revenue (ln) Employment (ln) Intermediate materials (ln) Capital stock (ln)
Mean SD Mean SD Mean SD Mean SD 2008 1473 229 289 136 1207 267 1168 271 2009 1470 220 282 132 1187 262 1182 269 2010 1470 228 276 135 1202 268 1184 268 2011 1533 200 306 133 1252 260 1228 258 2012 1523 208 304 132 1253 261 1222 259 2013 1503 212 292 133 1232 264 1209 263 2014 1507 213 294 132 1237 262 1204 264 2015 1532 198 307 128 1255 255 1211 264 2016 1540 191 311 126 1244 263 1214 263 2017 1546 189 313 125 1241 270 1220 262 Total 1508 212 297 132 1229 264 1203 265
Source World Bank staff calculations based on SBS data set Note SD = standard deviation
11
4 RESULTS
41 HAS CORPORATE MARKET POWER INCREASED AT THE AGGREGATE LEVEL HOW DO AGGREGATE TRENDS DIFFER ACROSS SECTORS IS THERE A GROUP OF FIRMS DRIVING THE OVERALL TREND
Results show that the average markup in Romania increased by around 15 percent during 2008ndash17 However this expansion was marked by an uneven trend Figure 1 panel a displays the evolution of the (sales-weighted) aggregate markup for the 2008ndash17 period for the whole economy (aggregating manufacturing services and mining) At aggregate level average markups experienced a 15 percent aggregate increase from 2008 to 2017 However three alternating trends are detected in this whole period a sharp increase of more than 15 percent during 2008ndash09 a strong decline after 2009 when markups fell by 23 percent from 2009 to 2012 and a consistent increase of 215 percent from 2012 to 2017
Figure 1 Evolution of (sales‐weighted) average markup by sector 2008ndash17 a All sectors b Manufacturing
c Services d Mining
Source World Bank staff calculations based on SBS data set
Because aggregate numbers mask a lot of heterogeneity it is not surprising to see
92
94
96
98
11
02M
ark-
up in
dex
(200
8 =
1)
2008 2009 2010 2011 2012 2013 2014 2015 2016 2017Year
Manufacturing
11
11
21
31
4M
ark-
up in
dex
(200
8 =
1)
2008 2009 2010 2011 2012 2013 2014 2015 2016 2017Year
Services
51
15
22
5M
ark-
up in
dex
(200
8 =
1)
2008 2009 2010 2011 2012 2013 2014 2015 2016 2017Year
Mining
12
different trends when unraveling markups across sectors Because of their intrinsic characteristics firms are different from each other and contrast in terms of performance even within very narrowly defined sectors (Syverson 2004) These differences could persist either because of supply-side factors such as management skills RampD or investment patterns (Bartelsman and Doms 2000) or because of demand-side factors related to product differentiation customer-producer relationships geographical segmentation among others That said firms across high-level sectorsmdashmanufacturing services and miningmdashhave shown varied performance While the manufacturing (sales-weighted) average markup experienced a decline of minus57 percent over the 2008ndash17 period (figure 1 panel b) there was an opposite and much more rapid trend in services with an aggregate change of 422 percent (see figure 1 panel c) Weighted average markup in mining experienced an uneven trend throughout the same period Nuances are unveiled even within sectors as aggregate markup performance shows different patterns when breaking manufacturing down into groups of sectors according to their technology intensity14 This is also observed when services are broken down into groups of sectors according to their knowledge intensity15 (see figure A11 and figure A12 in annex 1)
Further there is also evidence of changes in the markup firm distribution from 2008 to 2017 revealing an increasing proportion of firms with relatively high markups Figure 2 displays the firm-level distribution of markups in 2008 and 2017 Some changes are noteworthy First both the mean and variance increased over that period But more importantly the upper tail of the distribution became fatter over time suggesting that in 2017 more firms have higher markups than in 2008 This suggests that the rise in average markups is associated with large increases among the firms with the highest markups
14 As per Eurostat classification manufacturing sectors are classified as high-technology medium-high-technology medium-low-technology and low-technology according to technological intensity (RampD expenditure or value added) and based on the statistical classification of economic activities in the European Community (NACE) at the 2-digit level See table A11 in annex 1 with sector aggregation 15 As per Eurostat classification service sectors are classified as knowledge-intensive services (KIS) and less-knowledge-intensive services (LKIS) KISs comprise knowledge-intensive market services high-tech knowledge-intensive services knowledge-intensive financial services and other knowledge-intensive services LKIS comprise less-knowledge-intensive market services and other less-knowledge-intensive services Both KIS and LKIS are based on the share of tertiary educated persons at the NACE 2-digit level See table A12 in annex 1 with sector aggregation
13
Figure 2 Distribution of firm-level markups all sectors 2008 and 2017
Source World Bank staff calculations based on SBS data set
In fact data show that the rise in average markup has been driven by the ability of a small group of firmsmdashthe top decile firmsmdashto increase their markups over time especially after 2014 Figure 3 panel a shows that markup growth has been progressively uneven across firms with firms in the top decile of the markup distribution increasing their average markup faster than the rest of firms Firms in the 90th percentile increased their (sales-weighted) average markup by 285 percent from 2008 to 2017 while the rest of firmsmdashthose below the top decilemdashexperienced a completely opposite trend their weighted markup contracted by 83 percent over the same period This shows that the increase in the weighted average markupmdashof around 15 percent as shown in figure 3 panel amdashcomes mainly from the group of firms in the top decile of the markup distribution The divergence between the top decile and the rest of firms remains even when results are broken down by sectors it is more pronounced in manufacturing despite some volatility (figure 3 panel b) while in services this happens only after 2014 (panel c) The mining sector experienced the opposite trend (panel d) as most of the time (until 2016) the top decile group of the markup distribution reported lower markup growth than the rest of the firms in the data set
02
46
kden
sity
lnmu
-2 0 2 4 6 8Mark-up (ln)
2008 2017
14
Figure 3 Evolution of (sales-weighted) average markup by sector and by top decile and firm groups (top decile firms versus the rest) 2008ndash17
a All sectors b Manufacturing
c Services d Mining
Source World Bank staff calculations based on SBS data set
Overall these results suggest that any analysis about markup performance in Romania should pay attention to a small group of firms the top decile of firms based on markup distribution These firms have been accounting for increasing shares of value added and employment in the economy Figure 4 shows that the share of value added in the whole economy (including manufacturing services and mining sectors) as accounted for by the firms in the top decile of the markup distribution has been increasing jumping from less than 13 percent in 2008 to 231 percent in 2017 The same applies to employment the sample of the top decile of firms accounts for an increasing share of employment generated in the economy across the 2008ndash17 period (figure 5)
91
11
12
13
Mar
k-up
inde
x (2
008=
1)
2008 2009 2010 2011 2012 2013 2014 2015 2016 2017Year
Average (wgtd)perc 90 (wgtd)Rest of firms (below perc 90) (wgtd)
All firms
15
Figure 4 Share of total value added accounted for by the top decile firms 2008ndash17
Figure 5 Share of employment accounted for by the top decile firms 2008ndash17
Source World Bank staff calculations based on SBS data set
Source World Bank staff calculations based on SBS data set
These top decile firms are also typically smaller less productive and less likely to invest in intangible assets than the rest of the firms As highlighted in the methodological section of this paper the increase of markups cannot be unequivocally interpreted as a decline in competition in a given market it can reflect firmsrsquo efficiency gains or adoption of quality-upgrading strategies To explore this aspect a simple econometric analysis was applied to capture performance differences between the group of firms that is leading the markup increase (the top decile firms) and the rest of the firms based on the markup distribution The following specification was adopted
119862119862ℎ119886119886119886119886119886119886119886119886119886119886119886119886119886119886119886119886119904119904119886119886119886119886119886119886119888119888119895119895119894119894119895119895 = 1205751205750 + 1205751205751119879119879119879119879119879119879_119889119889119886119886119886119886119886119886119889119889119886119886119894119894119895119895 + η119895119895 + ρ119895119895 + γ119888119888 + 120583120583119888119888119895119895119894119894119895119895 (8)
where the dependent variable reflects different firm characteristics (of firm i that operates in sector j county c at year t) to be compared Three dependent variables are tested size (measured in terms of the number of full-time employees) productivity (measured as TFPR discounted for markup16) and intangible assets (measured as a dummy that takes the value of 1 for firms having a positive value of intangible fixed assets17) The key explanatory variable is 119879119879119879119879119879119879_119889119889119886119886119886119886119886119886119889119889119886119886119894119894119895119895 a dummy that takes the value of one firm if i is among the top decile of the markup distribution in year tmdashwhile ηt ρj and γc are respectively time NACE 4-digit sector and county fixed effects The parameters of equation (8) are estimated by OLS (or Probit regression maximum likelihood when the dependent variable is the intangible assets dummy) always using heteroscedasticity-robust standard errors Results displayed in table 3 columns 1 and 2 suggest that firms in the 90th percentile of the markup distribution are on average 468
16 TFPR discounted for markup is computed as TFPR-markup In this regard it is not a perfect measure of the true technical efficiency but just a proxy of productivity that accounts for market share and the effect of materials elasticity while other factors such as the effect of product quality or innovation are not considered 17 Value of intangible assets in the SBS data set is defined as value built on (a) RampD expenditure and (b) franchise patents and other similar rights and values
1015
2025
Perc
enta
ge
2008 2009 2010 2011 2012 2013 2014 2015 2016 2017Year
1012
1416
18Pe
rcen
tage
2008 2009 2010 2011 2012 2013 2014 2015 2016 2017Year
16
percent18 smaller and 91 percent 19 less productive than the rest of the firms even within narrowly defined sectors (at NACE 4-digit level) Results in column 3 captures the differences between these two groups of firms in terms of their willingness to invest in intangible assetsmdashtheir ldquoknowledge capacityrdquomdasha key determinant of firmsrsquo expansion in the long term Results suggest that the sample of top decile firms are almost 33 percent less likely to invest in intangible fixed assets than the remaining firms even within NACE 4-digit sectors20 All these correlations are statistically significant at the 1 percent confidence level
Table 3 Characteristics of top decile firms Conditional correlations between markups and firm characteristics (OLS and Probit results)
(Estimation method) Dependent variable (1)
(OLS) Employment
(ln)
(2) (OLS)
TFPR discounted for markup (ln)
(3) (Probit)
Investment in intangibles
(yesno) Top _decile minus0632 minus2422 minus0386 NACE 4-digit sector fixed effects
Yes Yes Yes
County fixed effects Yes Yes Yes Year fixed effects Yes Yes Yes R2 (pseudo R2)a 0238 0728 0078 Observations 484604 403561 484594
Source World Bank staff calculations based on SBS data set Note All firm-year observations (for the 2008ndash17 period) are pooled together and NACE 4-digit sector and year fixed effects are included OLS = ordinary least squares TFPR = revenue-based total factor productivity a It is worth highlighting that R2 value does not influence the consistency of the estimators of each population parameter which is the objective of the current analysis See for instance Cameron and Trivedi (2010) for a theoretical discussion on this matter Moreover since the analysis draws on a large sample the standard errors of the coefficient estimators are not affected because of the law of large numbers The key issue would be the lack of correlation of omitted variables and the explanatory variables However given that the main (theoretical) determinants of the markup performance are included the omitted variables can be understood to be random Statistically significant at 1 percent
In addition the group of 10 top decile firms in the markup distribution operate mainly in the services sector and are overrepresented in less-knowledge-intensive services sectors with some exceptions Table 4 displays the distribution of top decile firms across NACE 2-digit sectors in 2017 To control for the fact that some sectors might be overrepresented (given the SBS survey sampling) the table shows only those sectors for which the probability of a firm being in the top decile is larger than the sectorrsquos frequency ratio Results show that firms in the 90th percentile of markup distribution are overrepresented in wholesale trade and retail trade sectors the probability of a top decile firm being in these two sectorsmdashclassified as less-knowledge-intensive services according to the Eurostat definition
18 This value results from the following expression 100[exp(beta)minus1] where beta equals estimated top 90 percent dummy coefficients in an OLS regression where size is the dependent variable controlling for 4-digit and county fixed effects (table 3 column 1) 19 This value results from the following expression 100[exp(beta)minus1] where beta equals estimated top 90 percent dummy coefficients in an OLS regression where TFPR is the dependent variable controlling for 4-digit and county fixed effects (table 3 column 2) 20 The odds-ratio is computed as the relative difference between the marginal effects for each category (that is 42 percent for the top decile firms and 56 percent for firms below the 90th percentile) Specifically it is computed as follows (56 percent minus 42 percent)(42 percent)
17
(see table A12 in annex 1)mdashis almost 40 percent21 It is worth highlighting however that these top decile firms also operate in some knowledge-intensive services sectors though the probability is much smaller 387 percent for computer programming and 268 percent for security and investigating activities22
When taken together these results suggest that the small group of firms leading the overall increase in markups in Romania does not seem to follow the typical superstar firmsrsquo profile As discussed by Van Reenen (2018) and Autor et al (2017) superstar firmsmdashtypically with higher markups larger and more productive ndash would be rewarded with larger market shares due to their innovative nature This hypothesis does not seem to be supported by data in Romania As results showed the group of firms who are driving the aggregate rise in markupsmdashthe top decile firms of the markup distributionmdashare typically smaller less productive less likely to invest in intangible assets and are mostly active in services sectors where use and diffusion of knowledge is less important This may suggest that the increase in markups in Romania might reflect a less competition-intensive environment rather than changes in the nature of competition where superstar firms would be rewarded with greater market share because they are more efficient and innovative
Table 4 Probability of a top decile firm (in the markup distribution) being in the following sectors
2-digit sector Probability Wholesale trade 2436 Retail trade 1477 Computer programming 387 Manufacturing of wearing apparel 321 Real estate activities 314 Security and investigation activities 268
Source World Bank staff calculations based on SBS data set Note The table shows only sectors for which the probability of a firm being in the top decile of markup distribution is higher than the sectorrsquos overall frequency ratio
42 HOW HAVE FIRM DYNAMICS INFLUENCED AGGREGATE MARKUP PERFORMANCE ARE THERE SIGNS OF MARKET POWER CONSOLIDATION AMONG INCUMBENT FIRMS
To indirectly assess whether the rise in markups is associated with weakening competition the analysis decomposes the evolution of aggregate markups into that of incumbents and of net entry of firms To do so the Melitz and Polanec (2015) decomposition technique is applied to the aggregate markup changes between 2008 and 2017 This approach follows two steps First the aggregate (ln) markup (μ) at year t is defined as
21 Under the NACE 2-digit wholesale trade sector the group of top decile firms are overrepresented in the following NACE 4-digit sectors sector 4690ndashNon-specialized wholesale trade sector 4673ndashWholesale of wood construction materials and sanitary equipment sector 4621ndashWholesale of grain unmanufactured tobacco seeds and animal feeds sector 4646ndashWholesale of pharmaceutical goods sector 4675ndashWholesale of chemical products and sector 4631ndashWholesale of fruit and vegetables Under the NACE 2-digit retail services sector the sample of top decile firms are overrepresented in the following NACE 4-digit sectors sector 4711ndashRetail sale in non-specialized stores with food beverages or tobacco predominating and sector 4730mdashRetail sale of automotive fuel in specialized stores 22 The same analysis is applied for ownership structure again controlling for overrepresentation Results show that the sample of top decile firms are overrepresented in the fully foreign-owned ownership category
18
120583120583119895119895119895119895 = sum sum 119904119904119895119895119894119894119895119895119894119894isinΩ119895119895 120583120583119895119895119894119894119895119895119894119894isin119896119896119895119895 (9)
where sjit is firm irsquos market share at moment t where the market share is defined in terms of firm irsquos revenue weight over the total revenue of sector j (kj) where sector j is the sector to which firm i belongs Then the change of (ln) markup between moments t and tminus1 is decomposed as
Δ120583120583119895119895119895119895 = Δ120583119878119878119895119895119895119895 + Δ119862119862119879119879119907119907119878119878120583120583119878119878119895119895119894119894119895119895 119904119904119878119878119895119895119894119894119895119895 + 119904119904119864119864119895119895119895119895120583120583119864119864119895119895119895119895 minus 120583120583119878119878119895119895119895119895 + 119904119904119883119883119895119895119895119895120583120583119878119878119895119895119895119895 minus 120583120583119883119883119895119895119895119895 (10)
where the subindex S refers to survivor firms (that is those operating in both years t and tminus1 the subindex X denotes firms exiting the market or those firms present in moment tminus1 but not in moment t and E denotes entrants or those firms operating in moment t but not in moment tminus1 Each component expressed in equation (10) represents different drivers to explain aggregate change in markup over the period The first term is the change of the
unweighted average ln markup of survivors or the ldquowithinrdquo component Likewise is the change in the covariance between ln markup and market share for
survivors only This is the ldquobetweenrdquo component and it measures the reallocation of resources among surviving firms The term is the ldquoentryrdquo component and it measures
the difference of the aggregate ln markup of entrants and that of survivors at moment t weighted by the share of entrants over the total population of firms ( ) The entry component will be
positive if the aggregate markup of those firms entering the market is larger than the aggregate markup of the survivors Finally is the exit component which measures the
difference between the aggregate ln markup of survivors and exiting firms at moment tminus1 likewise weighted by the proportion of firms exiting the market that is This term is
positive if the aggregate ln markup of the exiting firms is lower than the aggregate ln markup of survivors In other words and as displayed in equation (10) aggregate markup can growshrink because (a) incumbent firms have increaseddecreased their markups (the ldquowithinrdquo component) (b) incumbent firms with high markups have gainedlost market share (the ldquobetweenrdquo component) and (c) entrant firms have higherlower markups than exiting firms (the ldquoentryrdquo or ldquoexitrdquo component)23
Results show that the increase in aggregate markups has been driven mostly by incumbents rather than entrants and exiting firms Decomposition results for the full sample of firms are displayed in figure 6 Estimations suggest that a large proportion of the aggregate increase in markup in Romania was driven by increases within incumbent firms (the ldquowithinrdquo bar) And among incumbents results show that the rise in markups reflects mostly a markup increase within firms rather than a reallocation of market share away from low-markup to high-markup companies (the ldquobetweenrdquo bar) Meanwhile the entry of new firms with lower markups pulled the change in aggregate markups down (the ldquoentryrdquo bar) and contribution from
23 SBS tends to underestimate entry and exit (populational) figures as a result of its sampling design In this regard the proposed analysis captures entry and exit in the enumerated stratum (above 20 employees) so results will be representative at least for the population of firms in the enumerated stratum
19
exiting firms was negligible
20
Figure 6 Decomposition of percentage change of (sales-weighted) average markup 2008ndash17
Source World Bank staff calculations based on SBS data set
This result could be interpreted as a sign of consolidation of market power among existing firms enabled by remaining product market regulations that restrict competition despite previous reforms Several policy-related factors can explain this result among them government interventions and regulations that restrict competition by reinforcing dominance or limiting entry facilitating collusive outcomes or increasing the cost to compete in markets and discriminating and protecting vested interests24 In this regard Pop and Ore Monago (2020) provide illustrative examples about the presence of regulations that still restrict competition in Romania drawing from the OECDndashWorld Bank Group (WBG) product market regulation (PMR) indicators data set which provides information across 70 countries25 The assessment uses the latest PMR round for Romania from 2013 and includes Romaniarsquos performance projected on the basis of information updated in 2017 Results suggest that the regulatory framework as it is in the books in Romania is less restrictive than that of countries such as Poland and the total sample average but it is more restrictive than that of the OECD and EU-15 countries However from an economywide perspective the overall restrictiveness of regulations in Romania is mainly associated with the state control of the economy and several remaining barriers to entry and rivalry (see figure 7)
24 In principle greater competition outcomes are enabled through an effective competition policy framework which involves three key pillars (a) fostering pro-competition regulations and government interventions (b) promoting competitive neutrality and non-distortive public aid and (c) enabling effective competition law and antitrust enforcement 25 The current PMR database used for this study includes Argentina Australia Austria Belgium Bolivia Brazil Bulgaria Canada Chile China Colombia Costa Rica Croatia Cyprus the Czech Republic Denmark the Dominican Republic Ecuador Arab Republic of Egypt El Salvador Estonia Finland France Germany Greece Guatemala Honduras Hungary Iceland India Indonesia Ireland Israel Italy Jamaica Japan Kenya the Republic of Korea Kuwait Latvia Lithuania Luxembourg Malta Mexico the Netherlands New Zealand Nicaragua Norway Panama Paraguay Peru the Philippines Poland Portugal Romania the Russian Federation Rwanda Senegal the Slovak Republic Slovenia South Africa Spain Sweden Switzerland Turkey Tunisia Ukraine Uruguay the United Kingdom and the United States
21
Figure 7 Product market regulation in Romania and comparator countries
Source Pop and Ore Monago 2020 Note The top five performers in the overall PMR indicator are the Netherlands United Kingdom Austria Denmark and New Zealand Figure shows 2013 information unless otherwise indicated PMR = product market regulation
Barriers to entry and rivalry still affect some service sectors In fact there are examples of regulations that hamper competition in retail trade which concentrates a substantial proportion of high-markup firms in the Romanian economy as seen previously Drawing from the OECD-WBG PMR data set Pop and Ore Monago (2020) show that although regulations in the retail trade sector are less restrictive than in the EU-15 and OECD there is still room for improvement to make the retail trade market more efficient The authors show that licenses and permit requirements may still be imposing an unnecessary burden on entry and increasing the costs to compete in the sector Companies operating in retail sectors in Romania are subject to requirements that go beyond the general conditions formalities and procedures applicable to any company For instance in Romaniarsquos clothing industry licenses and permits are always required compared with 57 percent of OECD countries and 60 percent of EU-15 countries which do not have such a requirement26 In addition Romania has regulations that impose restrictions on entry or expansion of business activities and constrain strategic options to compete in retail markets For instance most of the PMR countries and all top five performers do not restrict firms from selling below cost (beyond a prohibition of predatory pricing) and restrictions on sales promotions are not a common practice either27 In Romania sales below cost are prohibited or restricted beyond a prohibition of predatory pricing Likewise sales promotions are restricted to a particular time of the year28
43 DO FIRM MARKUPS DIFFER ACROSS FIRMS WITH DIFFERENT ATTRIBUTES
To answer this question the analysis explores how markup performance differs across different types of firms To assess the heterogeneity in markups the analysis relates markups to firm-level characteristics such as size age ownership status RampD status and location
26 In this case the least restrictive countries such as Bulgaria Latvia and Sweden do not have such requirements 27 Among the Central and Eastern Europe comparator countries only the Czech Republic and the Slovak Republic apply restrictions on discounted sales pricing while only Poland applies constraints to sales promotions 28 Government Ordinance no 992000 prohibits sales below costs and provides for the conditions and periods when certain types of promotions can take occur
5156 51 52 47 49 53
62 55
3830 42 40 43 39
4333 41
1114
6 9 10 125 5 4
113129 133 134 141 148 156
165 169
0
05
1
15
2
25
3
0
05
1
15
2
25
3
Top 5 -PMR SlovakRepublic
Hungary EU-15average
CzechRepublic
OECDaverage
2013
Romaniasim 2017
Poland Romania
State control (SC) Barriers to entry and rivalry (BER) Barriers to trade and investment (BTI)
Avg of all countries = 190
22
within narrowly defined product markets proxied by NACE 4-digit sectors The following regression is estimated
120583120583119888119888119895119895119894119894119895119895 = 1205751205750 + sum 12057512057511198961198961198791198791199001199001198991198991198961198961198881198881198951198951198941198941198951198957119896119896=2 + sum 1205751205752119903119903119904119904119886119886119904119904119886119886119903119903119888119888119895119895119894119894119895119895
3119903119903=2 + sum 1205751205752119902119902119886119886119886119886119886119886119902119902119888119888119895119895119894119894119895119895
3119902119902=2 + 1205751205753119889119889119888119888119895119895119894119894119895119895
119864119864119864119864119864119864 +1205751205754119889119889119888119888119895119895119894119894119895119895119877119877119877119877119889119889 + 1205751205755119896119896119888119888119895119895119894119894119895119895 + 120578120578119895119895 + 120588120588119895119895 + 120574120574119888119888 + 119906119906119888119888119895119895119894119894119895119895 (11)
where ownkcjit with k = 23hellip7 comprises a set of dummies defining the type of ownership of the firm Romanian private (omitted category) majority state-owned state-private ownership Romanian private and foreign fully foreign-owned public of national and local interest and other (cooperatives and craft organizations)29 The term sizercjit is a set of three dummies controlling for firmsrsquo sizemdashsmall or fewer than 50 employees (omitted category) medium or 51ndash250 employees and large more than 250 employees The term agercjit is a set of three age dummiesmdashyoung or less than 5 years old mature or 6ndash15 years old and older than 15 years Two dichotomous variables are also defined to capture export and RampD profiles dExp and dRnd which take a value of 1 if a firmrsquos direct exports represent more than 10 percent of a firmrsquos total revenue and if a firmrsquos RampD represents more than 1 percent of a firmrsquos total revenue respectively In addition kcjit is firmsrsquo total capital stock value (sum of tangible and intangible assets)30 Finally ηt ρj and γc are respectively time NACE 4-digit sector and county fixed effects Equation (11) is estimated separately for each 1-digit sector (that is manufacturing services and mining) and for the whole economy while the equation parameters are estimated by OLS always using heteroscedasticity-robust standard errors The complete set of results is displayed in table A15 in annex 1
Results show that ownership structure matters to explain markup differences across firms State-controlled companies tend to exert the highest markup premiums in the overall economy and especially in the manufacturing sector Table 5 displays the estimated coefficients of ownership categories multiplied by 100 Except for the mining sector most of estimated coefficients are statistically significant which suggests that ownership structure makes a difference to explain markup performance even for firms operating in the same product market (here proxied by NACE 4-digit sector) county location and year and with similar characteristics in terms of size age and export and RampD profile
In particular firms in which the state has majority or minority ownership demonstrate higher markups when compared with domestic privately owned companies (see table 5 column 4) The average difference in markup is higher for companies with minority state ownership (289 percent) than for fully state-owned companies (200 percent) In manufacturing markups of fully state-owned firms are the highest on average at 527 percent when compared with the reference category (domestic privately owned firms) Results in services are mixed with both private and state ownership extracting high premiums private firms with mixed domestic-foreign ownership show the highest average difference (279 percent) closely followed by minority state-owned companies for which the markup premium
29 More details about the original ownership classification in SBS and the aggregation used for the analysis can be found in table A13 and table A14 in annex 1 30 The variable lnTFPRkit is included as an additional control to test the robustness of the analysis See results in table A16 in annex 1
23
is 275 percent compared with the reference category 31 All results are robust to the inclusion of productivity as an additional control variable (see results in table A16 in annex 1)32
Table 5 Average markup differences by ownership structure relative to domestic privately owned firms
(1) Manufacturing
()
(2) Services
()
(3) Mining
()
(4) All sectors
() Majority state-owned 527 139 772 200 State-private ownership 352 275 ns 289 Domestic private + foreign 161 279 ns 229 Fully foreign-owned 105 263 ns 201 Public of national and local interest
209 149 ns 214
Source World Bank staff calculations based on SBS data set Note Numbers reflect estimated coefficients (multiplied by 100) for ownership dummy categoriesmdashrelative to Romanian private firms the omitted categorymdashin a fixed-effect regression model controlling for firm covariates plus year and NACE 4-digit sector fixed effects as displayed in equation (11) More details about the original ownership classification in SBS and aggregation used for the analysis can be found in table A13 and table A14 in annex 1 See table A15 in annex 1 for the complete set of results ns = not statistically significant
Larger firms and older companies wield higher markups when compared with their counterparts implying that firm size and age are relevant characteristics that influence markup differences As shown in figure 8 old companies (older than 15 years) display higher average markups than young ones (1ndash5 years old) even when they share similar attributes (in terms of ownership structure size and export and RampD profiles) and operate in the same NACE 4-digit sector county and year The estimated average markup premium for old companies (relative to young ones) is 54 percent for the whole economy It varies depending on how data are clustered across large sectors 79 percent in manufacturing 48 percent in services and 228 percent in mining Higher markup premiums for older companies can be interpreted in two ways it can reflect that more experienced firms are able to transpose learning returnsmdashwhich could positively affect their productivity or reduce their marginal costsmdashinto higher markups or that older firms are able to lobby better and create barriers to entry making it more difficult for younger firms to exert competitive pressure Firm size also matters to explain markup performance large companies (with more than 250 full-time employees) tend to display higher markups compared with small companies even when they operate in the same product market and share similar characteristics On average for the whole economy the
31 Results for the category ldquootherrdquo are not shown in table 5 As detailed in table A13 in annex 1 this ldquootherrdquo category refers to SBS ownership answer-codes 40 and 50 respectively ldquocooperativerdquo and ldquopublic of national and local interestrdquo The reason the corresponding results were not highlighted in the main text are twofold First the above-mentioned category accounts for only 006 percent of total companies in the sample Second an in-depth analysis would be needed to understand whether this ldquootherrdquo category reflects potential noise in the way firms self-classify their ownership structures or the way firms report cost expenditures (mainly) or whether this was influenced by SBS sampling design 32 Because the production approach applied in the current analysis delivers both markup and productivity estimates it is possible to further decompose the markup differences across firm characteristics and to verify whether after controlling for differences in marginal costs (that is productivity) certain groups of firms still have higher markups This is precisely one of the mitigating methods employed to reduce the conflation risk as highlighted before Results in table A16 in annex 1 should be interpreted as follows once productivity level is included in the equation differences in marginal cost are accounted for so the coefficient on ldquomajority state-ownedrdquo for instance captures the variation in average prices between majority state-owned and the size reference category (domestic privately owned firms)
24
markup premium for large companies is 122 percent higher than that of small firms (figure 9) Both size and age effects are still present even after controlling for productivity differences (see table A16 in annex 1)33
Figure 8 Average markup differences relative to young firms by age category
Figure 9 Average markup differences relative to small firms by size category
Source World Bank staff calculations based on SBS data set Note Numbers reflect estimated coefficients (multiplied by 100) for age dummy categoriesmdashrelative to young firms (1ndash5 years old) the omitted categorymdashin a fixed-effect regression model controlling for firm covariates plus year county and NACE 4-digit sector fixed effects as displayed in equation (11) All bars reflect statistically significant results See table A15 in annex 1 for the complete set of results
Source World Bank staff calculations based on SBS data set Note Numbers reflect estimated coefficients (multiplied by 100) for size dummy categoriesmdashrelative to small firms (1ndash50 employees) the omitted categorymdashin a fixed-effect regression model controlling for firm covariates plus year county and NACE 4-digit sector fixed effects as displayed in equation (11) All bars reflect statistically significant results See table A15 in annex 1 for the complete set of results
By the same token export intensity also influences markup performance with firms that export earning higher markups Being an exporter is a relevant firm feature to be analyzed when it comes to understanding markup performance Recent models of international trade predict that exporting firms earn higher markups than non-exporting firms either because they are relatively more productive and can thus undercut their rivals (see Melitz and Ottaviano 2008) or because they produce higher-quality goods and rely on higher-quality inputs which allow them to charge higher prices (see Hallak and Sivadasan 2009) In this regard the results summarized in figure 10 are consistent with the literature and suggest that exporting firmsmdashdefined as those whose direct exports represent more than 10 percent of total revenuemdashearn higher markups than non-exporting firms that operate in the same product market (NACE 4-digit sector) the difference ranges from 12 percent to 416 percent depending on how data are clustered across large sectors (manufacturing services and mining)
33 See footnote 32 on how to interpret results in table A16 in annex 1 (after including productivity as an additional control)
22
-160
158
7948
228
54
-505
101520253035
d
iffer
ence
Mature (between 6 and 15 years old)
Old (older than 15)
23
-830
090
327
169122
-15-55
152535
d
iffer
ence
Medium (between 51 and 250)
Large (more than 250 employees)
25
Figure 10 Average markup differences relative to non-exporters by export status
Figure 11 Average markup differences relative to non-RampD performers by RampD status
Source World Bank staff calculations based on SBS data set Note Numbers reflect estimated coefficients (multiplied by 100) for RampD dummy categorymdashrelative to non-RampD performer firms the omitted categorymdashin a fixed-effect regression model controlling for firm covariates plus year county and NACE 4-digit sector fixed effects as displayed in equation (11) All bars reflect statistically significant results See table A15 in annex 1 for the complete set of results
Source World Bank staff calculations based on SBS data set Note Numbers reflect estimated coefficients (multiplied by 100) for export dummy categorymdashrelative to non-exporters the omitted categorymdashin a fixed-effect regression model controlling for firm covariates plus year county and NACE 4-digit sector fixed effects as displayed in equation (11) All bars reflect statistically significant results See table A15 in annex 1 for the complete set of results
Performing RampD activities is positively correlated with markup differences while location proxied by county also matters to explain markup performance Results displayed in figure 11 show that RampD performersmdashidentified by those firms whose RampD expenses surpass more than 1 percent of their total revenuemdashtend to earn higher markups than non-RampD performers The markup premium for RampD performers is always positive suggesting that this group of firms is able to recoup fixed costs associated with RampD activities The magnitude of the premium varies from 16 percent to 46 percent depending how data are clustered across large sectors (manufacturing services and mining) In addition results displayed in figure 12 show that firms in the same product market (at NACE 4-digit level) and with similar characteristics (in terms of ownership age size and export and RampD profiles) charge different markups depending on the county in which they operate Except for Dolj firms in all other counties demonstrate lower average markups than Bucharest the negative markup premium in relation to Bucharest varies from minus154 percent (Vrancea) to minus36 percent (Satu-Mare)
12
258
416
119
05
101520253035404550
d
iffer
ence
160
340
460
273
05
101520253035404550
d
iffer
ence
26
Figure 12 Average markup differences by county relative to Bucharest
Source World Bank staff calculations based on SBS data set Note Numbers reflect estimated coefficients (multiplied by 100) for county fixed effectsmdashrelative to Bucharest the omitted categorymdashin a fixed-effect regression model controlling for firm covariates plus year and NACE 4-digit sector fixed effects as displayed in equation (11) All bars reflect statistically significant results See table A15 in annex 1 for the complete set of results
A variance decomposition analysis suggests that ownership is the most relevant characteristic to explain total variance of markup performance across firms in Romania followed by capital intensity and export status Drawing from estimations of equation (11) it is possible to evaluate the relative importance of each variable to explain the variance of the markup Letting dExp represent any of the explanatory variables of equation (11) the contribution to the variance of the markup of that variable can be defined as
119862119862119879119879119899119899119886119886119889119889119864119864119864119864119864119864 = 12057512057532119881119881119886119886119903119903119889119889119864119864119864119864119864119864+21205751205753119872119872119862119862119862119862(119889119889119864119864119864119864119864119864120583120583minus1205751205753119889119889119864119864119864119864119864119864)119881119881119886119886119903119903(120583120583)
(12)
or as the variance of the variable plus 2 times the covariance of the variable with the part of the markup not explained by that variable A similar expression can be derived for any of the remaining explanatory variables The relative contribution of each variable is computed after discounting the residuals sector and year contributions Results are displayed in figure 13 Ownership structure is shown to be the most relevant feature to explain the variance of markup performance across firms it accounts for 347 percent of the explained variance of markup performance (after removing NACE 4-digit sector and year contributions) The second most important characteristic is capital intensity corresponding to 214 percent of the variance of the markup performance Export status accounts for the third largest share in explained variance 113 percent
d
iffer
ence
27
Figure 13 Contribution by each firm characteristic to explain total variance of markup performance across firms
Source World Bank staff calculations based on SBS data set Note The pie chart reflects markup variance decomposition results It decomposes the variance of markup performance across firms after removing the proportion accounted for by omitted factors NACE 4-digit sector and year contributions
44 WHAT WOULD BE THE PRODUCTIVITY DIVIDENDS FROM MARKUP REDUCTION
While it became evident that aggregate market power in Romania has been rising it is important to analyze its consequences for economic growth An indirect way to measure this is to estimate the productivity dividends that would come from markup reduction The association between markup and productivity can be positive or negative depending on the nature of competition in the specific marketssectors As shown by Autor et al (2017) and Van Reenen (2018) there are marketsmdashsuch as high-tech sectors or knowledge-intensive onesmdashwhere the nature of competition tends to emphasize the importance of network effects economies of scale and scope and intangible assets so the most productive and dynamic firms exert higher markups and obtain larger market shares On the other hand in certain markets where recouping fixed costs (such as RampD) because of higher-risk investments is not that relevant high-markup firms are not necessarily more productive and efficient Another way to look at this contrast is through the inverted-U relationship of innovation and competition to an increase in productivity as explored by Aghion et al (2005) According to this view stronger competition (proxied here by smaller markups) encourages neck-and-neck firms to innovatemdashthe ldquoescape competitionrdquo effectmdashand therefore to increase productivity growth At the same time this view discourages laggard firms from innovating (the Schumpeterian effect) therefore reducing productivity growth The combination of the two effectsmdashescaping competition and discouraging innovationmdashexplains the inverted-U relationship of competition and innovation with productivity growth
To assess the correlation between productivity growth and markups in Romania the analysis uses firm-level estimations of TFPR and markups obtained so far Thus it estimates the specification presented in Aghion Braun and Fedderke (2008) as follows
Δ119889119889119899119899119879119879119897119897119897119897119877119877119888119888119895119895119894119894119895119895 = 1206011206010 + 1206011206011120583120583119888119888119895119895119894119894119895119895 + 120578120578119895119895 + 120588120588119895119895 + 120574120574119888119888 + 120592120592119888119888119895119895119894119894119895119895 (13)
where the left-hand-side variable represents TFPR growth of firm i in NACE 4-digit sector j in year t 120583120583119894119894119895119895119895119895minus1 is the lagged value of firm irsquos markup in sector j in year t ηt ρj and γc are
214
113
79
47
347
64
136
capital intensity Export status RampD status age ownership size region
28
respectively time NACE 4-digit sector and county fixed effects Equation (13) is estimated separately for each 1-digit sector (that is manufacturing services and mining) and for the whole economy while the equation parameters are estimated by OLS always using heteroscedasticity-robust standard errors
Figure 14 Productivity (TFPR) growth dividends from a 10 percent reduction of average markup by sector
Source World Bank staff calculations based on SBS data set Note Results from year county and 4-digit sector fixed effects Coefficient for mining was not statistically significant
Results shows that on average reducing markups would have a positive impact on aggregate productivity expansion Results displayed in table A18 in annex 1 suggest that lower (past) markups are associated with higher (current) productivity growth all coefficients for lagged markups are negative and statistically significant at conventional values for all sectors except mining Overall this negative correlation between past markup level and productivity growth is an indication of a positive association between competition and productivity growth which would be driven by the escape competition effect described by Aghion et al (2008)34
The magnitude of the economic effect of markup reduction on productivity growth is sizable Figure 14 shows that a 10 percent decrease in the average markup of 61 percent for the overall economy in the 2008ndash17 period would imply an increase in productivity (TFPR) growth of 082 percentage point per year The economic effect for the manufacturing sector would be substantially higher reducing the average markup of 403 percent for manufacturing in the same period would imply an increase in TFPR growth of 147 percentage points per year
Further productivity dividends stemming from markup reduction vary substantially across NACE 4-digit sectors The same specification expressed in equation (9) is estimated for each NACE 4-digit sector separately controlling for year and county fixed effects The TFPR growth dividends from markup reduction are computed for each NACE 4-digit sector drawing from the estimated coefficients (see table A18 in annex 1) Results vary substantially
34 An extended specificationmdashwhere the squared value of lagged markup is included as an additional dependent variablemdashwas also estimated The estimated coefficient of the squared term was not statistically significant (see results in table A17 in annex 1)
147
048
082
0
02
04
06
08
1
12
14
16
Manufacturing Services All
Perc
enta
ge p
oint
s per
yea
r
29
across sectors among those 4-digit sectors where the estimated coefficients are statistically significant the productivity growth dividends of a 10 percent decrease in markup vary from 701 percentage points to 016 percentage points respectively for NACE sector 1041ndashManufacture of oil and fats and sector 4649ndashWholesale of other household goods (figure 15)35 Productivity dividends from a potential markup reduction are also positive in sectors where the top decile firms in the markup distribution are overly represented for instance in sector 4711ndashRetail sale in non-specialized stores with food beverages or tobacco predominating a 10 percent decrease of average markup would be associated with an increase in TFPR growth of 022 percentage points per year For sector 4690ndashNon-specialized wholesale trade and sector 4673ndashWholesale of wood construction materials and sanitary equipment the productivity dividends would be 018 and 021 percentage points respectively
Figure 15 Productivity (TFPR) growth dividends from a 10 percent reduction of average markup Results by NACE 4-digit sector
Source World Bank staff calculations based on SBS data set
35 There are however some sectors where markup reduction brings detrimental impacts to productivity expansion See complete set of results in table A18in annex 1 for instance in NACE sector 8010ndashPrivate security activities and sector 2432ndashPrecious metals production where a reduction of average markup in the 2008ndash17 period would imply a decrease of TFPR growth of 030 percentage points and 663 percentage points respectively Following Aghion Braun and Fedderke (2008) the Schumpeterian effect of product market competition would be the underlying driver behind this result in these sectors competition reduces innovation incentives and therefore productivity growth by reducing the rents from innovations of firms below the technological frontier
00
10
20
30
40
50
60
70
80
Perc
enta
ge p
oint
s per
yea
r
30
5 CONCLUSIONS
A stylized fact emerging in the recent empirical literature is the increase in average levels of market power across countries in both developed and emerging economies This paper aims to bring new evidence about the evolution of corporate market power in Romania and the implications for competition dynamics It uses markups as a proxy for market power and explores firm-level heterogeneity to identify the underlying drivers of aggregate trends The paper applies the production approachmdashfollowing De Loecker and Warzynski (2012) De Loecker and Eeckhout (2018) and De Loecker Eeckhout and Unger (2020)mdashto estimate markup at the firm-year level for Romania The Romanian Structural Business Survey data set is used to apply this methodology
Results show that the aggregate markup in Romania increased by around 15 percent between 2008 and 2017 However this aggregate performance masks a lot of heterogeneity the first being heterogeneity of markups across the main sectors While in manufacturing (sales-weighted) average markups experienced a declining pattern of minus57 percent during 2008ndash17 there was an opposite and much more rapid trend in services with an aggregate change of 422 percent
Second at the firm level results suggest that a key driving force behind this aggregate trend was the ability of the top decile of firms in the markup distribution to increase their markups This increase has been faster than for the rest of the firms Firms in the 90th percentile of the markup distribution increased their (sales-weighted) average markup by 285 percent between 2008 and 2017 while the rest of firms (that is those below the top decile firms) experienced a completely opposite trend their weighted markup contracted by 83 percent over the same period
This sample of top decile firms does not seem to follow the typical superstar firmsrsquo profile which suggests that the increase in markups in Romania might be associated with an environment that is less conducive to competition The top decile firms in the markup distribution are 468 percent smaller 910 percent less productive and 33 percent less likely to invest in intangible assets than the rest of the firms in the markup distribution and they are overrepresented in less knowledge-intensive service sectors Therefore they do not seem to follow the typical superstar firmsrsquo profile (typically larger more productive and more likely to invest in intangible assets) This suggests that the increase in markups in Romania might be more due to relatively weak competition rather than to changes in the nature of competition where superstar firms (usually more efficient and innovative) are rewarded with greater market share In fact a decomposition exercise shows that the increase in aggregate markups has been driven mostly by incumbents rather than by new entrants and exiting firms These results could be interpreted as a sign of consolidation of market power among existing firms Several policy-related factors could explain this result among them government interventions and regulations that restrict competition by reinforcing dominance or limiting entry facilitating collusive outcomes or increasing the cost to compete in markets and by discriminating and protecting vested interests In this regard illustrative evidence provided by Pop and Ore Monago (2020) shows that despite reforms regulations that restrict entry and rivalry are still present in the retail trade sector which concentrates a substantial proportion of high-markup firms in the Romanian economy
31
Results also show that certain firm characteristics matter in explaining differences in markup performance size age RampD profile export propensity location and notably ownership State-controlled companies tend to demonstrate the highest markup premiums when compared with domestic privately owned companies 289 percent higher for minority state-owned companies and 20 percent higher for fully state-owned companies Old companies (older than 15 years) display 54 percent higher markups on average than young ones no matter the product market (at NACE 4-digit level) where they operate The markup premium for large companies (with more than 250 full-time employees) is 122 percent higher than that of small firms in the overall economy Exporting firmsmdashthose whose direct exports represent more than 10 percent of total revenuemdashearn 119 percent higher markups than non-exporting firms that operate in the same sector At the same time results show that the markup premium for RampD performers (compared with non-RampD performers) is 273 percent for the whole economy and that firms operating in the same product market charge different markups depending on the county where they operate Overall while all these features matter to explain markup performance a variance decomposition analysis suggests that ownership is the most relevant characteristic to explain total variance of markup performance across firms in Romania
In this context given that ownership assumes a prominent role to explain markup performance it is important to ensure competitively neutral policies across markets where private and public enterprises compete The prominent role of ownership in explaining total variance of markup performance across firms combined with the evidence that state-controlled companies tend to exert the highest markup premiums in the overall economy highlights the importance of ensuring competitive neutrality in Romania so that private and public enterprises compete on a fair basis Analysis presented in Pop and Ore Monago (2020) shows that state-owned enterprises (SOEs) in Romania compete on uneven terms with the private sector because of gaps in terms of both the current regulatory framework as well as its implementation As for the regulatory framework itself lack of competitive neutrality emerges from restrictive SOE governance rules and the exemption of newly setup SOEs from the corporate governance law lack of rules mandating the separation of commercial and noncommercial functions despite legal separation (for example in the railway and energy sectors) and the lack of specific provisions that require SOE investments to show positive rates of returns With regard to implementation of the regulatory framework competitive neutrality gaps stem from (a) the protracted application of corporate governance rules (b) fragmentation of SOE oversight across institutions with frequent overlaps (c) inconsistent reporting of SOE performance that prevents full monitoring and comparability with the private sector performance in comparable situations (d) little clarity in terms of compensation for public service obligations and (e) lack of transparency in state aid allocation
Finally the analysis shows that productivity dividends arise from increased competition in Romania As such lowering markups can boost productivity growth A 10 percent decrease in the average markup for the overall economy during 2008ndash17 would imply an increase in productivity (TFPR) growth of 082 percentage point per year The effect for the manufacturing sector is higher (147 percentage points per year) but lower for services (048 percentage point per year) The ldquoescape competitionrdquo effect described by Aghion Braun and Fedderke (2008)mdashthrough which fiercer competition induces firms to innovate to escape competition with the fringe therefore increasing productivity growthmdashwould be the underlying driver behind these average results for the manufacturing industry Results vary substantially across sectors among
32
those 4-digit sectors where the estimated coefficients are statistically significant the productivity growth dividend of a 10 percent decrease in markup varies from 701 percentage points (sector 1041ndashManufacture of oil and fats) to 016 percentage point (sector 4649ndashWholesale of other household goods)
In this context boosting competition becomes a key part of the engine to drive productivity growth and help consolidate Romaniarsquos convergence to a high-income level Implementing pro-competition policies is instrumental Besides removing anticompetitive regulations and promoting competitive neutrality policy makers should ensure that state aid is allocated in a non-distortive way and enable more effective competition law and antitrust enforcement
33
REFERENCES
Ackerberg D K Caves and G Frazer 2015 ldquoIdentification Properties of Recent Production Function Estimatorsrdquo Econometrica 83 (6) 2411ndash51
Aghion P N Bloom R Blundell R Griffith and P Howitt 2005 ldquoCompetition and Innovation An Inverted-U Relationshiprdquo Quarterly Journal of Economics 120 (2) 701minus28
Aghion P M Braun and J Fedderke 2008 ldquoCompetition and Productivity Growth in South Africardquo Economics of Transition 16 (4) 741ndash68
Autor D D Dorn F Lawrence C Patterson and J Van Reenen 2017 ldquoThe Fall of the Labor Share and the Rise of Superstar Firmsrdquo NBER Working Paper 23396 National Bureau of Economic Research Cambridge MA
Barkai S 2020 ldquoDeclining Labor and Capital Sharesrdquo Journal of Finance 75 (5) 2421ndash63
Bartelsman E J and M Doms 2000 ldquoUnderstanding Productivity Lessons from Longitudinal Microdatardquo Journal of Economic Literature 38 (3) 569ndash94
Berry S J Levinsohn and A Pakes 1995 ldquoAutomobile Prices in Market Equilibriumrdquo Econometrica Journal of the Econometric Society 63 (4) 841ndash90
Berry S J Levinsohn and A Pakes 2004 ldquoDifferentiated Products Demand Systems from a Combination of Micro and Macro Data The New Car Marketrdquo Journal of Political Economy 112 (1) 68ndash105
Bessen J 2017 ldquoInformation Technology and Industry Concentrationrdquo Law and Economics Paper No 17-41 Boston University School of Law Boston
Bond S A Hashemi G Kaplan and P Zoch 2020 ldquoSome Unpleasant Markup Arithmetic Production Function Elasticities and their Estimation from Production Datardquo NBER Working Paper No 27002 National Bureau of Economic Research Cambridge MA
Bresnahan T F 1989 ldquoEmpirical Studies of Industries with Market Powerrdquo In Handbook of Industrial Organization Vol 2 edited by R Schmalensee and R Willig 1011ndash57 Amsterdam Elsevier
Cameron A C and P K Trivedi 2010 Microeconometrics Using Stata (Rev ed) College Station TX Stata Press
Crouzet N and J Eberly 2018 ldquoUnderstanding Weak Capital Investment The Role of Market Concentration and Intangiblesrdquo NBER Working Paper 25869 National Bureau of Economic Research Cambridge MA De Loecker J 2011 ldquoRecovering Markups from Production Datardquo International Journal of Industrial Organization 29 (3) 350ndash55
De Loecker J 2013 ldquoDetecting Learning by Exportingrdquo American Economic Journal Microeconomics 5 (3) 1ndash21
De Loecker J and J Eeckhout 2018 ldquoGlobal Market Powerrdquo NBER Working Paper 24768 National Bureau of Economic Research Cambridge MA
De Loecker J J Eeckhout and G Unger 2020 ldquoThe Rise of Market Power and the Macroeconomic Implicationsrdquo Quarterly Journal of Economics 135 (2) 561ndash644 httpsdoiorg101093qjeqjz041
34
De Loecker J and F Warzynski 2012 ldquoMark-ups and Firm-Level Export Statusrdquo American Economic Review 102 (6) 2437ndash71
Diacuteez F D Leigh and S Tambunlertchai 2018 ldquoGlobal Market Power and Its Macroeconomic Implicationsrdquo IMF Working Paper 18137 International Monetary Fund Washington DC
Grullon G Y Larkin and R Michaely 2018 ldquoAre US Industries Becoming More Concentratedrdquo Swiss Finance Institute Research Paper No 19-41 httpdxdoiorg102139ssrn2612047
Gutieacuterrez G and T Philippon 2017a ldquoDeclining Competition and Investment in the USrdquo NBER Working Paper 23583 National Bureau of Economic Research Cambridge MA Gutieacuterrez G and T Philippon 2017b ldquoInvestment-less Growth An Empirical Investigationrdquo Brookings Papers on Economic Activity (Fall) 89ndash182 Gutieacuterrez G and T Philippon 2018 ldquoHow EU Markets Became More Competitive than US Markets A Study of Institutional Driftrdquo NBER Working Paper 24700 National Bureau of Economic Research Cambridge MA
Hall R 1988 ldquoThe Relation between Price and Marginal Cost in US Industryrdquo Journal of Political Economy 96 (5) 921ndash47
Hallak J and J Sivadasan 2009 ldquoExporting Behavior under Quality Constraintsrdquo NBER Working Paper 14928 National Bureau of Economic Research Cambridge MA
IMF (International Monetary Fund) 2019 World Economic Outlook April 2019 Growth Slowdown Precarious Recovery Washington DC International Monetary Fund
Koujianou Goldberg P and R Hellerstein 2012 A Structural Approach to Identifying the Sources of Local Currency Price Stability Review of Economic Studies 80 (1) 175ndash210
Melitz M J and G Ottaviano 2008 ldquoMarket Size Trade and Productivityrdquo Review of Economic Studies 75 (1) 295ndash316
Melitz M J and S Polanec 2015 ldquoDynamic Olley-Pakes Productivity Decomposition with Entry and Exitrdquo RAND Journal of Economics 46 (2) 362ndash75
Motta M 2004 Competition Policy Theory and Practice Cambridge MA Cambridge University Press
Pop G and T Ore Monago 2020 ldquoCompetition and Government Interventions in Romania An Assessment with Focus on Product Market Regulations and Competitive Neutralityrdquo Background paper for Markets and People Romania Country Economic Memorandum International Development in Focus World Bank Washington DC
Shapiro C 2018 ldquoAntitrust in a Time of Populismrdquo International Journal of Industrial Organization 61 714ndash48
Syverson C 2004 ldquoProduct Substitutability and Productivity Dispersionrdquo Review of Economics and Statistics 86 (2) 534ndash50
Van Reenen J 2018 ldquoIncreasing Differences between Firms Market Power and the Macroeconomyrdquo CEPR Discussion Paper 1576 Center for Economic and Policy Research Washington DC
35
World Bank 2020a ldquoMarkets and People Romania Country Economic Memorandumrdquo International Development in Focus World Bank Washington DC
World Bank 2020b ldquoAssessing the Direct and Indirect Impact of State Aid in Romania An Ex-post Evaluationrdquo World Bank Washington DC
36
ANNEX 1 ADDITIONAL FIGURES AND TABLES
Figure A11 Evolution of (sales-weighted) average markup in manufacturing sector by technology intensity 2008ndash17
Source World Bank staff calculations based on SBS data set
Table A11 Manufacturing industry groups by technology intensity Eurostat classification
85
99
51
Mar
k-up i
ndex
(200
8 = 1
)
2008 2009 2010 2011 2012 2013 2014 2015 2016 2017Year
Manuf High-tech
37
Source Eurostat Indicators on High-Tech Industry and KnowledgendashIntensive Services annex 3 httpseceuropaeueurostatcachemetadataAnnexeshtec_esms_an3pdf
38
Figure A12 Evolution of (sales-weighted) average markup in services sector by knowledge intensity
39
Table A12 Services groups by knowledge intensity Eurostat classification
40
Source Eurostat Indicators on High-Tech Industry and KnowledgendashIntensive Services annex 3 httpseceuropaeueurostatcachemetadataAnnexeshtec_esms_an3pdf
41
Table A13 Original ownership classification from SBS SBS Code Description
10 Fully state-owned Majority state-owned (statepublic capital gt 50 of equity)
21 State + Romanian private 22 State + foreign 23 State + Romanian private + foreign
Majority privately owned (private capital ge 50 of equity) 26 State + Romanian private 27 State + foreign 28 State + Romanian private + foreign
Fully privately owned 31 Romanian private 32 Romanian private + foreign 40 Cooperative 50 Craft organizations 60 Fully foreign-owned 70 Public of national and local interest
Source World Bank staff calculations based on SBS data set
Table A14 Ownership classification adopted in the analysis SBS codes (combined) Description
10 21 22 23 State owned (fully + majority state-owned) 26 27 28 Private-public (majority private)
31 Fully private (domestic) 32 Fully private (domestic + foreign) 60 Fully private (fully foreign) 70 Public of national and local interest
40 50 Other Source World Bank staff calculations based on SBS data set
Table A15 Conditional correlations between firm characteristics and markup performance regression results
Variable Manufacturing Services Mining All Capital stock (ln) minus0150 minus0039 minus0067 minus0066 Export dummy 0120 0258 0416 0119 RampD dummy 0160 0340 0460 0273 Mature 0022 minus0016 0158 minus0005 Old 0079 0048 0228 0054 Majority state-owned 0527 0139 0772 0200 State-private ownership 0352 0275 0111 0289 Romanian private + foreign 0161 0279 0096 0229 Fully foreign-owned 0105 0263 0 0201 Public of national and local interest 0209 0149 (omitted) 0214 Other 0884 0555 (omitted) 0758 Medium 0230 minus0083 0011 0009 Large 0327 0169 minus0015 0122 1 Alba 0106 minus0087 minus0151 minus0042 2 Arad 0038 minus0090 minus0148 minus0077 3 Arges minus0005 minus0053 minus0195 minus0060
42
Variable Manufacturing Services Mining All 4 Bacau 0092 minus0090 minus0194 minus0055 5 Bihor 0036 minus0115 minus0256 minus0088 6 Bistrita-Nasaud minus0064 minus0156 minus0069 minus0144 7 Botosani 0046 minus0089 minus0438 minus0076 8 Brasov 0041 minus0047 0049 minus0040 9 Braila 0133 minus0055 minus0265 minus0025 10 Buzau 0017 minus0123 minus0025 minus0100 11 Caras-Severin 0035 minus0187 minus0005 minus0139 12 Cluj minus0004 minus0094 minus0119 minus0088 13 Constanta 0057 minus0105 0062 minus0088 14 Covasna 0038 minus0056 minus0151 minus0052 15 Dambovita 0005 minus0183 minus0154 minus0144 16 Dolj 0195 0060 minus0042 0079 17 Galati 0106 minus0007 minus0276 0004 18 Gorj 0084 0028 minus0116 0026 19 Harghita 0101 minus0102 minus0007 minus0045 20 Hunedoara 0167 minus0031 minus0057 0011 21 Ialomita 0138 minus0049 minus0265 minus0027 22 Iasi minus0014 minus0038 minus0384 minus0058 23 Ilfov 0011 0009 0314 0010 24 Maramures 0094 minus0020 minus0042 0 25 Mehedinti 0113 minus0136 minus0720 minus0096 26 Mures 0048 minus0063 minus0093 minus0048 27 Neamt 0001 minus0108 minus0428 minus0102 28 Olt 0073 minus0005 minus0397 minus0011 29 Prahova 0018 minus0034 minus0028 minus0043 30 Satu-Mare 0033 minus0024 minus0056 minus0036 31 Salaj 0075 minus0045 minus0448 minus0031 32 Sibiu 0044 minus0038 minus0154 minus0041 33 Suceava 0044 minus0087 minus0111 minus0074 34 Teleorman 0103 minus0099 minus0299 minus0062 35 Timis 0030 minus0020 minus0341 minus0037 36 Tulcea 0142 minus0149 0096 minus0078 37 Vaslui 0091 minus0017 minus0105 minus0007 38 Valcea 0078 minus0008 minus0122 minus0002 39 Vrancea minus0061 minus0163 minus0608 minus0154 51 Calarasi 0080 minus0122 0672 minus0075 52 Giurgiu 0052 minus0064 minus0334 minus0066
_cons 2147 1150 2291 2246 NACE 4-digit fixed effects Yes Yes Yes Yes
Year fixed effects Yes Yes Yes Yes
R2 0345 0235 0254 0279 Source World Bank staff calculations based on SBS data set Note Dependent variable = ln(markup) denotes significance level at 1 percent at 5 percent and at 10 percent
43
44
Table A16 Conditional correlations between firm characteristics (including productivity) and markup performance regression results
Variable Manufacturing Services Mining All Capital stock (ln) minus0149 minus0038 minus0065 minus0066 Export dummy 0116 0257 0400 0118 RampD dummy 0182 0366 0449 0295 Mature 0021 minus0014 0164 minus0003 Old 0079 0052 0228 0057 Majority state-owned 0529 0147 0758 0209 State-private ownership 0351 0274 0118 0288 Romanian private + foreign 0156 0275 0090 0225 Fully foreign-owned 0096 0254 minus0011 0192 Public of national and local interest 0179 0165 (omitted) 0233 Other 0879 0561 (omitted) 0759 Medium 0232 minus0083 0002 0010 Large 0327 0170 minus0016 0122
Productivity (TFPR) 0051 0020 0041 0024 1 Alba 0114 minus0081 minus0156 minus0035 2 Arad 0045 minus0085 minus0135 minus0071 3 Arges 0001 minus0049 minus0196 minus0056 4 Bacau 0098 minus0084 minus0188 minus0049 5 Bihor 0042 minus0111 minus0268 minus0083 6 Bistrita-Nasaud minus0057 minus0150 minus0055 minus0137 7 Botosani 0053 minus0082 minus0443 minus0069 8 Brasov 0045 minus0042 0033 minus0035 9 Braila 0139 minus0048 minus0243 minus0018 10 Buzau 0022 minus0118 minus0002 minus0094 11 Caras-Severin 0042 minus0178 minus0001 minus0131 12 Cluj minus0001 minus0089 minus0120 minus0083 13 Constanta 0067 minus0101 0056 minus0084 14 Covasna 0045 minus0050 minus0166 minus0046 15 Dambovita 0010 minus0180 minus0162 minus0140 16 Dolj 0202 0068 minus0054 0087 17 Galati 0114 minus0001 minus0289 0010 18 Gorj 0091 0037 minus0118 0035 19 Harghita 0108 minus0096 minus0005 minus0039 20 Hunedoara 0173 minus0025 minus0055 0018 21 Ialomita 0144 minus0045 minus0256 minus0023 22 Iasi minus0005 minus0034 minus0394 minus0053 23 Ilfov 0013 0012 0296 0013 24 Maramures 0101 minus0013 minus0038 0007 25 Mehedinti 0128 minus0132 minus0729 minus0090 26 Mures 0053 minus0057 minus0105 minus0042 27 Neamt 0010 minus0101 minus0434 minus0094
45
Variable Manufacturing Services Mining All 28 Olt 0082 0002 minus0402 minus0004 29 Prahova 0023 minus0029 minus0032 minus0039 30 Satu-Mare 0038 minus0018 minus0047 minus0030 31 Salaj 0081 minus0039 minus0433 minus0025 32 Sibiu 0044 minus0034 minus0147 minus0038 33 Suceava 0051 minus0081 minus0105 minus0068 34 Teleorman 0117 minus0092 minus0296 minus0053 35 Timis 0033 minus0014 minus0340 minus0032 36 Tulcea 0147 minus0142 0078 minus0072 37 Vaslui 0101 minus0011 minus0104 0 38 Valcea 0087 minus0002 minus0120 0004 39 Vrancea minus0053 minus0158 minus0602 minus0148 51 Calarasi 0086 minus0118 0673 minus0071 52 Giurgiu 0059 minus0060 minus0334 minus0061
_cons 1632 0993 1934 2036 NACE 4-digit fixed effects Yes Yes Yes Yes
Year fixed effects Yes Yes Yes Yes
R2 0347 0235 0255 0280 Source World Bank staff calculations based on SBS data set Note Dependent variable = ln(markup) denotes significance level at 1 percent at 5 percent and at 10 percent
Table A17 Productivity growth and markup performance regression results
All Manufacturing Services Mining
Lag markup minus0025 minus0028 minus0026 minus0027 minus0025 minus0027 minus0012 minus0024
Lag markup squared 0001 0000 0001 0003 NACE 4-digit sector fixed effects Yes Yes Yes Yes Yes Yes Yes Yes County fixed effects Yes Yes Yes Yes Yes Yes Yes Yes Year fixed effects Yes Yes Yes Yes Yes Yes Yes Yes
Observations 245525 245525 76694 76694 167120 167120 1711 1711 Source World Bank staff calculations based on SBS data set Note Dependent variable = TFPR growth denotes significance level at 1 percent at 5 percent and at 10 percent
46
Table A18 Productivity (TFPR) growth dividends from a 10 reduction of average markup results by NACE 4-digit sector
NACE 4-digit sector Gain in TFPR growth per
year (percentage points)
1041ndashManufacture of oils and fats 7015 4331ndashPlastering 5547 2060ndashManufacture of man-made fibers 5286 2824ndashManufacture of power-driven hand tools 4869 1072ndashManufacture of rusks and biscuits manufacture of preserved pastry goods and cakes
4145
1104ndashManufacture of other non-distilled fermented beverages 3984 1723ndashManufacture of paper stationery 3716 2812ndashManufacture of fluid power equipment 3566 2452ndashCasting of steel 3278 1101ndashDistilling rectifying and blending of spirits 3134 1420ndashRaising of other cattle and buffaloes 3072 2011ndashManufacture of industrial gases 3033 2593ndashManufacture of wire products chain and springs 2689 2829ndashManufacture of other general-purpose machinery nec 2641 4910ndashPassenger rail transport interurban 2629 2451ndashCasting of iron 2615 3821ndashTreatment and disposal of non-hazardous waste 2375 2059ndashManufacture of other chemical products nec 2336 2920ndashManufacture of bodies (coachwork) for motor vehicles manufacture of trailers and semi-trailers
2270
1051ndashOperation of dairies and cheese making 2224 3313ndashRepair of electronic and optical equipment 2160 1081ndashManufacture of sugar 2158 1073ndashManufacture of macaroni noodles couscous and similar farinaceous products 2081 4213ndashConstruction of bridges and tunnels 2077 2223ndashManufacture of buildersrsquo ware of plastic 2011 2550ndashForging pressing stamping and roll-forming of metal powder metallurgy 1949 2313ndashManufacture of hollow glass 1926 2825ndashManufacture of non-domestic cooling and ventilation equipment 1889 2020ndashManufacture of pesticides and other agrochemical products 1818 2571ndashManufacture of cutlery 1758 5914ndashMotion picture projection activities 1691 5920ndashSound recording and music publishing activities 1665 3514ndashTrade of electricity 1653 1310ndashPreparation and spinning of textile fibers 1616 4920ndashFreight rail transport 1613 4339ndashOther building completion and finishing 1586 2620ndashManufacture of computers and peripheral equipment 1543 4311ndashDemolition 1515 3832ndashRecovery of sorted materials 1404 3523ndashTrade of gas through mains 1382 2410ndashManufacture of basic iron and steel and of ferro-alloys 1353 2399ndashManufacture of other non-metallic mineral products nec 1272 2017ndashManufacture of synthetic rubber in primary forms 1258 7711ndashRental and leasing of cars and light motor vehicles 1256 4212ndashConstruction of railways and underground railways 1128 2453ndashCasting of light metals 1080 7410ndashSpecialized design activities 1068 5630ndashBeverage serving activities 1065 4211ndashConstruction of roads and motorways 0989 4677ndashWholesale of waste and scrap 0926 4676ndashWholesale of other intermediate products 0917 4120ndashConstruction of residential and non-residential buildings 0912 4623ndashWholesale of live animals 0890 6820ndashRental and operating of own or leased real estate 0826 4110ndashDevelopment of building projects 0824
47
NACE 4-digit sector Gain in TFPR growth per year
(percentage points) 4613ndashAgents involved in the sale of timber and building materials 0823 4322ndashPlumbing heat and air-conditioning installation 0731 5629ndashOther food service activities 0699 4791ndashRetail sale via mail order houses or via internet 0659 4941ndashFreight transport by road 0659 4618ndashAgents specialized in the sale of other particular products 0646 7219ndashOther research and experimental development on natural sciences and engineering 0623 4617ndashAgents involved in the sale of food beverages and tobacco 0609 5510ndashHotels and similar accommodation 0560 4615ndashAgents involved in the sale of furniture household goods hardware and ironmongery
0541
4633ndashWholesale of dairy products eggs and edible oils and fats 0540 4778ndashOther retail sale of new goods in specialized stores 0527 4621ndashWholesale of grain unmanufactured tobacco seeds and animal feeds 0517 4662ndashWholesale of machine tools 0501 6110ndashWired telecommunications activities 0491 4634ndashWholesale of beverages 0468 5610ndashRestaurants and mobile food service activities 0463 4631ndashWholesale of fruit and vegetables 0426 4532ndashRetail trade of motor vehicle parts and accessories 0394 1411ndashManufacture of leather clothes 0390 4511ndashSale of cars and light motor vehicles 0382 4637ndashWholesale of coffee tea cocoa and spices 0361 4645ndashWholesale of perfume and cosmetics 0354 1419ndashManufacture of other wearing apparel and accessories 0344 4643ndashWholesale of electrical household appliances 0335 4639ndashNon-specialized wholesale of food beverages and tobacco 0285 4619ndashAgents involved in the sale of a variety of goods 0281 4675ndashWholesale of chemical products 0249 4711ndashRetail sale in non-specialized stores with food beverages or tobacco predominating 0223 4673ndashWholesale of wood construction materials and sanitary equipment 0214 4690ndashNon-specialized wholesale trade 0188 4649ndashWholesale of other household goods 0158 8010ndashPrivate security activities minus0300 8220ndashActivities of call centres minus0323 2572ndashManufacture of locks and hinges minus0503 7120ndashTechnical testing and analysis minus0511 3315ndashRepair and maintenance of ships and boats minus0512 3600ndashWater collection treatment and supply minus0547 4754ndashRetail sale of electrical household appliances in specialized stores minus0627 2341ndashManufacture of ceramic household and ornamental articles minus0646 7111ndashArchitectural activities minus0649 6120ndashWireless telecommunications activities minus0746 7312ndashMedia representation minus1023 4334ndashPainting and glazing minus1200 5020ndashSea and coastal freight water transport minus1276 1052ndashManufacture of ice cream minus1367 5911ndashMotion picture video and television programme production activities minus1439 2592ndashManufacture of light metal packaging minus1619 2752ndashManufacture of non-electric domestic appliances minus1729 2521ndashManufacture of central heating radiators and boilers minus1843 4932ndashTaxi operation minus2568 2013ndashManufacture of other inorganic basic chemicals minus3524 1711ndashManufacture of pulp minus3631 4942ndashRemoval services minus4214 1092ndashManufacture of prepared pet foods minus4262 3040ndashManufacture of military fighting vehicles minus5508 2432ndashCold rolling of narrow strip minus6629
Source World Bank staff calculations based on SBS data set Note The table displays only sectors for which estimated coefficients are statistically significant
48
- 1 Introduction and motivation
- 2 Methodology
- 3 Data set
- 4 Results
-
- 41 Has corporate market power increased at the aggregate level How do aggregate trends differ across sectors Is there a group of firms driving the overall trend
- 42 How have firm dynamics influenced aggregate markup performance Are there signs of market power consolidation among incumbent firms
- 43 Do firm markups differ across firms with different attributes
- 44 What would be the productivity dividends from markup reduction
-
- 5 Conclusions
- References
- Annex 1 Additional figures and tables
-

11
4 RESULTS
41 HAS CORPORATE MARKET POWER INCREASED AT THE AGGREGATE LEVEL HOW DO AGGREGATE TRENDS DIFFER ACROSS SECTORS IS THERE A GROUP OF FIRMS DRIVING THE OVERALL TREND
Results show that the average markup in Romania increased by around 15 percent during 2008ndash17 However this expansion was marked by an uneven trend Figure 1 panel a displays the evolution of the (sales-weighted) aggregate markup for the 2008ndash17 period for the whole economy (aggregating manufacturing services and mining) At aggregate level average markups experienced a 15 percent aggregate increase from 2008 to 2017 However three alternating trends are detected in this whole period a sharp increase of more than 15 percent during 2008ndash09 a strong decline after 2009 when markups fell by 23 percent from 2009 to 2012 and a consistent increase of 215 percent from 2012 to 2017
Figure 1 Evolution of (sales‐weighted) average markup by sector 2008ndash17 a All sectors b Manufacturing
c Services d Mining
Source World Bank staff calculations based on SBS data set
Because aggregate numbers mask a lot of heterogeneity it is not surprising to see
92
94
96
98
11
02M
ark-
up in
dex
(200
8 =
1)
2008 2009 2010 2011 2012 2013 2014 2015 2016 2017Year
Manufacturing
11
11
21
31
4M
ark-
up in
dex
(200
8 =
1)
2008 2009 2010 2011 2012 2013 2014 2015 2016 2017Year
Services
51
15
22
5M
ark-
up in
dex
(200
8 =
1)
2008 2009 2010 2011 2012 2013 2014 2015 2016 2017Year
Mining
12
different trends when unraveling markups across sectors Because of their intrinsic characteristics firms are different from each other and contrast in terms of performance even within very narrowly defined sectors (Syverson 2004) These differences could persist either because of supply-side factors such as management skills RampD or investment patterns (Bartelsman and Doms 2000) or because of demand-side factors related to product differentiation customer-producer relationships geographical segmentation among others That said firms across high-level sectorsmdashmanufacturing services and miningmdashhave shown varied performance While the manufacturing (sales-weighted) average markup experienced a decline of minus57 percent over the 2008ndash17 period (figure 1 panel b) there was an opposite and much more rapid trend in services with an aggregate change of 422 percent (see figure 1 panel c) Weighted average markup in mining experienced an uneven trend throughout the same period Nuances are unveiled even within sectors as aggregate markup performance shows different patterns when breaking manufacturing down into groups of sectors according to their technology intensity14 This is also observed when services are broken down into groups of sectors according to their knowledge intensity15 (see figure A11 and figure A12 in annex 1)
Further there is also evidence of changes in the markup firm distribution from 2008 to 2017 revealing an increasing proportion of firms with relatively high markups Figure 2 displays the firm-level distribution of markups in 2008 and 2017 Some changes are noteworthy First both the mean and variance increased over that period But more importantly the upper tail of the distribution became fatter over time suggesting that in 2017 more firms have higher markups than in 2008 This suggests that the rise in average markups is associated with large increases among the firms with the highest markups
14 As per Eurostat classification manufacturing sectors are classified as high-technology medium-high-technology medium-low-technology and low-technology according to technological intensity (RampD expenditure or value added) and based on the statistical classification of economic activities in the European Community (NACE) at the 2-digit level See table A11 in annex 1 with sector aggregation 15 As per Eurostat classification service sectors are classified as knowledge-intensive services (KIS) and less-knowledge-intensive services (LKIS) KISs comprise knowledge-intensive market services high-tech knowledge-intensive services knowledge-intensive financial services and other knowledge-intensive services LKIS comprise less-knowledge-intensive market services and other less-knowledge-intensive services Both KIS and LKIS are based on the share of tertiary educated persons at the NACE 2-digit level See table A12 in annex 1 with sector aggregation
13
Figure 2 Distribution of firm-level markups all sectors 2008 and 2017
Source World Bank staff calculations based on SBS data set
In fact data show that the rise in average markup has been driven by the ability of a small group of firmsmdashthe top decile firmsmdashto increase their markups over time especially after 2014 Figure 3 panel a shows that markup growth has been progressively uneven across firms with firms in the top decile of the markup distribution increasing their average markup faster than the rest of firms Firms in the 90th percentile increased their (sales-weighted) average markup by 285 percent from 2008 to 2017 while the rest of firmsmdashthose below the top decilemdashexperienced a completely opposite trend their weighted markup contracted by 83 percent over the same period This shows that the increase in the weighted average markupmdashof around 15 percent as shown in figure 3 panel amdashcomes mainly from the group of firms in the top decile of the markup distribution The divergence between the top decile and the rest of firms remains even when results are broken down by sectors it is more pronounced in manufacturing despite some volatility (figure 3 panel b) while in services this happens only after 2014 (panel c) The mining sector experienced the opposite trend (panel d) as most of the time (until 2016) the top decile group of the markup distribution reported lower markup growth than the rest of the firms in the data set
02
46
kden
sity
lnmu
-2 0 2 4 6 8Mark-up (ln)
2008 2017
14
Figure 3 Evolution of (sales-weighted) average markup by sector and by top decile and firm groups (top decile firms versus the rest) 2008ndash17
a All sectors b Manufacturing
c Services d Mining
Source World Bank staff calculations based on SBS data set
Overall these results suggest that any analysis about markup performance in Romania should pay attention to a small group of firms the top decile of firms based on markup distribution These firms have been accounting for increasing shares of value added and employment in the economy Figure 4 shows that the share of value added in the whole economy (including manufacturing services and mining sectors) as accounted for by the firms in the top decile of the markup distribution has been increasing jumping from less than 13 percent in 2008 to 231 percent in 2017 The same applies to employment the sample of the top decile of firms accounts for an increasing share of employment generated in the economy across the 2008ndash17 period (figure 5)
91
11
12
13
Mar
k-up
inde
x (2
008=
1)
2008 2009 2010 2011 2012 2013 2014 2015 2016 2017Year
Average (wgtd)perc 90 (wgtd)Rest of firms (below perc 90) (wgtd)
All firms
15
Figure 4 Share of total value added accounted for by the top decile firms 2008ndash17
Figure 5 Share of employment accounted for by the top decile firms 2008ndash17
Source World Bank staff calculations based on SBS data set
Source World Bank staff calculations based on SBS data set
These top decile firms are also typically smaller less productive and less likely to invest in intangible assets than the rest of the firms As highlighted in the methodological section of this paper the increase of markups cannot be unequivocally interpreted as a decline in competition in a given market it can reflect firmsrsquo efficiency gains or adoption of quality-upgrading strategies To explore this aspect a simple econometric analysis was applied to capture performance differences between the group of firms that is leading the markup increase (the top decile firms) and the rest of the firms based on the markup distribution The following specification was adopted
119862119862ℎ119886119886119886119886119886119886119886119886119886119886119886119886119886119886119886119886119904119904119886119886119886119886119886119886119888119888119895119895119894119894119895119895 = 1205751205750 + 1205751205751119879119879119879119879119879119879_119889119889119886119886119886119886119886119886119889119889119886119886119894119894119895119895 + η119895119895 + ρ119895119895 + γ119888119888 + 120583120583119888119888119895119895119894119894119895119895 (8)
where the dependent variable reflects different firm characteristics (of firm i that operates in sector j county c at year t) to be compared Three dependent variables are tested size (measured in terms of the number of full-time employees) productivity (measured as TFPR discounted for markup16) and intangible assets (measured as a dummy that takes the value of 1 for firms having a positive value of intangible fixed assets17) The key explanatory variable is 119879119879119879119879119879119879_119889119889119886119886119886119886119886119886119889119889119886119886119894119894119895119895 a dummy that takes the value of one firm if i is among the top decile of the markup distribution in year tmdashwhile ηt ρj and γc are respectively time NACE 4-digit sector and county fixed effects The parameters of equation (8) are estimated by OLS (or Probit regression maximum likelihood when the dependent variable is the intangible assets dummy) always using heteroscedasticity-robust standard errors Results displayed in table 3 columns 1 and 2 suggest that firms in the 90th percentile of the markup distribution are on average 468
16 TFPR discounted for markup is computed as TFPR-markup In this regard it is not a perfect measure of the true technical efficiency but just a proxy of productivity that accounts for market share and the effect of materials elasticity while other factors such as the effect of product quality or innovation are not considered 17 Value of intangible assets in the SBS data set is defined as value built on (a) RampD expenditure and (b) franchise patents and other similar rights and values
1015
2025
Perc
enta
ge
2008 2009 2010 2011 2012 2013 2014 2015 2016 2017Year
1012
1416
18Pe
rcen
tage
2008 2009 2010 2011 2012 2013 2014 2015 2016 2017Year
16
percent18 smaller and 91 percent 19 less productive than the rest of the firms even within narrowly defined sectors (at NACE 4-digit level) Results in column 3 captures the differences between these two groups of firms in terms of their willingness to invest in intangible assetsmdashtheir ldquoknowledge capacityrdquomdasha key determinant of firmsrsquo expansion in the long term Results suggest that the sample of top decile firms are almost 33 percent less likely to invest in intangible fixed assets than the remaining firms even within NACE 4-digit sectors20 All these correlations are statistically significant at the 1 percent confidence level
Table 3 Characteristics of top decile firms Conditional correlations between markups and firm characteristics (OLS and Probit results)
(Estimation method) Dependent variable (1)
(OLS) Employment
(ln)
(2) (OLS)
TFPR discounted for markup (ln)
(3) (Probit)
Investment in intangibles
(yesno) Top _decile minus0632 minus2422 minus0386 NACE 4-digit sector fixed effects
Yes Yes Yes
County fixed effects Yes Yes Yes Year fixed effects Yes Yes Yes R2 (pseudo R2)a 0238 0728 0078 Observations 484604 403561 484594
Source World Bank staff calculations based on SBS data set Note All firm-year observations (for the 2008ndash17 period) are pooled together and NACE 4-digit sector and year fixed effects are included OLS = ordinary least squares TFPR = revenue-based total factor productivity a It is worth highlighting that R2 value does not influence the consistency of the estimators of each population parameter which is the objective of the current analysis See for instance Cameron and Trivedi (2010) for a theoretical discussion on this matter Moreover since the analysis draws on a large sample the standard errors of the coefficient estimators are not affected because of the law of large numbers The key issue would be the lack of correlation of omitted variables and the explanatory variables However given that the main (theoretical) determinants of the markup performance are included the omitted variables can be understood to be random Statistically significant at 1 percent
In addition the group of 10 top decile firms in the markup distribution operate mainly in the services sector and are overrepresented in less-knowledge-intensive services sectors with some exceptions Table 4 displays the distribution of top decile firms across NACE 2-digit sectors in 2017 To control for the fact that some sectors might be overrepresented (given the SBS survey sampling) the table shows only those sectors for which the probability of a firm being in the top decile is larger than the sectorrsquos frequency ratio Results show that firms in the 90th percentile of markup distribution are overrepresented in wholesale trade and retail trade sectors the probability of a top decile firm being in these two sectorsmdashclassified as less-knowledge-intensive services according to the Eurostat definition
18 This value results from the following expression 100[exp(beta)minus1] where beta equals estimated top 90 percent dummy coefficients in an OLS regression where size is the dependent variable controlling for 4-digit and county fixed effects (table 3 column 1) 19 This value results from the following expression 100[exp(beta)minus1] where beta equals estimated top 90 percent dummy coefficients in an OLS regression where TFPR is the dependent variable controlling for 4-digit and county fixed effects (table 3 column 2) 20 The odds-ratio is computed as the relative difference between the marginal effects for each category (that is 42 percent for the top decile firms and 56 percent for firms below the 90th percentile) Specifically it is computed as follows (56 percent minus 42 percent)(42 percent)
17
(see table A12 in annex 1)mdashis almost 40 percent21 It is worth highlighting however that these top decile firms also operate in some knowledge-intensive services sectors though the probability is much smaller 387 percent for computer programming and 268 percent for security and investigating activities22
When taken together these results suggest that the small group of firms leading the overall increase in markups in Romania does not seem to follow the typical superstar firmsrsquo profile As discussed by Van Reenen (2018) and Autor et al (2017) superstar firmsmdashtypically with higher markups larger and more productive ndash would be rewarded with larger market shares due to their innovative nature This hypothesis does not seem to be supported by data in Romania As results showed the group of firms who are driving the aggregate rise in markupsmdashthe top decile firms of the markup distributionmdashare typically smaller less productive less likely to invest in intangible assets and are mostly active in services sectors where use and diffusion of knowledge is less important This may suggest that the increase in markups in Romania might reflect a less competition-intensive environment rather than changes in the nature of competition where superstar firms would be rewarded with greater market share because they are more efficient and innovative
Table 4 Probability of a top decile firm (in the markup distribution) being in the following sectors
2-digit sector Probability Wholesale trade 2436 Retail trade 1477 Computer programming 387 Manufacturing of wearing apparel 321 Real estate activities 314 Security and investigation activities 268
Source World Bank staff calculations based on SBS data set Note The table shows only sectors for which the probability of a firm being in the top decile of markup distribution is higher than the sectorrsquos overall frequency ratio
42 HOW HAVE FIRM DYNAMICS INFLUENCED AGGREGATE MARKUP PERFORMANCE ARE THERE SIGNS OF MARKET POWER CONSOLIDATION AMONG INCUMBENT FIRMS
To indirectly assess whether the rise in markups is associated with weakening competition the analysis decomposes the evolution of aggregate markups into that of incumbents and of net entry of firms To do so the Melitz and Polanec (2015) decomposition technique is applied to the aggregate markup changes between 2008 and 2017 This approach follows two steps First the aggregate (ln) markup (μ) at year t is defined as
21 Under the NACE 2-digit wholesale trade sector the group of top decile firms are overrepresented in the following NACE 4-digit sectors sector 4690ndashNon-specialized wholesale trade sector 4673ndashWholesale of wood construction materials and sanitary equipment sector 4621ndashWholesale of grain unmanufactured tobacco seeds and animal feeds sector 4646ndashWholesale of pharmaceutical goods sector 4675ndashWholesale of chemical products and sector 4631ndashWholesale of fruit and vegetables Under the NACE 2-digit retail services sector the sample of top decile firms are overrepresented in the following NACE 4-digit sectors sector 4711ndashRetail sale in non-specialized stores with food beverages or tobacco predominating and sector 4730mdashRetail sale of automotive fuel in specialized stores 22 The same analysis is applied for ownership structure again controlling for overrepresentation Results show that the sample of top decile firms are overrepresented in the fully foreign-owned ownership category
18
120583120583119895119895119895119895 = sum sum 119904119904119895119895119894119894119895119895119894119894isinΩ119895119895 120583120583119895119895119894119894119895119895119894119894isin119896119896119895119895 (9)
where sjit is firm irsquos market share at moment t where the market share is defined in terms of firm irsquos revenue weight over the total revenue of sector j (kj) where sector j is the sector to which firm i belongs Then the change of (ln) markup between moments t and tminus1 is decomposed as
Δ120583120583119895119895119895119895 = Δ120583119878119878119895119895119895119895 + Δ119862119862119879119879119907119907119878119878120583120583119878119878119895119895119894119894119895119895 119904119904119878119878119895119895119894119894119895119895 + 119904119904119864119864119895119895119895119895120583120583119864119864119895119895119895119895 minus 120583120583119878119878119895119895119895119895 + 119904119904119883119883119895119895119895119895120583120583119878119878119895119895119895119895 minus 120583120583119883119883119895119895119895119895 (10)
where the subindex S refers to survivor firms (that is those operating in both years t and tminus1 the subindex X denotes firms exiting the market or those firms present in moment tminus1 but not in moment t and E denotes entrants or those firms operating in moment t but not in moment tminus1 Each component expressed in equation (10) represents different drivers to explain aggregate change in markup over the period The first term is the change of the
unweighted average ln markup of survivors or the ldquowithinrdquo component Likewise is the change in the covariance between ln markup and market share for
survivors only This is the ldquobetweenrdquo component and it measures the reallocation of resources among surviving firms The term is the ldquoentryrdquo component and it measures
the difference of the aggregate ln markup of entrants and that of survivors at moment t weighted by the share of entrants over the total population of firms ( ) The entry component will be
positive if the aggregate markup of those firms entering the market is larger than the aggregate markup of the survivors Finally is the exit component which measures the
difference between the aggregate ln markup of survivors and exiting firms at moment tminus1 likewise weighted by the proportion of firms exiting the market that is This term is
positive if the aggregate ln markup of the exiting firms is lower than the aggregate ln markup of survivors In other words and as displayed in equation (10) aggregate markup can growshrink because (a) incumbent firms have increaseddecreased their markups (the ldquowithinrdquo component) (b) incumbent firms with high markups have gainedlost market share (the ldquobetweenrdquo component) and (c) entrant firms have higherlower markups than exiting firms (the ldquoentryrdquo or ldquoexitrdquo component)23
Results show that the increase in aggregate markups has been driven mostly by incumbents rather than entrants and exiting firms Decomposition results for the full sample of firms are displayed in figure 6 Estimations suggest that a large proportion of the aggregate increase in markup in Romania was driven by increases within incumbent firms (the ldquowithinrdquo bar) And among incumbents results show that the rise in markups reflects mostly a markup increase within firms rather than a reallocation of market share away from low-markup to high-markup companies (the ldquobetweenrdquo bar) Meanwhile the entry of new firms with lower markups pulled the change in aggregate markups down (the ldquoentryrdquo bar) and contribution from
23 SBS tends to underestimate entry and exit (populational) figures as a result of its sampling design In this regard the proposed analysis captures entry and exit in the enumerated stratum (above 20 employees) so results will be representative at least for the population of firms in the enumerated stratum
19
exiting firms was negligible
20
Figure 6 Decomposition of percentage change of (sales-weighted) average markup 2008ndash17
Source World Bank staff calculations based on SBS data set
This result could be interpreted as a sign of consolidation of market power among existing firms enabled by remaining product market regulations that restrict competition despite previous reforms Several policy-related factors can explain this result among them government interventions and regulations that restrict competition by reinforcing dominance or limiting entry facilitating collusive outcomes or increasing the cost to compete in markets and discriminating and protecting vested interests24 In this regard Pop and Ore Monago (2020) provide illustrative examples about the presence of regulations that still restrict competition in Romania drawing from the OECDndashWorld Bank Group (WBG) product market regulation (PMR) indicators data set which provides information across 70 countries25 The assessment uses the latest PMR round for Romania from 2013 and includes Romaniarsquos performance projected on the basis of information updated in 2017 Results suggest that the regulatory framework as it is in the books in Romania is less restrictive than that of countries such as Poland and the total sample average but it is more restrictive than that of the OECD and EU-15 countries However from an economywide perspective the overall restrictiveness of regulations in Romania is mainly associated with the state control of the economy and several remaining barriers to entry and rivalry (see figure 7)
24 In principle greater competition outcomes are enabled through an effective competition policy framework which involves three key pillars (a) fostering pro-competition regulations and government interventions (b) promoting competitive neutrality and non-distortive public aid and (c) enabling effective competition law and antitrust enforcement 25 The current PMR database used for this study includes Argentina Australia Austria Belgium Bolivia Brazil Bulgaria Canada Chile China Colombia Costa Rica Croatia Cyprus the Czech Republic Denmark the Dominican Republic Ecuador Arab Republic of Egypt El Salvador Estonia Finland France Germany Greece Guatemala Honduras Hungary Iceland India Indonesia Ireland Israel Italy Jamaica Japan Kenya the Republic of Korea Kuwait Latvia Lithuania Luxembourg Malta Mexico the Netherlands New Zealand Nicaragua Norway Panama Paraguay Peru the Philippines Poland Portugal Romania the Russian Federation Rwanda Senegal the Slovak Republic Slovenia South Africa Spain Sweden Switzerland Turkey Tunisia Ukraine Uruguay the United Kingdom and the United States
21
Figure 7 Product market regulation in Romania and comparator countries
Source Pop and Ore Monago 2020 Note The top five performers in the overall PMR indicator are the Netherlands United Kingdom Austria Denmark and New Zealand Figure shows 2013 information unless otherwise indicated PMR = product market regulation
Barriers to entry and rivalry still affect some service sectors In fact there are examples of regulations that hamper competition in retail trade which concentrates a substantial proportion of high-markup firms in the Romanian economy as seen previously Drawing from the OECD-WBG PMR data set Pop and Ore Monago (2020) show that although regulations in the retail trade sector are less restrictive than in the EU-15 and OECD there is still room for improvement to make the retail trade market more efficient The authors show that licenses and permit requirements may still be imposing an unnecessary burden on entry and increasing the costs to compete in the sector Companies operating in retail sectors in Romania are subject to requirements that go beyond the general conditions formalities and procedures applicable to any company For instance in Romaniarsquos clothing industry licenses and permits are always required compared with 57 percent of OECD countries and 60 percent of EU-15 countries which do not have such a requirement26 In addition Romania has regulations that impose restrictions on entry or expansion of business activities and constrain strategic options to compete in retail markets For instance most of the PMR countries and all top five performers do not restrict firms from selling below cost (beyond a prohibition of predatory pricing) and restrictions on sales promotions are not a common practice either27 In Romania sales below cost are prohibited or restricted beyond a prohibition of predatory pricing Likewise sales promotions are restricted to a particular time of the year28
43 DO FIRM MARKUPS DIFFER ACROSS FIRMS WITH DIFFERENT ATTRIBUTES
To answer this question the analysis explores how markup performance differs across different types of firms To assess the heterogeneity in markups the analysis relates markups to firm-level characteristics such as size age ownership status RampD status and location
26 In this case the least restrictive countries such as Bulgaria Latvia and Sweden do not have such requirements 27 Among the Central and Eastern Europe comparator countries only the Czech Republic and the Slovak Republic apply restrictions on discounted sales pricing while only Poland applies constraints to sales promotions 28 Government Ordinance no 992000 prohibits sales below costs and provides for the conditions and periods when certain types of promotions can take occur
5156 51 52 47 49 53
62 55
3830 42 40 43 39
4333 41
1114
6 9 10 125 5 4
113129 133 134 141 148 156
165 169
0
05
1
15
2
25
3
0
05
1
15
2
25
3
Top 5 -PMR SlovakRepublic
Hungary EU-15average
CzechRepublic
OECDaverage
2013
Romaniasim 2017
Poland Romania
State control (SC) Barriers to entry and rivalry (BER) Barriers to trade and investment (BTI)
Avg of all countries = 190
22
within narrowly defined product markets proxied by NACE 4-digit sectors The following regression is estimated
120583120583119888119888119895119895119894119894119895119895 = 1205751205750 + sum 12057512057511198961198961198791198791199001199001198991198991198961198961198881198881198951198951198941198941198951198957119896119896=2 + sum 1205751205752119903119903119904119904119886119886119904119904119886119886119903119903119888119888119895119895119894119894119895119895
3119903119903=2 + sum 1205751205752119902119902119886119886119886119886119886119886119902119902119888119888119895119895119894119894119895119895
3119902119902=2 + 1205751205753119889119889119888119888119895119895119894119894119895119895
119864119864119864119864119864119864 +1205751205754119889119889119888119888119895119895119894119894119895119895119877119877119877119877119889119889 + 1205751205755119896119896119888119888119895119895119894119894119895119895 + 120578120578119895119895 + 120588120588119895119895 + 120574120574119888119888 + 119906119906119888119888119895119895119894119894119895119895 (11)
where ownkcjit with k = 23hellip7 comprises a set of dummies defining the type of ownership of the firm Romanian private (omitted category) majority state-owned state-private ownership Romanian private and foreign fully foreign-owned public of national and local interest and other (cooperatives and craft organizations)29 The term sizercjit is a set of three dummies controlling for firmsrsquo sizemdashsmall or fewer than 50 employees (omitted category) medium or 51ndash250 employees and large more than 250 employees The term agercjit is a set of three age dummiesmdashyoung or less than 5 years old mature or 6ndash15 years old and older than 15 years Two dichotomous variables are also defined to capture export and RampD profiles dExp and dRnd which take a value of 1 if a firmrsquos direct exports represent more than 10 percent of a firmrsquos total revenue and if a firmrsquos RampD represents more than 1 percent of a firmrsquos total revenue respectively In addition kcjit is firmsrsquo total capital stock value (sum of tangible and intangible assets)30 Finally ηt ρj and γc are respectively time NACE 4-digit sector and county fixed effects Equation (11) is estimated separately for each 1-digit sector (that is manufacturing services and mining) and for the whole economy while the equation parameters are estimated by OLS always using heteroscedasticity-robust standard errors The complete set of results is displayed in table A15 in annex 1
Results show that ownership structure matters to explain markup differences across firms State-controlled companies tend to exert the highest markup premiums in the overall economy and especially in the manufacturing sector Table 5 displays the estimated coefficients of ownership categories multiplied by 100 Except for the mining sector most of estimated coefficients are statistically significant which suggests that ownership structure makes a difference to explain markup performance even for firms operating in the same product market (here proxied by NACE 4-digit sector) county location and year and with similar characteristics in terms of size age and export and RampD profile
In particular firms in which the state has majority or minority ownership demonstrate higher markups when compared with domestic privately owned companies (see table 5 column 4) The average difference in markup is higher for companies with minority state ownership (289 percent) than for fully state-owned companies (200 percent) In manufacturing markups of fully state-owned firms are the highest on average at 527 percent when compared with the reference category (domestic privately owned firms) Results in services are mixed with both private and state ownership extracting high premiums private firms with mixed domestic-foreign ownership show the highest average difference (279 percent) closely followed by minority state-owned companies for which the markup premium
29 More details about the original ownership classification in SBS and the aggregation used for the analysis can be found in table A13 and table A14 in annex 1 30 The variable lnTFPRkit is included as an additional control to test the robustness of the analysis See results in table A16 in annex 1
23
is 275 percent compared with the reference category 31 All results are robust to the inclusion of productivity as an additional control variable (see results in table A16 in annex 1)32
Table 5 Average markup differences by ownership structure relative to domestic privately owned firms
(1) Manufacturing
()
(2) Services
()
(3) Mining
()
(4) All sectors
() Majority state-owned 527 139 772 200 State-private ownership 352 275 ns 289 Domestic private + foreign 161 279 ns 229 Fully foreign-owned 105 263 ns 201 Public of national and local interest
209 149 ns 214
Source World Bank staff calculations based on SBS data set Note Numbers reflect estimated coefficients (multiplied by 100) for ownership dummy categoriesmdashrelative to Romanian private firms the omitted categorymdashin a fixed-effect regression model controlling for firm covariates plus year and NACE 4-digit sector fixed effects as displayed in equation (11) More details about the original ownership classification in SBS and aggregation used for the analysis can be found in table A13 and table A14 in annex 1 See table A15 in annex 1 for the complete set of results ns = not statistically significant
Larger firms and older companies wield higher markups when compared with their counterparts implying that firm size and age are relevant characteristics that influence markup differences As shown in figure 8 old companies (older than 15 years) display higher average markups than young ones (1ndash5 years old) even when they share similar attributes (in terms of ownership structure size and export and RampD profiles) and operate in the same NACE 4-digit sector county and year The estimated average markup premium for old companies (relative to young ones) is 54 percent for the whole economy It varies depending on how data are clustered across large sectors 79 percent in manufacturing 48 percent in services and 228 percent in mining Higher markup premiums for older companies can be interpreted in two ways it can reflect that more experienced firms are able to transpose learning returnsmdashwhich could positively affect their productivity or reduce their marginal costsmdashinto higher markups or that older firms are able to lobby better and create barriers to entry making it more difficult for younger firms to exert competitive pressure Firm size also matters to explain markup performance large companies (with more than 250 full-time employees) tend to display higher markups compared with small companies even when they operate in the same product market and share similar characteristics On average for the whole economy the
31 Results for the category ldquootherrdquo are not shown in table 5 As detailed in table A13 in annex 1 this ldquootherrdquo category refers to SBS ownership answer-codes 40 and 50 respectively ldquocooperativerdquo and ldquopublic of national and local interestrdquo The reason the corresponding results were not highlighted in the main text are twofold First the above-mentioned category accounts for only 006 percent of total companies in the sample Second an in-depth analysis would be needed to understand whether this ldquootherrdquo category reflects potential noise in the way firms self-classify their ownership structures or the way firms report cost expenditures (mainly) or whether this was influenced by SBS sampling design 32 Because the production approach applied in the current analysis delivers both markup and productivity estimates it is possible to further decompose the markup differences across firm characteristics and to verify whether after controlling for differences in marginal costs (that is productivity) certain groups of firms still have higher markups This is precisely one of the mitigating methods employed to reduce the conflation risk as highlighted before Results in table A16 in annex 1 should be interpreted as follows once productivity level is included in the equation differences in marginal cost are accounted for so the coefficient on ldquomajority state-ownedrdquo for instance captures the variation in average prices between majority state-owned and the size reference category (domestic privately owned firms)
24
markup premium for large companies is 122 percent higher than that of small firms (figure 9) Both size and age effects are still present even after controlling for productivity differences (see table A16 in annex 1)33
Figure 8 Average markup differences relative to young firms by age category
Figure 9 Average markup differences relative to small firms by size category
Source World Bank staff calculations based on SBS data set Note Numbers reflect estimated coefficients (multiplied by 100) for age dummy categoriesmdashrelative to young firms (1ndash5 years old) the omitted categorymdashin a fixed-effect regression model controlling for firm covariates plus year county and NACE 4-digit sector fixed effects as displayed in equation (11) All bars reflect statistically significant results See table A15 in annex 1 for the complete set of results
Source World Bank staff calculations based on SBS data set Note Numbers reflect estimated coefficients (multiplied by 100) for size dummy categoriesmdashrelative to small firms (1ndash50 employees) the omitted categorymdashin a fixed-effect regression model controlling for firm covariates plus year county and NACE 4-digit sector fixed effects as displayed in equation (11) All bars reflect statistically significant results See table A15 in annex 1 for the complete set of results
By the same token export intensity also influences markup performance with firms that export earning higher markups Being an exporter is a relevant firm feature to be analyzed when it comes to understanding markup performance Recent models of international trade predict that exporting firms earn higher markups than non-exporting firms either because they are relatively more productive and can thus undercut their rivals (see Melitz and Ottaviano 2008) or because they produce higher-quality goods and rely on higher-quality inputs which allow them to charge higher prices (see Hallak and Sivadasan 2009) In this regard the results summarized in figure 10 are consistent with the literature and suggest that exporting firmsmdashdefined as those whose direct exports represent more than 10 percent of total revenuemdashearn higher markups than non-exporting firms that operate in the same product market (NACE 4-digit sector) the difference ranges from 12 percent to 416 percent depending on how data are clustered across large sectors (manufacturing services and mining)
33 See footnote 32 on how to interpret results in table A16 in annex 1 (after including productivity as an additional control)
22
-160
158
7948
228
54
-505
101520253035
d
iffer
ence
Mature (between 6 and 15 years old)
Old (older than 15)
23
-830
090
327
169122
-15-55
152535
d
iffer
ence
Medium (between 51 and 250)
Large (more than 250 employees)
25
Figure 10 Average markup differences relative to non-exporters by export status
Figure 11 Average markup differences relative to non-RampD performers by RampD status
Source World Bank staff calculations based on SBS data set Note Numbers reflect estimated coefficients (multiplied by 100) for RampD dummy categorymdashrelative to non-RampD performer firms the omitted categorymdashin a fixed-effect regression model controlling for firm covariates plus year county and NACE 4-digit sector fixed effects as displayed in equation (11) All bars reflect statistically significant results See table A15 in annex 1 for the complete set of results
Source World Bank staff calculations based on SBS data set Note Numbers reflect estimated coefficients (multiplied by 100) for export dummy categorymdashrelative to non-exporters the omitted categorymdashin a fixed-effect regression model controlling for firm covariates plus year county and NACE 4-digit sector fixed effects as displayed in equation (11) All bars reflect statistically significant results See table A15 in annex 1 for the complete set of results
Performing RampD activities is positively correlated with markup differences while location proxied by county also matters to explain markup performance Results displayed in figure 11 show that RampD performersmdashidentified by those firms whose RampD expenses surpass more than 1 percent of their total revenuemdashtend to earn higher markups than non-RampD performers The markup premium for RampD performers is always positive suggesting that this group of firms is able to recoup fixed costs associated with RampD activities The magnitude of the premium varies from 16 percent to 46 percent depending how data are clustered across large sectors (manufacturing services and mining) In addition results displayed in figure 12 show that firms in the same product market (at NACE 4-digit level) and with similar characteristics (in terms of ownership age size and export and RampD profiles) charge different markups depending on the county in which they operate Except for Dolj firms in all other counties demonstrate lower average markups than Bucharest the negative markup premium in relation to Bucharest varies from minus154 percent (Vrancea) to minus36 percent (Satu-Mare)
12
258
416
119
05
101520253035404550
d
iffer
ence
160
340
460
273
05
101520253035404550
d
iffer
ence
26
Figure 12 Average markup differences by county relative to Bucharest
Source World Bank staff calculations based on SBS data set Note Numbers reflect estimated coefficients (multiplied by 100) for county fixed effectsmdashrelative to Bucharest the omitted categorymdashin a fixed-effect regression model controlling for firm covariates plus year and NACE 4-digit sector fixed effects as displayed in equation (11) All bars reflect statistically significant results See table A15 in annex 1 for the complete set of results
A variance decomposition analysis suggests that ownership is the most relevant characteristic to explain total variance of markup performance across firms in Romania followed by capital intensity and export status Drawing from estimations of equation (11) it is possible to evaluate the relative importance of each variable to explain the variance of the markup Letting dExp represent any of the explanatory variables of equation (11) the contribution to the variance of the markup of that variable can be defined as
119862119862119879119879119899119899119886119886119889119889119864119864119864119864119864119864 = 12057512057532119881119881119886119886119903119903119889119889119864119864119864119864119864119864+21205751205753119872119872119862119862119862119862(119889119889119864119864119864119864119864119864120583120583minus1205751205753119889119889119864119864119864119864119864119864)119881119881119886119886119903119903(120583120583)
(12)
or as the variance of the variable plus 2 times the covariance of the variable with the part of the markup not explained by that variable A similar expression can be derived for any of the remaining explanatory variables The relative contribution of each variable is computed after discounting the residuals sector and year contributions Results are displayed in figure 13 Ownership structure is shown to be the most relevant feature to explain the variance of markup performance across firms it accounts for 347 percent of the explained variance of markup performance (after removing NACE 4-digit sector and year contributions) The second most important characteristic is capital intensity corresponding to 214 percent of the variance of the markup performance Export status accounts for the third largest share in explained variance 113 percent
d
iffer
ence
27
Figure 13 Contribution by each firm characteristic to explain total variance of markup performance across firms
Source World Bank staff calculations based on SBS data set Note The pie chart reflects markup variance decomposition results It decomposes the variance of markup performance across firms after removing the proportion accounted for by omitted factors NACE 4-digit sector and year contributions
44 WHAT WOULD BE THE PRODUCTIVITY DIVIDENDS FROM MARKUP REDUCTION
While it became evident that aggregate market power in Romania has been rising it is important to analyze its consequences for economic growth An indirect way to measure this is to estimate the productivity dividends that would come from markup reduction The association between markup and productivity can be positive or negative depending on the nature of competition in the specific marketssectors As shown by Autor et al (2017) and Van Reenen (2018) there are marketsmdashsuch as high-tech sectors or knowledge-intensive onesmdashwhere the nature of competition tends to emphasize the importance of network effects economies of scale and scope and intangible assets so the most productive and dynamic firms exert higher markups and obtain larger market shares On the other hand in certain markets where recouping fixed costs (such as RampD) because of higher-risk investments is not that relevant high-markup firms are not necessarily more productive and efficient Another way to look at this contrast is through the inverted-U relationship of innovation and competition to an increase in productivity as explored by Aghion et al (2005) According to this view stronger competition (proxied here by smaller markups) encourages neck-and-neck firms to innovatemdashthe ldquoescape competitionrdquo effectmdashand therefore to increase productivity growth At the same time this view discourages laggard firms from innovating (the Schumpeterian effect) therefore reducing productivity growth The combination of the two effectsmdashescaping competition and discouraging innovationmdashexplains the inverted-U relationship of competition and innovation with productivity growth
To assess the correlation between productivity growth and markups in Romania the analysis uses firm-level estimations of TFPR and markups obtained so far Thus it estimates the specification presented in Aghion Braun and Fedderke (2008) as follows
Δ119889119889119899119899119879119879119897119897119897119897119877119877119888119888119895119895119894119894119895119895 = 1206011206010 + 1206011206011120583120583119888119888119895119895119894119894119895119895 + 120578120578119895119895 + 120588120588119895119895 + 120574120574119888119888 + 120592120592119888119888119895119895119894119894119895119895 (13)
where the left-hand-side variable represents TFPR growth of firm i in NACE 4-digit sector j in year t 120583120583119894119894119895119895119895119895minus1 is the lagged value of firm irsquos markup in sector j in year t ηt ρj and γc are
214
113
79
47
347
64
136
capital intensity Export status RampD status age ownership size region
28
respectively time NACE 4-digit sector and county fixed effects Equation (13) is estimated separately for each 1-digit sector (that is manufacturing services and mining) and for the whole economy while the equation parameters are estimated by OLS always using heteroscedasticity-robust standard errors
Figure 14 Productivity (TFPR) growth dividends from a 10 percent reduction of average markup by sector
Source World Bank staff calculations based on SBS data set Note Results from year county and 4-digit sector fixed effects Coefficient for mining was not statistically significant
Results shows that on average reducing markups would have a positive impact on aggregate productivity expansion Results displayed in table A18 in annex 1 suggest that lower (past) markups are associated with higher (current) productivity growth all coefficients for lagged markups are negative and statistically significant at conventional values for all sectors except mining Overall this negative correlation between past markup level and productivity growth is an indication of a positive association between competition and productivity growth which would be driven by the escape competition effect described by Aghion et al (2008)34
The magnitude of the economic effect of markup reduction on productivity growth is sizable Figure 14 shows that a 10 percent decrease in the average markup of 61 percent for the overall economy in the 2008ndash17 period would imply an increase in productivity (TFPR) growth of 082 percentage point per year The economic effect for the manufacturing sector would be substantially higher reducing the average markup of 403 percent for manufacturing in the same period would imply an increase in TFPR growth of 147 percentage points per year
Further productivity dividends stemming from markup reduction vary substantially across NACE 4-digit sectors The same specification expressed in equation (9) is estimated for each NACE 4-digit sector separately controlling for year and county fixed effects The TFPR growth dividends from markup reduction are computed for each NACE 4-digit sector drawing from the estimated coefficients (see table A18 in annex 1) Results vary substantially
34 An extended specificationmdashwhere the squared value of lagged markup is included as an additional dependent variablemdashwas also estimated The estimated coefficient of the squared term was not statistically significant (see results in table A17 in annex 1)
147
048
082
0
02
04
06
08
1
12
14
16
Manufacturing Services All
Perc
enta
ge p
oint
s per
yea
r
29
across sectors among those 4-digit sectors where the estimated coefficients are statistically significant the productivity growth dividends of a 10 percent decrease in markup vary from 701 percentage points to 016 percentage points respectively for NACE sector 1041ndashManufacture of oil and fats and sector 4649ndashWholesale of other household goods (figure 15)35 Productivity dividends from a potential markup reduction are also positive in sectors where the top decile firms in the markup distribution are overly represented for instance in sector 4711ndashRetail sale in non-specialized stores with food beverages or tobacco predominating a 10 percent decrease of average markup would be associated with an increase in TFPR growth of 022 percentage points per year For sector 4690ndashNon-specialized wholesale trade and sector 4673ndashWholesale of wood construction materials and sanitary equipment the productivity dividends would be 018 and 021 percentage points respectively
Figure 15 Productivity (TFPR) growth dividends from a 10 percent reduction of average markup Results by NACE 4-digit sector
Source World Bank staff calculations based on SBS data set
35 There are however some sectors where markup reduction brings detrimental impacts to productivity expansion See complete set of results in table A18in annex 1 for instance in NACE sector 8010ndashPrivate security activities and sector 2432ndashPrecious metals production where a reduction of average markup in the 2008ndash17 period would imply a decrease of TFPR growth of 030 percentage points and 663 percentage points respectively Following Aghion Braun and Fedderke (2008) the Schumpeterian effect of product market competition would be the underlying driver behind this result in these sectors competition reduces innovation incentives and therefore productivity growth by reducing the rents from innovations of firms below the technological frontier
00
10
20
30
40
50
60
70
80
Perc
enta
ge p
oint
s per
yea
r
30
5 CONCLUSIONS
A stylized fact emerging in the recent empirical literature is the increase in average levels of market power across countries in both developed and emerging economies This paper aims to bring new evidence about the evolution of corporate market power in Romania and the implications for competition dynamics It uses markups as a proxy for market power and explores firm-level heterogeneity to identify the underlying drivers of aggregate trends The paper applies the production approachmdashfollowing De Loecker and Warzynski (2012) De Loecker and Eeckhout (2018) and De Loecker Eeckhout and Unger (2020)mdashto estimate markup at the firm-year level for Romania The Romanian Structural Business Survey data set is used to apply this methodology
Results show that the aggregate markup in Romania increased by around 15 percent between 2008 and 2017 However this aggregate performance masks a lot of heterogeneity the first being heterogeneity of markups across the main sectors While in manufacturing (sales-weighted) average markups experienced a declining pattern of minus57 percent during 2008ndash17 there was an opposite and much more rapid trend in services with an aggregate change of 422 percent
Second at the firm level results suggest that a key driving force behind this aggregate trend was the ability of the top decile of firms in the markup distribution to increase their markups This increase has been faster than for the rest of the firms Firms in the 90th percentile of the markup distribution increased their (sales-weighted) average markup by 285 percent between 2008 and 2017 while the rest of firms (that is those below the top decile firms) experienced a completely opposite trend their weighted markup contracted by 83 percent over the same period
This sample of top decile firms does not seem to follow the typical superstar firmsrsquo profile which suggests that the increase in markups in Romania might be associated with an environment that is less conducive to competition The top decile firms in the markup distribution are 468 percent smaller 910 percent less productive and 33 percent less likely to invest in intangible assets than the rest of the firms in the markup distribution and they are overrepresented in less knowledge-intensive service sectors Therefore they do not seem to follow the typical superstar firmsrsquo profile (typically larger more productive and more likely to invest in intangible assets) This suggests that the increase in markups in Romania might be more due to relatively weak competition rather than to changes in the nature of competition where superstar firms (usually more efficient and innovative) are rewarded with greater market share In fact a decomposition exercise shows that the increase in aggregate markups has been driven mostly by incumbents rather than by new entrants and exiting firms These results could be interpreted as a sign of consolidation of market power among existing firms Several policy-related factors could explain this result among them government interventions and regulations that restrict competition by reinforcing dominance or limiting entry facilitating collusive outcomes or increasing the cost to compete in markets and by discriminating and protecting vested interests In this regard illustrative evidence provided by Pop and Ore Monago (2020) shows that despite reforms regulations that restrict entry and rivalry are still present in the retail trade sector which concentrates a substantial proportion of high-markup firms in the Romanian economy
31
Results also show that certain firm characteristics matter in explaining differences in markup performance size age RampD profile export propensity location and notably ownership State-controlled companies tend to demonstrate the highest markup premiums when compared with domestic privately owned companies 289 percent higher for minority state-owned companies and 20 percent higher for fully state-owned companies Old companies (older than 15 years) display 54 percent higher markups on average than young ones no matter the product market (at NACE 4-digit level) where they operate The markup premium for large companies (with more than 250 full-time employees) is 122 percent higher than that of small firms in the overall economy Exporting firmsmdashthose whose direct exports represent more than 10 percent of total revenuemdashearn 119 percent higher markups than non-exporting firms that operate in the same sector At the same time results show that the markup premium for RampD performers (compared with non-RampD performers) is 273 percent for the whole economy and that firms operating in the same product market charge different markups depending on the county where they operate Overall while all these features matter to explain markup performance a variance decomposition analysis suggests that ownership is the most relevant characteristic to explain total variance of markup performance across firms in Romania
In this context given that ownership assumes a prominent role to explain markup performance it is important to ensure competitively neutral policies across markets where private and public enterprises compete The prominent role of ownership in explaining total variance of markup performance across firms combined with the evidence that state-controlled companies tend to exert the highest markup premiums in the overall economy highlights the importance of ensuring competitive neutrality in Romania so that private and public enterprises compete on a fair basis Analysis presented in Pop and Ore Monago (2020) shows that state-owned enterprises (SOEs) in Romania compete on uneven terms with the private sector because of gaps in terms of both the current regulatory framework as well as its implementation As for the regulatory framework itself lack of competitive neutrality emerges from restrictive SOE governance rules and the exemption of newly setup SOEs from the corporate governance law lack of rules mandating the separation of commercial and noncommercial functions despite legal separation (for example in the railway and energy sectors) and the lack of specific provisions that require SOE investments to show positive rates of returns With regard to implementation of the regulatory framework competitive neutrality gaps stem from (a) the protracted application of corporate governance rules (b) fragmentation of SOE oversight across institutions with frequent overlaps (c) inconsistent reporting of SOE performance that prevents full monitoring and comparability with the private sector performance in comparable situations (d) little clarity in terms of compensation for public service obligations and (e) lack of transparency in state aid allocation
Finally the analysis shows that productivity dividends arise from increased competition in Romania As such lowering markups can boost productivity growth A 10 percent decrease in the average markup for the overall economy during 2008ndash17 would imply an increase in productivity (TFPR) growth of 082 percentage point per year The effect for the manufacturing sector is higher (147 percentage points per year) but lower for services (048 percentage point per year) The ldquoescape competitionrdquo effect described by Aghion Braun and Fedderke (2008)mdashthrough which fiercer competition induces firms to innovate to escape competition with the fringe therefore increasing productivity growthmdashwould be the underlying driver behind these average results for the manufacturing industry Results vary substantially across sectors among
32
those 4-digit sectors where the estimated coefficients are statistically significant the productivity growth dividend of a 10 percent decrease in markup varies from 701 percentage points (sector 1041ndashManufacture of oil and fats) to 016 percentage point (sector 4649ndashWholesale of other household goods)
In this context boosting competition becomes a key part of the engine to drive productivity growth and help consolidate Romaniarsquos convergence to a high-income level Implementing pro-competition policies is instrumental Besides removing anticompetitive regulations and promoting competitive neutrality policy makers should ensure that state aid is allocated in a non-distortive way and enable more effective competition law and antitrust enforcement
33
REFERENCES
Ackerberg D K Caves and G Frazer 2015 ldquoIdentification Properties of Recent Production Function Estimatorsrdquo Econometrica 83 (6) 2411ndash51
Aghion P N Bloom R Blundell R Griffith and P Howitt 2005 ldquoCompetition and Innovation An Inverted-U Relationshiprdquo Quarterly Journal of Economics 120 (2) 701minus28
Aghion P M Braun and J Fedderke 2008 ldquoCompetition and Productivity Growth in South Africardquo Economics of Transition 16 (4) 741ndash68
Autor D D Dorn F Lawrence C Patterson and J Van Reenen 2017 ldquoThe Fall of the Labor Share and the Rise of Superstar Firmsrdquo NBER Working Paper 23396 National Bureau of Economic Research Cambridge MA
Barkai S 2020 ldquoDeclining Labor and Capital Sharesrdquo Journal of Finance 75 (5) 2421ndash63
Bartelsman E J and M Doms 2000 ldquoUnderstanding Productivity Lessons from Longitudinal Microdatardquo Journal of Economic Literature 38 (3) 569ndash94
Berry S J Levinsohn and A Pakes 1995 ldquoAutomobile Prices in Market Equilibriumrdquo Econometrica Journal of the Econometric Society 63 (4) 841ndash90
Berry S J Levinsohn and A Pakes 2004 ldquoDifferentiated Products Demand Systems from a Combination of Micro and Macro Data The New Car Marketrdquo Journal of Political Economy 112 (1) 68ndash105
Bessen J 2017 ldquoInformation Technology and Industry Concentrationrdquo Law and Economics Paper No 17-41 Boston University School of Law Boston
Bond S A Hashemi G Kaplan and P Zoch 2020 ldquoSome Unpleasant Markup Arithmetic Production Function Elasticities and their Estimation from Production Datardquo NBER Working Paper No 27002 National Bureau of Economic Research Cambridge MA
Bresnahan T F 1989 ldquoEmpirical Studies of Industries with Market Powerrdquo In Handbook of Industrial Organization Vol 2 edited by R Schmalensee and R Willig 1011ndash57 Amsterdam Elsevier
Cameron A C and P K Trivedi 2010 Microeconometrics Using Stata (Rev ed) College Station TX Stata Press
Crouzet N and J Eberly 2018 ldquoUnderstanding Weak Capital Investment The Role of Market Concentration and Intangiblesrdquo NBER Working Paper 25869 National Bureau of Economic Research Cambridge MA De Loecker J 2011 ldquoRecovering Markups from Production Datardquo International Journal of Industrial Organization 29 (3) 350ndash55
De Loecker J 2013 ldquoDetecting Learning by Exportingrdquo American Economic Journal Microeconomics 5 (3) 1ndash21
De Loecker J and J Eeckhout 2018 ldquoGlobal Market Powerrdquo NBER Working Paper 24768 National Bureau of Economic Research Cambridge MA
De Loecker J J Eeckhout and G Unger 2020 ldquoThe Rise of Market Power and the Macroeconomic Implicationsrdquo Quarterly Journal of Economics 135 (2) 561ndash644 httpsdoiorg101093qjeqjz041
34
De Loecker J and F Warzynski 2012 ldquoMark-ups and Firm-Level Export Statusrdquo American Economic Review 102 (6) 2437ndash71
Diacuteez F D Leigh and S Tambunlertchai 2018 ldquoGlobal Market Power and Its Macroeconomic Implicationsrdquo IMF Working Paper 18137 International Monetary Fund Washington DC
Grullon G Y Larkin and R Michaely 2018 ldquoAre US Industries Becoming More Concentratedrdquo Swiss Finance Institute Research Paper No 19-41 httpdxdoiorg102139ssrn2612047
Gutieacuterrez G and T Philippon 2017a ldquoDeclining Competition and Investment in the USrdquo NBER Working Paper 23583 National Bureau of Economic Research Cambridge MA Gutieacuterrez G and T Philippon 2017b ldquoInvestment-less Growth An Empirical Investigationrdquo Brookings Papers on Economic Activity (Fall) 89ndash182 Gutieacuterrez G and T Philippon 2018 ldquoHow EU Markets Became More Competitive than US Markets A Study of Institutional Driftrdquo NBER Working Paper 24700 National Bureau of Economic Research Cambridge MA
Hall R 1988 ldquoThe Relation between Price and Marginal Cost in US Industryrdquo Journal of Political Economy 96 (5) 921ndash47
Hallak J and J Sivadasan 2009 ldquoExporting Behavior under Quality Constraintsrdquo NBER Working Paper 14928 National Bureau of Economic Research Cambridge MA
IMF (International Monetary Fund) 2019 World Economic Outlook April 2019 Growth Slowdown Precarious Recovery Washington DC International Monetary Fund
Koujianou Goldberg P and R Hellerstein 2012 A Structural Approach to Identifying the Sources of Local Currency Price Stability Review of Economic Studies 80 (1) 175ndash210
Melitz M J and G Ottaviano 2008 ldquoMarket Size Trade and Productivityrdquo Review of Economic Studies 75 (1) 295ndash316
Melitz M J and S Polanec 2015 ldquoDynamic Olley-Pakes Productivity Decomposition with Entry and Exitrdquo RAND Journal of Economics 46 (2) 362ndash75
Motta M 2004 Competition Policy Theory and Practice Cambridge MA Cambridge University Press
Pop G and T Ore Monago 2020 ldquoCompetition and Government Interventions in Romania An Assessment with Focus on Product Market Regulations and Competitive Neutralityrdquo Background paper for Markets and People Romania Country Economic Memorandum International Development in Focus World Bank Washington DC
Shapiro C 2018 ldquoAntitrust in a Time of Populismrdquo International Journal of Industrial Organization 61 714ndash48
Syverson C 2004 ldquoProduct Substitutability and Productivity Dispersionrdquo Review of Economics and Statistics 86 (2) 534ndash50
Van Reenen J 2018 ldquoIncreasing Differences between Firms Market Power and the Macroeconomyrdquo CEPR Discussion Paper 1576 Center for Economic and Policy Research Washington DC
35
World Bank 2020a ldquoMarkets and People Romania Country Economic Memorandumrdquo International Development in Focus World Bank Washington DC
World Bank 2020b ldquoAssessing the Direct and Indirect Impact of State Aid in Romania An Ex-post Evaluationrdquo World Bank Washington DC
36
ANNEX 1 ADDITIONAL FIGURES AND TABLES
Figure A11 Evolution of (sales-weighted) average markup in manufacturing sector by technology intensity 2008ndash17
Source World Bank staff calculations based on SBS data set
Table A11 Manufacturing industry groups by technology intensity Eurostat classification
85
99
51
Mar
k-up i
ndex
(200
8 = 1
)
2008 2009 2010 2011 2012 2013 2014 2015 2016 2017Year
Manuf High-tech
37
Source Eurostat Indicators on High-Tech Industry and KnowledgendashIntensive Services annex 3 httpseceuropaeueurostatcachemetadataAnnexeshtec_esms_an3pdf
38
Figure A12 Evolution of (sales-weighted) average markup in services sector by knowledge intensity
39
Table A12 Services groups by knowledge intensity Eurostat classification
40
Source Eurostat Indicators on High-Tech Industry and KnowledgendashIntensive Services annex 3 httpseceuropaeueurostatcachemetadataAnnexeshtec_esms_an3pdf
41
Table A13 Original ownership classification from SBS SBS Code Description
10 Fully state-owned Majority state-owned (statepublic capital gt 50 of equity)
21 State + Romanian private 22 State + foreign 23 State + Romanian private + foreign
Majority privately owned (private capital ge 50 of equity) 26 State + Romanian private 27 State + foreign 28 State + Romanian private + foreign
Fully privately owned 31 Romanian private 32 Romanian private + foreign 40 Cooperative 50 Craft organizations 60 Fully foreign-owned 70 Public of national and local interest
Source World Bank staff calculations based on SBS data set
Table A14 Ownership classification adopted in the analysis SBS codes (combined) Description
10 21 22 23 State owned (fully + majority state-owned) 26 27 28 Private-public (majority private)
31 Fully private (domestic) 32 Fully private (domestic + foreign) 60 Fully private (fully foreign) 70 Public of national and local interest
40 50 Other Source World Bank staff calculations based on SBS data set
Table A15 Conditional correlations between firm characteristics and markup performance regression results
Variable Manufacturing Services Mining All Capital stock (ln) minus0150 minus0039 minus0067 minus0066 Export dummy 0120 0258 0416 0119 RampD dummy 0160 0340 0460 0273 Mature 0022 minus0016 0158 minus0005 Old 0079 0048 0228 0054 Majority state-owned 0527 0139 0772 0200 State-private ownership 0352 0275 0111 0289 Romanian private + foreign 0161 0279 0096 0229 Fully foreign-owned 0105 0263 0 0201 Public of national and local interest 0209 0149 (omitted) 0214 Other 0884 0555 (omitted) 0758 Medium 0230 minus0083 0011 0009 Large 0327 0169 minus0015 0122 1 Alba 0106 minus0087 minus0151 minus0042 2 Arad 0038 minus0090 minus0148 minus0077 3 Arges minus0005 minus0053 minus0195 minus0060
42
Variable Manufacturing Services Mining All 4 Bacau 0092 minus0090 minus0194 minus0055 5 Bihor 0036 minus0115 minus0256 minus0088 6 Bistrita-Nasaud minus0064 minus0156 minus0069 minus0144 7 Botosani 0046 minus0089 minus0438 minus0076 8 Brasov 0041 minus0047 0049 minus0040 9 Braila 0133 minus0055 minus0265 minus0025 10 Buzau 0017 minus0123 minus0025 minus0100 11 Caras-Severin 0035 minus0187 minus0005 minus0139 12 Cluj minus0004 minus0094 minus0119 minus0088 13 Constanta 0057 minus0105 0062 minus0088 14 Covasna 0038 minus0056 minus0151 minus0052 15 Dambovita 0005 minus0183 minus0154 minus0144 16 Dolj 0195 0060 minus0042 0079 17 Galati 0106 minus0007 minus0276 0004 18 Gorj 0084 0028 minus0116 0026 19 Harghita 0101 minus0102 minus0007 minus0045 20 Hunedoara 0167 minus0031 minus0057 0011 21 Ialomita 0138 minus0049 minus0265 minus0027 22 Iasi minus0014 minus0038 minus0384 minus0058 23 Ilfov 0011 0009 0314 0010 24 Maramures 0094 minus0020 minus0042 0 25 Mehedinti 0113 minus0136 minus0720 minus0096 26 Mures 0048 minus0063 minus0093 minus0048 27 Neamt 0001 minus0108 minus0428 minus0102 28 Olt 0073 minus0005 minus0397 minus0011 29 Prahova 0018 minus0034 minus0028 minus0043 30 Satu-Mare 0033 minus0024 minus0056 minus0036 31 Salaj 0075 minus0045 minus0448 minus0031 32 Sibiu 0044 minus0038 minus0154 minus0041 33 Suceava 0044 minus0087 minus0111 minus0074 34 Teleorman 0103 minus0099 minus0299 minus0062 35 Timis 0030 minus0020 minus0341 minus0037 36 Tulcea 0142 minus0149 0096 minus0078 37 Vaslui 0091 minus0017 minus0105 minus0007 38 Valcea 0078 minus0008 minus0122 minus0002 39 Vrancea minus0061 minus0163 minus0608 minus0154 51 Calarasi 0080 minus0122 0672 minus0075 52 Giurgiu 0052 minus0064 minus0334 minus0066
_cons 2147 1150 2291 2246 NACE 4-digit fixed effects Yes Yes Yes Yes
Year fixed effects Yes Yes Yes Yes
R2 0345 0235 0254 0279 Source World Bank staff calculations based on SBS data set Note Dependent variable = ln(markup) denotes significance level at 1 percent at 5 percent and at 10 percent
43
44
Table A16 Conditional correlations between firm characteristics (including productivity) and markup performance regression results
Variable Manufacturing Services Mining All Capital stock (ln) minus0149 minus0038 minus0065 minus0066 Export dummy 0116 0257 0400 0118 RampD dummy 0182 0366 0449 0295 Mature 0021 minus0014 0164 minus0003 Old 0079 0052 0228 0057 Majority state-owned 0529 0147 0758 0209 State-private ownership 0351 0274 0118 0288 Romanian private + foreign 0156 0275 0090 0225 Fully foreign-owned 0096 0254 minus0011 0192 Public of national and local interest 0179 0165 (omitted) 0233 Other 0879 0561 (omitted) 0759 Medium 0232 minus0083 0002 0010 Large 0327 0170 minus0016 0122
Productivity (TFPR) 0051 0020 0041 0024 1 Alba 0114 minus0081 minus0156 minus0035 2 Arad 0045 minus0085 minus0135 minus0071 3 Arges 0001 minus0049 minus0196 minus0056 4 Bacau 0098 minus0084 minus0188 minus0049 5 Bihor 0042 minus0111 minus0268 minus0083 6 Bistrita-Nasaud minus0057 minus0150 minus0055 minus0137 7 Botosani 0053 minus0082 minus0443 minus0069 8 Brasov 0045 minus0042 0033 minus0035 9 Braila 0139 minus0048 minus0243 minus0018 10 Buzau 0022 minus0118 minus0002 minus0094 11 Caras-Severin 0042 minus0178 minus0001 minus0131 12 Cluj minus0001 minus0089 minus0120 minus0083 13 Constanta 0067 minus0101 0056 minus0084 14 Covasna 0045 minus0050 minus0166 minus0046 15 Dambovita 0010 minus0180 minus0162 minus0140 16 Dolj 0202 0068 minus0054 0087 17 Galati 0114 minus0001 minus0289 0010 18 Gorj 0091 0037 minus0118 0035 19 Harghita 0108 minus0096 minus0005 minus0039 20 Hunedoara 0173 minus0025 minus0055 0018 21 Ialomita 0144 minus0045 minus0256 minus0023 22 Iasi minus0005 minus0034 minus0394 minus0053 23 Ilfov 0013 0012 0296 0013 24 Maramures 0101 minus0013 minus0038 0007 25 Mehedinti 0128 minus0132 minus0729 minus0090 26 Mures 0053 minus0057 minus0105 minus0042 27 Neamt 0010 minus0101 minus0434 minus0094
45
Variable Manufacturing Services Mining All 28 Olt 0082 0002 minus0402 minus0004 29 Prahova 0023 minus0029 minus0032 minus0039 30 Satu-Mare 0038 minus0018 minus0047 minus0030 31 Salaj 0081 minus0039 minus0433 minus0025 32 Sibiu 0044 minus0034 minus0147 minus0038 33 Suceava 0051 minus0081 minus0105 minus0068 34 Teleorman 0117 minus0092 minus0296 minus0053 35 Timis 0033 minus0014 minus0340 minus0032 36 Tulcea 0147 minus0142 0078 minus0072 37 Vaslui 0101 minus0011 minus0104 0 38 Valcea 0087 minus0002 minus0120 0004 39 Vrancea minus0053 minus0158 minus0602 minus0148 51 Calarasi 0086 minus0118 0673 minus0071 52 Giurgiu 0059 minus0060 minus0334 minus0061
_cons 1632 0993 1934 2036 NACE 4-digit fixed effects Yes Yes Yes Yes
Year fixed effects Yes Yes Yes Yes
R2 0347 0235 0255 0280 Source World Bank staff calculations based on SBS data set Note Dependent variable = ln(markup) denotes significance level at 1 percent at 5 percent and at 10 percent
Table A17 Productivity growth and markup performance regression results
All Manufacturing Services Mining
Lag markup minus0025 minus0028 minus0026 minus0027 minus0025 minus0027 minus0012 minus0024
Lag markup squared 0001 0000 0001 0003 NACE 4-digit sector fixed effects Yes Yes Yes Yes Yes Yes Yes Yes County fixed effects Yes Yes Yes Yes Yes Yes Yes Yes Year fixed effects Yes Yes Yes Yes Yes Yes Yes Yes
Observations 245525 245525 76694 76694 167120 167120 1711 1711 Source World Bank staff calculations based on SBS data set Note Dependent variable = TFPR growth denotes significance level at 1 percent at 5 percent and at 10 percent
46
Table A18 Productivity (TFPR) growth dividends from a 10 reduction of average markup results by NACE 4-digit sector
NACE 4-digit sector Gain in TFPR growth per
year (percentage points)
1041ndashManufacture of oils and fats 7015 4331ndashPlastering 5547 2060ndashManufacture of man-made fibers 5286 2824ndashManufacture of power-driven hand tools 4869 1072ndashManufacture of rusks and biscuits manufacture of preserved pastry goods and cakes
4145
1104ndashManufacture of other non-distilled fermented beverages 3984 1723ndashManufacture of paper stationery 3716 2812ndashManufacture of fluid power equipment 3566 2452ndashCasting of steel 3278 1101ndashDistilling rectifying and blending of spirits 3134 1420ndashRaising of other cattle and buffaloes 3072 2011ndashManufacture of industrial gases 3033 2593ndashManufacture of wire products chain and springs 2689 2829ndashManufacture of other general-purpose machinery nec 2641 4910ndashPassenger rail transport interurban 2629 2451ndashCasting of iron 2615 3821ndashTreatment and disposal of non-hazardous waste 2375 2059ndashManufacture of other chemical products nec 2336 2920ndashManufacture of bodies (coachwork) for motor vehicles manufacture of trailers and semi-trailers
2270
1051ndashOperation of dairies and cheese making 2224 3313ndashRepair of electronic and optical equipment 2160 1081ndashManufacture of sugar 2158 1073ndashManufacture of macaroni noodles couscous and similar farinaceous products 2081 4213ndashConstruction of bridges and tunnels 2077 2223ndashManufacture of buildersrsquo ware of plastic 2011 2550ndashForging pressing stamping and roll-forming of metal powder metallurgy 1949 2313ndashManufacture of hollow glass 1926 2825ndashManufacture of non-domestic cooling and ventilation equipment 1889 2020ndashManufacture of pesticides and other agrochemical products 1818 2571ndashManufacture of cutlery 1758 5914ndashMotion picture projection activities 1691 5920ndashSound recording and music publishing activities 1665 3514ndashTrade of electricity 1653 1310ndashPreparation and spinning of textile fibers 1616 4920ndashFreight rail transport 1613 4339ndashOther building completion and finishing 1586 2620ndashManufacture of computers and peripheral equipment 1543 4311ndashDemolition 1515 3832ndashRecovery of sorted materials 1404 3523ndashTrade of gas through mains 1382 2410ndashManufacture of basic iron and steel and of ferro-alloys 1353 2399ndashManufacture of other non-metallic mineral products nec 1272 2017ndashManufacture of synthetic rubber in primary forms 1258 7711ndashRental and leasing of cars and light motor vehicles 1256 4212ndashConstruction of railways and underground railways 1128 2453ndashCasting of light metals 1080 7410ndashSpecialized design activities 1068 5630ndashBeverage serving activities 1065 4211ndashConstruction of roads and motorways 0989 4677ndashWholesale of waste and scrap 0926 4676ndashWholesale of other intermediate products 0917 4120ndashConstruction of residential and non-residential buildings 0912 4623ndashWholesale of live animals 0890 6820ndashRental and operating of own or leased real estate 0826 4110ndashDevelopment of building projects 0824
47
NACE 4-digit sector Gain in TFPR growth per year
(percentage points) 4613ndashAgents involved in the sale of timber and building materials 0823 4322ndashPlumbing heat and air-conditioning installation 0731 5629ndashOther food service activities 0699 4791ndashRetail sale via mail order houses or via internet 0659 4941ndashFreight transport by road 0659 4618ndashAgents specialized in the sale of other particular products 0646 7219ndashOther research and experimental development on natural sciences and engineering 0623 4617ndashAgents involved in the sale of food beverages and tobacco 0609 5510ndashHotels and similar accommodation 0560 4615ndashAgents involved in the sale of furniture household goods hardware and ironmongery
0541
4633ndashWholesale of dairy products eggs and edible oils and fats 0540 4778ndashOther retail sale of new goods in specialized stores 0527 4621ndashWholesale of grain unmanufactured tobacco seeds and animal feeds 0517 4662ndashWholesale of machine tools 0501 6110ndashWired telecommunications activities 0491 4634ndashWholesale of beverages 0468 5610ndashRestaurants and mobile food service activities 0463 4631ndashWholesale of fruit and vegetables 0426 4532ndashRetail trade of motor vehicle parts and accessories 0394 1411ndashManufacture of leather clothes 0390 4511ndashSale of cars and light motor vehicles 0382 4637ndashWholesale of coffee tea cocoa and spices 0361 4645ndashWholesale of perfume and cosmetics 0354 1419ndashManufacture of other wearing apparel and accessories 0344 4643ndashWholesale of electrical household appliances 0335 4639ndashNon-specialized wholesale of food beverages and tobacco 0285 4619ndashAgents involved in the sale of a variety of goods 0281 4675ndashWholesale of chemical products 0249 4711ndashRetail sale in non-specialized stores with food beverages or tobacco predominating 0223 4673ndashWholesale of wood construction materials and sanitary equipment 0214 4690ndashNon-specialized wholesale trade 0188 4649ndashWholesale of other household goods 0158 8010ndashPrivate security activities minus0300 8220ndashActivities of call centres minus0323 2572ndashManufacture of locks and hinges minus0503 7120ndashTechnical testing and analysis minus0511 3315ndashRepair and maintenance of ships and boats minus0512 3600ndashWater collection treatment and supply minus0547 4754ndashRetail sale of electrical household appliances in specialized stores minus0627 2341ndashManufacture of ceramic household and ornamental articles minus0646 7111ndashArchitectural activities minus0649 6120ndashWireless telecommunications activities minus0746 7312ndashMedia representation minus1023 4334ndashPainting and glazing minus1200 5020ndashSea and coastal freight water transport minus1276 1052ndashManufacture of ice cream minus1367 5911ndashMotion picture video and television programme production activities minus1439 2592ndashManufacture of light metal packaging minus1619 2752ndashManufacture of non-electric domestic appliances minus1729 2521ndashManufacture of central heating radiators and boilers minus1843 4932ndashTaxi operation minus2568 2013ndashManufacture of other inorganic basic chemicals minus3524 1711ndashManufacture of pulp minus3631 4942ndashRemoval services minus4214 1092ndashManufacture of prepared pet foods minus4262 3040ndashManufacture of military fighting vehicles minus5508 2432ndashCold rolling of narrow strip minus6629
Source World Bank staff calculations based on SBS data set Note The table displays only sectors for which estimated coefficients are statistically significant
48
- 1 Introduction and motivation
- 2 Methodology
- 3 Data set
- 4 Results
-
- 41 Has corporate market power increased at the aggregate level How do aggregate trends differ across sectors Is there a group of firms driving the overall trend
- 42 How have firm dynamics influenced aggregate markup performance Are there signs of market power consolidation among incumbent firms
- 43 Do firm markups differ across firms with different attributes
- 44 What would be the productivity dividends from markup reduction
-
- 5 Conclusions
- References
- Annex 1 Additional figures and tables
-

12
different trends when unraveling markups across sectors Because of their intrinsic characteristics firms are different from each other and contrast in terms of performance even within very narrowly defined sectors (Syverson 2004) These differences could persist either because of supply-side factors such as management skills RampD or investment patterns (Bartelsman and Doms 2000) or because of demand-side factors related to product differentiation customer-producer relationships geographical segmentation among others That said firms across high-level sectorsmdashmanufacturing services and miningmdashhave shown varied performance While the manufacturing (sales-weighted) average markup experienced a decline of minus57 percent over the 2008ndash17 period (figure 1 panel b) there was an opposite and much more rapid trend in services with an aggregate change of 422 percent (see figure 1 panel c) Weighted average markup in mining experienced an uneven trend throughout the same period Nuances are unveiled even within sectors as aggregate markup performance shows different patterns when breaking manufacturing down into groups of sectors according to their technology intensity14 This is also observed when services are broken down into groups of sectors according to their knowledge intensity15 (see figure A11 and figure A12 in annex 1)
Further there is also evidence of changes in the markup firm distribution from 2008 to 2017 revealing an increasing proportion of firms with relatively high markups Figure 2 displays the firm-level distribution of markups in 2008 and 2017 Some changes are noteworthy First both the mean and variance increased over that period But more importantly the upper tail of the distribution became fatter over time suggesting that in 2017 more firms have higher markups than in 2008 This suggests that the rise in average markups is associated with large increases among the firms with the highest markups
14 As per Eurostat classification manufacturing sectors are classified as high-technology medium-high-technology medium-low-technology and low-technology according to technological intensity (RampD expenditure or value added) and based on the statistical classification of economic activities in the European Community (NACE) at the 2-digit level See table A11 in annex 1 with sector aggregation 15 As per Eurostat classification service sectors are classified as knowledge-intensive services (KIS) and less-knowledge-intensive services (LKIS) KISs comprise knowledge-intensive market services high-tech knowledge-intensive services knowledge-intensive financial services and other knowledge-intensive services LKIS comprise less-knowledge-intensive market services and other less-knowledge-intensive services Both KIS and LKIS are based on the share of tertiary educated persons at the NACE 2-digit level See table A12 in annex 1 with sector aggregation
13
Figure 2 Distribution of firm-level markups all sectors 2008 and 2017
Source World Bank staff calculations based on SBS data set
In fact data show that the rise in average markup has been driven by the ability of a small group of firmsmdashthe top decile firmsmdashto increase their markups over time especially after 2014 Figure 3 panel a shows that markup growth has been progressively uneven across firms with firms in the top decile of the markup distribution increasing their average markup faster than the rest of firms Firms in the 90th percentile increased their (sales-weighted) average markup by 285 percent from 2008 to 2017 while the rest of firmsmdashthose below the top decilemdashexperienced a completely opposite trend their weighted markup contracted by 83 percent over the same period This shows that the increase in the weighted average markupmdashof around 15 percent as shown in figure 3 panel amdashcomes mainly from the group of firms in the top decile of the markup distribution The divergence between the top decile and the rest of firms remains even when results are broken down by sectors it is more pronounced in manufacturing despite some volatility (figure 3 panel b) while in services this happens only after 2014 (panel c) The mining sector experienced the opposite trend (panel d) as most of the time (until 2016) the top decile group of the markup distribution reported lower markup growth than the rest of the firms in the data set
02
46
kden
sity
lnmu
-2 0 2 4 6 8Mark-up (ln)
2008 2017
14
Figure 3 Evolution of (sales-weighted) average markup by sector and by top decile and firm groups (top decile firms versus the rest) 2008ndash17
a All sectors b Manufacturing
c Services d Mining
Source World Bank staff calculations based on SBS data set
Overall these results suggest that any analysis about markup performance in Romania should pay attention to a small group of firms the top decile of firms based on markup distribution These firms have been accounting for increasing shares of value added and employment in the economy Figure 4 shows that the share of value added in the whole economy (including manufacturing services and mining sectors) as accounted for by the firms in the top decile of the markup distribution has been increasing jumping from less than 13 percent in 2008 to 231 percent in 2017 The same applies to employment the sample of the top decile of firms accounts for an increasing share of employment generated in the economy across the 2008ndash17 period (figure 5)
91
11
12
13
Mar
k-up
inde
x (2
008=
1)
2008 2009 2010 2011 2012 2013 2014 2015 2016 2017Year
Average (wgtd)perc 90 (wgtd)Rest of firms (below perc 90) (wgtd)
All firms
15
Figure 4 Share of total value added accounted for by the top decile firms 2008ndash17
Figure 5 Share of employment accounted for by the top decile firms 2008ndash17
Source World Bank staff calculations based on SBS data set
Source World Bank staff calculations based on SBS data set
These top decile firms are also typically smaller less productive and less likely to invest in intangible assets than the rest of the firms As highlighted in the methodological section of this paper the increase of markups cannot be unequivocally interpreted as a decline in competition in a given market it can reflect firmsrsquo efficiency gains or adoption of quality-upgrading strategies To explore this aspect a simple econometric analysis was applied to capture performance differences between the group of firms that is leading the markup increase (the top decile firms) and the rest of the firms based on the markup distribution The following specification was adopted
119862119862ℎ119886119886119886119886119886119886119886119886119886119886119886119886119886119886119886119886119904119904119886119886119886119886119886119886119888119888119895119895119894119894119895119895 = 1205751205750 + 1205751205751119879119879119879119879119879119879_119889119889119886119886119886119886119886119886119889119889119886119886119894119894119895119895 + η119895119895 + ρ119895119895 + γ119888119888 + 120583120583119888119888119895119895119894119894119895119895 (8)
where the dependent variable reflects different firm characteristics (of firm i that operates in sector j county c at year t) to be compared Three dependent variables are tested size (measured in terms of the number of full-time employees) productivity (measured as TFPR discounted for markup16) and intangible assets (measured as a dummy that takes the value of 1 for firms having a positive value of intangible fixed assets17) The key explanatory variable is 119879119879119879119879119879119879_119889119889119886119886119886119886119886119886119889119889119886119886119894119894119895119895 a dummy that takes the value of one firm if i is among the top decile of the markup distribution in year tmdashwhile ηt ρj and γc are respectively time NACE 4-digit sector and county fixed effects The parameters of equation (8) are estimated by OLS (or Probit regression maximum likelihood when the dependent variable is the intangible assets dummy) always using heteroscedasticity-robust standard errors Results displayed in table 3 columns 1 and 2 suggest that firms in the 90th percentile of the markup distribution are on average 468
16 TFPR discounted for markup is computed as TFPR-markup In this regard it is not a perfect measure of the true technical efficiency but just a proxy of productivity that accounts for market share and the effect of materials elasticity while other factors such as the effect of product quality or innovation are not considered 17 Value of intangible assets in the SBS data set is defined as value built on (a) RampD expenditure and (b) franchise patents and other similar rights and values
1015
2025
Perc
enta
ge
2008 2009 2010 2011 2012 2013 2014 2015 2016 2017Year
1012
1416
18Pe
rcen
tage
2008 2009 2010 2011 2012 2013 2014 2015 2016 2017Year
16
percent18 smaller and 91 percent 19 less productive than the rest of the firms even within narrowly defined sectors (at NACE 4-digit level) Results in column 3 captures the differences between these two groups of firms in terms of their willingness to invest in intangible assetsmdashtheir ldquoknowledge capacityrdquomdasha key determinant of firmsrsquo expansion in the long term Results suggest that the sample of top decile firms are almost 33 percent less likely to invest in intangible fixed assets than the remaining firms even within NACE 4-digit sectors20 All these correlations are statistically significant at the 1 percent confidence level
Table 3 Characteristics of top decile firms Conditional correlations between markups and firm characteristics (OLS and Probit results)
(Estimation method) Dependent variable (1)
(OLS) Employment
(ln)
(2) (OLS)
TFPR discounted for markup (ln)
(3) (Probit)
Investment in intangibles
(yesno) Top _decile minus0632 minus2422 minus0386 NACE 4-digit sector fixed effects
Yes Yes Yes
County fixed effects Yes Yes Yes Year fixed effects Yes Yes Yes R2 (pseudo R2)a 0238 0728 0078 Observations 484604 403561 484594
Source World Bank staff calculations based on SBS data set Note All firm-year observations (for the 2008ndash17 period) are pooled together and NACE 4-digit sector and year fixed effects are included OLS = ordinary least squares TFPR = revenue-based total factor productivity a It is worth highlighting that R2 value does not influence the consistency of the estimators of each population parameter which is the objective of the current analysis See for instance Cameron and Trivedi (2010) for a theoretical discussion on this matter Moreover since the analysis draws on a large sample the standard errors of the coefficient estimators are not affected because of the law of large numbers The key issue would be the lack of correlation of omitted variables and the explanatory variables However given that the main (theoretical) determinants of the markup performance are included the omitted variables can be understood to be random Statistically significant at 1 percent
In addition the group of 10 top decile firms in the markup distribution operate mainly in the services sector and are overrepresented in less-knowledge-intensive services sectors with some exceptions Table 4 displays the distribution of top decile firms across NACE 2-digit sectors in 2017 To control for the fact that some sectors might be overrepresented (given the SBS survey sampling) the table shows only those sectors for which the probability of a firm being in the top decile is larger than the sectorrsquos frequency ratio Results show that firms in the 90th percentile of markup distribution are overrepresented in wholesale trade and retail trade sectors the probability of a top decile firm being in these two sectorsmdashclassified as less-knowledge-intensive services according to the Eurostat definition
18 This value results from the following expression 100[exp(beta)minus1] where beta equals estimated top 90 percent dummy coefficients in an OLS regression where size is the dependent variable controlling for 4-digit and county fixed effects (table 3 column 1) 19 This value results from the following expression 100[exp(beta)minus1] where beta equals estimated top 90 percent dummy coefficients in an OLS regression where TFPR is the dependent variable controlling for 4-digit and county fixed effects (table 3 column 2) 20 The odds-ratio is computed as the relative difference between the marginal effects for each category (that is 42 percent for the top decile firms and 56 percent for firms below the 90th percentile) Specifically it is computed as follows (56 percent minus 42 percent)(42 percent)
17
(see table A12 in annex 1)mdashis almost 40 percent21 It is worth highlighting however that these top decile firms also operate in some knowledge-intensive services sectors though the probability is much smaller 387 percent for computer programming and 268 percent for security and investigating activities22
When taken together these results suggest that the small group of firms leading the overall increase in markups in Romania does not seem to follow the typical superstar firmsrsquo profile As discussed by Van Reenen (2018) and Autor et al (2017) superstar firmsmdashtypically with higher markups larger and more productive ndash would be rewarded with larger market shares due to their innovative nature This hypothesis does not seem to be supported by data in Romania As results showed the group of firms who are driving the aggregate rise in markupsmdashthe top decile firms of the markup distributionmdashare typically smaller less productive less likely to invest in intangible assets and are mostly active in services sectors where use and diffusion of knowledge is less important This may suggest that the increase in markups in Romania might reflect a less competition-intensive environment rather than changes in the nature of competition where superstar firms would be rewarded with greater market share because they are more efficient and innovative
Table 4 Probability of a top decile firm (in the markup distribution) being in the following sectors
2-digit sector Probability Wholesale trade 2436 Retail trade 1477 Computer programming 387 Manufacturing of wearing apparel 321 Real estate activities 314 Security and investigation activities 268
Source World Bank staff calculations based on SBS data set Note The table shows only sectors for which the probability of a firm being in the top decile of markup distribution is higher than the sectorrsquos overall frequency ratio
42 HOW HAVE FIRM DYNAMICS INFLUENCED AGGREGATE MARKUP PERFORMANCE ARE THERE SIGNS OF MARKET POWER CONSOLIDATION AMONG INCUMBENT FIRMS
To indirectly assess whether the rise in markups is associated with weakening competition the analysis decomposes the evolution of aggregate markups into that of incumbents and of net entry of firms To do so the Melitz and Polanec (2015) decomposition technique is applied to the aggregate markup changes between 2008 and 2017 This approach follows two steps First the aggregate (ln) markup (μ) at year t is defined as
21 Under the NACE 2-digit wholesale trade sector the group of top decile firms are overrepresented in the following NACE 4-digit sectors sector 4690ndashNon-specialized wholesale trade sector 4673ndashWholesale of wood construction materials and sanitary equipment sector 4621ndashWholesale of grain unmanufactured tobacco seeds and animal feeds sector 4646ndashWholesale of pharmaceutical goods sector 4675ndashWholesale of chemical products and sector 4631ndashWholesale of fruit and vegetables Under the NACE 2-digit retail services sector the sample of top decile firms are overrepresented in the following NACE 4-digit sectors sector 4711ndashRetail sale in non-specialized stores with food beverages or tobacco predominating and sector 4730mdashRetail sale of automotive fuel in specialized stores 22 The same analysis is applied for ownership structure again controlling for overrepresentation Results show that the sample of top decile firms are overrepresented in the fully foreign-owned ownership category
18
120583120583119895119895119895119895 = sum sum 119904119904119895119895119894119894119895119895119894119894isinΩ119895119895 120583120583119895119895119894119894119895119895119894119894isin119896119896119895119895 (9)
where sjit is firm irsquos market share at moment t where the market share is defined in terms of firm irsquos revenue weight over the total revenue of sector j (kj) where sector j is the sector to which firm i belongs Then the change of (ln) markup between moments t and tminus1 is decomposed as
Δ120583120583119895119895119895119895 = Δ120583119878119878119895119895119895119895 + Δ119862119862119879119879119907119907119878119878120583120583119878119878119895119895119894119894119895119895 119904119904119878119878119895119895119894119894119895119895 + 119904119904119864119864119895119895119895119895120583120583119864119864119895119895119895119895 minus 120583120583119878119878119895119895119895119895 + 119904119904119883119883119895119895119895119895120583120583119878119878119895119895119895119895 minus 120583120583119883119883119895119895119895119895 (10)
where the subindex S refers to survivor firms (that is those operating in both years t and tminus1 the subindex X denotes firms exiting the market or those firms present in moment tminus1 but not in moment t and E denotes entrants or those firms operating in moment t but not in moment tminus1 Each component expressed in equation (10) represents different drivers to explain aggregate change in markup over the period The first term is the change of the
unweighted average ln markup of survivors or the ldquowithinrdquo component Likewise is the change in the covariance between ln markup and market share for
survivors only This is the ldquobetweenrdquo component and it measures the reallocation of resources among surviving firms The term is the ldquoentryrdquo component and it measures
the difference of the aggregate ln markup of entrants and that of survivors at moment t weighted by the share of entrants over the total population of firms ( ) The entry component will be
positive if the aggregate markup of those firms entering the market is larger than the aggregate markup of the survivors Finally is the exit component which measures the
difference between the aggregate ln markup of survivors and exiting firms at moment tminus1 likewise weighted by the proportion of firms exiting the market that is This term is
positive if the aggregate ln markup of the exiting firms is lower than the aggregate ln markup of survivors In other words and as displayed in equation (10) aggregate markup can growshrink because (a) incumbent firms have increaseddecreased their markups (the ldquowithinrdquo component) (b) incumbent firms with high markups have gainedlost market share (the ldquobetweenrdquo component) and (c) entrant firms have higherlower markups than exiting firms (the ldquoentryrdquo or ldquoexitrdquo component)23
Results show that the increase in aggregate markups has been driven mostly by incumbents rather than entrants and exiting firms Decomposition results for the full sample of firms are displayed in figure 6 Estimations suggest that a large proportion of the aggregate increase in markup in Romania was driven by increases within incumbent firms (the ldquowithinrdquo bar) And among incumbents results show that the rise in markups reflects mostly a markup increase within firms rather than a reallocation of market share away from low-markup to high-markup companies (the ldquobetweenrdquo bar) Meanwhile the entry of new firms with lower markups pulled the change in aggregate markups down (the ldquoentryrdquo bar) and contribution from
23 SBS tends to underestimate entry and exit (populational) figures as a result of its sampling design In this regard the proposed analysis captures entry and exit in the enumerated stratum (above 20 employees) so results will be representative at least for the population of firms in the enumerated stratum
19
exiting firms was negligible
20
Figure 6 Decomposition of percentage change of (sales-weighted) average markup 2008ndash17
Source World Bank staff calculations based on SBS data set
This result could be interpreted as a sign of consolidation of market power among existing firms enabled by remaining product market regulations that restrict competition despite previous reforms Several policy-related factors can explain this result among them government interventions and regulations that restrict competition by reinforcing dominance or limiting entry facilitating collusive outcomes or increasing the cost to compete in markets and discriminating and protecting vested interests24 In this regard Pop and Ore Monago (2020) provide illustrative examples about the presence of regulations that still restrict competition in Romania drawing from the OECDndashWorld Bank Group (WBG) product market regulation (PMR) indicators data set which provides information across 70 countries25 The assessment uses the latest PMR round for Romania from 2013 and includes Romaniarsquos performance projected on the basis of information updated in 2017 Results suggest that the regulatory framework as it is in the books in Romania is less restrictive than that of countries such as Poland and the total sample average but it is more restrictive than that of the OECD and EU-15 countries However from an economywide perspective the overall restrictiveness of regulations in Romania is mainly associated with the state control of the economy and several remaining barriers to entry and rivalry (see figure 7)
24 In principle greater competition outcomes are enabled through an effective competition policy framework which involves three key pillars (a) fostering pro-competition regulations and government interventions (b) promoting competitive neutrality and non-distortive public aid and (c) enabling effective competition law and antitrust enforcement 25 The current PMR database used for this study includes Argentina Australia Austria Belgium Bolivia Brazil Bulgaria Canada Chile China Colombia Costa Rica Croatia Cyprus the Czech Republic Denmark the Dominican Republic Ecuador Arab Republic of Egypt El Salvador Estonia Finland France Germany Greece Guatemala Honduras Hungary Iceland India Indonesia Ireland Israel Italy Jamaica Japan Kenya the Republic of Korea Kuwait Latvia Lithuania Luxembourg Malta Mexico the Netherlands New Zealand Nicaragua Norway Panama Paraguay Peru the Philippines Poland Portugal Romania the Russian Federation Rwanda Senegal the Slovak Republic Slovenia South Africa Spain Sweden Switzerland Turkey Tunisia Ukraine Uruguay the United Kingdom and the United States
21
Figure 7 Product market regulation in Romania and comparator countries
Source Pop and Ore Monago 2020 Note The top five performers in the overall PMR indicator are the Netherlands United Kingdom Austria Denmark and New Zealand Figure shows 2013 information unless otherwise indicated PMR = product market regulation
Barriers to entry and rivalry still affect some service sectors In fact there are examples of regulations that hamper competition in retail trade which concentrates a substantial proportion of high-markup firms in the Romanian economy as seen previously Drawing from the OECD-WBG PMR data set Pop and Ore Monago (2020) show that although regulations in the retail trade sector are less restrictive than in the EU-15 and OECD there is still room for improvement to make the retail trade market more efficient The authors show that licenses and permit requirements may still be imposing an unnecessary burden on entry and increasing the costs to compete in the sector Companies operating in retail sectors in Romania are subject to requirements that go beyond the general conditions formalities and procedures applicable to any company For instance in Romaniarsquos clothing industry licenses and permits are always required compared with 57 percent of OECD countries and 60 percent of EU-15 countries which do not have such a requirement26 In addition Romania has regulations that impose restrictions on entry or expansion of business activities and constrain strategic options to compete in retail markets For instance most of the PMR countries and all top five performers do not restrict firms from selling below cost (beyond a prohibition of predatory pricing) and restrictions on sales promotions are not a common practice either27 In Romania sales below cost are prohibited or restricted beyond a prohibition of predatory pricing Likewise sales promotions are restricted to a particular time of the year28
43 DO FIRM MARKUPS DIFFER ACROSS FIRMS WITH DIFFERENT ATTRIBUTES
To answer this question the analysis explores how markup performance differs across different types of firms To assess the heterogeneity in markups the analysis relates markups to firm-level characteristics such as size age ownership status RampD status and location
26 In this case the least restrictive countries such as Bulgaria Latvia and Sweden do not have such requirements 27 Among the Central and Eastern Europe comparator countries only the Czech Republic and the Slovak Republic apply restrictions on discounted sales pricing while only Poland applies constraints to sales promotions 28 Government Ordinance no 992000 prohibits sales below costs and provides for the conditions and periods when certain types of promotions can take occur
5156 51 52 47 49 53
62 55
3830 42 40 43 39
4333 41
1114
6 9 10 125 5 4
113129 133 134 141 148 156
165 169
0
05
1
15
2
25
3
0
05
1
15
2
25
3
Top 5 -PMR SlovakRepublic
Hungary EU-15average
CzechRepublic
OECDaverage
2013
Romaniasim 2017
Poland Romania
State control (SC) Barriers to entry and rivalry (BER) Barriers to trade and investment (BTI)
Avg of all countries = 190
22
within narrowly defined product markets proxied by NACE 4-digit sectors The following regression is estimated
120583120583119888119888119895119895119894119894119895119895 = 1205751205750 + sum 12057512057511198961198961198791198791199001199001198991198991198961198961198881198881198951198951198941198941198951198957119896119896=2 + sum 1205751205752119903119903119904119904119886119886119904119904119886119886119903119903119888119888119895119895119894119894119895119895
3119903119903=2 + sum 1205751205752119902119902119886119886119886119886119886119886119902119902119888119888119895119895119894119894119895119895
3119902119902=2 + 1205751205753119889119889119888119888119895119895119894119894119895119895
119864119864119864119864119864119864 +1205751205754119889119889119888119888119895119895119894119894119895119895119877119877119877119877119889119889 + 1205751205755119896119896119888119888119895119895119894119894119895119895 + 120578120578119895119895 + 120588120588119895119895 + 120574120574119888119888 + 119906119906119888119888119895119895119894119894119895119895 (11)
where ownkcjit with k = 23hellip7 comprises a set of dummies defining the type of ownership of the firm Romanian private (omitted category) majority state-owned state-private ownership Romanian private and foreign fully foreign-owned public of national and local interest and other (cooperatives and craft organizations)29 The term sizercjit is a set of three dummies controlling for firmsrsquo sizemdashsmall or fewer than 50 employees (omitted category) medium or 51ndash250 employees and large more than 250 employees The term agercjit is a set of three age dummiesmdashyoung or less than 5 years old mature or 6ndash15 years old and older than 15 years Two dichotomous variables are also defined to capture export and RampD profiles dExp and dRnd which take a value of 1 if a firmrsquos direct exports represent more than 10 percent of a firmrsquos total revenue and if a firmrsquos RampD represents more than 1 percent of a firmrsquos total revenue respectively In addition kcjit is firmsrsquo total capital stock value (sum of tangible and intangible assets)30 Finally ηt ρj and γc are respectively time NACE 4-digit sector and county fixed effects Equation (11) is estimated separately for each 1-digit sector (that is manufacturing services and mining) and for the whole economy while the equation parameters are estimated by OLS always using heteroscedasticity-robust standard errors The complete set of results is displayed in table A15 in annex 1
Results show that ownership structure matters to explain markup differences across firms State-controlled companies tend to exert the highest markup premiums in the overall economy and especially in the manufacturing sector Table 5 displays the estimated coefficients of ownership categories multiplied by 100 Except for the mining sector most of estimated coefficients are statistically significant which suggests that ownership structure makes a difference to explain markup performance even for firms operating in the same product market (here proxied by NACE 4-digit sector) county location and year and with similar characteristics in terms of size age and export and RampD profile
In particular firms in which the state has majority or minority ownership demonstrate higher markups when compared with domestic privately owned companies (see table 5 column 4) The average difference in markup is higher for companies with minority state ownership (289 percent) than for fully state-owned companies (200 percent) In manufacturing markups of fully state-owned firms are the highest on average at 527 percent when compared with the reference category (domestic privately owned firms) Results in services are mixed with both private and state ownership extracting high premiums private firms with mixed domestic-foreign ownership show the highest average difference (279 percent) closely followed by minority state-owned companies for which the markup premium
29 More details about the original ownership classification in SBS and the aggregation used for the analysis can be found in table A13 and table A14 in annex 1 30 The variable lnTFPRkit is included as an additional control to test the robustness of the analysis See results in table A16 in annex 1
23
is 275 percent compared with the reference category 31 All results are robust to the inclusion of productivity as an additional control variable (see results in table A16 in annex 1)32
Table 5 Average markup differences by ownership structure relative to domestic privately owned firms
(1) Manufacturing
()
(2) Services
()
(3) Mining
()
(4) All sectors
() Majority state-owned 527 139 772 200 State-private ownership 352 275 ns 289 Domestic private + foreign 161 279 ns 229 Fully foreign-owned 105 263 ns 201 Public of national and local interest
209 149 ns 214
Source World Bank staff calculations based on SBS data set Note Numbers reflect estimated coefficients (multiplied by 100) for ownership dummy categoriesmdashrelative to Romanian private firms the omitted categorymdashin a fixed-effect regression model controlling for firm covariates plus year and NACE 4-digit sector fixed effects as displayed in equation (11) More details about the original ownership classification in SBS and aggregation used for the analysis can be found in table A13 and table A14 in annex 1 See table A15 in annex 1 for the complete set of results ns = not statistically significant
Larger firms and older companies wield higher markups when compared with their counterparts implying that firm size and age are relevant characteristics that influence markup differences As shown in figure 8 old companies (older than 15 years) display higher average markups than young ones (1ndash5 years old) even when they share similar attributes (in terms of ownership structure size and export and RampD profiles) and operate in the same NACE 4-digit sector county and year The estimated average markup premium for old companies (relative to young ones) is 54 percent for the whole economy It varies depending on how data are clustered across large sectors 79 percent in manufacturing 48 percent in services and 228 percent in mining Higher markup premiums for older companies can be interpreted in two ways it can reflect that more experienced firms are able to transpose learning returnsmdashwhich could positively affect their productivity or reduce their marginal costsmdashinto higher markups or that older firms are able to lobby better and create barriers to entry making it more difficult for younger firms to exert competitive pressure Firm size also matters to explain markup performance large companies (with more than 250 full-time employees) tend to display higher markups compared with small companies even when they operate in the same product market and share similar characteristics On average for the whole economy the
31 Results for the category ldquootherrdquo are not shown in table 5 As detailed in table A13 in annex 1 this ldquootherrdquo category refers to SBS ownership answer-codes 40 and 50 respectively ldquocooperativerdquo and ldquopublic of national and local interestrdquo The reason the corresponding results were not highlighted in the main text are twofold First the above-mentioned category accounts for only 006 percent of total companies in the sample Second an in-depth analysis would be needed to understand whether this ldquootherrdquo category reflects potential noise in the way firms self-classify their ownership structures or the way firms report cost expenditures (mainly) or whether this was influenced by SBS sampling design 32 Because the production approach applied in the current analysis delivers both markup and productivity estimates it is possible to further decompose the markup differences across firm characteristics and to verify whether after controlling for differences in marginal costs (that is productivity) certain groups of firms still have higher markups This is precisely one of the mitigating methods employed to reduce the conflation risk as highlighted before Results in table A16 in annex 1 should be interpreted as follows once productivity level is included in the equation differences in marginal cost are accounted for so the coefficient on ldquomajority state-ownedrdquo for instance captures the variation in average prices between majority state-owned and the size reference category (domestic privately owned firms)
24
markup premium for large companies is 122 percent higher than that of small firms (figure 9) Both size and age effects are still present even after controlling for productivity differences (see table A16 in annex 1)33
Figure 8 Average markup differences relative to young firms by age category
Figure 9 Average markup differences relative to small firms by size category
Source World Bank staff calculations based on SBS data set Note Numbers reflect estimated coefficients (multiplied by 100) for age dummy categoriesmdashrelative to young firms (1ndash5 years old) the omitted categorymdashin a fixed-effect regression model controlling for firm covariates plus year county and NACE 4-digit sector fixed effects as displayed in equation (11) All bars reflect statistically significant results See table A15 in annex 1 for the complete set of results
Source World Bank staff calculations based on SBS data set Note Numbers reflect estimated coefficients (multiplied by 100) for size dummy categoriesmdashrelative to small firms (1ndash50 employees) the omitted categorymdashin a fixed-effect regression model controlling for firm covariates plus year county and NACE 4-digit sector fixed effects as displayed in equation (11) All bars reflect statistically significant results See table A15 in annex 1 for the complete set of results
By the same token export intensity also influences markup performance with firms that export earning higher markups Being an exporter is a relevant firm feature to be analyzed when it comes to understanding markup performance Recent models of international trade predict that exporting firms earn higher markups than non-exporting firms either because they are relatively more productive and can thus undercut their rivals (see Melitz and Ottaviano 2008) or because they produce higher-quality goods and rely on higher-quality inputs which allow them to charge higher prices (see Hallak and Sivadasan 2009) In this regard the results summarized in figure 10 are consistent with the literature and suggest that exporting firmsmdashdefined as those whose direct exports represent more than 10 percent of total revenuemdashearn higher markups than non-exporting firms that operate in the same product market (NACE 4-digit sector) the difference ranges from 12 percent to 416 percent depending on how data are clustered across large sectors (manufacturing services and mining)
33 See footnote 32 on how to interpret results in table A16 in annex 1 (after including productivity as an additional control)
22
-160
158
7948
228
54
-505
101520253035
d
iffer
ence
Mature (between 6 and 15 years old)
Old (older than 15)
23
-830
090
327
169122
-15-55
152535
d
iffer
ence
Medium (between 51 and 250)
Large (more than 250 employees)
25
Figure 10 Average markup differences relative to non-exporters by export status
Figure 11 Average markup differences relative to non-RampD performers by RampD status
Source World Bank staff calculations based on SBS data set Note Numbers reflect estimated coefficients (multiplied by 100) for RampD dummy categorymdashrelative to non-RampD performer firms the omitted categorymdashin a fixed-effect regression model controlling for firm covariates plus year county and NACE 4-digit sector fixed effects as displayed in equation (11) All bars reflect statistically significant results See table A15 in annex 1 for the complete set of results
Source World Bank staff calculations based on SBS data set Note Numbers reflect estimated coefficients (multiplied by 100) for export dummy categorymdashrelative to non-exporters the omitted categorymdashin a fixed-effect regression model controlling for firm covariates plus year county and NACE 4-digit sector fixed effects as displayed in equation (11) All bars reflect statistically significant results See table A15 in annex 1 for the complete set of results
Performing RampD activities is positively correlated with markup differences while location proxied by county also matters to explain markup performance Results displayed in figure 11 show that RampD performersmdashidentified by those firms whose RampD expenses surpass more than 1 percent of their total revenuemdashtend to earn higher markups than non-RampD performers The markup premium for RampD performers is always positive suggesting that this group of firms is able to recoup fixed costs associated with RampD activities The magnitude of the premium varies from 16 percent to 46 percent depending how data are clustered across large sectors (manufacturing services and mining) In addition results displayed in figure 12 show that firms in the same product market (at NACE 4-digit level) and with similar characteristics (in terms of ownership age size and export and RampD profiles) charge different markups depending on the county in which they operate Except for Dolj firms in all other counties demonstrate lower average markups than Bucharest the negative markup premium in relation to Bucharest varies from minus154 percent (Vrancea) to minus36 percent (Satu-Mare)
12
258
416
119
05
101520253035404550
d
iffer
ence
160
340
460
273
05
101520253035404550
d
iffer
ence
26
Figure 12 Average markup differences by county relative to Bucharest
Source World Bank staff calculations based on SBS data set Note Numbers reflect estimated coefficients (multiplied by 100) for county fixed effectsmdashrelative to Bucharest the omitted categorymdashin a fixed-effect regression model controlling for firm covariates plus year and NACE 4-digit sector fixed effects as displayed in equation (11) All bars reflect statistically significant results See table A15 in annex 1 for the complete set of results
A variance decomposition analysis suggests that ownership is the most relevant characteristic to explain total variance of markup performance across firms in Romania followed by capital intensity and export status Drawing from estimations of equation (11) it is possible to evaluate the relative importance of each variable to explain the variance of the markup Letting dExp represent any of the explanatory variables of equation (11) the contribution to the variance of the markup of that variable can be defined as
119862119862119879119879119899119899119886119886119889119889119864119864119864119864119864119864 = 12057512057532119881119881119886119886119903119903119889119889119864119864119864119864119864119864+21205751205753119872119872119862119862119862119862(119889119889119864119864119864119864119864119864120583120583minus1205751205753119889119889119864119864119864119864119864119864)119881119881119886119886119903119903(120583120583)
(12)
or as the variance of the variable plus 2 times the covariance of the variable with the part of the markup not explained by that variable A similar expression can be derived for any of the remaining explanatory variables The relative contribution of each variable is computed after discounting the residuals sector and year contributions Results are displayed in figure 13 Ownership structure is shown to be the most relevant feature to explain the variance of markup performance across firms it accounts for 347 percent of the explained variance of markup performance (after removing NACE 4-digit sector and year contributions) The second most important characteristic is capital intensity corresponding to 214 percent of the variance of the markup performance Export status accounts for the third largest share in explained variance 113 percent
d
iffer
ence
27
Figure 13 Contribution by each firm characteristic to explain total variance of markup performance across firms
Source World Bank staff calculations based on SBS data set Note The pie chart reflects markup variance decomposition results It decomposes the variance of markup performance across firms after removing the proportion accounted for by omitted factors NACE 4-digit sector and year contributions
44 WHAT WOULD BE THE PRODUCTIVITY DIVIDENDS FROM MARKUP REDUCTION
While it became evident that aggregate market power in Romania has been rising it is important to analyze its consequences for economic growth An indirect way to measure this is to estimate the productivity dividends that would come from markup reduction The association between markup and productivity can be positive or negative depending on the nature of competition in the specific marketssectors As shown by Autor et al (2017) and Van Reenen (2018) there are marketsmdashsuch as high-tech sectors or knowledge-intensive onesmdashwhere the nature of competition tends to emphasize the importance of network effects economies of scale and scope and intangible assets so the most productive and dynamic firms exert higher markups and obtain larger market shares On the other hand in certain markets where recouping fixed costs (such as RampD) because of higher-risk investments is not that relevant high-markup firms are not necessarily more productive and efficient Another way to look at this contrast is through the inverted-U relationship of innovation and competition to an increase in productivity as explored by Aghion et al (2005) According to this view stronger competition (proxied here by smaller markups) encourages neck-and-neck firms to innovatemdashthe ldquoescape competitionrdquo effectmdashand therefore to increase productivity growth At the same time this view discourages laggard firms from innovating (the Schumpeterian effect) therefore reducing productivity growth The combination of the two effectsmdashescaping competition and discouraging innovationmdashexplains the inverted-U relationship of competition and innovation with productivity growth
To assess the correlation between productivity growth and markups in Romania the analysis uses firm-level estimations of TFPR and markups obtained so far Thus it estimates the specification presented in Aghion Braun and Fedderke (2008) as follows
Δ119889119889119899119899119879119879119897119897119897119897119877119877119888119888119895119895119894119894119895119895 = 1206011206010 + 1206011206011120583120583119888119888119895119895119894119894119895119895 + 120578120578119895119895 + 120588120588119895119895 + 120574120574119888119888 + 120592120592119888119888119895119895119894119894119895119895 (13)
where the left-hand-side variable represents TFPR growth of firm i in NACE 4-digit sector j in year t 120583120583119894119894119895119895119895119895minus1 is the lagged value of firm irsquos markup in sector j in year t ηt ρj and γc are
214
113
79
47
347
64
136
capital intensity Export status RampD status age ownership size region
28
respectively time NACE 4-digit sector and county fixed effects Equation (13) is estimated separately for each 1-digit sector (that is manufacturing services and mining) and for the whole economy while the equation parameters are estimated by OLS always using heteroscedasticity-robust standard errors
Figure 14 Productivity (TFPR) growth dividends from a 10 percent reduction of average markup by sector
Source World Bank staff calculations based on SBS data set Note Results from year county and 4-digit sector fixed effects Coefficient for mining was not statistically significant
Results shows that on average reducing markups would have a positive impact on aggregate productivity expansion Results displayed in table A18 in annex 1 suggest that lower (past) markups are associated with higher (current) productivity growth all coefficients for lagged markups are negative and statistically significant at conventional values for all sectors except mining Overall this negative correlation between past markup level and productivity growth is an indication of a positive association between competition and productivity growth which would be driven by the escape competition effect described by Aghion et al (2008)34
The magnitude of the economic effect of markup reduction on productivity growth is sizable Figure 14 shows that a 10 percent decrease in the average markup of 61 percent for the overall economy in the 2008ndash17 period would imply an increase in productivity (TFPR) growth of 082 percentage point per year The economic effect for the manufacturing sector would be substantially higher reducing the average markup of 403 percent for manufacturing in the same period would imply an increase in TFPR growth of 147 percentage points per year
Further productivity dividends stemming from markup reduction vary substantially across NACE 4-digit sectors The same specification expressed in equation (9) is estimated for each NACE 4-digit sector separately controlling for year and county fixed effects The TFPR growth dividends from markup reduction are computed for each NACE 4-digit sector drawing from the estimated coefficients (see table A18 in annex 1) Results vary substantially
34 An extended specificationmdashwhere the squared value of lagged markup is included as an additional dependent variablemdashwas also estimated The estimated coefficient of the squared term was not statistically significant (see results in table A17 in annex 1)
147
048
082
0
02
04
06
08
1
12
14
16
Manufacturing Services All
Perc
enta
ge p
oint
s per
yea
r
29
across sectors among those 4-digit sectors where the estimated coefficients are statistically significant the productivity growth dividends of a 10 percent decrease in markup vary from 701 percentage points to 016 percentage points respectively for NACE sector 1041ndashManufacture of oil and fats and sector 4649ndashWholesale of other household goods (figure 15)35 Productivity dividends from a potential markup reduction are also positive in sectors where the top decile firms in the markup distribution are overly represented for instance in sector 4711ndashRetail sale in non-specialized stores with food beverages or tobacco predominating a 10 percent decrease of average markup would be associated with an increase in TFPR growth of 022 percentage points per year For sector 4690ndashNon-specialized wholesale trade and sector 4673ndashWholesale of wood construction materials and sanitary equipment the productivity dividends would be 018 and 021 percentage points respectively
Figure 15 Productivity (TFPR) growth dividends from a 10 percent reduction of average markup Results by NACE 4-digit sector
Source World Bank staff calculations based on SBS data set
35 There are however some sectors where markup reduction brings detrimental impacts to productivity expansion See complete set of results in table A18in annex 1 for instance in NACE sector 8010ndashPrivate security activities and sector 2432ndashPrecious metals production where a reduction of average markup in the 2008ndash17 period would imply a decrease of TFPR growth of 030 percentage points and 663 percentage points respectively Following Aghion Braun and Fedderke (2008) the Schumpeterian effect of product market competition would be the underlying driver behind this result in these sectors competition reduces innovation incentives and therefore productivity growth by reducing the rents from innovations of firms below the technological frontier
00
10
20
30
40
50
60
70
80
Perc
enta
ge p
oint
s per
yea
r
30
5 CONCLUSIONS
A stylized fact emerging in the recent empirical literature is the increase in average levels of market power across countries in both developed and emerging economies This paper aims to bring new evidence about the evolution of corporate market power in Romania and the implications for competition dynamics It uses markups as a proxy for market power and explores firm-level heterogeneity to identify the underlying drivers of aggregate trends The paper applies the production approachmdashfollowing De Loecker and Warzynski (2012) De Loecker and Eeckhout (2018) and De Loecker Eeckhout and Unger (2020)mdashto estimate markup at the firm-year level for Romania The Romanian Structural Business Survey data set is used to apply this methodology
Results show that the aggregate markup in Romania increased by around 15 percent between 2008 and 2017 However this aggregate performance masks a lot of heterogeneity the first being heterogeneity of markups across the main sectors While in manufacturing (sales-weighted) average markups experienced a declining pattern of minus57 percent during 2008ndash17 there was an opposite and much more rapid trend in services with an aggregate change of 422 percent
Second at the firm level results suggest that a key driving force behind this aggregate trend was the ability of the top decile of firms in the markup distribution to increase their markups This increase has been faster than for the rest of the firms Firms in the 90th percentile of the markup distribution increased their (sales-weighted) average markup by 285 percent between 2008 and 2017 while the rest of firms (that is those below the top decile firms) experienced a completely opposite trend their weighted markup contracted by 83 percent over the same period
This sample of top decile firms does not seem to follow the typical superstar firmsrsquo profile which suggests that the increase in markups in Romania might be associated with an environment that is less conducive to competition The top decile firms in the markup distribution are 468 percent smaller 910 percent less productive and 33 percent less likely to invest in intangible assets than the rest of the firms in the markup distribution and they are overrepresented in less knowledge-intensive service sectors Therefore they do not seem to follow the typical superstar firmsrsquo profile (typically larger more productive and more likely to invest in intangible assets) This suggests that the increase in markups in Romania might be more due to relatively weak competition rather than to changes in the nature of competition where superstar firms (usually more efficient and innovative) are rewarded with greater market share In fact a decomposition exercise shows that the increase in aggregate markups has been driven mostly by incumbents rather than by new entrants and exiting firms These results could be interpreted as a sign of consolidation of market power among existing firms Several policy-related factors could explain this result among them government interventions and regulations that restrict competition by reinforcing dominance or limiting entry facilitating collusive outcomes or increasing the cost to compete in markets and by discriminating and protecting vested interests In this regard illustrative evidence provided by Pop and Ore Monago (2020) shows that despite reforms regulations that restrict entry and rivalry are still present in the retail trade sector which concentrates a substantial proportion of high-markup firms in the Romanian economy
31
Results also show that certain firm characteristics matter in explaining differences in markup performance size age RampD profile export propensity location and notably ownership State-controlled companies tend to demonstrate the highest markup premiums when compared with domestic privately owned companies 289 percent higher for minority state-owned companies and 20 percent higher for fully state-owned companies Old companies (older than 15 years) display 54 percent higher markups on average than young ones no matter the product market (at NACE 4-digit level) where they operate The markup premium for large companies (with more than 250 full-time employees) is 122 percent higher than that of small firms in the overall economy Exporting firmsmdashthose whose direct exports represent more than 10 percent of total revenuemdashearn 119 percent higher markups than non-exporting firms that operate in the same sector At the same time results show that the markup premium for RampD performers (compared with non-RampD performers) is 273 percent for the whole economy and that firms operating in the same product market charge different markups depending on the county where they operate Overall while all these features matter to explain markup performance a variance decomposition analysis suggests that ownership is the most relevant characteristic to explain total variance of markup performance across firms in Romania
In this context given that ownership assumes a prominent role to explain markup performance it is important to ensure competitively neutral policies across markets where private and public enterprises compete The prominent role of ownership in explaining total variance of markup performance across firms combined with the evidence that state-controlled companies tend to exert the highest markup premiums in the overall economy highlights the importance of ensuring competitive neutrality in Romania so that private and public enterprises compete on a fair basis Analysis presented in Pop and Ore Monago (2020) shows that state-owned enterprises (SOEs) in Romania compete on uneven terms with the private sector because of gaps in terms of both the current regulatory framework as well as its implementation As for the regulatory framework itself lack of competitive neutrality emerges from restrictive SOE governance rules and the exemption of newly setup SOEs from the corporate governance law lack of rules mandating the separation of commercial and noncommercial functions despite legal separation (for example in the railway and energy sectors) and the lack of specific provisions that require SOE investments to show positive rates of returns With regard to implementation of the regulatory framework competitive neutrality gaps stem from (a) the protracted application of corporate governance rules (b) fragmentation of SOE oversight across institutions with frequent overlaps (c) inconsistent reporting of SOE performance that prevents full monitoring and comparability with the private sector performance in comparable situations (d) little clarity in terms of compensation for public service obligations and (e) lack of transparency in state aid allocation
Finally the analysis shows that productivity dividends arise from increased competition in Romania As such lowering markups can boost productivity growth A 10 percent decrease in the average markup for the overall economy during 2008ndash17 would imply an increase in productivity (TFPR) growth of 082 percentage point per year The effect for the manufacturing sector is higher (147 percentage points per year) but lower for services (048 percentage point per year) The ldquoescape competitionrdquo effect described by Aghion Braun and Fedderke (2008)mdashthrough which fiercer competition induces firms to innovate to escape competition with the fringe therefore increasing productivity growthmdashwould be the underlying driver behind these average results for the manufacturing industry Results vary substantially across sectors among
32
those 4-digit sectors where the estimated coefficients are statistically significant the productivity growth dividend of a 10 percent decrease in markup varies from 701 percentage points (sector 1041ndashManufacture of oil and fats) to 016 percentage point (sector 4649ndashWholesale of other household goods)
In this context boosting competition becomes a key part of the engine to drive productivity growth and help consolidate Romaniarsquos convergence to a high-income level Implementing pro-competition policies is instrumental Besides removing anticompetitive regulations and promoting competitive neutrality policy makers should ensure that state aid is allocated in a non-distortive way and enable more effective competition law and antitrust enforcement
33
REFERENCES
Ackerberg D K Caves and G Frazer 2015 ldquoIdentification Properties of Recent Production Function Estimatorsrdquo Econometrica 83 (6) 2411ndash51
Aghion P N Bloom R Blundell R Griffith and P Howitt 2005 ldquoCompetition and Innovation An Inverted-U Relationshiprdquo Quarterly Journal of Economics 120 (2) 701minus28
Aghion P M Braun and J Fedderke 2008 ldquoCompetition and Productivity Growth in South Africardquo Economics of Transition 16 (4) 741ndash68
Autor D D Dorn F Lawrence C Patterson and J Van Reenen 2017 ldquoThe Fall of the Labor Share and the Rise of Superstar Firmsrdquo NBER Working Paper 23396 National Bureau of Economic Research Cambridge MA
Barkai S 2020 ldquoDeclining Labor and Capital Sharesrdquo Journal of Finance 75 (5) 2421ndash63
Bartelsman E J and M Doms 2000 ldquoUnderstanding Productivity Lessons from Longitudinal Microdatardquo Journal of Economic Literature 38 (3) 569ndash94
Berry S J Levinsohn and A Pakes 1995 ldquoAutomobile Prices in Market Equilibriumrdquo Econometrica Journal of the Econometric Society 63 (4) 841ndash90
Berry S J Levinsohn and A Pakes 2004 ldquoDifferentiated Products Demand Systems from a Combination of Micro and Macro Data The New Car Marketrdquo Journal of Political Economy 112 (1) 68ndash105
Bessen J 2017 ldquoInformation Technology and Industry Concentrationrdquo Law and Economics Paper No 17-41 Boston University School of Law Boston
Bond S A Hashemi G Kaplan and P Zoch 2020 ldquoSome Unpleasant Markup Arithmetic Production Function Elasticities and their Estimation from Production Datardquo NBER Working Paper No 27002 National Bureau of Economic Research Cambridge MA
Bresnahan T F 1989 ldquoEmpirical Studies of Industries with Market Powerrdquo In Handbook of Industrial Organization Vol 2 edited by R Schmalensee and R Willig 1011ndash57 Amsterdam Elsevier
Cameron A C and P K Trivedi 2010 Microeconometrics Using Stata (Rev ed) College Station TX Stata Press
Crouzet N and J Eberly 2018 ldquoUnderstanding Weak Capital Investment The Role of Market Concentration and Intangiblesrdquo NBER Working Paper 25869 National Bureau of Economic Research Cambridge MA De Loecker J 2011 ldquoRecovering Markups from Production Datardquo International Journal of Industrial Organization 29 (3) 350ndash55
De Loecker J 2013 ldquoDetecting Learning by Exportingrdquo American Economic Journal Microeconomics 5 (3) 1ndash21
De Loecker J and J Eeckhout 2018 ldquoGlobal Market Powerrdquo NBER Working Paper 24768 National Bureau of Economic Research Cambridge MA
De Loecker J J Eeckhout and G Unger 2020 ldquoThe Rise of Market Power and the Macroeconomic Implicationsrdquo Quarterly Journal of Economics 135 (2) 561ndash644 httpsdoiorg101093qjeqjz041
34
De Loecker J and F Warzynski 2012 ldquoMark-ups and Firm-Level Export Statusrdquo American Economic Review 102 (6) 2437ndash71
Diacuteez F D Leigh and S Tambunlertchai 2018 ldquoGlobal Market Power and Its Macroeconomic Implicationsrdquo IMF Working Paper 18137 International Monetary Fund Washington DC
Grullon G Y Larkin and R Michaely 2018 ldquoAre US Industries Becoming More Concentratedrdquo Swiss Finance Institute Research Paper No 19-41 httpdxdoiorg102139ssrn2612047
Gutieacuterrez G and T Philippon 2017a ldquoDeclining Competition and Investment in the USrdquo NBER Working Paper 23583 National Bureau of Economic Research Cambridge MA Gutieacuterrez G and T Philippon 2017b ldquoInvestment-less Growth An Empirical Investigationrdquo Brookings Papers on Economic Activity (Fall) 89ndash182 Gutieacuterrez G and T Philippon 2018 ldquoHow EU Markets Became More Competitive than US Markets A Study of Institutional Driftrdquo NBER Working Paper 24700 National Bureau of Economic Research Cambridge MA
Hall R 1988 ldquoThe Relation between Price and Marginal Cost in US Industryrdquo Journal of Political Economy 96 (5) 921ndash47
Hallak J and J Sivadasan 2009 ldquoExporting Behavior under Quality Constraintsrdquo NBER Working Paper 14928 National Bureau of Economic Research Cambridge MA
IMF (International Monetary Fund) 2019 World Economic Outlook April 2019 Growth Slowdown Precarious Recovery Washington DC International Monetary Fund
Koujianou Goldberg P and R Hellerstein 2012 A Structural Approach to Identifying the Sources of Local Currency Price Stability Review of Economic Studies 80 (1) 175ndash210
Melitz M J and G Ottaviano 2008 ldquoMarket Size Trade and Productivityrdquo Review of Economic Studies 75 (1) 295ndash316
Melitz M J and S Polanec 2015 ldquoDynamic Olley-Pakes Productivity Decomposition with Entry and Exitrdquo RAND Journal of Economics 46 (2) 362ndash75
Motta M 2004 Competition Policy Theory and Practice Cambridge MA Cambridge University Press
Pop G and T Ore Monago 2020 ldquoCompetition and Government Interventions in Romania An Assessment with Focus on Product Market Regulations and Competitive Neutralityrdquo Background paper for Markets and People Romania Country Economic Memorandum International Development in Focus World Bank Washington DC
Shapiro C 2018 ldquoAntitrust in a Time of Populismrdquo International Journal of Industrial Organization 61 714ndash48
Syverson C 2004 ldquoProduct Substitutability and Productivity Dispersionrdquo Review of Economics and Statistics 86 (2) 534ndash50
Van Reenen J 2018 ldquoIncreasing Differences between Firms Market Power and the Macroeconomyrdquo CEPR Discussion Paper 1576 Center for Economic and Policy Research Washington DC
35
World Bank 2020a ldquoMarkets and People Romania Country Economic Memorandumrdquo International Development in Focus World Bank Washington DC
World Bank 2020b ldquoAssessing the Direct and Indirect Impact of State Aid in Romania An Ex-post Evaluationrdquo World Bank Washington DC
36
ANNEX 1 ADDITIONAL FIGURES AND TABLES
Figure A11 Evolution of (sales-weighted) average markup in manufacturing sector by technology intensity 2008ndash17
Source World Bank staff calculations based on SBS data set
Table A11 Manufacturing industry groups by technology intensity Eurostat classification
85
99
51
Mar
k-up i
ndex
(200
8 = 1
)
2008 2009 2010 2011 2012 2013 2014 2015 2016 2017Year
Manuf High-tech
37
Source Eurostat Indicators on High-Tech Industry and KnowledgendashIntensive Services annex 3 httpseceuropaeueurostatcachemetadataAnnexeshtec_esms_an3pdf
38
Figure A12 Evolution of (sales-weighted) average markup in services sector by knowledge intensity
39
Table A12 Services groups by knowledge intensity Eurostat classification
40
Source Eurostat Indicators on High-Tech Industry and KnowledgendashIntensive Services annex 3 httpseceuropaeueurostatcachemetadataAnnexeshtec_esms_an3pdf
41
Table A13 Original ownership classification from SBS SBS Code Description
10 Fully state-owned Majority state-owned (statepublic capital gt 50 of equity)
21 State + Romanian private 22 State + foreign 23 State + Romanian private + foreign
Majority privately owned (private capital ge 50 of equity) 26 State + Romanian private 27 State + foreign 28 State + Romanian private + foreign
Fully privately owned 31 Romanian private 32 Romanian private + foreign 40 Cooperative 50 Craft organizations 60 Fully foreign-owned 70 Public of national and local interest
Source World Bank staff calculations based on SBS data set
Table A14 Ownership classification adopted in the analysis SBS codes (combined) Description
10 21 22 23 State owned (fully + majority state-owned) 26 27 28 Private-public (majority private)
31 Fully private (domestic) 32 Fully private (domestic + foreign) 60 Fully private (fully foreign) 70 Public of national and local interest
40 50 Other Source World Bank staff calculations based on SBS data set
Table A15 Conditional correlations between firm characteristics and markup performance regression results
Variable Manufacturing Services Mining All Capital stock (ln) minus0150 minus0039 minus0067 minus0066 Export dummy 0120 0258 0416 0119 RampD dummy 0160 0340 0460 0273 Mature 0022 minus0016 0158 minus0005 Old 0079 0048 0228 0054 Majority state-owned 0527 0139 0772 0200 State-private ownership 0352 0275 0111 0289 Romanian private + foreign 0161 0279 0096 0229 Fully foreign-owned 0105 0263 0 0201 Public of national and local interest 0209 0149 (omitted) 0214 Other 0884 0555 (omitted) 0758 Medium 0230 minus0083 0011 0009 Large 0327 0169 minus0015 0122 1 Alba 0106 minus0087 minus0151 minus0042 2 Arad 0038 minus0090 minus0148 minus0077 3 Arges minus0005 minus0053 minus0195 minus0060
42
Variable Manufacturing Services Mining All 4 Bacau 0092 minus0090 minus0194 minus0055 5 Bihor 0036 minus0115 minus0256 minus0088 6 Bistrita-Nasaud minus0064 minus0156 minus0069 minus0144 7 Botosani 0046 minus0089 minus0438 minus0076 8 Brasov 0041 minus0047 0049 minus0040 9 Braila 0133 minus0055 minus0265 minus0025 10 Buzau 0017 minus0123 minus0025 minus0100 11 Caras-Severin 0035 minus0187 minus0005 minus0139 12 Cluj minus0004 minus0094 minus0119 minus0088 13 Constanta 0057 minus0105 0062 minus0088 14 Covasna 0038 minus0056 minus0151 minus0052 15 Dambovita 0005 minus0183 minus0154 minus0144 16 Dolj 0195 0060 minus0042 0079 17 Galati 0106 minus0007 minus0276 0004 18 Gorj 0084 0028 minus0116 0026 19 Harghita 0101 minus0102 minus0007 minus0045 20 Hunedoara 0167 minus0031 minus0057 0011 21 Ialomita 0138 minus0049 minus0265 minus0027 22 Iasi minus0014 minus0038 minus0384 minus0058 23 Ilfov 0011 0009 0314 0010 24 Maramures 0094 minus0020 minus0042 0 25 Mehedinti 0113 minus0136 minus0720 minus0096 26 Mures 0048 minus0063 minus0093 minus0048 27 Neamt 0001 minus0108 minus0428 minus0102 28 Olt 0073 minus0005 minus0397 minus0011 29 Prahova 0018 minus0034 minus0028 minus0043 30 Satu-Mare 0033 minus0024 minus0056 minus0036 31 Salaj 0075 minus0045 minus0448 minus0031 32 Sibiu 0044 minus0038 minus0154 minus0041 33 Suceava 0044 minus0087 minus0111 minus0074 34 Teleorman 0103 minus0099 minus0299 minus0062 35 Timis 0030 minus0020 minus0341 minus0037 36 Tulcea 0142 minus0149 0096 minus0078 37 Vaslui 0091 minus0017 minus0105 minus0007 38 Valcea 0078 minus0008 minus0122 minus0002 39 Vrancea minus0061 minus0163 minus0608 minus0154 51 Calarasi 0080 minus0122 0672 minus0075 52 Giurgiu 0052 minus0064 minus0334 minus0066
_cons 2147 1150 2291 2246 NACE 4-digit fixed effects Yes Yes Yes Yes
Year fixed effects Yes Yes Yes Yes
R2 0345 0235 0254 0279 Source World Bank staff calculations based on SBS data set Note Dependent variable = ln(markup) denotes significance level at 1 percent at 5 percent and at 10 percent
43
44
Table A16 Conditional correlations between firm characteristics (including productivity) and markup performance regression results
Variable Manufacturing Services Mining All Capital stock (ln) minus0149 minus0038 minus0065 minus0066 Export dummy 0116 0257 0400 0118 RampD dummy 0182 0366 0449 0295 Mature 0021 minus0014 0164 minus0003 Old 0079 0052 0228 0057 Majority state-owned 0529 0147 0758 0209 State-private ownership 0351 0274 0118 0288 Romanian private + foreign 0156 0275 0090 0225 Fully foreign-owned 0096 0254 minus0011 0192 Public of national and local interest 0179 0165 (omitted) 0233 Other 0879 0561 (omitted) 0759 Medium 0232 minus0083 0002 0010 Large 0327 0170 minus0016 0122
Productivity (TFPR) 0051 0020 0041 0024 1 Alba 0114 minus0081 minus0156 minus0035 2 Arad 0045 minus0085 minus0135 minus0071 3 Arges 0001 minus0049 minus0196 minus0056 4 Bacau 0098 minus0084 minus0188 minus0049 5 Bihor 0042 minus0111 minus0268 minus0083 6 Bistrita-Nasaud minus0057 minus0150 minus0055 minus0137 7 Botosani 0053 minus0082 minus0443 minus0069 8 Brasov 0045 minus0042 0033 minus0035 9 Braila 0139 minus0048 minus0243 minus0018 10 Buzau 0022 minus0118 minus0002 minus0094 11 Caras-Severin 0042 minus0178 minus0001 minus0131 12 Cluj minus0001 minus0089 minus0120 minus0083 13 Constanta 0067 minus0101 0056 minus0084 14 Covasna 0045 minus0050 minus0166 minus0046 15 Dambovita 0010 minus0180 minus0162 minus0140 16 Dolj 0202 0068 minus0054 0087 17 Galati 0114 minus0001 minus0289 0010 18 Gorj 0091 0037 minus0118 0035 19 Harghita 0108 minus0096 minus0005 minus0039 20 Hunedoara 0173 minus0025 minus0055 0018 21 Ialomita 0144 minus0045 minus0256 minus0023 22 Iasi minus0005 minus0034 minus0394 minus0053 23 Ilfov 0013 0012 0296 0013 24 Maramures 0101 minus0013 minus0038 0007 25 Mehedinti 0128 minus0132 minus0729 minus0090 26 Mures 0053 minus0057 minus0105 minus0042 27 Neamt 0010 minus0101 minus0434 minus0094
45
Variable Manufacturing Services Mining All 28 Olt 0082 0002 minus0402 minus0004 29 Prahova 0023 minus0029 minus0032 minus0039 30 Satu-Mare 0038 minus0018 minus0047 minus0030 31 Salaj 0081 minus0039 minus0433 minus0025 32 Sibiu 0044 minus0034 minus0147 minus0038 33 Suceava 0051 minus0081 minus0105 minus0068 34 Teleorman 0117 minus0092 minus0296 minus0053 35 Timis 0033 minus0014 minus0340 minus0032 36 Tulcea 0147 minus0142 0078 minus0072 37 Vaslui 0101 minus0011 minus0104 0 38 Valcea 0087 minus0002 minus0120 0004 39 Vrancea minus0053 minus0158 minus0602 minus0148 51 Calarasi 0086 minus0118 0673 minus0071 52 Giurgiu 0059 minus0060 minus0334 minus0061
_cons 1632 0993 1934 2036 NACE 4-digit fixed effects Yes Yes Yes Yes
Year fixed effects Yes Yes Yes Yes
R2 0347 0235 0255 0280 Source World Bank staff calculations based on SBS data set Note Dependent variable = ln(markup) denotes significance level at 1 percent at 5 percent and at 10 percent
Table A17 Productivity growth and markup performance regression results
All Manufacturing Services Mining
Lag markup minus0025 minus0028 minus0026 minus0027 minus0025 minus0027 minus0012 minus0024
Lag markup squared 0001 0000 0001 0003 NACE 4-digit sector fixed effects Yes Yes Yes Yes Yes Yes Yes Yes County fixed effects Yes Yes Yes Yes Yes Yes Yes Yes Year fixed effects Yes Yes Yes Yes Yes Yes Yes Yes
Observations 245525 245525 76694 76694 167120 167120 1711 1711 Source World Bank staff calculations based on SBS data set Note Dependent variable = TFPR growth denotes significance level at 1 percent at 5 percent and at 10 percent
46
Table A18 Productivity (TFPR) growth dividends from a 10 reduction of average markup results by NACE 4-digit sector
NACE 4-digit sector Gain in TFPR growth per
year (percentage points)
1041ndashManufacture of oils and fats 7015 4331ndashPlastering 5547 2060ndashManufacture of man-made fibers 5286 2824ndashManufacture of power-driven hand tools 4869 1072ndashManufacture of rusks and biscuits manufacture of preserved pastry goods and cakes
4145
1104ndashManufacture of other non-distilled fermented beverages 3984 1723ndashManufacture of paper stationery 3716 2812ndashManufacture of fluid power equipment 3566 2452ndashCasting of steel 3278 1101ndashDistilling rectifying and blending of spirits 3134 1420ndashRaising of other cattle and buffaloes 3072 2011ndashManufacture of industrial gases 3033 2593ndashManufacture of wire products chain and springs 2689 2829ndashManufacture of other general-purpose machinery nec 2641 4910ndashPassenger rail transport interurban 2629 2451ndashCasting of iron 2615 3821ndashTreatment and disposal of non-hazardous waste 2375 2059ndashManufacture of other chemical products nec 2336 2920ndashManufacture of bodies (coachwork) for motor vehicles manufacture of trailers and semi-trailers
2270
1051ndashOperation of dairies and cheese making 2224 3313ndashRepair of electronic and optical equipment 2160 1081ndashManufacture of sugar 2158 1073ndashManufacture of macaroni noodles couscous and similar farinaceous products 2081 4213ndashConstruction of bridges and tunnels 2077 2223ndashManufacture of buildersrsquo ware of plastic 2011 2550ndashForging pressing stamping and roll-forming of metal powder metallurgy 1949 2313ndashManufacture of hollow glass 1926 2825ndashManufacture of non-domestic cooling and ventilation equipment 1889 2020ndashManufacture of pesticides and other agrochemical products 1818 2571ndashManufacture of cutlery 1758 5914ndashMotion picture projection activities 1691 5920ndashSound recording and music publishing activities 1665 3514ndashTrade of electricity 1653 1310ndashPreparation and spinning of textile fibers 1616 4920ndashFreight rail transport 1613 4339ndashOther building completion and finishing 1586 2620ndashManufacture of computers and peripheral equipment 1543 4311ndashDemolition 1515 3832ndashRecovery of sorted materials 1404 3523ndashTrade of gas through mains 1382 2410ndashManufacture of basic iron and steel and of ferro-alloys 1353 2399ndashManufacture of other non-metallic mineral products nec 1272 2017ndashManufacture of synthetic rubber in primary forms 1258 7711ndashRental and leasing of cars and light motor vehicles 1256 4212ndashConstruction of railways and underground railways 1128 2453ndashCasting of light metals 1080 7410ndashSpecialized design activities 1068 5630ndashBeverage serving activities 1065 4211ndashConstruction of roads and motorways 0989 4677ndashWholesale of waste and scrap 0926 4676ndashWholesale of other intermediate products 0917 4120ndashConstruction of residential and non-residential buildings 0912 4623ndashWholesale of live animals 0890 6820ndashRental and operating of own or leased real estate 0826 4110ndashDevelopment of building projects 0824
47
NACE 4-digit sector Gain in TFPR growth per year
(percentage points) 4613ndashAgents involved in the sale of timber and building materials 0823 4322ndashPlumbing heat and air-conditioning installation 0731 5629ndashOther food service activities 0699 4791ndashRetail sale via mail order houses or via internet 0659 4941ndashFreight transport by road 0659 4618ndashAgents specialized in the sale of other particular products 0646 7219ndashOther research and experimental development on natural sciences and engineering 0623 4617ndashAgents involved in the sale of food beverages and tobacco 0609 5510ndashHotels and similar accommodation 0560 4615ndashAgents involved in the sale of furniture household goods hardware and ironmongery
0541
4633ndashWholesale of dairy products eggs and edible oils and fats 0540 4778ndashOther retail sale of new goods in specialized stores 0527 4621ndashWholesale of grain unmanufactured tobacco seeds and animal feeds 0517 4662ndashWholesale of machine tools 0501 6110ndashWired telecommunications activities 0491 4634ndashWholesale of beverages 0468 5610ndashRestaurants and mobile food service activities 0463 4631ndashWholesale of fruit and vegetables 0426 4532ndashRetail trade of motor vehicle parts and accessories 0394 1411ndashManufacture of leather clothes 0390 4511ndashSale of cars and light motor vehicles 0382 4637ndashWholesale of coffee tea cocoa and spices 0361 4645ndashWholesale of perfume and cosmetics 0354 1419ndashManufacture of other wearing apparel and accessories 0344 4643ndashWholesale of electrical household appliances 0335 4639ndashNon-specialized wholesale of food beverages and tobacco 0285 4619ndashAgents involved in the sale of a variety of goods 0281 4675ndashWholesale of chemical products 0249 4711ndashRetail sale in non-specialized stores with food beverages or tobacco predominating 0223 4673ndashWholesale of wood construction materials and sanitary equipment 0214 4690ndashNon-specialized wholesale trade 0188 4649ndashWholesale of other household goods 0158 8010ndashPrivate security activities minus0300 8220ndashActivities of call centres minus0323 2572ndashManufacture of locks and hinges minus0503 7120ndashTechnical testing and analysis minus0511 3315ndashRepair and maintenance of ships and boats minus0512 3600ndashWater collection treatment and supply minus0547 4754ndashRetail sale of electrical household appliances in specialized stores minus0627 2341ndashManufacture of ceramic household and ornamental articles minus0646 7111ndashArchitectural activities minus0649 6120ndashWireless telecommunications activities minus0746 7312ndashMedia representation minus1023 4334ndashPainting and glazing minus1200 5020ndashSea and coastal freight water transport minus1276 1052ndashManufacture of ice cream minus1367 5911ndashMotion picture video and television programme production activities minus1439 2592ndashManufacture of light metal packaging minus1619 2752ndashManufacture of non-electric domestic appliances minus1729 2521ndashManufacture of central heating radiators and boilers minus1843 4932ndashTaxi operation minus2568 2013ndashManufacture of other inorganic basic chemicals minus3524 1711ndashManufacture of pulp minus3631 4942ndashRemoval services minus4214 1092ndashManufacture of prepared pet foods minus4262 3040ndashManufacture of military fighting vehicles minus5508 2432ndashCold rolling of narrow strip minus6629
Source World Bank staff calculations based on SBS data set Note The table displays only sectors for which estimated coefficients are statistically significant
48
- 1 Introduction and motivation
- 2 Methodology
- 3 Data set
- 4 Results
-
- 41 Has corporate market power increased at the aggregate level How do aggregate trends differ across sectors Is there a group of firms driving the overall trend
- 42 How have firm dynamics influenced aggregate markup performance Are there signs of market power consolidation among incumbent firms
- 43 Do firm markups differ across firms with different attributes
- 44 What would be the productivity dividends from markup reduction
-
- 5 Conclusions
- References
- Annex 1 Additional figures and tables
-

13
Figure 2 Distribution of firm-level markups all sectors 2008 and 2017
Source World Bank staff calculations based on SBS data set
In fact data show that the rise in average markup has been driven by the ability of a small group of firmsmdashthe top decile firmsmdashto increase their markups over time especially after 2014 Figure 3 panel a shows that markup growth has been progressively uneven across firms with firms in the top decile of the markup distribution increasing their average markup faster than the rest of firms Firms in the 90th percentile increased their (sales-weighted) average markup by 285 percent from 2008 to 2017 while the rest of firmsmdashthose below the top decilemdashexperienced a completely opposite trend their weighted markup contracted by 83 percent over the same period This shows that the increase in the weighted average markupmdashof around 15 percent as shown in figure 3 panel amdashcomes mainly from the group of firms in the top decile of the markup distribution The divergence between the top decile and the rest of firms remains even when results are broken down by sectors it is more pronounced in manufacturing despite some volatility (figure 3 panel b) while in services this happens only after 2014 (panel c) The mining sector experienced the opposite trend (panel d) as most of the time (until 2016) the top decile group of the markup distribution reported lower markup growth than the rest of the firms in the data set
02
46
kden
sity
lnmu
-2 0 2 4 6 8Mark-up (ln)
2008 2017
14
Figure 3 Evolution of (sales-weighted) average markup by sector and by top decile and firm groups (top decile firms versus the rest) 2008ndash17
a All sectors b Manufacturing
c Services d Mining
Source World Bank staff calculations based on SBS data set
Overall these results suggest that any analysis about markup performance in Romania should pay attention to a small group of firms the top decile of firms based on markup distribution These firms have been accounting for increasing shares of value added and employment in the economy Figure 4 shows that the share of value added in the whole economy (including manufacturing services and mining sectors) as accounted for by the firms in the top decile of the markup distribution has been increasing jumping from less than 13 percent in 2008 to 231 percent in 2017 The same applies to employment the sample of the top decile of firms accounts for an increasing share of employment generated in the economy across the 2008ndash17 period (figure 5)
91
11
12
13
Mar
k-up
inde
x (2
008=
1)
2008 2009 2010 2011 2012 2013 2014 2015 2016 2017Year
Average (wgtd)perc 90 (wgtd)Rest of firms (below perc 90) (wgtd)
All firms
15
Figure 4 Share of total value added accounted for by the top decile firms 2008ndash17
Figure 5 Share of employment accounted for by the top decile firms 2008ndash17
Source World Bank staff calculations based on SBS data set
Source World Bank staff calculations based on SBS data set
These top decile firms are also typically smaller less productive and less likely to invest in intangible assets than the rest of the firms As highlighted in the methodological section of this paper the increase of markups cannot be unequivocally interpreted as a decline in competition in a given market it can reflect firmsrsquo efficiency gains or adoption of quality-upgrading strategies To explore this aspect a simple econometric analysis was applied to capture performance differences between the group of firms that is leading the markup increase (the top decile firms) and the rest of the firms based on the markup distribution The following specification was adopted
119862119862ℎ119886119886119886119886119886119886119886119886119886119886119886119886119886119886119886119886119904119904119886119886119886119886119886119886119888119888119895119895119894119894119895119895 = 1205751205750 + 1205751205751119879119879119879119879119879119879_119889119889119886119886119886119886119886119886119889119889119886119886119894119894119895119895 + η119895119895 + ρ119895119895 + γ119888119888 + 120583120583119888119888119895119895119894119894119895119895 (8)
where the dependent variable reflects different firm characteristics (of firm i that operates in sector j county c at year t) to be compared Three dependent variables are tested size (measured in terms of the number of full-time employees) productivity (measured as TFPR discounted for markup16) and intangible assets (measured as a dummy that takes the value of 1 for firms having a positive value of intangible fixed assets17) The key explanatory variable is 119879119879119879119879119879119879_119889119889119886119886119886119886119886119886119889119889119886119886119894119894119895119895 a dummy that takes the value of one firm if i is among the top decile of the markup distribution in year tmdashwhile ηt ρj and γc are respectively time NACE 4-digit sector and county fixed effects The parameters of equation (8) are estimated by OLS (or Probit regression maximum likelihood when the dependent variable is the intangible assets dummy) always using heteroscedasticity-robust standard errors Results displayed in table 3 columns 1 and 2 suggest that firms in the 90th percentile of the markup distribution are on average 468
16 TFPR discounted for markup is computed as TFPR-markup In this regard it is not a perfect measure of the true technical efficiency but just a proxy of productivity that accounts for market share and the effect of materials elasticity while other factors such as the effect of product quality or innovation are not considered 17 Value of intangible assets in the SBS data set is defined as value built on (a) RampD expenditure and (b) franchise patents and other similar rights and values
1015
2025
Perc
enta
ge
2008 2009 2010 2011 2012 2013 2014 2015 2016 2017Year
1012
1416
18Pe
rcen
tage
2008 2009 2010 2011 2012 2013 2014 2015 2016 2017Year
16
percent18 smaller and 91 percent 19 less productive than the rest of the firms even within narrowly defined sectors (at NACE 4-digit level) Results in column 3 captures the differences between these two groups of firms in terms of their willingness to invest in intangible assetsmdashtheir ldquoknowledge capacityrdquomdasha key determinant of firmsrsquo expansion in the long term Results suggest that the sample of top decile firms are almost 33 percent less likely to invest in intangible fixed assets than the remaining firms even within NACE 4-digit sectors20 All these correlations are statistically significant at the 1 percent confidence level
Table 3 Characteristics of top decile firms Conditional correlations between markups and firm characteristics (OLS and Probit results)
(Estimation method) Dependent variable (1)
(OLS) Employment
(ln)
(2) (OLS)
TFPR discounted for markup (ln)
(3) (Probit)
Investment in intangibles
(yesno) Top _decile minus0632 minus2422 minus0386 NACE 4-digit sector fixed effects
Yes Yes Yes
County fixed effects Yes Yes Yes Year fixed effects Yes Yes Yes R2 (pseudo R2)a 0238 0728 0078 Observations 484604 403561 484594
Source World Bank staff calculations based on SBS data set Note All firm-year observations (for the 2008ndash17 period) are pooled together and NACE 4-digit sector and year fixed effects are included OLS = ordinary least squares TFPR = revenue-based total factor productivity a It is worth highlighting that R2 value does not influence the consistency of the estimators of each population parameter which is the objective of the current analysis See for instance Cameron and Trivedi (2010) for a theoretical discussion on this matter Moreover since the analysis draws on a large sample the standard errors of the coefficient estimators are not affected because of the law of large numbers The key issue would be the lack of correlation of omitted variables and the explanatory variables However given that the main (theoretical) determinants of the markup performance are included the omitted variables can be understood to be random Statistically significant at 1 percent
In addition the group of 10 top decile firms in the markup distribution operate mainly in the services sector and are overrepresented in less-knowledge-intensive services sectors with some exceptions Table 4 displays the distribution of top decile firms across NACE 2-digit sectors in 2017 To control for the fact that some sectors might be overrepresented (given the SBS survey sampling) the table shows only those sectors for which the probability of a firm being in the top decile is larger than the sectorrsquos frequency ratio Results show that firms in the 90th percentile of markup distribution are overrepresented in wholesale trade and retail trade sectors the probability of a top decile firm being in these two sectorsmdashclassified as less-knowledge-intensive services according to the Eurostat definition
18 This value results from the following expression 100[exp(beta)minus1] where beta equals estimated top 90 percent dummy coefficients in an OLS regression where size is the dependent variable controlling for 4-digit and county fixed effects (table 3 column 1) 19 This value results from the following expression 100[exp(beta)minus1] where beta equals estimated top 90 percent dummy coefficients in an OLS regression where TFPR is the dependent variable controlling for 4-digit and county fixed effects (table 3 column 2) 20 The odds-ratio is computed as the relative difference between the marginal effects for each category (that is 42 percent for the top decile firms and 56 percent for firms below the 90th percentile) Specifically it is computed as follows (56 percent minus 42 percent)(42 percent)
17
(see table A12 in annex 1)mdashis almost 40 percent21 It is worth highlighting however that these top decile firms also operate in some knowledge-intensive services sectors though the probability is much smaller 387 percent for computer programming and 268 percent for security and investigating activities22
When taken together these results suggest that the small group of firms leading the overall increase in markups in Romania does not seem to follow the typical superstar firmsrsquo profile As discussed by Van Reenen (2018) and Autor et al (2017) superstar firmsmdashtypically with higher markups larger and more productive ndash would be rewarded with larger market shares due to their innovative nature This hypothesis does not seem to be supported by data in Romania As results showed the group of firms who are driving the aggregate rise in markupsmdashthe top decile firms of the markup distributionmdashare typically smaller less productive less likely to invest in intangible assets and are mostly active in services sectors where use and diffusion of knowledge is less important This may suggest that the increase in markups in Romania might reflect a less competition-intensive environment rather than changes in the nature of competition where superstar firms would be rewarded with greater market share because they are more efficient and innovative
Table 4 Probability of a top decile firm (in the markup distribution) being in the following sectors
2-digit sector Probability Wholesale trade 2436 Retail trade 1477 Computer programming 387 Manufacturing of wearing apparel 321 Real estate activities 314 Security and investigation activities 268
Source World Bank staff calculations based on SBS data set Note The table shows only sectors for which the probability of a firm being in the top decile of markup distribution is higher than the sectorrsquos overall frequency ratio
42 HOW HAVE FIRM DYNAMICS INFLUENCED AGGREGATE MARKUP PERFORMANCE ARE THERE SIGNS OF MARKET POWER CONSOLIDATION AMONG INCUMBENT FIRMS
To indirectly assess whether the rise in markups is associated with weakening competition the analysis decomposes the evolution of aggregate markups into that of incumbents and of net entry of firms To do so the Melitz and Polanec (2015) decomposition technique is applied to the aggregate markup changes between 2008 and 2017 This approach follows two steps First the aggregate (ln) markup (μ) at year t is defined as
21 Under the NACE 2-digit wholesale trade sector the group of top decile firms are overrepresented in the following NACE 4-digit sectors sector 4690ndashNon-specialized wholesale trade sector 4673ndashWholesale of wood construction materials and sanitary equipment sector 4621ndashWholesale of grain unmanufactured tobacco seeds and animal feeds sector 4646ndashWholesale of pharmaceutical goods sector 4675ndashWholesale of chemical products and sector 4631ndashWholesale of fruit and vegetables Under the NACE 2-digit retail services sector the sample of top decile firms are overrepresented in the following NACE 4-digit sectors sector 4711ndashRetail sale in non-specialized stores with food beverages or tobacco predominating and sector 4730mdashRetail sale of automotive fuel in specialized stores 22 The same analysis is applied for ownership structure again controlling for overrepresentation Results show that the sample of top decile firms are overrepresented in the fully foreign-owned ownership category
18
120583120583119895119895119895119895 = sum sum 119904119904119895119895119894119894119895119895119894119894isinΩ119895119895 120583120583119895119895119894119894119895119895119894119894isin119896119896119895119895 (9)
where sjit is firm irsquos market share at moment t where the market share is defined in terms of firm irsquos revenue weight over the total revenue of sector j (kj) where sector j is the sector to which firm i belongs Then the change of (ln) markup between moments t and tminus1 is decomposed as
Δ120583120583119895119895119895119895 = Δ120583119878119878119895119895119895119895 + Δ119862119862119879119879119907119907119878119878120583120583119878119878119895119895119894119894119895119895 119904119904119878119878119895119895119894119894119895119895 + 119904119904119864119864119895119895119895119895120583120583119864119864119895119895119895119895 minus 120583120583119878119878119895119895119895119895 + 119904119904119883119883119895119895119895119895120583120583119878119878119895119895119895119895 minus 120583120583119883119883119895119895119895119895 (10)
where the subindex S refers to survivor firms (that is those operating in both years t and tminus1 the subindex X denotes firms exiting the market or those firms present in moment tminus1 but not in moment t and E denotes entrants or those firms operating in moment t but not in moment tminus1 Each component expressed in equation (10) represents different drivers to explain aggregate change in markup over the period The first term is the change of the
unweighted average ln markup of survivors or the ldquowithinrdquo component Likewise is the change in the covariance between ln markup and market share for
survivors only This is the ldquobetweenrdquo component and it measures the reallocation of resources among surviving firms The term is the ldquoentryrdquo component and it measures
the difference of the aggregate ln markup of entrants and that of survivors at moment t weighted by the share of entrants over the total population of firms ( ) The entry component will be
positive if the aggregate markup of those firms entering the market is larger than the aggregate markup of the survivors Finally is the exit component which measures the
difference between the aggregate ln markup of survivors and exiting firms at moment tminus1 likewise weighted by the proportion of firms exiting the market that is This term is
positive if the aggregate ln markup of the exiting firms is lower than the aggregate ln markup of survivors In other words and as displayed in equation (10) aggregate markup can growshrink because (a) incumbent firms have increaseddecreased their markups (the ldquowithinrdquo component) (b) incumbent firms with high markups have gainedlost market share (the ldquobetweenrdquo component) and (c) entrant firms have higherlower markups than exiting firms (the ldquoentryrdquo or ldquoexitrdquo component)23
Results show that the increase in aggregate markups has been driven mostly by incumbents rather than entrants and exiting firms Decomposition results for the full sample of firms are displayed in figure 6 Estimations suggest that a large proportion of the aggregate increase in markup in Romania was driven by increases within incumbent firms (the ldquowithinrdquo bar) And among incumbents results show that the rise in markups reflects mostly a markup increase within firms rather than a reallocation of market share away from low-markup to high-markup companies (the ldquobetweenrdquo bar) Meanwhile the entry of new firms with lower markups pulled the change in aggregate markups down (the ldquoentryrdquo bar) and contribution from
23 SBS tends to underestimate entry and exit (populational) figures as a result of its sampling design In this regard the proposed analysis captures entry and exit in the enumerated stratum (above 20 employees) so results will be representative at least for the population of firms in the enumerated stratum
19
exiting firms was negligible
20
Figure 6 Decomposition of percentage change of (sales-weighted) average markup 2008ndash17
Source World Bank staff calculations based on SBS data set
This result could be interpreted as a sign of consolidation of market power among existing firms enabled by remaining product market regulations that restrict competition despite previous reforms Several policy-related factors can explain this result among them government interventions and regulations that restrict competition by reinforcing dominance or limiting entry facilitating collusive outcomes or increasing the cost to compete in markets and discriminating and protecting vested interests24 In this regard Pop and Ore Monago (2020) provide illustrative examples about the presence of regulations that still restrict competition in Romania drawing from the OECDndashWorld Bank Group (WBG) product market regulation (PMR) indicators data set which provides information across 70 countries25 The assessment uses the latest PMR round for Romania from 2013 and includes Romaniarsquos performance projected on the basis of information updated in 2017 Results suggest that the regulatory framework as it is in the books in Romania is less restrictive than that of countries such as Poland and the total sample average but it is more restrictive than that of the OECD and EU-15 countries However from an economywide perspective the overall restrictiveness of regulations in Romania is mainly associated with the state control of the economy and several remaining barriers to entry and rivalry (see figure 7)
24 In principle greater competition outcomes are enabled through an effective competition policy framework which involves three key pillars (a) fostering pro-competition regulations and government interventions (b) promoting competitive neutrality and non-distortive public aid and (c) enabling effective competition law and antitrust enforcement 25 The current PMR database used for this study includes Argentina Australia Austria Belgium Bolivia Brazil Bulgaria Canada Chile China Colombia Costa Rica Croatia Cyprus the Czech Republic Denmark the Dominican Republic Ecuador Arab Republic of Egypt El Salvador Estonia Finland France Germany Greece Guatemala Honduras Hungary Iceland India Indonesia Ireland Israel Italy Jamaica Japan Kenya the Republic of Korea Kuwait Latvia Lithuania Luxembourg Malta Mexico the Netherlands New Zealand Nicaragua Norway Panama Paraguay Peru the Philippines Poland Portugal Romania the Russian Federation Rwanda Senegal the Slovak Republic Slovenia South Africa Spain Sweden Switzerland Turkey Tunisia Ukraine Uruguay the United Kingdom and the United States
21
Figure 7 Product market regulation in Romania and comparator countries
Source Pop and Ore Monago 2020 Note The top five performers in the overall PMR indicator are the Netherlands United Kingdom Austria Denmark and New Zealand Figure shows 2013 information unless otherwise indicated PMR = product market regulation
Barriers to entry and rivalry still affect some service sectors In fact there are examples of regulations that hamper competition in retail trade which concentrates a substantial proportion of high-markup firms in the Romanian economy as seen previously Drawing from the OECD-WBG PMR data set Pop and Ore Monago (2020) show that although regulations in the retail trade sector are less restrictive than in the EU-15 and OECD there is still room for improvement to make the retail trade market more efficient The authors show that licenses and permit requirements may still be imposing an unnecessary burden on entry and increasing the costs to compete in the sector Companies operating in retail sectors in Romania are subject to requirements that go beyond the general conditions formalities and procedures applicable to any company For instance in Romaniarsquos clothing industry licenses and permits are always required compared with 57 percent of OECD countries and 60 percent of EU-15 countries which do not have such a requirement26 In addition Romania has regulations that impose restrictions on entry or expansion of business activities and constrain strategic options to compete in retail markets For instance most of the PMR countries and all top five performers do not restrict firms from selling below cost (beyond a prohibition of predatory pricing) and restrictions on sales promotions are not a common practice either27 In Romania sales below cost are prohibited or restricted beyond a prohibition of predatory pricing Likewise sales promotions are restricted to a particular time of the year28
43 DO FIRM MARKUPS DIFFER ACROSS FIRMS WITH DIFFERENT ATTRIBUTES
To answer this question the analysis explores how markup performance differs across different types of firms To assess the heterogeneity in markups the analysis relates markups to firm-level characteristics such as size age ownership status RampD status and location
26 In this case the least restrictive countries such as Bulgaria Latvia and Sweden do not have such requirements 27 Among the Central and Eastern Europe comparator countries only the Czech Republic and the Slovak Republic apply restrictions on discounted sales pricing while only Poland applies constraints to sales promotions 28 Government Ordinance no 992000 prohibits sales below costs and provides for the conditions and periods when certain types of promotions can take occur
5156 51 52 47 49 53
62 55
3830 42 40 43 39
4333 41
1114
6 9 10 125 5 4
113129 133 134 141 148 156
165 169
0
05
1
15
2
25
3
0
05
1
15
2
25
3
Top 5 -PMR SlovakRepublic
Hungary EU-15average
CzechRepublic
OECDaverage
2013
Romaniasim 2017
Poland Romania
State control (SC) Barriers to entry and rivalry (BER) Barriers to trade and investment (BTI)
Avg of all countries = 190
22
within narrowly defined product markets proxied by NACE 4-digit sectors The following regression is estimated
120583120583119888119888119895119895119894119894119895119895 = 1205751205750 + sum 12057512057511198961198961198791198791199001199001198991198991198961198961198881198881198951198951198941198941198951198957119896119896=2 + sum 1205751205752119903119903119904119904119886119886119904119904119886119886119903119903119888119888119895119895119894119894119895119895
3119903119903=2 + sum 1205751205752119902119902119886119886119886119886119886119886119902119902119888119888119895119895119894119894119895119895
3119902119902=2 + 1205751205753119889119889119888119888119895119895119894119894119895119895
119864119864119864119864119864119864 +1205751205754119889119889119888119888119895119895119894119894119895119895119877119877119877119877119889119889 + 1205751205755119896119896119888119888119895119895119894119894119895119895 + 120578120578119895119895 + 120588120588119895119895 + 120574120574119888119888 + 119906119906119888119888119895119895119894119894119895119895 (11)
where ownkcjit with k = 23hellip7 comprises a set of dummies defining the type of ownership of the firm Romanian private (omitted category) majority state-owned state-private ownership Romanian private and foreign fully foreign-owned public of national and local interest and other (cooperatives and craft organizations)29 The term sizercjit is a set of three dummies controlling for firmsrsquo sizemdashsmall or fewer than 50 employees (omitted category) medium or 51ndash250 employees and large more than 250 employees The term agercjit is a set of three age dummiesmdashyoung or less than 5 years old mature or 6ndash15 years old and older than 15 years Two dichotomous variables are also defined to capture export and RampD profiles dExp and dRnd which take a value of 1 if a firmrsquos direct exports represent more than 10 percent of a firmrsquos total revenue and if a firmrsquos RampD represents more than 1 percent of a firmrsquos total revenue respectively In addition kcjit is firmsrsquo total capital stock value (sum of tangible and intangible assets)30 Finally ηt ρj and γc are respectively time NACE 4-digit sector and county fixed effects Equation (11) is estimated separately for each 1-digit sector (that is manufacturing services and mining) and for the whole economy while the equation parameters are estimated by OLS always using heteroscedasticity-robust standard errors The complete set of results is displayed in table A15 in annex 1
Results show that ownership structure matters to explain markup differences across firms State-controlled companies tend to exert the highest markup premiums in the overall economy and especially in the manufacturing sector Table 5 displays the estimated coefficients of ownership categories multiplied by 100 Except for the mining sector most of estimated coefficients are statistically significant which suggests that ownership structure makes a difference to explain markup performance even for firms operating in the same product market (here proxied by NACE 4-digit sector) county location and year and with similar characteristics in terms of size age and export and RampD profile
In particular firms in which the state has majority or minority ownership demonstrate higher markups when compared with domestic privately owned companies (see table 5 column 4) The average difference in markup is higher for companies with minority state ownership (289 percent) than for fully state-owned companies (200 percent) In manufacturing markups of fully state-owned firms are the highest on average at 527 percent when compared with the reference category (domestic privately owned firms) Results in services are mixed with both private and state ownership extracting high premiums private firms with mixed domestic-foreign ownership show the highest average difference (279 percent) closely followed by minority state-owned companies for which the markup premium
29 More details about the original ownership classification in SBS and the aggregation used for the analysis can be found in table A13 and table A14 in annex 1 30 The variable lnTFPRkit is included as an additional control to test the robustness of the analysis See results in table A16 in annex 1
23
is 275 percent compared with the reference category 31 All results are robust to the inclusion of productivity as an additional control variable (see results in table A16 in annex 1)32
Table 5 Average markup differences by ownership structure relative to domestic privately owned firms
(1) Manufacturing
()
(2) Services
()
(3) Mining
()
(4) All sectors
() Majority state-owned 527 139 772 200 State-private ownership 352 275 ns 289 Domestic private + foreign 161 279 ns 229 Fully foreign-owned 105 263 ns 201 Public of national and local interest
209 149 ns 214
Source World Bank staff calculations based on SBS data set Note Numbers reflect estimated coefficients (multiplied by 100) for ownership dummy categoriesmdashrelative to Romanian private firms the omitted categorymdashin a fixed-effect regression model controlling for firm covariates plus year and NACE 4-digit sector fixed effects as displayed in equation (11) More details about the original ownership classification in SBS and aggregation used for the analysis can be found in table A13 and table A14 in annex 1 See table A15 in annex 1 for the complete set of results ns = not statistically significant
Larger firms and older companies wield higher markups when compared with their counterparts implying that firm size and age are relevant characteristics that influence markup differences As shown in figure 8 old companies (older than 15 years) display higher average markups than young ones (1ndash5 years old) even when they share similar attributes (in terms of ownership structure size and export and RampD profiles) and operate in the same NACE 4-digit sector county and year The estimated average markup premium for old companies (relative to young ones) is 54 percent for the whole economy It varies depending on how data are clustered across large sectors 79 percent in manufacturing 48 percent in services and 228 percent in mining Higher markup premiums for older companies can be interpreted in two ways it can reflect that more experienced firms are able to transpose learning returnsmdashwhich could positively affect their productivity or reduce their marginal costsmdashinto higher markups or that older firms are able to lobby better and create barriers to entry making it more difficult for younger firms to exert competitive pressure Firm size also matters to explain markup performance large companies (with more than 250 full-time employees) tend to display higher markups compared with small companies even when they operate in the same product market and share similar characteristics On average for the whole economy the
31 Results for the category ldquootherrdquo are not shown in table 5 As detailed in table A13 in annex 1 this ldquootherrdquo category refers to SBS ownership answer-codes 40 and 50 respectively ldquocooperativerdquo and ldquopublic of national and local interestrdquo The reason the corresponding results were not highlighted in the main text are twofold First the above-mentioned category accounts for only 006 percent of total companies in the sample Second an in-depth analysis would be needed to understand whether this ldquootherrdquo category reflects potential noise in the way firms self-classify their ownership structures or the way firms report cost expenditures (mainly) or whether this was influenced by SBS sampling design 32 Because the production approach applied in the current analysis delivers both markup and productivity estimates it is possible to further decompose the markup differences across firm characteristics and to verify whether after controlling for differences in marginal costs (that is productivity) certain groups of firms still have higher markups This is precisely one of the mitigating methods employed to reduce the conflation risk as highlighted before Results in table A16 in annex 1 should be interpreted as follows once productivity level is included in the equation differences in marginal cost are accounted for so the coefficient on ldquomajority state-ownedrdquo for instance captures the variation in average prices between majority state-owned and the size reference category (domestic privately owned firms)
24
markup premium for large companies is 122 percent higher than that of small firms (figure 9) Both size and age effects are still present even after controlling for productivity differences (see table A16 in annex 1)33
Figure 8 Average markup differences relative to young firms by age category
Figure 9 Average markup differences relative to small firms by size category
Source World Bank staff calculations based on SBS data set Note Numbers reflect estimated coefficients (multiplied by 100) for age dummy categoriesmdashrelative to young firms (1ndash5 years old) the omitted categorymdashin a fixed-effect regression model controlling for firm covariates plus year county and NACE 4-digit sector fixed effects as displayed in equation (11) All bars reflect statistically significant results See table A15 in annex 1 for the complete set of results
Source World Bank staff calculations based on SBS data set Note Numbers reflect estimated coefficients (multiplied by 100) for size dummy categoriesmdashrelative to small firms (1ndash50 employees) the omitted categorymdashin a fixed-effect regression model controlling for firm covariates plus year county and NACE 4-digit sector fixed effects as displayed in equation (11) All bars reflect statistically significant results See table A15 in annex 1 for the complete set of results
By the same token export intensity also influences markup performance with firms that export earning higher markups Being an exporter is a relevant firm feature to be analyzed when it comes to understanding markup performance Recent models of international trade predict that exporting firms earn higher markups than non-exporting firms either because they are relatively more productive and can thus undercut their rivals (see Melitz and Ottaviano 2008) or because they produce higher-quality goods and rely on higher-quality inputs which allow them to charge higher prices (see Hallak and Sivadasan 2009) In this regard the results summarized in figure 10 are consistent with the literature and suggest that exporting firmsmdashdefined as those whose direct exports represent more than 10 percent of total revenuemdashearn higher markups than non-exporting firms that operate in the same product market (NACE 4-digit sector) the difference ranges from 12 percent to 416 percent depending on how data are clustered across large sectors (manufacturing services and mining)
33 See footnote 32 on how to interpret results in table A16 in annex 1 (after including productivity as an additional control)
22
-160
158
7948
228
54
-505
101520253035
d
iffer
ence
Mature (between 6 and 15 years old)
Old (older than 15)
23
-830
090
327
169122
-15-55
152535
d
iffer
ence
Medium (between 51 and 250)
Large (more than 250 employees)
25
Figure 10 Average markup differences relative to non-exporters by export status
Figure 11 Average markup differences relative to non-RampD performers by RampD status
Source World Bank staff calculations based on SBS data set Note Numbers reflect estimated coefficients (multiplied by 100) for RampD dummy categorymdashrelative to non-RampD performer firms the omitted categorymdashin a fixed-effect regression model controlling for firm covariates plus year county and NACE 4-digit sector fixed effects as displayed in equation (11) All bars reflect statistically significant results See table A15 in annex 1 for the complete set of results
Source World Bank staff calculations based on SBS data set Note Numbers reflect estimated coefficients (multiplied by 100) for export dummy categorymdashrelative to non-exporters the omitted categorymdashin a fixed-effect regression model controlling for firm covariates plus year county and NACE 4-digit sector fixed effects as displayed in equation (11) All bars reflect statistically significant results See table A15 in annex 1 for the complete set of results
Performing RampD activities is positively correlated with markup differences while location proxied by county also matters to explain markup performance Results displayed in figure 11 show that RampD performersmdashidentified by those firms whose RampD expenses surpass more than 1 percent of their total revenuemdashtend to earn higher markups than non-RampD performers The markup premium for RampD performers is always positive suggesting that this group of firms is able to recoup fixed costs associated with RampD activities The magnitude of the premium varies from 16 percent to 46 percent depending how data are clustered across large sectors (manufacturing services and mining) In addition results displayed in figure 12 show that firms in the same product market (at NACE 4-digit level) and with similar characteristics (in terms of ownership age size and export and RampD profiles) charge different markups depending on the county in which they operate Except for Dolj firms in all other counties demonstrate lower average markups than Bucharest the negative markup premium in relation to Bucharest varies from minus154 percent (Vrancea) to minus36 percent (Satu-Mare)
12
258
416
119
05
101520253035404550
d
iffer
ence
160
340
460
273
05
101520253035404550
d
iffer
ence
26
Figure 12 Average markup differences by county relative to Bucharest
Source World Bank staff calculations based on SBS data set Note Numbers reflect estimated coefficients (multiplied by 100) for county fixed effectsmdashrelative to Bucharest the omitted categorymdashin a fixed-effect regression model controlling for firm covariates plus year and NACE 4-digit sector fixed effects as displayed in equation (11) All bars reflect statistically significant results See table A15 in annex 1 for the complete set of results
A variance decomposition analysis suggests that ownership is the most relevant characteristic to explain total variance of markup performance across firms in Romania followed by capital intensity and export status Drawing from estimations of equation (11) it is possible to evaluate the relative importance of each variable to explain the variance of the markup Letting dExp represent any of the explanatory variables of equation (11) the contribution to the variance of the markup of that variable can be defined as
119862119862119879119879119899119899119886119886119889119889119864119864119864119864119864119864 = 12057512057532119881119881119886119886119903119903119889119889119864119864119864119864119864119864+21205751205753119872119872119862119862119862119862(119889119889119864119864119864119864119864119864120583120583minus1205751205753119889119889119864119864119864119864119864119864)119881119881119886119886119903119903(120583120583)
(12)
or as the variance of the variable plus 2 times the covariance of the variable with the part of the markup not explained by that variable A similar expression can be derived for any of the remaining explanatory variables The relative contribution of each variable is computed after discounting the residuals sector and year contributions Results are displayed in figure 13 Ownership structure is shown to be the most relevant feature to explain the variance of markup performance across firms it accounts for 347 percent of the explained variance of markup performance (after removing NACE 4-digit sector and year contributions) The second most important characteristic is capital intensity corresponding to 214 percent of the variance of the markup performance Export status accounts for the third largest share in explained variance 113 percent
d
iffer
ence
27
Figure 13 Contribution by each firm characteristic to explain total variance of markup performance across firms
Source World Bank staff calculations based on SBS data set Note The pie chart reflects markup variance decomposition results It decomposes the variance of markup performance across firms after removing the proportion accounted for by omitted factors NACE 4-digit sector and year contributions
44 WHAT WOULD BE THE PRODUCTIVITY DIVIDENDS FROM MARKUP REDUCTION
While it became evident that aggregate market power in Romania has been rising it is important to analyze its consequences for economic growth An indirect way to measure this is to estimate the productivity dividends that would come from markup reduction The association between markup and productivity can be positive or negative depending on the nature of competition in the specific marketssectors As shown by Autor et al (2017) and Van Reenen (2018) there are marketsmdashsuch as high-tech sectors or knowledge-intensive onesmdashwhere the nature of competition tends to emphasize the importance of network effects economies of scale and scope and intangible assets so the most productive and dynamic firms exert higher markups and obtain larger market shares On the other hand in certain markets where recouping fixed costs (such as RampD) because of higher-risk investments is not that relevant high-markup firms are not necessarily more productive and efficient Another way to look at this contrast is through the inverted-U relationship of innovation and competition to an increase in productivity as explored by Aghion et al (2005) According to this view stronger competition (proxied here by smaller markups) encourages neck-and-neck firms to innovatemdashthe ldquoescape competitionrdquo effectmdashand therefore to increase productivity growth At the same time this view discourages laggard firms from innovating (the Schumpeterian effect) therefore reducing productivity growth The combination of the two effectsmdashescaping competition and discouraging innovationmdashexplains the inverted-U relationship of competition and innovation with productivity growth
To assess the correlation between productivity growth and markups in Romania the analysis uses firm-level estimations of TFPR and markups obtained so far Thus it estimates the specification presented in Aghion Braun and Fedderke (2008) as follows
Δ119889119889119899119899119879119879119897119897119897119897119877119877119888119888119895119895119894119894119895119895 = 1206011206010 + 1206011206011120583120583119888119888119895119895119894119894119895119895 + 120578120578119895119895 + 120588120588119895119895 + 120574120574119888119888 + 120592120592119888119888119895119895119894119894119895119895 (13)
where the left-hand-side variable represents TFPR growth of firm i in NACE 4-digit sector j in year t 120583120583119894119894119895119895119895119895minus1 is the lagged value of firm irsquos markup in sector j in year t ηt ρj and γc are
214
113
79
47
347
64
136
capital intensity Export status RampD status age ownership size region
28
respectively time NACE 4-digit sector and county fixed effects Equation (13) is estimated separately for each 1-digit sector (that is manufacturing services and mining) and for the whole economy while the equation parameters are estimated by OLS always using heteroscedasticity-robust standard errors
Figure 14 Productivity (TFPR) growth dividends from a 10 percent reduction of average markup by sector
Source World Bank staff calculations based on SBS data set Note Results from year county and 4-digit sector fixed effects Coefficient for mining was not statistically significant
Results shows that on average reducing markups would have a positive impact on aggregate productivity expansion Results displayed in table A18 in annex 1 suggest that lower (past) markups are associated with higher (current) productivity growth all coefficients for lagged markups are negative and statistically significant at conventional values for all sectors except mining Overall this negative correlation between past markup level and productivity growth is an indication of a positive association between competition and productivity growth which would be driven by the escape competition effect described by Aghion et al (2008)34
The magnitude of the economic effect of markup reduction on productivity growth is sizable Figure 14 shows that a 10 percent decrease in the average markup of 61 percent for the overall economy in the 2008ndash17 period would imply an increase in productivity (TFPR) growth of 082 percentage point per year The economic effect for the manufacturing sector would be substantially higher reducing the average markup of 403 percent for manufacturing in the same period would imply an increase in TFPR growth of 147 percentage points per year
Further productivity dividends stemming from markup reduction vary substantially across NACE 4-digit sectors The same specification expressed in equation (9) is estimated for each NACE 4-digit sector separately controlling for year and county fixed effects The TFPR growth dividends from markup reduction are computed for each NACE 4-digit sector drawing from the estimated coefficients (see table A18 in annex 1) Results vary substantially
34 An extended specificationmdashwhere the squared value of lagged markup is included as an additional dependent variablemdashwas also estimated The estimated coefficient of the squared term was not statistically significant (see results in table A17 in annex 1)
147
048
082
0
02
04
06
08
1
12
14
16
Manufacturing Services All
Perc
enta
ge p
oint
s per
yea
r
29
across sectors among those 4-digit sectors where the estimated coefficients are statistically significant the productivity growth dividends of a 10 percent decrease in markup vary from 701 percentage points to 016 percentage points respectively for NACE sector 1041ndashManufacture of oil and fats and sector 4649ndashWholesale of other household goods (figure 15)35 Productivity dividends from a potential markup reduction are also positive in sectors where the top decile firms in the markup distribution are overly represented for instance in sector 4711ndashRetail sale in non-specialized stores with food beverages or tobacco predominating a 10 percent decrease of average markup would be associated with an increase in TFPR growth of 022 percentage points per year For sector 4690ndashNon-specialized wholesale trade and sector 4673ndashWholesale of wood construction materials and sanitary equipment the productivity dividends would be 018 and 021 percentage points respectively
Figure 15 Productivity (TFPR) growth dividends from a 10 percent reduction of average markup Results by NACE 4-digit sector
Source World Bank staff calculations based on SBS data set
35 There are however some sectors where markup reduction brings detrimental impacts to productivity expansion See complete set of results in table A18in annex 1 for instance in NACE sector 8010ndashPrivate security activities and sector 2432ndashPrecious metals production where a reduction of average markup in the 2008ndash17 period would imply a decrease of TFPR growth of 030 percentage points and 663 percentage points respectively Following Aghion Braun and Fedderke (2008) the Schumpeterian effect of product market competition would be the underlying driver behind this result in these sectors competition reduces innovation incentives and therefore productivity growth by reducing the rents from innovations of firms below the technological frontier
00
10
20
30
40
50
60
70
80
Perc
enta
ge p
oint
s per
yea
r
30
5 CONCLUSIONS
A stylized fact emerging in the recent empirical literature is the increase in average levels of market power across countries in both developed and emerging economies This paper aims to bring new evidence about the evolution of corporate market power in Romania and the implications for competition dynamics It uses markups as a proxy for market power and explores firm-level heterogeneity to identify the underlying drivers of aggregate trends The paper applies the production approachmdashfollowing De Loecker and Warzynski (2012) De Loecker and Eeckhout (2018) and De Loecker Eeckhout and Unger (2020)mdashto estimate markup at the firm-year level for Romania The Romanian Structural Business Survey data set is used to apply this methodology
Results show that the aggregate markup in Romania increased by around 15 percent between 2008 and 2017 However this aggregate performance masks a lot of heterogeneity the first being heterogeneity of markups across the main sectors While in manufacturing (sales-weighted) average markups experienced a declining pattern of minus57 percent during 2008ndash17 there was an opposite and much more rapid trend in services with an aggregate change of 422 percent
Second at the firm level results suggest that a key driving force behind this aggregate trend was the ability of the top decile of firms in the markup distribution to increase their markups This increase has been faster than for the rest of the firms Firms in the 90th percentile of the markup distribution increased their (sales-weighted) average markup by 285 percent between 2008 and 2017 while the rest of firms (that is those below the top decile firms) experienced a completely opposite trend their weighted markup contracted by 83 percent over the same period
This sample of top decile firms does not seem to follow the typical superstar firmsrsquo profile which suggests that the increase in markups in Romania might be associated with an environment that is less conducive to competition The top decile firms in the markup distribution are 468 percent smaller 910 percent less productive and 33 percent less likely to invest in intangible assets than the rest of the firms in the markup distribution and they are overrepresented in less knowledge-intensive service sectors Therefore they do not seem to follow the typical superstar firmsrsquo profile (typically larger more productive and more likely to invest in intangible assets) This suggests that the increase in markups in Romania might be more due to relatively weak competition rather than to changes in the nature of competition where superstar firms (usually more efficient and innovative) are rewarded with greater market share In fact a decomposition exercise shows that the increase in aggregate markups has been driven mostly by incumbents rather than by new entrants and exiting firms These results could be interpreted as a sign of consolidation of market power among existing firms Several policy-related factors could explain this result among them government interventions and regulations that restrict competition by reinforcing dominance or limiting entry facilitating collusive outcomes or increasing the cost to compete in markets and by discriminating and protecting vested interests In this regard illustrative evidence provided by Pop and Ore Monago (2020) shows that despite reforms regulations that restrict entry and rivalry are still present in the retail trade sector which concentrates a substantial proportion of high-markup firms in the Romanian economy
31
Results also show that certain firm characteristics matter in explaining differences in markup performance size age RampD profile export propensity location and notably ownership State-controlled companies tend to demonstrate the highest markup premiums when compared with domestic privately owned companies 289 percent higher for minority state-owned companies and 20 percent higher for fully state-owned companies Old companies (older than 15 years) display 54 percent higher markups on average than young ones no matter the product market (at NACE 4-digit level) where they operate The markup premium for large companies (with more than 250 full-time employees) is 122 percent higher than that of small firms in the overall economy Exporting firmsmdashthose whose direct exports represent more than 10 percent of total revenuemdashearn 119 percent higher markups than non-exporting firms that operate in the same sector At the same time results show that the markup premium for RampD performers (compared with non-RampD performers) is 273 percent for the whole economy and that firms operating in the same product market charge different markups depending on the county where they operate Overall while all these features matter to explain markup performance a variance decomposition analysis suggests that ownership is the most relevant characteristic to explain total variance of markup performance across firms in Romania
In this context given that ownership assumes a prominent role to explain markup performance it is important to ensure competitively neutral policies across markets where private and public enterprises compete The prominent role of ownership in explaining total variance of markup performance across firms combined with the evidence that state-controlled companies tend to exert the highest markup premiums in the overall economy highlights the importance of ensuring competitive neutrality in Romania so that private and public enterprises compete on a fair basis Analysis presented in Pop and Ore Monago (2020) shows that state-owned enterprises (SOEs) in Romania compete on uneven terms with the private sector because of gaps in terms of both the current regulatory framework as well as its implementation As for the regulatory framework itself lack of competitive neutrality emerges from restrictive SOE governance rules and the exemption of newly setup SOEs from the corporate governance law lack of rules mandating the separation of commercial and noncommercial functions despite legal separation (for example in the railway and energy sectors) and the lack of specific provisions that require SOE investments to show positive rates of returns With regard to implementation of the regulatory framework competitive neutrality gaps stem from (a) the protracted application of corporate governance rules (b) fragmentation of SOE oversight across institutions with frequent overlaps (c) inconsistent reporting of SOE performance that prevents full monitoring and comparability with the private sector performance in comparable situations (d) little clarity in terms of compensation for public service obligations and (e) lack of transparency in state aid allocation
Finally the analysis shows that productivity dividends arise from increased competition in Romania As such lowering markups can boost productivity growth A 10 percent decrease in the average markup for the overall economy during 2008ndash17 would imply an increase in productivity (TFPR) growth of 082 percentage point per year The effect for the manufacturing sector is higher (147 percentage points per year) but lower for services (048 percentage point per year) The ldquoescape competitionrdquo effect described by Aghion Braun and Fedderke (2008)mdashthrough which fiercer competition induces firms to innovate to escape competition with the fringe therefore increasing productivity growthmdashwould be the underlying driver behind these average results for the manufacturing industry Results vary substantially across sectors among
32
those 4-digit sectors where the estimated coefficients are statistically significant the productivity growth dividend of a 10 percent decrease in markup varies from 701 percentage points (sector 1041ndashManufacture of oil and fats) to 016 percentage point (sector 4649ndashWholesale of other household goods)
In this context boosting competition becomes a key part of the engine to drive productivity growth and help consolidate Romaniarsquos convergence to a high-income level Implementing pro-competition policies is instrumental Besides removing anticompetitive regulations and promoting competitive neutrality policy makers should ensure that state aid is allocated in a non-distortive way and enable more effective competition law and antitrust enforcement
33
REFERENCES
Ackerberg D K Caves and G Frazer 2015 ldquoIdentification Properties of Recent Production Function Estimatorsrdquo Econometrica 83 (6) 2411ndash51
Aghion P N Bloom R Blundell R Griffith and P Howitt 2005 ldquoCompetition and Innovation An Inverted-U Relationshiprdquo Quarterly Journal of Economics 120 (2) 701minus28
Aghion P M Braun and J Fedderke 2008 ldquoCompetition and Productivity Growth in South Africardquo Economics of Transition 16 (4) 741ndash68
Autor D D Dorn F Lawrence C Patterson and J Van Reenen 2017 ldquoThe Fall of the Labor Share and the Rise of Superstar Firmsrdquo NBER Working Paper 23396 National Bureau of Economic Research Cambridge MA
Barkai S 2020 ldquoDeclining Labor and Capital Sharesrdquo Journal of Finance 75 (5) 2421ndash63
Bartelsman E J and M Doms 2000 ldquoUnderstanding Productivity Lessons from Longitudinal Microdatardquo Journal of Economic Literature 38 (3) 569ndash94
Berry S J Levinsohn and A Pakes 1995 ldquoAutomobile Prices in Market Equilibriumrdquo Econometrica Journal of the Econometric Society 63 (4) 841ndash90
Berry S J Levinsohn and A Pakes 2004 ldquoDifferentiated Products Demand Systems from a Combination of Micro and Macro Data The New Car Marketrdquo Journal of Political Economy 112 (1) 68ndash105
Bessen J 2017 ldquoInformation Technology and Industry Concentrationrdquo Law and Economics Paper No 17-41 Boston University School of Law Boston
Bond S A Hashemi G Kaplan and P Zoch 2020 ldquoSome Unpleasant Markup Arithmetic Production Function Elasticities and their Estimation from Production Datardquo NBER Working Paper No 27002 National Bureau of Economic Research Cambridge MA
Bresnahan T F 1989 ldquoEmpirical Studies of Industries with Market Powerrdquo In Handbook of Industrial Organization Vol 2 edited by R Schmalensee and R Willig 1011ndash57 Amsterdam Elsevier
Cameron A C and P K Trivedi 2010 Microeconometrics Using Stata (Rev ed) College Station TX Stata Press
Crouzet N and J Eberly 2018 ldquoUnderstanding Weak Capital Investment The Role of Market Concentration and Intangiblesrdquo NBER Working Paper 25869 National Bureau of Economic Research Cambridge MA De Loecker J 2011 ldquoRecovering Markups from Production Datardquo International Journal of Industrial Organization 29 (3) 350ndash55
De Loecker J 2013 ldquoDetecting Learning by Exportingrdquo American Economic Journal Microeconomics 5 (3) 1ndash21
De Loecker J and J Eeckhout 2018 ldquoGlobal Market Powerrdquo NBER Working Paper 24768 National Bureau of Economic Research Cambridge MA
De Loecker J J Eeckhout and G Unger 2020 ldquoThe Rise of Market Power and the Macroeconomic Implicationsrdquo Quarterly Journal of Economics 135 (2) 561ndash644 httpsdoiorg101093qjeqjz041
34
De Loecker J and F Warzynski 2012 ldquoMark-ups and Firm-Level Export Statusrdquo American Economic Review 102 (6) 2437ndash71
Diacuteez F D Leigh and S Tambunlertchai 2018 ldquoGlobal Market Power and Its Macroeconomic Implicationsrdquo IMF Working Paper 18137 International Monetary Fund Washington DC
Grullon G Y Larkin and R Michaely 2018 ldquoAre US Industries Becoming More Concentratedrdquo Swiss Finance Institute Research Paper No 19-41 httpdxdoiorg102139ssrn2612047
Gutieacuterrez G and T Philippon 2017a ldquoDeclining Competition and Investment in the USrdquo NBER Working Paper 23583 National Bureau of Economic Research Cambridge MA Gutieacuterrez G and T Philippon 2017b ldquoInvestment-less Growth An Empirical Investigationrdquo Brookings Papers on Economic Activity (Fall) 89ndash182 Gutieacuterrez G and T Philippon 2018 ldquoHow EU Markets Became More Competitive than US Markets A Study of Institutional Driftrdquo NBER Working Paper 24700 National Bureau of Economic Research Cambridge MA
Hall R 1988 ldquoThe Relation between Price and Marginal Cost in US Industryrdquo Journal of Political Economy 96 (5) 921ndash47
Hallak J and J Sivadasan 2009 ldquoExporting Behavior under Quality Constraintsrdquo NBER Working Paper 14928 National Bureau of Economic Research Cambridge MA
IMF (International Monetary Fund) 2019 World Economic Outlook April 2019 Growth Slowdown Precarious Recovery Washington DC International Monetary Fund
Koujianou Goldberg P and R Hellerstein 2012 A Structural Approach to Identifying the Sources of Local Currency Price Stability Review of Economic Studies 80 (1) 175ndash210
Melitz M J and G Ottaviano 2008 ldquoMarket Size Trade and Productivityrdquo Review of Economic Studies 75 (1) 295ndash316
Melitz M J and S Polanec 2015 ldquoDynamic Olley-Pakes Productivity Decomposition with Entry and Exitrdquo RAND Journal of Economics 46 (2) 362ndash75
Motta M 2004 Competition Policy Theory and Practice Cambridge MA Cambridge University Press
Pop G and T Ore Monago 2020 ldquoCompetition and Government Interventions in Romania An Assessment with Focus on Product Market Regulations and Competitive Neutralityrdquo Background paper for Markets and People Romania Country Economic Memorandum International Development in Focus World Bank Washington DC
Shapiro C 2018 ldquoAntitrust in a Time of Populismrdquo International Journal of Industrial Organization 61 714ndash48
Syverson C 2004 ldquoProduct Substitutability and Productivity Dispersionrdquo Review of Economics and Statistics 86 (2) 534ndash50
Van Reenen J 2018 ldquoIncreasing Differences between Firms Market Power and the Macroeconomyrdquo CEPR Discussion Paper 1576 Center for Economic and Policy Research Washington DC
35
World Bank 2020a ldquoMarkets and People Romania Country Economic Memorandumrdquo International Development in Focus World Bank Washington DC
World Bank 2020b ldquoAssessing the Direct and Indirect Impact of State Aid in Romania An Ex-post Evaluationrdquo World Bank Washington DC
36
ANNEX 1 ADDITIONAL FIGURES AND TABLES
Figure A11 Evolution of (sales-weighted) average markup in manufacturing sector by technology intensity 2008ndash17
Source World Bank staff calculations based on SBS data set
Table A11 Manufacturing industry groups by technology intensity Eurostat classification
85
99
51
Mar
k-up i
ndex
(200
8 = 1
)
2008 2009 2010 2011 2012 2013 2014 2015 2016 2017Year
Manuf High-tech
37
Source Eurostat Indicators on High-Tech Industry and KnowledgendashIntensive Services annex 3 httpseceuropaeueurostatcachemetadataAnnexeshtec_esms_an3pdf
38
Figure A12 Evolution of (sales-weighted) average markup in services sector by knowledge intensity
39
Table A12 Services groups by knowledge intensity Eurostat classification
40
Source Eurostat Indicators on High-Tech Industry and KnowledgendashIntensive Services annex 3 httpseceuropaeueurostatcachemetadataAnnexeshtec_esms_an3pdf
41
Table A13 Original ownership classification from SBS SBS Code Description
10 Fully state-owned Majority state-owned (statepublic capital gt 50 of equity)
21 State + Romanian private 22 State + foreign 23 State + Romanian private + foreign
Majority privately owned (private capital ge 50 of equity) 26 State + Romanian private 27 State + foreign 28 State + Romanian private + foreign
Fully privately owned 31 Romanian private 32 Romanian private + foreign 40 Cooperative 50 Craft organizations 60 Fully foreign-owned 70 Public of national and local interest
Source World Bank staff calculations based on SBS data set
Table A14 Ownership classification adopted in the analysis SBS codes (combined) Description
10 21 22 23 State owned (fully + majority state-owned) 26 27 28 Private-public (majority private)
31 Fully private (domestic) 32 Fully private (domestic + foreign) 60 Fully private (fully foreign) 70 Public of national and local interest
40 50 Other Source World Bank staff calculations based on SBS data set
Table A15 Conditional correlations between firm characteristics and markup performance regression results
Variable Manufacturing Services Mining All Capital stock (ln) minus0150 minus0039 minus0067 minus0066 Export dummy 0120 0258 0416 0119 RampD dummy 0160 0340 0460 0273 Mature 0022 minus0016 0158 minus0005 Old 0079 0048 0228 0054 Majority state-owned 0527 0139 0772 0200 State-private ownership 0352 0275 0111 0289 Romanian private + foreign 0161 0279 0096 0229 Fully foreign-owned 0105 0263 0 0201 Public of national and local interest 0209 0149 (omitted) 0214 Other 0884 0555 (omitted) 0758 Medium 0230 minus0083 0011 0009 Large 0327 0169 minus0015 0122 1 Alba 0106 minus0087 minus0151 minus0042 2 Arad 0038 minus0090 minus0148 minus0077 3 Arges minus0005 minus0053 minus0195 minus0060
42
Variable Manufacturing Services Mining All 4 Bacau 0092 minus0090 minus0194 minus0055 5 Bihor 0036 minus0115 minus0256 minus0088 6 Bistrita-Nasaud minus0064 minus0156 minus0069 minus0144 7 Botosani 0046 minus0089 minus0438 minus0076 8 Brasov 0041 minus0047 0049 minus0040 9 Braila 0133 minus0055 minus0265 minus0025 10 Buzau 0017 minus0123 minus0025 minus0100 11 Caras-Severin 0035 minus0187 minus0005 minus0139 12 Cluj minus0004 minus0094 minus0119 minus0088 13 Constanta 0057 minus0105 0062 minus0088 14 Covasna 0038 minus0056 minus0151 minus0052 15 Dambovita 0005 minus0183 minus0154 minus0144 16 Dolj 0195 0060 minus0042 0079 17 Galati 0106 minus0007 minus0276 0004 18 Gorj 0084 0028 minus0116 0026 19 Harghita 0101 minus0102 minus0007 minus0045 20 Hunedoara 0167 minus0031 minus0057 0011 21 Ialomita 0138 minus0049 minus0265 minus0027 22 Iasi minus0014 minus0038 minus0384 minus0058 23 Ilfov 0011 0009 0314 0010 24 Maramures 0094 minus0020 minus0042 0 25 Mehedinti 0113 minus0136 minus0720 minus0096 26 Mures 0048 minus0063 minus0093 minus0048 27 Neamt 0001 minus0108 minus0428 minus0102 28 Olt 0073 minus0005 minus0397 minus0011 29 Prahova 0018 minus0034 minus0028 minus0043 30 Satu-Mare 0033 minus0024 minus0056 minus0036 31 Salaj 0075 minus0045 minus0448 minus0031 32 Sibiu 0044 minus0038 minus0154 minus0041 33 Suceava 0044 minus0087 minus0111 minus0074 34 Teleorman 0103 minus0099 minus0299 minus0062 35 Timis 0030 minus0020 minus0341 minus0037 36 Tulcea 0142 minus0149 0096 minus0078 37 Vaslui 0091 minus0017 minus0105 minus0007 38 Valcea 0078 minus0008 minus0122 minus0002 39 Vrancea minus0061 minus0163 minus0608 minus0154 51 Calarasi 0080 minus0122 0672 minus0075 52 Giurgiu 0052 minus0064 minus0334 minus0066
_cons 2147 1150 2291 2246 NACE 4-digit fixed effects Yes Yes Yes Yes
Year fixed effects Yes Yes Yes Yes
R2 0345 0235 0254 0279 Source World Bank staff calculations based on SBS data set Note Dependent variable = ln(markup) denotes significance level at 1 percent at 5 percent and at 10 percent
43
44
Table A16 Conditional correlations between firm characteristics (including productivity) and markup performance regression results
Variable Manufacturing Services Mining All Capital stock (ln) minus0149 minus0038 minus0065 minus0066 Export dummy 0116 0257 0400 0118 RampD dummy 0182 0366 0449 0295 Mature 0021 minus0014 0164 minus0003 Old 0079 0052 0228 0057 Majority state-owned 0529 0147 0758 0209 State-private ownership 0351 0274 0118 0288 Romanian private + foreign 0156 0275 0090 0225 Fully foreign-owned 0096 0254 minus0011 0192 Public of national and local interest 0179 0165 (omitted) 0233 Other 0879 0561 (omitted) 0759 Medium 0232 minus0083 0002 0010 Large 0327 0170 minus0016 0122
Productivity (TFPR) 0051 0020 0041 0024 1 Alba 0114 minus0081 minus0156 minus0035 2 Arad 0045 minus0085 minus0135 minus0071 3 Arges 0001 minus0049 minus0196 minus0056 4 Bacau 0098 minus0084 minus0188 minus0049 5 Bihor 0042 minus0111 minus0268 minus0083 6 Bistrita-Nasaud minus0057 minus0150 minus0055 minus0137 7 Botosani 0053 minus0082 minus0443 minus0069 8 Brasov 0045 minus0042 0033 minus0035 9 Braila 0139 minus0048 minus0243 minus0018 10 Buzau 0022 minus0118 minus0002 minus0094 11 Caras-Severin 0042 minus0178 minus0001 minus0131 12 Cluj minus0001 minus0089 minus0120 minus0083 13 Constanta 0067 minus0101 0056 minus0084 14 Covasna 0045 minus0050 minus0166 minus0046 15 Dambovita 0010 minus0180 minus0162 minus0140 16 Dolj 0202 0068 minus0054 0087 17 Galati 0114 minus0001 minus0289 0010 18 Gorj 0091 0037 minus0118 0035 19 Harghita 0108 minus0096 minus0005 minus0039 20 Hunedoara 0173 minus0025 minus0055 0018 21 Ialomita 0144 minus0045 minus0256 minus0023 22 Iasi minus0005 minus0034 minus0394 minus0053 23 Ilfov 0013 0012 0296 0013 24 Maramures 0101 minus0013 minus0038 0007 25 Mehedinti 0128 minus0132 minus0729 minus0090 26 Mures 0053 minus0057 minus0105 minus0042 27 Neamt 0010 minus0101 minus0434 minus0094
45
Variable Manufacturing Services Mining All 28 Olt 0082 0002 minus0402 minus0004 29 Prahova 0023 minus0029 minus0032 minus0039 30 Satu-Mare 0038 minus0018 minus0047 minus0030 31 Salaj 0081 minus0039 minus0433 minus0025 32 Sibiu 0044 minus0034 minus0147 minus0038 33 Suceava 0051 minus0081 minus0105 minus0068 34 Teleorman 0117 minus0092 minus0296 minus0053 35 Timis 0033 minus0014 minus0340 minus0032 36 Tulcea 0147 minus0142 0078 minus0072 37 Vaslui 0101 minus0011 minus0104 0 38 Valcea 0087 minus0002 minus0120 0004 39 Vrancea minus0053 minus0158 minus0602 minus0148 51 Calarasi 0086 minus0118 0673 minus0071 52 Giurgiu 0059 minus0060 minus0334 minus0061
_cons 1632 0993 1934 2036 NACE 4-digit fixed effects Yes Yes Yes Yes
Year fixed effects Yes Yes Yes Yes
R2 0347 0235 0255 0280 Source World Bank staff calculations based on SBS data set Note Dependent variable = ln(markup) denotes significance level at 1 percent at 5 percent and at 10 percent
Table A17 Productivity growth and markup performance regression results
All Manufacturing Services Mining
Lag markup minus0025 minus0028 minus0026 minus0027 minus0025 minus0027 minus0012 minus0024
Lag markup squared 0001 0000 0001 0003 NACE 4-digit sector fixed effects Yes Yes Yes Yes Yes Yes Yes Yes County fixed effects Yes Yes Yes Yes Yes Yes Yes Yes Year fixed effects Yes Yes Yes Yes Yes Yes Yes Yes
Observations 245525 245525 76694 76694 167120 167120 1711 1711 Source World Bank staff calculations based on SBS data set Note Dependent variable = TFPR growth denotes significance level at 1 percent at 5 percent and at 10 percent
46
Table A18 Productivity (TFPR) growth dividends from a 10 reduction of average markup results by NACE 4-digit sector
NACE 4-digit sector Gain in TFPR growth per
year (percentage points)
1041ndashManufacture of oils and fats 7015 4331ndashPlastering 5547 2060ndashManufacture of man-made fibers 5286 2824ndashManufacture of power-driven hand tools 4869 1072ndashManufacture of rusks and biscuits manufacture of preserved pastry goods and cakes
4145
1104ndashManufacture of other non-distilled fermented beverages 3984 1723ndashManufacture of paper stationery 3716 2812ndashManufacture of fluid power equipment 3566 2452ndashCasting of steel 3278 1101ndashDistilling rectifying and blending of spirits 3134 1420ndashRaising of other cattle and buffaloes 3072 2011ndashManufacture of industrial gases 3033 2593ndashManufacture of wire products chain and springs 2689 2829ndashManufacture of other general-purpose machinery nec 2641 4910ndashPassenger rail transport interurban 2629 2451ndashCasting of iron 2615 3821ndashTreatment and disposal of non-hazardous waste 2375 2059ndashManufacture of other chemical products nec 2336 2920ndashManufacture of bodies (coachwork) for motor vehicles manufacture of trailers and semi-trailers
2270
1051ndashOperation of dairies and cheese making 2224 3313ndashRepair of electronic and optical equipment 2160 1081ndashManufacture of sugar 2158 1073ndashManufacture of macaroni noodles couscous and similar farinaceous products 2081 4213ndashConstruction of bridges and tunnels 2077 2223ndashManufacture of buildersrsquo ware of plastic 2011 2550ndashForging pressing stamping and roll-forming of metal powder metallurgy 1949 2313ndashManufacture of hollow glass 1926 2825ndashManufacture of non-domestic cooling and ventilation equipment 1889 2020ndashManufacture of pesticides and other agrochemical products 1818 2571ndashManufacture of cutlery 1758 5914ndashMotion picture projection activities 1691 5920ndashSound recording and music publishing activities 1665 3514ndashTrade of electricity 1653 1310ndashPreparation and spinning of textile fibers 1616 4920ndashFreight rail transport 1613 4339ndashOther building completion and finishing 1586 2620ndashManufacture of computers and peripheral equipment 1543 4311ndashDemolition 1515 3832ndashRecovery of sorted materials 1404 3523ndashTrade of gas through mains 1382 2410ndashManufacture of basic iron and steel and of ferro-alloys 1353 2399ndashManufacture of other non-metallic mineral products nec 1272 2017ndashManufacture of synthetic rubber in primary forms 1258 7711ndashRental and leasing of cars and light motor vehicles 1256 4212ndashConstruction of railways and underground railways 1128 2453ndashCasting of light metals 1080 7410ndashSpecialized design activities 1068 5630ndashBeverage serving activities 1065 4211ndashConstruction of roads and motorways 0989 4677ndashWholesale of waste and scrap 0926 4676ndashWholesale of other intermediate products 0917 4120ndashConstruction of residential and non-residential buildings 0912 4623ndashWholesale of live animals 0890 6820ndashRental and operating of own or leased real estate 0826 4110ndashDevelopment of building projects 0824
47
NACE 4-digit sector Gain in TFPR growth per year
(percentage points) 4613ndashAgents involved in the sale of timber and building materials 0823 4322ndashPlumbing heat and air-conditioning installation 0731 5629ndashOther food service activities 0699 4791ndashRetail sale via mail order houses or via internet 0659 4941ndashFreight transport by road 0659 4618ndashAgents specialized in the sale of other particular products 0646 7219ndashOther research and experimental development on natural sciences and engineering 0623 4617ndashAgents involved in the sale of food beverages and tobacco 0609 5510ndashHotels and similar accommodation 0560 4615ndashAgents involved in the sale of furniture household goods hardware and ironmongery
0541
4633ndashWholesale of dairy products eggs and edible oils and fats 0540 4778ndashOther retail sale of new goods in specialized stores 0527 4621ndashWholesale of grain unmanufactured tobacco seeds and animal feeds 0517 4662ndashWholesale of machine tools 0501 6110ndashWired telecommunications activities 0491 4634ndashWholesale of beverages 0468 5610ndashRestaurants and mobile food service activities 0463 4631ndashWholesale of fruit and vegetables 0426 4532ndashRetail trade of motor vehicle parts and accessories 0394 1411ndashManufacture of leather clothes 0390 4511ndashSale of cars and light motor vehicles 0382 4637ndashWholesale of coffee tea cocoa and spices 0361 4645ndashWholesale of perfume and cosmetics 0354 1419ndashManufacture of other wearing apparel and accessories 0344 4643ndashWholesale of electrical household appliances 0335 4639ndashNon-specialized wholesale of food beverages and tobacco 0285 4619ndashAgents involved in the sale of a variety of goods 0281 4675ndashWholesale of chemical products 0249 4711ndashRetail sale in non-specialized stores with food beverages or tobacco predominating 0223 4673ndashWholesale of wood construction materials and sanitary equipment 0214 4690ndashNon-specialized wholesale trade 0188 4649ndashWholesale of other household goods 0158 8010ndashPrivate security activities minus0300 8220ndashActivities of call centres minus0323 2572ndashManufacture of locks and hinges minus0503 7120ndashTechnical testing and analysis minus0511 3315ndashRepair and maintenance of ships and boats minus0512 3600ndashWater collection treatment and supply minus0547 4754ndashRetail sale of electrical household appliances in specialized stores minus0627 2341ndashManufacture of ceramic household and ornamental articles minus0646 7111ndashArchitectural activities minus0649 6120ndashWireless telecommunications activities minus0746 7312ndashMedia representation minus1023 4334ndashPainting and glazing minus1200 5020ndashSea and coastal freight water transport minus1276 1052ndashManufacture of ice cream minus1367 5911ndashMotion picture video and television programme production activities minus1439 2592ndashManufacture of light metal packaging minus1619 2752ndashManufacture of non-electric domestic appliances minus1729 2521ndashManufacture of central heating radiators and boilers minus1843 4932ndashTaxi operation minus2568 2013ndashManufacture of other inorganic basic chemicals minus3524 1711ndashManufacture of pulp minus3631 4942ndashRemoval services minus4214 1092ndashManufacture of prepared pet foods minus4262 3040ndashManufacture of military fighting vehicles minus5508 2432ndashCold rolling of narrow strip minus6629
Source World Bank staff calculations based on SBS data set Note The table displays only sectors for which estimated coefficients are statistically significant
48
- 1 Introduction and motivation
- 2 Methodology
- 3 Data set
- 4 Results
-
- 41 Has corporate market power increased at the aggregate level How do aggregate trends differ across sectors Is there a group of firms driving the overall trend
- 42 How have firm dynamics influenced aggregate markup performance Are there signs of market power consolidation among incumbent firms
- 43 Do firm markups differ across firms with different attributes
- 44 What would be the productivity dividends from markup reduction
-
- 5 Conclusions
- References
- Annex 1 Additional figures and tables
-
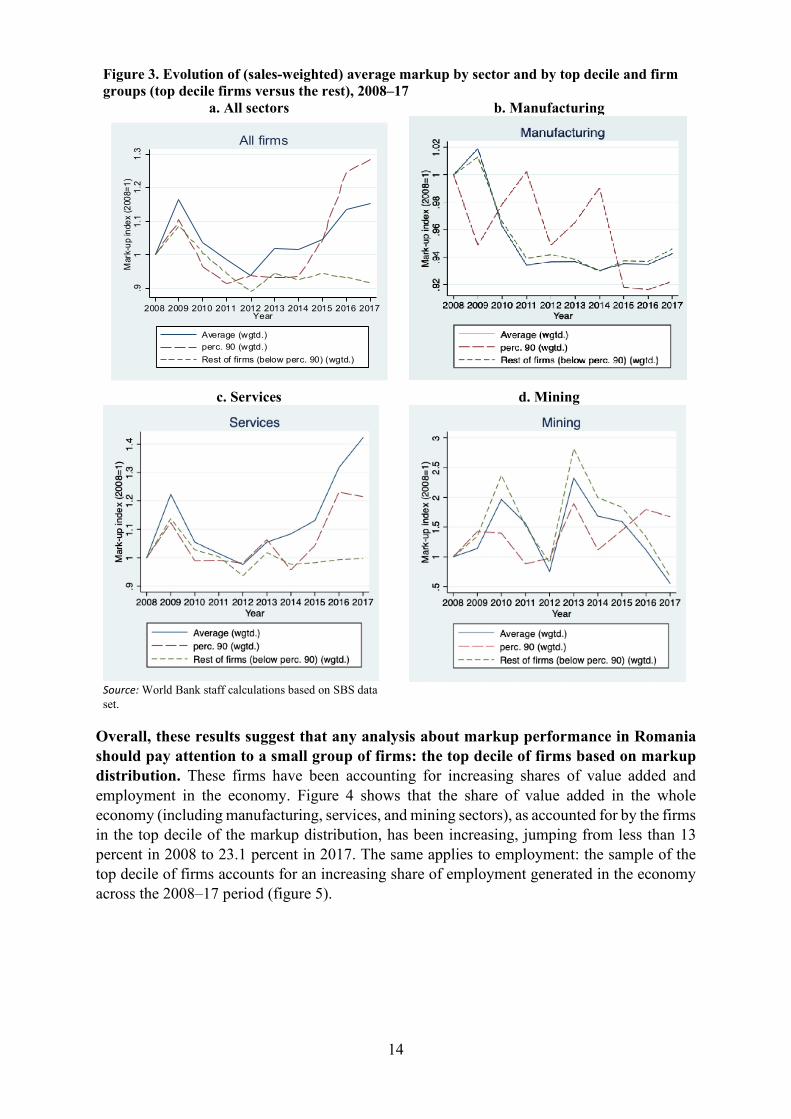
14
Figure 3 Evolution of (sales-weighted) average markup by sector and by top decile and firm groups (top decile firms versus the rest) 2008ndash17
a All sectors b Manufacturing
c Services d Mining
Source World Bank staff calculations based on SBS data set
Overall these results suggest that any analysis about markup performance in Romania should pay attention to a small group of firms the top decile of firms based on markup distribution These firms have been accounting for increasing shares of value added and employment in the economy Figure 4 shows that the share of value added in the whole economy (including manufacturing services and mining sectors) as accounted for by the firms in the top decile of the markup distribution has been increasing jumping from less than 13 percent in 2008 to 231 percent in 2017 The same applies to employment the sample of the top decile of firms accounts for an increasing share of employment generated in the economy across the 2008ndash17 period (figure 5)
91
11
12
13
Mar
k-up
inde
x (2
008=
1)
2008 2009 2010 2011 2012 2013 2014 2015 2016 2017Year
Average (wgtd)perc 90 (wgtd)Rest of firms (below perc 90) (wgtd)
All firms
15
Figure 4 Share of total value added accounted for by the top decile firms 2008ndash17
Figure 5 Share of employment accounted for by the top decile firms 2008ndash17
Source World Bank staff calculations based on SBS data set
Source World Bank staff calculations based on SBS data set
These top decile firms are also typically smaller less productive and less likely to invest in intangible assets than the rest of the firms As highlighted in the methodological section of this paper the increase of markups cannot be unequivocally interpreted as a decline in competition in a given market it can reflect firmsrsquo efficiency gains or adoption of quality-upgrading strategies To explore this aspect a simple econometric analysis was applied to capture performance differences between the group of firms that is leading the markup increase (the top decile firms) and the rest of the firms based on the markup distribution The following specification was adopted
119862119862ℎ119886119886119886119886119886119886119886119886119886119886119886119886119886119886119886119886119904119904119886119886119886119886119886119886119888119888119895119895119894119894119895119895 = 1205751205750 + 1205751205751119879119879119879119879119879119879_119889119889119886119886119886119886119886119886119889119889119886119886119894119894119895119895 + η119895119895 + ρ119895119895 + γ119888119888 + 120583120583119888119888119895119895119894119894119895119895 (8)
where the dependent variable reflects different firm characteristics (of firm i that operates in sector j county c at year t) to be compared Three dependent variables are tested size (measured in terms of the number of full-time employees) productivity (measured as TFPR discounted for markup16) and intangible assets (measured as a dummy that takes the value of 1 for firms having a positive value of intangible fixed assets17) The key explanatory variable is 119879119879119879119879119879119879_119889119889119886119886119886119886119886119886119889119889119886119886119894119894119895119895 a dummy that takes the value of one firm if i is among the top decile of the markup distribution in year tmdashwhile ηt ρj and γc are respectively time NACE 4-digit sector and county fixed effects The parameters of equation (8) are estimated by OLS (or Probit regression maximum likelihood when the dependent variable is the intangible assets dummy) always using heteroscedasticity-robust standard errors Results displayed in table 3 columns 1 and 2 suggest that firms in the 90th percentile of the markup distribution are on average 468
16 TFPR discounted for markup is computed as TFPR-markup In this regard it is not a perfect measure of the true technical efficiency but just a proxy of productivity that accounts for market share and the effect of materials elasticity while other factors such as the effect of product quality or innovation are not considered 17 Value of intangible assets in the SBS data set is defined as value built on (a) RampD expenditure and (b) franchise patents and other similar rights and values
1015
2025
Perc
enta
ge
2008 2009 2010 2011 2012 2013 2014 2015 2016 2017Year
1012
1416
18Pe
rcen
tage
2008 2009 2010 2011 2012 2013 2014 2015 2016 2017Year
16
percent18 smaller and 91 percent 19 less productive than the rest of the firms even within narrowly defined sectors (at NACE 4-digit level) Results in column 3 captures the differences between these two groups of firms in terms of their willingness to invest in intangible assetsmdashtheir ldquoknowledge capacityrdquomdasha key determinant of firmsrsquo expansion in the long term Results suggest that the sample of top decile firms are almost 33 percent less likely to invest in intangible fixed assets than the remaining firms even within NACE 4-digit sectors20 All these correlations are statistically significant at the 1 percent confidence level
Table 3 Characteristics of top decile firms Conditional correlations between markups and firm characteristics (OLS and Probit results)
(Estimation method) Dependent variable (1)
(OLS) Employment
(ln)
(2) (OLS)
TFPR discounted for markup (ln)
(3) (Probit)
Investment in intangibles
(yesno) Top _decile minus0632 minus2422 minus0386 NACE 4-digit sector fixed effects
Yes Yes Yes
County fixed effects Yes Yes Yes Year fixed effects Yes Yes Yes R2 (pseudo R2)a 0238 0728 0078 Observations 484604 403561 484594
Source World Bank staff calculations based on SBS data set Note All firm-year observations (for the 2008ndash17 period) are pooled together and NACE 4-digit sector and year fixed effects are included OLS = ordinary least squares TFPR = revenue-based total factor productivity a It is worth highlighting that R2 value does not influence the consistency of the estimators of each population parameter which is the objective of the current analysis See for instance Cameron and Trivedi (2010) for a theoretical discussion on this matter Moreover since the analysis draws on a large sample the standard errors of the coefficient estimators are not affected because of the law of large numbers The key issue would be the lack of correlation of omitted variables and the explanatory variables However given that the main (theoretical) determinants of the markup performance are included the omitted variables can be understood to be random Statistically significant at 1 percent
In addition the group of 10 top decile firms in the markup distribution operate mainly in the services sector and are overrepresented in less-knowledge-intensive services sectors with some exceptions Table 4 displays the distribution of top decile firms across NACE 2-digit sectors in 2017 To control for the fact that some sectors might be overrepresented (given the SBS survey sampling) the table shows only those sectors for which the probability of a firm being in the top decile is larger than the sectorrsquos frequency ratio Results show that firms in the 90th percentile of markup distribution are overrepresented in wholesale trade and retail trade sectors the probability of a top decile firm being in these two sectorsmdashclassified as less-knowledge-intensive services according to the Eurostat definition
18 This value results from the following expression 100[exp(beta)minus1] where beta equals estimated top 90 percent dummy coefficients in an OLS regression where size is the dependent variable controlling for 4-digit and county fixed effects (table 3 column 1) 19 This value results from the following expression 100[exp(beta)minus1] where beta equals estimated top 90 percent dummy coefficients in an OLS regression where TFPR is the dependent variable controlling for 4-digit and county fixed effects (table 3 column 2) 20 The odds-ratio is computed as the relative difference between the marginal effects for each category (that is 42 percent for the top decile firms and 56 percent for firms below the 90th percentile) Specifically it is computed as follows (56 percent minus 42 percent)(42 percent)
17
(see table A12 in annex 1)mdashis almost 40 percent21 It is worth highlighting however that these top decile firms also operate in some knowledge-intensive services sectors though the probability is much smaller 387 percent for computer programming and 268 percent for security and investigating activities22
When taken together these results suggest that the small group of firms leading the overall increase in markups in Romania does not seem to follow the typical superstar firmsrsquo profile As discussed by Van Reenen (2018) and Autor et al (2017) superstar firmsmdashtypically with higher markups larger and more productive ndash would be rewarded with larger market shares due to their innovative nature This hypothesis does not seem to be supported by data in Romania As results showed the group of firms who are driving the aggregate rise in markupsmdashthe top decile firms of the markup distributionmdashare typically smaller less productive less likely to invest in intangible assets and are mostly active in services sectors where use and diffusion of knowledge is less important This may suggest that the increase in markups in Romania might reflect a less competition-intensive environment rather than changes in the nature of competition where superstar firms would be rewarded with greater market share because they are more efficient and innovative
Table 4 Probability of a top decile firm (in the markup distribution) being in the following sectors
2-digit sector Probability Wholesale trade 2436 Retail trade 1477 Computer programming 387 Manufacturing of wearing apparel 321 Real estate activities 314 Security and investigation activities 268
Source World Bank staff calculations based on SBS data set Note The table shows only sectors for which the probability of a firm being in the top decile of markup distribution is higher than the sectorrsquos overall frequency ratio
42 HOW HAVE FIRM DYNAMICS INFLUENCED AGGREGATE MARKUP PERFORMANCE ARE THERE SIGNS OF MARKET POWER CONSOLIDATION AMONG INCUMBENT FIRMS
To indirectly assess whether the rise in markups is associated with weakening competition the analysis decomposes the evolution of aggregate markups into that of incumbents and of net entry of firms To do so the Melitz and Polanec (2015) decomposition technique is applied to the aggregate markup changes between 2008 and 2017 This approach follows two steps First the aggregate (ln) markup (μ) at year t is defined as
21 Under the NACE 2-digit wholesale trade sector the group of top decile firms are overrepresented in the following NACE 4-digit sectors sector 4690ndashNon-specialized wholesale trade sector 4673ndashWholesale of wood construction materials and sanitary equipment sector 4621ndashWholesale of grain unmanufactured tobacco seeds and animal feeds sector 4646ndashWholesale of pharmaceutical goods sector 4675ndashWholesale of chemical products and sector 4631ndashWholesale of fruit and vegetables Under the NACE 2-digit retail services sector the sample of top decile firms are overrepresented in the following NACE 4-digit sectors sector 4711ndashRetail sale in non-specialized stores with food beverages or tobacco predominating and sector 4730mdashRetail sale of automotive fuel in specialized stores 22 The same analysis is applied for ownership structure again controlling for overrepresentation Results show that the sample of top decile firms are overrepresented in the fully foreign-owned ownership category
18
120583120583119895119895119895119895 = sum sum 119904119904119895119895119894119894119895119895119894119894isinΩ119895119895 120583120583119895119895119894119894119895119895119894119894isin119896119896119895119895 (9)
where sjit is firm irsquos market share at moment t where the market share is defined in terms of firm irsquos revenue weight over the total revenue of sector j (kj) where sector j is the sector to which firm i belongs Then the change of (ln) markup between moments t and tminus1 is decomposed as
Δ120583120583119895119895119895119895 = Δ120583119878119878119895119895119895119895 + Δ119862119862119879119879119907119907119878119878120583120583119878119878119895119895119894119894119895119895 119904119904119878119878119895119895119894119894119895119895 + 119904119904119864119864119895119895119895119895120583120583119864119864119895119895119895119895 minus 120583120583119878119878119895119895119895119895 + 119904119904119883119883119895119895119895119895120583120583119878119878119895119895119895119895 minus 120583120583119883119883119895119895119895119895 (10)
where the subindex S refers to survivor firms (that is those operating in both years t and tminus1 the subindex X denotes firms exiting the market or those firms present in moment tminus1 but not in moment t and E denotes entrants or those firms operating in moment t but not in moment tminus1 Each component expressed in equation (10) represents different drivers to explain aggregate change in markup over the period The first term is the change of the
unweighted average ln markup of survivors or the ldquowithinrdquo component Likewise is the change in the covariance between ln markup and market share for
survivors only This is the ldquobetweenrdquo component and it measures the reallocation of resources among surviving firms The term is the ldquoentryrdquo component and it measures
the difference of the aggregate ln markup of entrants and that of survivors at moment t weighted by the share of entrants over the total population of firms ( ) The entry component will be
positive if the aggregate markup of those firms entering the market is larger than the aggregate markup of the survivors Finally is the exit component which measures the
difference between the aggregate ln markup of survivors and exiting firms at moment tminus1 likewise weighted by the proportion of firms exiting the market that is This term is
positive if the aggregate ln markup of the exiting firms is lower than the aggregate ln markup of survivors In other words and as displayed in equation (10) aggregate markup can growshrink because (a) incumbent firms have increaseddecreased their markups (the ldquowithinrdquo component) (b) incumbent firms with high markups have gainedlost market share (the ldquobetweenrdquo component) and (c) entrant firms have higherlower markups than exiting firms (the ldquoentryrdquo or ldquoexitrdquo component)23
Results show that the increase in aggregate markups has been driven mostly by incumbents rather than entrants and exiting firms Decomposition results for the full sample of firms are displayed in figure 6 Estimations suggest that a large proportion of the aggregate increase in markup in Romania was driven by increases within incumbent firms (the ldquowithinrdquo bar) And among incumbents results show that the rise in markups reflects mostly a markup increase within firms rather than a reallocation of market share away from low-markup to high-markup companies (the ldquobetweenrdquo bar) Meanwhile the entry of new firms with lower markups pulled the change in aggregate markups down (the ldquoentryrdquo bar) and contribution from
23 SBS tends to underestimate entry and exit (populational) figures as a result of its sampling design In this regard the proposed analysis captures entry and exit in the enumerated stratum (above 20 employees) so results will be representative at least for the population of firms in the enumerated stratum
19
exiting firms was negligible
20
Figure 6 Decomposition of percentage change of (sales-weighted) average markup 2008ndash17
Source World Bank staff calculations based on SBS data set
This result could be interpreted as a sign of consolidation of market power among existing firms enabled by remaining product market regulations that restrict competition despite previous reforms Several policy-related factors can explain this result among them government interventions and regulations that restrict competition by reinforcing dominance or limiting entry facilitating collusive outcomes or increasing the cost to compete in markets and discriminating and protecting vested interests24 In this regard Pop and Ore Monago (2020) provide illustrative examples about the presence of regulations that still restrict competition in Romania drawing from the OECDndashWorld Bank Group (WBG) product market regulation (PMR) indicators data set which provides information across 70 countries25 The assessment uses the latest PMR round for Romania from 2013 and includes Romaniarsquos performance projected on the basis of information updated in 2017 Results suggest that the regulatory framework as it is in the books in Romania is less restrictive than that of countries such as Poland and the total sample average but it is more restrictive than that of the OECD and EU-15 countries However from an economywide perspective the overall restrictiveness of regulations in Romania is mainly associated with the state control of the economy and several remaining barriers to entry and rivalry (see figure 7)
24 In principle greater competition outcomes are enabled through an effective competition policy framework which involves three key pillars (a) fostering pro-competition regulations and government interventions (b) promoting competitive neutrality and non-distortive public aid and (c) enabling effective competition law and antitrust enforcement 25 The current PMR database used for this study includes Argentina Australia Austria Belgium Bolivia Brazil Bulgaria Canada Chile China Colombia Costa Rica Croatia Cyprus the Czech Republic Denmark the Dominican Republic Ecuador Arab Republic of Egypt El Salvador Estonia Finland France Germany Greece Guatemala Honduras Hungary Iceland India Indonesia Ireland Israel Italy Jamaica Japan Kenya the Republic of Korea Kuwait Latvia Lithuania Luxembourg Malta Mexico the Netherlands New Zealand Nicaragua Norway Panama Paraguay Peru the Philippines Poland Portugal Romania the Russian Federation Rwanda Senegal the Slovak Republic Slovenia South Africa Spain Sweden Switzerland Turkey Tunisia Ukraine Uruguay the United Kingdom and the United States
21
Figure 7 Product market regulation in Romania and comparator countries
Source Pop and Ore Monago 2020 Note The top five performers in the overall PMR indicator are the Netherlands United Kingdom Austria Denmark and New Zealand Figure shows 2013 information unless otherwise indicated PMR = product market regulation
Barriers to entry and rivalry still affect some service sectors In fact there are examples of regulations that hamper competition in retail trade which concentrates a substantial proportion of high-markup firms in the Romanian economy as seen previously Drawing from the OECD-WBG PMR data set Pop and Ore Monago (2020) show that although regulations in the retail trade sector are less restrictive than in the EU-15 and OECD there is still room for improvement to make the retail trade market more efficient The authors show that licenses and permit requirements may still be imposing an unnecessary burden on entry and increasing the costs to compete in the sector Companies operating in retail sectors in Romania are subject to requirements that go beyond the general conditions formalities and procedures applicable to any company For instance in Romaniarsquos clothing industry licenses and permits are always required compared with 57 percent of OECD countries and 60 percent of EU-15 countries which do not have such a requirement26 In addition Romania has regulations that impose restrictions on entry or expansion of business activities and constrain strategic options to compete in retail markets For instance most of the PMR countries and all top five performers do not restrict firms from selling below cost (beyond a prohibition of predatory pricing) and restrictions on sales promotions are not a common practice either27 In Romania sales below cost are prohibited or restricted beyond a prohibition of predatory pricing Likewise sales promotions are restricted to a particular time of the year28
43 DO FIRM MARKUPS DIFFER ACROSS FIRMS WITH DIFFERENT ATTRIBUTES
To answer this question the analysis explores how markup performance differs across different types of firms To assess the heterogeneity in markups the analysis relates markups to firm-level characteristics such as size age ownership status RampD status and location
26 In this case the least restrictive countries such as Bulgaria Latvia and Sweden do not have such requirements 27 Among the Central and Eastern Europe comparator countries only the Czech Republic and the Slovak Republic apply restrictions on discounted sales pricing while only Poland applies constraints to sales promotions 28 Government Ordinance no 992000 prohibits sales below costs and provides for the conditions and periods when certain types of promotions can take occur
5156 51 52 47 49 53
62 55
3830 42 40 43 39
4333 41
1114
6 9 10 125 5 4
113129 133 134 141 148 156
165 169
0
05
1
15
2
25
3
0
05
1
15
2
25
3
Top 5 -PMR SlovakRepublic
Hungary EU-15average
CzechRepublic
OECDaverage
2013
Romaniasim 2017
Poland Romania
State control (SC) Barriers to entry and rivalry (BER) Barriers to trade and investment (BTI)
Avg of all countries = 190
22
within narrowly defined product markets proxied by NACE 4-digit sectors The following regression is estimated
120583120583119888119888119895119895119894119894119895119895 = 1205751205750 + sum 12057512057511198961198961198791198791199001199001198991198991198961198961198881198881198951198951198941198941198951198957119896119896=2 + sum 1205751205752119903119903119904119904119886119886119904119904119886119886119903119903119888119888119895119895119894119894119895119895
3119903119903=2 + sum 1205751205752119902119902119886119886119886119886119886119886119902119902119888119888119895119895119894119894119895119895
3119902119902=2 + 1205751205753119889119889119888119888119895119895119894119894119895119895
119864119864119864119864119864119864 +1205751205754119889119889119888119888119895119895119894119894119895119895119877119877119877119877119889119889 + 1205751205755119896119896119888119888119895119895119894119894119895119895 + 120578120578119895119895 + 120588120588119895119895 + 120574120574119888119888 + 119906119906119888119888119895119895119894119894119895119895 (11)
where ownkcjit with k = 23hellip7 comprises a set of dummies defining the type of ownership of the firm Romanian private (omitted category) majority state-owned state-private ownership Romanian private and foreign fully foreign-owned public of national and local interest and other (cooperatives and craft organizations)29 The term sizercjit is a set of three dummies controlling for firmsrsquo sizemdashsmall or fewer than 50 employees (omitted category) medium or 51ndash250 employees and large more than 250 employees The term agercjit is a set of three age dummiesmdashyoung or less than 5 years old mature or 6ndash15 years old and older than 15 years Two dichotomous variables are also defined to capture export and RampD profiles dExp and dRnd which take a value of 1 if a firmrsquos direct exports represent more than 10 percent of a firmrsquos total revenue and if a firmrsquos RampD represents more than 1 percent of a firmrsquos total revenue respectively In addition kcjit is firmsrsquo total capital stock value (sum of tangible and intangible assets)30 Finally ηt ρj and γc are respectively time NACE 4-digit sector and county fixed effects Equation (11) is estimated separately for each 1-digit sector (that is manufacturing services and mining) and for the whole economy while the equation parameters are estimated by OLS always using heteroscedasticity-robust standard errors The complete set of results is displayed in table A15 in annex 1
Results show that ownership structure matters to explain markup differences across firms State-controlled companies tend to exert the highest markup premiums in the overall economy and especially in the manufacturing sector Table 5 displays the estimated coefficients of ownership categories multiplied by 100 Except for the mining sector most of estimated coefficients are statistically significant which suggests that ownership structure makes a difference to explain markup performance even for firms operating in the same product market (here proxied by NACE 4-digit sector) county location and year and with similar characteristics in terms of size age and export and RampD profile
In particular firms in which the state has majority or minority ownership demonstrate higher markups when compared with domestic privately owned companies (see table 5 column 4) The average difference in markup is higher for companies with minority state ownership (289 percent) than for fully state-owned companies (200 percent) In manufacturing markups of fully state-owned firms are the highest on average at 527 percent when compared with the reference category (domestic privately owned firms) Results in services are mixed with both private and state ownership extracting high premiums private firms with mixed domestic-foreign ownership show the highest average difference (279 percent) closely followed by minority state-owned companies for which the markup premium
29 More details about the original ownership classification in SBS and the aggregation used for the analysis can be found in table A13 and table A14 in annex 1 30 The variable lnTFPRkit is included as an additional control to test the robustness of the analysis See results in table A16 in annex 1
23
is 275 percent compared with the reference category 31 All results are robust to the inclusion of productivity as an additional control variable (see results in table A16 in annex 1)32
Table 5 Average markup differences by ownership structure relative to domestic privately owned firms
(1) Manufacturing
()
(2) Services
()
(3) Mining
()
(4) All sectors
() Majority state-owned 527 139 772 200 State-private ownership 352 275 ns 289 Domestic private + foreign 161 279 ns 229 Fully foreign-owned 105 263 ns 201 Public of national and local interest
209 149 ns 214
Source World Bank staff calculations based on SBS data set Note Numbers reflect estimated coefficients (multiplied by 100) for ownership dummy categoriesmdashrelative to Romanian private firms the omitted categorymdashin a fixed-effect regression model controlling for firm covariates plus year and NACE 4-digit sector fixed effects as displayed in equation (11) More details about the original ownership classification in SBS and aggregation used for the analysis can be found in table A13 and table A14 in annex 1 See table A15 in annex 1 for the complete set of results ns = not statistically significant
Larger firms and older companies wield higher markups when compared with their counterparts implying that firm size and age are relevant characteristics that influence markup differences As shown in figure 8 old companies (older than 15 years) display higher average markups than young ones (1ndash5 years old) even when they share similar attributes (in terms of ownership structure size and export and RampD profiles) and operate in the same NACE 4-digit sector county and year The estimated average markup premium for old companies (relative to young ones) is 54 percent for the whole economy It varies depending on how data are clustered across large sectors 79 percent in manufacturing 48 percent in services and 228 percent in mining Higher markup premiums for older companies can be interpreted in two ways it can reflect that more experienced firms are able to transpose learning returnsmdashwhich could positively affect their productivity or reduce their marginal costsmdashinto higher markups or that older firms are able to lobby better and create barriers to entry making it more difficult for younger firms to exert competitive pressure Firm size also matters to explain markup performance large companies (with more than 250 full-time employees) tend to display higher markups compared with small companies even when they operate in the same product market and share similar characteristics On average for the whole economy the
31 Results for the category ldquootherrdquo are not shown in table 5 As detailed in table A13 in annex 1 this ldquootherrdquo category refers to SBS ownership answer-codes 40 and 50 respectively ldquocooperativerdquo and ldquopublic of national and local interestrdquo The reason the corresponding results were not highlighted in the main text are twofold First the above-mentioned category accounts for only 006 percent of total companies in the sample Second an in-depth analysis would be needed to understand whether this ldquootherrdquo category reflects potential noise in the way firms self-classify their ownership structures or the way firms report cost expenditures (mainly) or whether this was influenced by SBS sampling design 32 Because the production approach applied in the current analysis delivers both markup and productivity estimates it is possible to further decompose the markup differences across firm characteristics and to verify whether after controlling for differences in marginal costs (that is productivity) certain groups of firms still have higher markups This is precisely one of the mitigating methods employed to reduce the conflation risk as highlighted before Results in table A16 in annex 1 should be interpreted as follows once productivity level is included in the equation differences in marginal cost are accounted for so the coefficient on ldquomajority state-ownedrdquo for instance captures the variation in average prices between majority state-owned and the size reference category (domestic privately owned firms)
24
markup premium for large companies is 122 percent higher than that of small firms (figure 9) Both size and age effects are still present even after controlling for productivity differences (see table A16 in annex 1)33
Figure 8 Average markup differences relative to young firms by age category
Figure 9 Average markup differences relative to small firms by size category
Source World Bank staff calculations based on SBS data set Note Numbers reflect estimated coefficients (multiplied by 100) for age dummy categoriesmdashrelative to young firms (1ndash5 years old) the omitted categorymdashin a fixed-effect regression model controlling for firm covariates plus year county and NACE 4-digit sector fixed effects as displayed in equation (11) All bars reflect statistically significant results See table A15 in annex 1 for the complete set of results
Source World Bank staff calculations based on SBS data set Note Numbers reflect estimated coefficients (multiplied by 100) for size dummy categoriesmdashrelative to small firms (1ndash50 employees) the omitted categorymdashin a fixed-effect regression model controlling for firm covariates plus year county and NACE 4-digit sector fixed effects as displayed in equation (11) All bars reflect statistically significant results See table A15 in annex 1 for the complete set of results
By the same token export intensity also influences markup performance with firms that export earning higher markups Being an exporter is a relevant firm feature to be analyzed when it comes to understanding markup performance Recent models of international trade predict that exporting firms earn higher markups than non-exporting firms either because they are relatively more productive and can thus undercut their rivals (see Melitz and Ottaviano 2008) or because they produce higher-quality goods and rely on higher-quality inputs which allow them to charge higher prices (see Hallak and Sivadasan 2009) In this regard the results summarized in figure 10 are consistent with the literature and suggest that exporting firmsmdashdefined as those whose direct exports represent more than 10 percent of total revenuemdashearn higher markups than non-exporting firms that operate in the same product market (NACE 4-digit sector) the difference ranges from 12 percent to 416 percent depending on how data are clustered across large sectors (manufacturing services and mining)
33 See footnote 32 on how to interpret results in table A16 in annex 1 (after including productivity as an additional control)
22
-160
158
7948
228
54
-505
101520253035
d
iffer
ence
Mature (between 6 and 15 years old)
Old (older than 15)
23
-830
090
327
169122
-15-55
152535
d
iffer
ence
Medium (between 51 and 250)
Large (more than 250 employees)
25
Figure 10 Average markup differences relative to non-exporters by export status
Figure 11 Average markup differences relative to non-RampD performers by RampD status
Source World Bank staff calculations based on SBS data set Note Numbers reflect estimated coefficients (multiplied by 100) for RampD dummy categorymdashrelative to non-RampD performer firms the omitted categorymdashin a fixed-effect regression model controlling for firm covariates plus year county and NACE 4-digit sector fixed effects as displayed in equation (11) All bars reflect statistically significant results See table A15 in annex 1 for the complete set of results
Source World Bank staff calculations based on SBS data set Note Numbers reflect estimated coefficients (multiplied by 100) for export dummy categorymdashrelative to non-exporters the omitted categorymdashin a fixed-effect regression model controlling for firm covariates plus year county and NACE 4-digit sector fixed effects as displayed in equation (11) All bars reflect statistically significant results See table A15 in annex 1 for the complete set of results
Performing RampD activities is positively correlated with markup differences while location proxied by county also matters to explain markup performance Results displayed in figure 11 show that RampD performersmdashidentified by those firms whose RampD expenses surpass more than 1 percent of their total revenuemdashtend to earn higher markups than non-RampD performers The markup premium for RampD performers is always positive suggesting that this group of firms is able to recoup fixed costs associated with RampD activities The magnitude of the premium varies from 16 percent to 46 percent depending how data are clustered across large sectors (manufacturing services and mining) In addition results displayed in figure 12 show that firms in the same product market (at NACE 4-digit level) and with similar characteristics (in terms of ownership age size and export and RampD profiles) charge different markups depending on the county in which they operate Except for Dolj firms in all other counties demonstrate lower average markups than Bucharest the negative markup premium in relation to Bucharest varies from minus154 percent (Vrancea) to minus36 percent (Satu-Mare)
12
258
416
119
05
101520253035404550
d
iffer
ence
160
340
460
273
05
101520253035404550
d
iffer
ence
26
Figure 12 Average markup differences by county relative to Bucharest
Source World Bank staff calculations based on SBS data set Note Numbers reflect estimated coefficients (multiplied by 100) for county fixed effectsmdashrelative to Bucharest the omitted categorymdashin a fixed-effect regression model controlling for firm covariates plus year and NACE 4-digit sector fixed effects as displayed in equation (11) All bars reflect statistically significant results See table A15 in annex 1 for the complete set of results
A variance decomposition analysis suggests that ownership is the most relevant characteristic to explain total variance of markup performance across firms in Romania followed by capital intensity and export status Drawing from estimations of equation (11) it is possible to evaluate the relative importance of each variable to explain the variance of the markup Letting dExp represent any of the explanatory variables of equation (11) the contribution to the variance of the markup of that variable can be defined as
119862119862119879119879119899119899119886119886119889119889119864119864119864119864119864119864 = 12057512057532119881119881119886119886119903119903119889119889119864119864119864119864119864119864+21205751205753119872119872119862119862119862119862(119889119889119864119864119864119864119864119864120583120583minus1205751205753119889119889119864119864119864119864119864119864)119881119881119886119886119903119903(120583120583)
(12)
or as the variance of the variable plus 2 times the covariance of the variable with the part of the markup not explained by that variable A similar expression can be derived for any of the remaining explanatory variables The relative contribution of each variable is computed after discounting the residuals sector and year contributions Results are displayed in figure 13 Ownership structure is shown to be the most relevant feature to explain the variance of markup performance across firms it accounts for 347 percent of the explained variance of markup performance (after removing NACE 4-digit sector and year contributions) The second most important characteristic is capital intensity corresponding to 214 percent of the variance of the markup performance Export status accounts for the third largest share in explained variance 113 percent
d
iffer
ence
27
Figure 13 Contribution by each firm characteristic to explain total variance of markup performance across firms
Source World Bank staff calculations based on SBS data set Note The pie chart reflects markup variance decomposition results It decomposes the variance of markup performance across firms after removing the proportion accounted for by omitted factors NACE 4-digit sector and year contributions
44 WHAT WOULD BE THE PRODUCTIVITY DIVIDENDS FROM MARKUP REDUCTION
While it became evident that aggregate market power in Romania has been rising it is important to analyze its consequences for economic growth An indirect way to measure this is to estimate the productivity dividends that would come from markup reduction The association between markup and productivity can be positive or negative depending on the nature of competition in the specific marketssectors As shown by Autor et al (2017) and Van Reenen (2018) there are marketsmdashsuch as high-tech sectors or knowledge-intensive onesmdashwhere the nature of competition tends to emphasize the importance of network effects economies of scale and scope and intangible assets so the most productive and dynamic firms exert higher markups and obtain larger market shares On the other hand in certain markets where recouping fixed costs (such as RampD) because of higher-risk investments is not that relevant high-markup firms are not necessarily more productive and efficient Another way to look at this contrast is through the inverted-U relationship of innovation and competition to an increase in productivity as explored by Aghion et al (2005) According to this view stronger competition (proxied here by smaller markups) encourages neck-and-neck firms to innovatemdashthe ldquoescape competitionrdquo effectmdashand therefore to increase productivity growth At the same time this view discourages laggard firms from innovating (the Schumpeterian effect) therefore reducing productivity growth The combination of the two effectsmdashescaping competition and discouraging innovationmdashexplains the inverted-U relationship of competition and innovation with productivity growth
To assess the correlation between productivity growth and markups in Romania the analysis uses firm-level estimations of TFPR and markups obtained so far Thus it estimates the specification presented in Aghion Braun and Fedderke (2008) as follows
Δ119889119889119899119899119879119879119897119897119897119897119877119877119888119888119895119895119894119894119895119895 = 1206011206010 + 1206011206011120583120583119888119888119895119895119894119894119895119895 + 120578120578119895119895 + 120588120588119895119895 + 120574120574119888119888 + 120592120592119888119888119895119895119894119894119895119895 (13)
where the left-hand-side variable represents TFPR growth of firm i in NACE 4-digit sector j in year t 120583120583119894119894119895119895119895119895minus1 is the lagged value of firm irsquos markup in sector j in year t ηt ρj and γc are
214
113
79
47
347
64
136
capital intensity Export status RampD status age ownership size region
28
respectively time NACE 4-digit sector and county fixed effects Equation (13) is estimated separately for each 1-digit sector (that is manufacturing services and mining) and for the whole economy while the equation parameters are estimated by OLS always using heteroscedasticity-robust standard errors
Figure 14 Productivity (TFPR) growth dividends from a 10 percent reduction of average markup by sector
Source World Bank staff calculations based on SBS data set Note Results from year county and 4-digit sector fixed effects Coefficient for mining was not statistically significant
Results shows that on average reducing markups would have a positive impact on aggregate productivity expansion Results displayed in table A18 in annex 1 suggest that lower (past) markups are associated with higher (current) productivity growth all coefficients for lagged markups are negative and statistically significant at conventional values for all sectors except mining Overall this negative correlation between past markup level and productivity growth is an indication of a positive association between competition and productivity growth which would be driven by the escape competition effect described by Aghion et al (2008)34
The magnitude of the economic effect of markup reduction on productivity growth is sizable Figure 14 shows that a 10 percent decrease in the average markup of 61 percent for the overall economy in the 2008ndash17 period would imply an increase in productivity (TFPR) growth of 082 percentage point per year The economic effect for the manufacturing sector would be substantially higher reducing the average markup of 403 percent for manufacturing in the same period would imply an increase in TFPR growth of 147 percentage points per year
Further productivity dividends stemming from markup reduction vary substantially across NACE 4-digit sectors The same specification expressed in equation (9) is estimated for each NACE 4-digit sector separately controlling for year and county fixed effects The TFPR growth dividends from markup reduction are computed for each NACE 4-digit sector drawing from the estimated coefficients (see table A18 in annex 1) Results vary substantially
34 An extended specificationmdashwhere the squared value of lagged markup is included as an additional dependent variablemdashwas also estimated The estimated coefficient of the squared term was not statistically significant (see results in table A17 in annex 1)
147
048
082
0
02
04
06
08
1
12
14
16
Manufacturing Services All
Perc
enta
ge p
oint
s per
yea
r
29
across sectors among those 4-digit sectors where the estimated coefficients are statistically significant the productivity growth dividends of a 10 percent decrease in markup vary from 701 percentage points to 016 percentage points respectively for NACE sector 1041ndashManufacture of oil and fats and sector 4649ndashWholesale of other household goods (figure 15)35 Productivity dividends from a potential markup reduction are also positive in sectors where the top decile firms in the markup distribution are overly represented for instance in sector 4711ndashRetail sale in non-specialized stores with food beverages or tobacco predominating a 10 percent decrease of average markup would be associated with an increase in TFPR growth of 022 percentage points per year For sector 4690ndashNon-specialized wholesale trade and sector 4673ndashWholesale of wood construction materials and sanitary equipment the productivity dividends would be 018 and 021 percentage points respectively
Figure 15 Productivity (TFPR) growth dividends from a 10 percent reduction of average markup Results by NACE 4-digit sector
Source World Bank staff calculations based on SBS data set
35 There are however some sectors where markup reduction brings detrimental impacts to productivity expansion See complete set of results in table A18in annex 1 for instance in NACE sector 8010ndashPrivate security activities and sector 2432ndashPrecious metals production where a reduction of average markup in the 2008ndash17 period would imply a decrease of TFPR growth of 030 percentage points and 663 percentage points respectively Following Aghion Braun and Fedderke (2008) the Schumpeterian effect of product market competition would be the underlying driver behind this result in these sectors competition reduces innovation incentives and therefore productivity growth by reducing the rents from innovations of firms below the technological frontier
00
10
20
30
40
50
60
70
80
Perc
enta
ge p
oint
s per
yea
r
30
5 CONCLUSIONS
A stylized fact emerging in the recent empirical literature is the increase in average levels of market power across countries in both developed and emerging economies This paper aims to bring new evidence about the evolution of corporate market power in Romania and the implications for competition dynamics It uses markups as a proxy for market power and explores firm-level heterogeneity to identify the underlying drivers of aggregate trends The paper applies the production approachmdashfollowing De Loecker and Warzynski (2012) De Loecker and Eeckhout (2018) and De Loecker Eeckhout and Unger (2020)mdashto estimate markup at the firm-year level for Romania The Romanian Structural Business Survey data set is used to apply this methodology
Results show that the aggregate markup in Romania increased by around 15 percent between 2008 and 2017 However this aggregate performance masks a lot of heterogeneity the first being heterogeneity of markups across the main sectors While in manufacturing (sales-weighted) average markups experienced a declining pattern of minus57 percent during 2008ndash17 there was an opposite and much more rapid trend in services with an aggregate change of 422 percent
Second at the firm level results suggest that a key driving force behind this aggregate trend was the ability of the top decile of firms in the markup distribution to increase their markups This increase has been faster than for the rest of the firms Firms in the 90th percentile of the markup distribution increased their (sales-weighted) average markup by 285 percent between 2008 and 2017 while the rest of firms (that is those below the top decile firms) experienced a completely opposite trend their weighted markup contracted by 83 percent over the same period
This sample of top decile firms does not seem to follow the typical superstar firmsrsquo profile which suggests that the increase in markups in Romania might be associated with an environment that is less conducive to competition The top decile firms in the markup distribution are 468 percent smaller 910 percent less productive and 33 percent less likely to invest in intangible assets than the rest of the firms in the markup distribution and they are overrepresented in less knowledge-intensive service sectors Therefore they do not seem to follow the typical superstar firmsrsquo profile (typically larger more productive and more likely to invest in intangible assets) This suggests that the increase in markups in Romania might be more due to relatively weak competition rather than to changes in the nature of competition where superstar firms (usually more efficient and innovative) are rewarded with greater market share In fact a decomposition exercise shows that the increase in aggregate markups has been driven mostly by incumbents rather than by new entrants and exiting firms These results could be interpreted as a sign of consolidation of market power among existing firms Several policy-related factors could explain this result among them government interventions and regulations that restrict competition by reinforcing dominance or limiting entry facilitating collusive outcomes or increasing the cost to compete in markets and by discriminating and protecting vested interests In this regard illustrative evidence provided by Pop and Ore Monago (2020) shows that despite reforms regulations that restrict entry and rivalry are still present in the retail trade sector which concentrates a substantial proportion of high-markup firms in the Romanian economy
31
Results also show that certain firm characteristics matter in explaining differences in markup performance size age RampD profile export propensity location and notably ownership State-controlled companies tend to demonstrate the highest markup premiums when compared with domestic privately owned companies 289 percent higher for minority state-owned companies and 20 percent higher for fully state-owned companies Old companies (older than 15 years) display 54 percent higher markups on average than young ones no matter the product market (at NACE 4-digit level) where they operate The markup premium for large companies (with more than 250 full-time employees) is 122 percent higher than that of small firms in the overall economy Exporting firmsmdashthose whose direct exports represent more than 10 percent of total revenuemdashearn 119 percent higher markups than non-exporting firms that operate in the same sector At the same time results show that the markup premium for RampD performers (compared with non-RampD performers) is 273 percent for the whole economy and that firms operating in the same product market charge different markups depending on the county where they operate Overall while all these features matter to explain markup performance a variance decomposition analysis suggests that ownership is the most relevant characteristic to explain total variance of markup performance across firms in Romania
In this context given that ownership assumes a prominent role to explain markup performance it is important to ensure competitively neutral policies across markets where private and public enterprises compete The prominent role of ownership in explaining total variance of markup performance across firms combined with the evidence that state-controlled companies tend to exert the highest markup premiums in the overall economy highlights the importance of ensuring competitive neutrality in Romania so that private and public enterprises compete on a fair basis Analysis presented in Pop and Ore Monago (2020) shows that state-owned enterprises (SOEs) in Romania compete on uneven terms with the private sector because of gaps in terms of both the current regulatory framework as well as its implementation As for the regulatory framework itself lack of competitive neutrality emerges from restrictive SOE governance rules and the exemption of newly setup SOEs from the corporate governance law lack of rules mandating the separation of commercial and noncommercial functions despite legal separation (for example in the railway and energy sectors) and the lack of specific provisions that require SOE investments to show positive rates of returns With regard to implementation of the regulatory framework competitive neutrality gaps stem from (a) the protracted application of corporate governance rules (b) fragmentation of SOE oversight across institutions with frequent overlaps (c) inconsistent reporting of SOE performance that prevents full monitoring and comparability with the private sector performance in comparable situations (d) little clarity in terms of compensation for public service obligations and (e) lack of transparency in state aid allocation
Finally the analysis shows that productivity dividends arise from increased competition in Romania As such lowering markups can boost productivity growth A 10 percent decrease in the average markup for the overall economy during 2008ndash17 would imply an increase in productivity (TFPR) growth of 082 percentage point per year The effect for the manufacturing sector is higher (147 percentage points per year) but lower for services (048 percentage point per year) The ldquoescape competitionrdquo effect described by Aghion Braun and Fedderke (2008)mdashthrough which fiercer competition induces firms to innovate to escape competition with the fringe therefore increasing productivity growthmdashwould be the underlying driver behind these average results for the manufacturing industry Results vary substantially across sectors among
32
those 4-digit sectors where the estimated coefficients are statistically significant the productivity growth dividend of a 10 percent decrease in markup varies from 701 percentage points (sector 1041ndashManufacture of oil and fats) to 016 percentage point (sector 4649ndashWholesale of other household goods)
In this context boosting competition becomes a key part of the engine to drive productivity growth and help consolidate Romaniarsquos convergence to a high-income level Implementing pro-competition policies is instrumental Besides removing anticompetitive regulations and promoting competitive neutrality policy makers should ensure that state aid is allocated in a non-distortive way and enable more effective competition law and antitrust enforcement
33
REFERENCES
Ackerberg D K Caves and G Frazer 2015 ldquoIdentification Properties of Recent Production Function Estimatorsrdquo Econometrica 83 (6) 2411ndash51
Aghion P N Bloom R Blundell R Griffith and P Howitt 2005 ldquoCompetition and Innovation An Inverted-U Relationshiprdquo Quarterly Journal of Economics 120 (2) 701minus28
Aghion P M Braun and J Fedderke 2008 ldquoCompetition and Productivity Growth in South Africardquo Economics of Transition 16 (4) 741ndash68
Autor D D Dorn F Lawrence C Patterson and J Van Reenen 2017 ldquoThe Fall of the Labor Share and the Rise of Superstar Firmsrdquo NBER Working Paper 23396 National Bureau of Economic Research Cambridge MA
Barkai S 2020 ldquoDeclining Labor and Capital Sharesrdquo Journal of Finance 75 (5) 2421ndash63
Bartelsman E J and M Doms 2000 ldquoUnderstanding Productivity Lessons from Longitudinal Microdatardquo Journal of Economic Literature 38 (3) 569ndash94
Berry S J Levinsohn and A Pakes 1995 ldquoAutomobile Prices in Market Equilibriumrdquo Econometrica Journal of the Econometric Society 63 (4) 841ndash90
Berry S J Levinsohn and A Pakes 2004 ldquoDifferentiated Products Demand Systems from a Combination of Micro and Macro Data The New Car Marketrdquo Journal of Political Economy 112 (1) 68ndash105
Bessen J 2017 ldquoInformation Technology and Industry Concentrationrdquo Law and Economics Paper No 17-41 Boston University School of Law Boston
Bond S A Hashemi G Kaplan and P Zoch 2020 ldquoSome Unpleasant Markup Arithmetic Production Function Elasticities and their Estimation from Production Datardquo NBER Working Paper No 27002 National Bureau of Economic Research Cambridge MA
Bresnahan T F 1989 ldquoEmpirical Studies of Industries with Market Powerrdquo In Handbook of Industrial Organization Vol 2 edited by R Schmalensee and R Willig 1011ndash57 Amsterdam Elsevier
Cameron A C and P K Trivedi 2010 Microeconometrics Using Stata (Rev ed) College Station TX Stata Press
Crouzet N and J Eberly 2018 ldquoUnderstanding Weak Capital Investment The Role of Market Concentration and Intangiblesrdquo NBER Working Paper 25869 National Bureau of Economic Research Cambridge MA De Loecker J 2011 ldquoRecovering Markups from Production Datardquo International Journal of Industrial Organization 29 (3) 350ndash55
De Loecker J 2013 ldquoDetecting Learning by Exportingrdquo American Economic Journal Microeconomics 5 (3) 1ndash21
De Loecker J and J Eeckhout 2018 ldquoGlobal Market Powerrdquo NBER Working Paper 24768 National Bureau of Economic Research Cambridge MA
De Loecker J J Eeckhout and G Unger 2020 ldquoThe Rise of Market Power and the Macroeconomic Implicationsrdquo Quarterly Journal of Economics 135 (2) 561ndash644 httpsdoiorg101093qjeqjz041
34
De Loecker J and F Warzynski 2012 ldquoMark-ups and Firm-Level Export Statusrdquo American Economic Review 102 (6) 2437ndash71
Diacuteez F D Leigh and S Tambunlertchai 2018 ldquoGlobal Market Power and Its Macroeconomic Implicationsrdquo IMF Working Paper 18137 International Monetary Fund Washington DC
Grullon G Y Larkin and R Michaely 2018 ldquoAre US Industries Becoming More Concentratedrdquo Swiss Finance Institute Research Paper No 19-41 httpdxdoiorg102139ssrn2612047
Gutieacuterrez G and T Philippon 2017a ldquoDeclining Competition and Investment in the USrdquo NBER Working Paper 23583 National Bureau of Economic Research Cambridge MA Gutieacuterrez G and T Philippon 2017b ldquoInvestment-less Growth An Empirical Investigationrdquo Brookings Papers on Economic Activity (Fall) 89ndash182 Gutieacuterrez G and T Philippon 2018 ldquoHow EU Markets Became More Competitive than US Markets A Study of Institutional Driftrdquo NBER Working Paper 24700 National Bureau of Economic Research Cambridge MA
Hall R 1988 ldquoThe Relation between Price and Marginal Cost in US Industryrdquo Journal of Political Economy 96 (5) 921ndash47
Hallak J and J Sivadasan 2009 ldquoExporting Behavior under Quality Constraintsrdquo NBER Working Paper 14928 National Bureau of Economic Research Cambridge MA
IMF (International Monetary Fund) 2019 World Economic Outlook April 2019 Growth Slowdown Precarious Recovery Washington DC International Monetary Fund
Koujianou Goldberg P and R Hellerstein 2012 A Structural Approach to Identifying the Sources of Local Currency Price Stability Review of Economic Studies 80 (1) 175ndash210
Melitz M J and G Ottaviano 2008 ldquoMarket Size Trade and Productivityrdquo Review of Economic Studies 75 (1) 295ndash316
Melitz M J and S Polanec 2015 ldquoDynamic Olley-Pakes Productivity Decomposition with Entry and Exitrdquo RAND Journal of Economics 46 (2) 362ndash75
Motta M 2004 Competition Policy Theory and Practice Cambridge MA Cambridge University Press
Pop G and T Ore Monago 2020 ldquoCompetition and Government Interventions in Romania An Assessment with Focus on Product Market Regulations and Competitive Neutralityrdquo Background paper for Markets and People Romania Country Economic Memorandum International Development in Focus World Bank Washington DC
Shapiro C 2018 ldquoAntitrust in a Time of Populismrdquo International Journal of Industrial Organization 61 714ndash48
Syverson C 2004 ldquoProduct Substitutability and Productivity Dispersionrdquo Review of Economics and Statistics 86 (2) 534ndash50
Van Reenen J 2018 ldquoIncreasing Differences between Firms Market Power and the Macroeconomyrdquo CEPR Discussion Paper 1576 Center for Economic and Policy Research Washington DC
35
World Bank 2020a ldquoMarkets and People Romania Country Economic Memorandumrdquo International Development in Focus World Bank Washington DC
World Bank 2020b ldquoAssessing the Direct and Indirect Impact of State Aid in Romania An Ex-post Evaluationrdquo World Bank Washington DC
36
ANNEX 1 ADDITIONAL FIGURES AND TABLES
Figure A11 Evolution of (sales-weighted) average markup in manufacturing sector by technology intensity 2008ndash17
Source World Bank staff calculations based on SBS data set
Table A11 Manufacturing industry groups by technology intensity Eurostat classification
85
99
51
Mar
k-up i
ndex
(200
8 = 1
)
2008 2009 2010 2011 2012 2013 2014 2015 2016 2017Year
Manuf High-tech
37
Source Eurostat Indicators on High-Tech Industry and KnowledgendashIntensive Services annex 3 httpseceuropaeueurostatcachemetadataAnnexeshtec_esms_an3pdf
38
Figure A12 Evolution of (sales-weighted) average markup in services sector by knowledge intensity
39
Table A12 Services groups by knowledge intensity Eurostat classification
40
Source Eurostat Indicators on High-Tech Industry and KnowledgendashIntensive Services annex 3 httpseceuropaeueurostatcachemetadataAnnexeshtec_esms_an3pdf
41
Table A13 Original ownership classification from SBS SBS Code Description
10 Fully state-owned Majority state-owned (statepublic capital gt 50 of equity)
21 State + Romanian private 22 State + foreign 23 State + Romanian private + foreign
Majority privately owned (private capital ge 50 of equity) 26 State + Romanian private 27 State + foreign 28 State + Romanian private + foreign
Fully privately owned 31 Romanian private 32 Romanian private + foreign 40 Cooperative 50 Craft organizations 60 Fully foreign-owned 70 Public of national and local interest
Source World Bank staff calculations based on SBS data set
Table A14 Ownership classification adopted in the analysis SBS codes (combined) Description
10 21 22 23 State owned (fully + majority state-owned) 26 27 28 Private-public (majority private)
31 Fully private (domestic) 32 Fully private (domestic + foreign) 60 Fully private (fully foreign) 70 Public of national and local interest
40 50 Other Source World Bank staff calculations based on SBS data set
Table A15 Conditional correlations between firm characteristics and markup performance regression results
Variable Manufacturing Services Mining All Capital stock (ln) minus0150 minus0039 minus0067 minus0066 Export dummy 0120 0258 0416 0119 RampD dummy 0160 0340 0460 0273 Mature 0022 minus0016 0158 minus0005 Old 0079 0048 0228 0054 Majority state-owned 0527 0139 0772 0200 State-private ownership 0352 0275 0111 0289 Romanian private + foreign 0161 0279 0096 0229 Fully foreign-owned 0105 0263 0 0201 Public of national and local interest 0209 0149 (omitted) 0214 Other 0884 0555 (omitted) 0758 Medium 0230 minus0083 0011 0009 Large 0327 0169 minus0015 0122 1 Alba 0106 minus0087 minus0151 minus0042 2 Arad 0038 minus0090 minus0148 minus0077 3 Arges minus0005 minus0053 minus0195 minus0060
42
Variable Manufacturing Services Mining All 4 Bacau 0092 minus0090 minus0194 minus0055 5 Bihor 0036 minus0115 minus0256 minus0088 6 Bistrita-Nasaud minus0064 minus0156 minus0069 minus0144 7 Botosani 0046 minus0089 minus0438 minus0076 8 Brasov 0041 minus0047 0049 minus0040 9 Braila 0133 minus0055 minus0265 minus0025 10 Buzau 0017 minus0123 minus0025 minus0100 11 Caras-Severin 0035 minus0187 minus0005 minus0139 12 Cluj minus0004 minus0094 minus0119 minus0088 13 Constanta 0057 minus0105 0062 minus0088 14 Covasna 0038 minus0056 minus0151 minus0052 15 Dambovita 0005 minus0183 minus0154 minus0144 16 Dolj 0195 0060 minus0042 0079 17 Galati 0106 minus0007 minus0276 0004 18 Gorj 0084 0028 minus0116 0026 19 Harghita 0101 minus0102 minus0007 minus0045 20 Hunedoara 0167 minus0031 minus0057 0011 21 Ialomita 0138 minus0049 minus0265 minus0027 22 Iasi minus0014 minus0038 minus0384 minus0058 23 Ilfov 0011 0009 0314 0010 24 Maramures 0094 minus0020 minus0042 0 25 Mehedinti 0113 minus0136 minus0720 minus0096 26 Mures 0048 minus0063 minus0093 minus0048 27 Neamt 0001 minus0108 minus0428 minus0102 28 Olt 0073 minus0005 minus0397 minus0011 29 Prahova 0018 minus0034 minus0028 minus0043 30 Satu-Mare 0033 minus0024 minus0056 minus0036 31 Salaj 0075 minus0045 minus0448 minus0031 32 Sibiu 0044 minus0038 minus0154 minus0041 33 Suceava 0044 minus0087 minus0111 minus0074 34 Teleorman 0103 minus0099 minus0299 minus0062 35 Timis 0030 minus0020 minus0341 minus0037 36 Tulcea 0142 minus0149 0096 minus0078 37 Vaslui 0091 minus0017 minus0105 minus0007 38 Valcea 0078 minus0008 minus0122 minus0002 39 Vrancea minus0061 minus0163 minus0608 minus0154 51 Calarasi 0080 minus0122 0672 minus0075 52 Giurgiu 0052 minus0064 minus0334 minus0066
_cons 2147 1150 2291 2246 NACE 4-digit fixed effects Yes Yes Yes Yes
Year fixed effects Yes Yes Yes Yes
R2 0345 0235 0254 0279 Source World Bank staff calculations based on SBS data set Note Dependent variable = ln(markup) denotes significance level at 1 percent at 5 percent and at 10 percent
43
44
Table A16 Conditional correlations between firm characteristics (including productivity) and markup performance regression results
Variable Manufacturing Services Mining All Capital stock (ln) minus0149 minus0038 minus0065 minus0066 Export dummy 0116 0257 0400 0118 RampD dummy 0182 0366 0449 0295 Mature 0021 minus0014 0164 minus0003 Old 0079 0052 0228 0057 Majority state-owned 0529 0147 0758 0209 State-private ownership 0351 0274 0118 0288 Romanian private + foreign 0156 0275 0090 0225 Fully foreign-owned 0096 0254 minus0011 0192 Public of national and local interest 0179 0165 (omitted) 0233 Other 0879 0561 (omitted) 0759 Medium 0232 minus0083 0002 0010 Large 0327 0170 minus0016 0122
Productivity (TFPR) 0051 0020 0041 0024 1 Alba 0114 minus0081 minus0156 minus0035 2 Arad 0045 minus0085 minus0135 minus0071 3 Arges 0001 minus0049 minus0196 minus0056 4 Bacau 0098 minus0084 minus0188 minus0049 5 Bihor 0042 minus0111 minus0268 minus0083 6 Bistrita-Nasaud minus0057 minus0150 minus0055 minus0137 7 Botosani 0053 minus0082 minus0443 minus0069 8 Brasov 0045 minus0042 0033 minus0035 9 Braila 0139 minus0048 minus0243 minus0018 10 Buzau 0022 minus0118 minus0002 minus0094 11 Caras-Severin 0042 minus0178 minus0001 minus0131 12 Cluj minus0001 minus0089 minus0120 minus0083 13 Constanta 0067 minus0101 0056 minus0084 14 Covasna 0045 minus0050 minus0166 minus0046 15 Dambovita 0010 minus0180 minus0162 minus0140 16 Dolj 0202 0068 minus0054 0087 17 Galati 0114 minus0001 minus0289 0010 18 Gorj 0091 0037 minus0118 0035 19 Harghita 0108 minus0096 minus0005 minus0039 20 Hunedoara 0173 minus0025 minus0055 0018 21 Ialomita 0144 minus0045 minus0256 minus0023 22 Iasi minus0005 minus0034 minus0394 minus0053 23 Ilfov 0013 0012 0296 0013 24 Maramures 0101 minus0013 minus0038 0007 25 Mehedinti 0128 minus0132 minus0729 minus0090 26 Mures 0053 minus0057 minus0105 minus0042 27 Neamt 0010 minus0101 minus0434 minus0094
45
Variable Manufacturing Services Mining All 28 Olt 0082 0002 minus0402 minus0004 29 Prahova 0023 minus0029 minus0032 minus0039 30 Satu-Mare 0038 minus0018 minus0047 minus0030 31 Salaj 0081 minus0039 minus0433 minus0025 32 Sibiu 0044 minus0034 minus0147 minus0038 33 Suceava 0051 minus0081 minus0105 minus0068 34 Teleorman 0117 minus0092 minus0296 minus0053 35 Timis 0033 minus0014 minus0340 minus0032 36 Tulcea 0147 minus0142 0078 minus0072 37 Vaslui 0101 minus0011 minus0104 0 38 Valcea 0087 minus0002 minus0120 0004 39 Vrancea minus0053 minus0158 minus0602 minus0148 51 Calarasi 0086 minus0118 0673 minus0071 52 Giurgiu 0059 minus0060 minus0334 minus0061
_cons 1632 0993 1934 2036 NACE 4-digit fixed effects Yes Yes Yes Yes
Year fixed effects Yes Yes Yes Yes
R2 0347 0235 0255 0280 Source World Bank staff calculations based on SBS data set Note Dependent variable = ln(markup) denotes significance level at 1 percent at 5 percent and at 10 percent
Table A17 Productivity growth and markup performance regression results
All Manufacturing Services Mining
Lag markup minus0025 minus0028 minus0026 minus0027 minus0025 minus0027 minus0012 minus0024
Lag markup squared 0001 0000 0001 0003 NACE 4-digit sector fixed effects Yes Yes Yes Yes Yes Yes Yes Yes County fixed effects Yes Yes Yes Yes Yes Yes Yes Yes Year fixed effects Yes Yes Yes Yes Yes Yes Yes Yes
Observations 245525 245525 76694 76694 167120 167120 1711 1711 Source World Bank staff calculations based on SBS data set Note Dependent variable = TFPR growth denotes significance level at 1 percent at 5 percent and at 10 percent
46
Table A18 Productivity (TFPR) growth dividends from a 10 reduction of average markup results by NACE 4-digit sector
NACE 4-digit sector Gain in TFPR growth per
year (percentage points)
1041ndashManufacture of oils and fats 7015 4331ndashPlastering 5547 2060ndashManufacture of man-made fibers 5286 2824ndashManufacture of power-driven hand tools 4869 1072ndashManufacture of rusks and biscuits manufacture of preserved pastry goods and cakes
4145
1104ndashManufacture of other non-distilled fermented beverages 3984 1723ndashManufacture of paper stationery 3716 2812ndashManufacture of fluid power equipment 3566 2452ndashCasting of steel 3278 1101ndashDistilling rectifying and blending of spirits 3134 1420ndashRaising of other cattle and buffaloes 3072 2011ndashManufacture of industrial gases 3033 2593ndashManufacture of wire products chain and springs 2689 2829ndashManufacture of other general-purpose machinery nec 2641 4910ndashPassenger rail transport interurban 2629 2451ndashCasting of iron 2615 3821ndashTreatment and disposal of non-hazardous waste 2375 2059ndashManufacture of other chemical products nec 2336 2920ndashManufacture of bodies (coachwork) for motor vehicles manufacture of trailers and semi-trailers
2270
1051ndashOperation of dairies and cheese making 2224 3313ndashRepair of electronic and optical equipment 2160 1081ndashManufacture of sugar 2158 1073ndashManufacture of macaroni noodles couscous and similar farinaceous products 2081 4213ndashConstruction of bridges and tunnels 2077 2223ndashManufacture of buildersrsquo ware of plastic 2011 2550ndashForging pressing stamping and roll-forming of metal powder metallurgy 1949 2313ndashManufacture of hollow glass 1926 2825ndashManufacture of non-domestic cooling and ventilation equipment 1889 2020ndashManufacture of pesticides and other agrochemical products 1818 2571ndashManufacture of cutlery 1758 5914ndashMotion picture projection activities 1691 5920ndashSound recording and music publishing activities 1665 3514ndashTrade of electricity 1653 1310ndashPreparation and spinning of textile fibers 1616 4920ndashFreight rail transport 1613 4339ndashOther building completion and finishing 1586 2620ndashManufacture of computers and peripheral equipment 1543 4311ndashDemolition 1515 3832ndashRecovery of sorted materials 1404 3523ndashTrade of gas through mains 1382 2410ndashManufacture of basic iron and steel and of ferro-alloys 1353 2399ndashManufacture of other non-metallic mineral products nec 1272 2017ndashManufacture of synthetic rubber in primary forms 1258 7711ndashRental and leasing of cars and light motor vehicles 1256 4212ndashConstruction of railways and underground railways 1128 2453ndashCasting of light metals 1080 7410ndashSpecialized design activities 1068 5630ndashBeverage serving activities 1065 4211ndashConstruction of roads and motorways 0989 4677ndashWholesale of waste and scrap 0926 4676ndashWholesale of other intermediate products 0917 4120ndashConstruction of residential and non-residential buildings 0912 4623ndashWholesale of live animals 0890 6820ndashRental and operating of own or leased real estate 0826 4110ndashDevelopment of building projects 0824
47
NACE 4-digit sector Gain in TFPR growth per year
(percentage points) 4613ndashAgents involved in the sale of timber and building materials 0823 4322ndashPlumbing heat and air-conditioning installation 0731 5629ndashOther food service activities 0699 4791ndashRetail sale via mail order houses or via internet 0659 4941ndashFreight transport by road 0659 4618ndashAgents specialized in the sale of other particular products 0646 7219ndashOther research and experimental development on natural sciences and engineering 0623 4617ndashAgents involved in the sale of food beverages and tobacco 0609 5510ndashHotels and similar accommodation 0560 4615ndashAgents involved in the sale of furniture household goods hardware and ironmongery
0541
4633ndashWholesale of dairy products eggs and edible oils and fats 0540 4778ndashOther retail sale of new goods in specialized stores 0527 4621ndashWholesale of grain unmanufactured tobacco seeds and animal feeds 0517 4662ndashWholesale of machine tools 0501 6110ndashWired telecommunications activities 0491 4634ndashWholesale of beverages 0468 5610ndashRestaurants and mobile food service activities 0463 4631ndashWholesale of fruit and vegetables 0426 4532ndashRetail trade of motor vehicle parts and accessories 0394 1411ndashManufacture of leather clothes 0390 4511ndashSale of cars and light motor vehicles 0382 4637ndashWholesale of coffee tea cocoa and spices 0361 4645ndashWholesale of perfume and cosmetics 0354 1419ndashManufacture of other wearing apparel and accessories 0344 4643ndashWholesale of electrical household appliances 0335 4639ndashNon-specialized wholesale of food beverages and tobacco 0285 4619ndashAgents involved in the sale of a variety of goods 0281 4675ndashWholesale of chemical products 0249 4711ndashRetail sale in non-specialized stores with food beverages or tobacco predominating 0223 4673ndashWholesale of wood construction materials and sanitary equipment 0214 4690ndashNon-specialized wholesale trade 0188 4649ndashWholesale of other household goods 0158 8010ndashPrivate security activities minus0300 8220ndashActivities of call centres minus0323 2572ndashManufacture of locks and hinges minus0503 7120ndashTechnical testing and analysis minus0511 3315ndashRepair and maintenance of ships and boats minus0512 3600ndashWater collection treatment and supply minus0547 4754ndashRetail sale of electrical household appliances in specialized stores minus0627 2341ndashManufacture of ceramic household and ornamental articles minus0646 7111ndashArchitectural activities minus0649 6120ndashWireless telecommunications activities minus0746 7312ndashMedia representation minus1023 4334ndashPainting and glazing minus1200 5020ndashSea and coastal freight water transport minus1276 1052ndashManufacture of ice cream minus1367 5911ndashMotion picture video and television programme production activities minus1439 2592ndashManufacture of light metal packaging minus1619 2752ndashManufacture of non-electric domestic appliances minus1729 2521ndashManufacture of central heating radiators and boilers minus1843 4932ndashTaxi operation minus2568 2013ndashManufacture of other inorganic basic chemicals minus3524 1711ndashManufacture of pulp minus3631 4942ndashRemoval services minus4214 1092ndashManufacture of prepared pet foods minus4262 3040ndashManufacture of military fighting vehicles minus5508 2432ndashCold rolling of narrow strip minus6629
Source World Bank staff calculations based on SBS data set Note The table displays only sectors for which estimated coefficients are statistically significant
48
- 1 Introduction and motivation
- 2 Methodology
- 3 Data set
- 4 Results
-
- 41 Has corporate market power increased at the aggregate level How do aggregate trends differ across sectors Is there a group of firms driving the overall trend
- 42 How have firm dynamics influenced aggregate markup performance Are there signs of market power consolidation among incumbent firms
- 43 Do firm markups differ across firms with different attributes
- 44 What would be the productivity dividends from markup reduction
-
- 5 Conclusions
- References
- Annex 1 Additional figures and tables
-
15
Figure 4 Share of total value added accounted for by the top decile firms 2008ndash17
Figure 5 Share of employment accounted for by the top decile firms 2008ndash17
Source World Bank staff calculations based on SBS data set
Source World Bank staff calculations based on SBS data set
These top decile firms are also typically smaller less productive and less likely to invest in intangible assets than the rest of the firms As highlighted in the methodological section of this paper the increase of markups cannot be unequivocally interpreted as a decline in competition in a given market it can reflect firmsrsquo efficiency gains or adoption of quality-upgrading strategies To explore this aspect a simple econometric analysis was applied to capture performance differences between the group of firms that is leading the markup increase (the top decile firms) and the rest of the firms based on the markup distribution The following specification was adopted
119862119862ℎ119886119886119886119886119886119886119886119886119886119886119886119886119886119886119886119886119904119904119886119886119886119886119886119886119888119888119895119895119894119894119895119895 = 1205751205750 + 1205751205751119879119879119879119879119879119879_119889119889119886119886119886119886119886119886119889119889119886119886119894119894119895119895 + η119895119895 + ρ119895119895 + γ119888119888 + 120583120583119888119888119895119895119894119894119895119895 (8)
where the dependent variable reflects different firm characteristics (of firm i that operates in sector j county c at year t) to be compared Three dependent variables are tested size (measured in terms of the number of full-time employees) productivity (measured as TFPR discounted for markup16) and intangible assets (measured as a dummy that takes the value of 1 for firms having a positive value of intangible fixed assets17) The key explanatory variable is 119879119879119879119879119879119879_119889119889119886119886119886119886119886119886119889119889119886119886119894119894119895119895 a dummy that takes the value of one firm if i is among the top decile of the markup distribution in year tmdashwhile ηt ρj and γc are respectively time NACE 4-digit sector and county fixed effects The parameters of equation (8) are estimated by OLS (or Probit regression maximum likelihood when the dependent variable is the intangible assets dummy) always using heteroscedasticity-robust standard errors Results displayed in table 3 columns 1 and 2 suggest that firms in the 90th percentile of the markup distribution are on average 468
16 TFPR discounted for markup is computed as TFPR-markup In this regard it is not a perfect measure of the true technical efficiency but just a proxy of productivity that accounts for market share and the effect of materials elasticity while other factors such as the effect of product quality or innovation are not considered 17 Value of intangible assets in the SBS data set is defined as value built on (a) RampD expenditure and (b) franchise patents and other similar rights and values
1015
2025
Perc
enta
ge
2008 2009 2010 2011 2012 2013 2014 2015 2016 2017Year
1012
1416
18Pe
rcen
tage
2008 2009 2010 2011 2012 2013 2014 2015 2016 2017Year
16
percent18 smaller and 91 percent 19 less productive than the rest of the firms even within narrowly defined sectors (at NACE 4-digit level) Results in column 3 captures the differences between these two groups of firms in terms of their willingness to invest in intangible assetsmdashtheir ldquoknowledge capacityrdquomdasha key determinant of firmsrsquo expansion in the long term Results suggest that the sample of top decile firms are almost 33 percent less likely to invest in intangible fixed assets than the remaining firms even within NACE 4-digit sectors20 All these correlations are statistically significant at the 1 percent confidence level
Table 3 Characteristics of top decile firms Conditional correlations between markups and firm characteristics (OLS and Probit results)
(Estimation method) Dependent variable (1)
(OLS) Employment
(ln)
(2) (OLS)
TFPR discounted for markup (ln)
(3) (Probit)
Investment in intangibles
(yesno) Top _decile minus0632 minus2422 minus0386 NACE 4-digit sector fixed effects
Yes Yes Yes
County fixed effects Yes Yes Yes Year fixed effects Yes Yes Yes R2 (pseudo R2)a 0238 0728 0078 Observations 484604 403561 484594
Source World Bank staff calculations based on SBS data set Note All firm-year observations (for the 2008ndash17 period) are pooled together and NACE 4-digit sector and year fixed effects are included OLS = ordinary least squares TFPR = revenue-based total factor productivity a It is worth highlighting that R2 value does not influence the consistency of the estimators of each population parameter which is the objective of the current analysis See for instance Cameron and Trivedi (2010) for a theoretical discussion on this matter Moreover since the analysis draws on a large sample the standard errors of the coefficient estimators are not affected because of the law of large numbers The key issue would be the lack of correlation of omitted variables and the explanatory variables However given that the main (theoretical) determinants of the markup performance are included the omitted variables can be understood to be random Statistically significant at 1 percent
In addition the group of 10 top decile firms in the markup distribution operate mainly in the services sector and are overrepresented in less-knowledge-intensive services sectors with some exceptions Table 4 displays the distribution of top decile firms across NACE 2-digit sectors in 2017 To control for the fact that some sectors might be overrepresented (given the SBS survey sampling) the table shows only those sectors for which the probability of a firm being in the top decile is larger than the sectorrsquos frequency ratio Results show that firms in the 90th percentile of markup distribution are overrepresented in wholesale trade and retail trade sectors the probability of a top decile firm being in these two sectorsmdashclassified as less-knowledge-intensive services according to the Eurostat definition
18 This value results from the following expression 100[exp(beta)minus1] where beta equals estimated top 90 percent dummy coefficients in an OLS regression where size is the dependent variable controlling for 4-digit and county fixed effects (table 3 column 1) 19 This value results from the following expression 100[exp(beta)minus1] where beta equals estimated top 90 percent dummy coefficients in an OLS regression where TFPR is the dependent variable controlling for 4-digit and county fixed effects (table 3 column 2) 20 The odds-ratio is computed as the relative difference between the marginal effects for each category (that is 42 percent for the top decile firms and 56 percent for firms below the 90th percentile) Specifically it is computed as follows (56 percent minus 42 percent)(42 percent)
17
(see table A12 in annex 1)mdashis almost 40 percent21 It is worth highlighting however that these top decile firms also operate in some knowledge-intensive services sectors though the probability is much smaller 387 percent for computer programming and 268 percent for security and investigating activities22
When taken together these results suggest that the small group of firms leading the overall increase in markups in Romania does not seem to follow the typical superstar firmsrsquo profile As discussed by Van Reenen (2018) and Autor et al (2017) superstar firmsmdashtypically with higher markups larger and more productive ndash would be rewarded with larger market shares due to their innovative nature This hypothesis does not seem to be supported by data in Romania As results showed the group of firms who are driving the aggregate rise in markupsmdashthe top decile firms of the markup distributionmdashare typically smaller less productive less likely to invest in intangible assets and are mostly active in services sectors where use and diffusion of knowledge is less important This may suggest that the increase in markups in Romania might reflect a less competition-intensive environment rather than changes in the nature of competition where superstar firms would be rewarded with greater market share because they are more efficient and innovative
Table 4 Probability of a top decile firm (in the markup distribution) being in the following sectors
2-digit sector Probability Wholesale trade 2436 Retail trade 1477 Computer programming 387 Manufacturing of wearing apparel 321 Real estate activities 314 Security and investigation activities 268
Source World Bank staff calculations based on SBS data set Note The table shows only sectors for which the probability of a firm being in the top decile of markup distribution is higher than the sectorrsquos overall frequency ratio
42 HOW HAVE FIRM DYNAMICS INFLUENCED AGGREGATE MARKUP PERFORMANCE ARE THERE SIGNS OF MARKET POWER CONSOLIDATION AMONG INCUMBENT FIRMS
To indirectly assess whether the rise in markups is associated with weakening competition the analysis decomposes the evolution of aggregate markups into that of incumbents and of net entry of firms To do so the Melitz and Polanec (2015) decomposition technique is applied to the aggregate markup changes between 2008 and 2017 This approach follows two steps First the aggregate (ln) markup (μ) at year t is defined as
21 Under the NACE 2-digit wholesale trade sector the group of top decile firms are overrepresented in the following NACE 4-digit sectors sector 4690ndashNon-specialized wholesale trade sector 4673ndashWholesale of wood construction materials and sanitary equipment sector 4621ndashWholesale of grain unmanufactured tobacco seeds and animal feeds sector 4646ndashWholesale of pharmaceutical goods sector 4675ndashWholesale of chemical products and sector 4631ndashWholesale of fruit and vegetables Under the NACE 2-digit retail services sector the sample of top decile firms are overrepresented in the following NACE 4-digit sectors sector 4711ndashRetail sale in non-specialized stores with food beverages or tobacco predominating and sector 4730mdashRetail sale of automotive fuel in specialized stores 22 The same analysis is applied for ownership structure again controlling for overrepresentation Results show that the sample of top decile firms are overrepresented in the fully foreign-owned ownership category
18
120583120583119895119895119895119895 = sum sum 119904119904119895119895119894119894119895119895119894119894isinΩ119895119895 120583120583119895119895119894119894119895119895119894119894isin119896119896119895119895 (9)
where sjit is firm irsquos market share at moment t where the market share is defined in terms of firm irsquos revenue weight over the total revenue of sector j (kj) where sector j is the sector to which firm i belongs Then the change of (ln) markup between moments t and tminus1 is decomposed as
Δ120583120583119895119895119895119895 = Δ120583119878119878119895119895119895119895 + Δ119862119862119879119879119907119907119878119878120583120583119878119878119895119895119894119894119895119895 119904119904119878119878119895119895119894119894119895119895 + 119904119904119864119864119895119895119895119895120583120583119864119864119895119895119895119895 minus 120583120583119878119878119895119895119895119895 + 119904119904119883119883119895119895119895119895120583120583119878119878119895119895119895119895 minus 120583120583119883119883119895119895119895119895 (10)
where the subindex S refers to survivor firms (that is those operating in both years t and tminus1 the subindex X denotes firms exiting the market or those firms present in moment tminus1 but not in moment t and E denotes entrants or those firms operating in moment t but not in moment tminus1 Each component expressed in equation (10) represents different drivers to explain aggregate change in markup over the period The first term is the change of the
unweighted average ln markup of survivors or the ldquowithinrdquo component Likewise is the change in the covariance between ln markup and market share for
survivors only This is the ldquobetweenrdquo component and it measures the reallocation of resources among surviving firms The term is the ldquoentryrdquo component and it measures
the difference of the aggregate ln markup of entrants and that of survivors at moment t weighted by the share of entrants over the total population of firms ( ) The entry component will be
positive if the aggregate markup of those firms entering the market is larger than the aggregate markup of the survivors Finally is the exit component which measures the
difference between the aggregate ln markup of survivors and exiting firms at moment tminus1 likewise weighted by the proportion of firms exiting the market that is This term is
positive if the aggregate ln markup of the exiting firms is lower than the aggregate ln markup of survivors In other words and as displayed in equation (10) aggregate markup can growshrink because (a) incumbent firms have increaseddecreased their markups (the ldquowithinrdquo component) (b) incumbent firms with high markups have gainedlost market share (the ldquobetweenrdquo component) and (c) entrant firms have higherlower markups than exiting firms (the ldquoentryrdquo or ldquoexitrdquo component)23
Results show that the increase in aggregate markups has been driven mostly by incumbents rather than entrants and exiting firms Decomposition results for the full sample of firms are displayed in figure 6 Estimations suggest that a large proportion of the aggregate increase in markup in Romania was driven by increases within incumbent firms (the ldquowithinrdquo bar) And among incumbents results show that the rise in markups reflects mostly a markup increase within firms rather than a reallocation of market share away from low-markup to high-markup companies (the ldquobetweenrdquo bar) Meanwhile the entry of new firms with lower markups pulled the change in aggregate markups down (the ldquoentryrdquo bar) and contribution from
23 SBS tends to underestimate entry and exit (populational) figures as a result of its sampling design In this regard the proposed analysis captures entry and exit in the enumerated stratum (above 20 employees) so results will be representative at least for the population of firms in the enumerated stratum
19
exiting firms was negligible
20
Figure 6 Decomposition of percentage change of (sales-weighted) average markup 2008ndash17
Source World Bank staff calculations based on SBS data set
This result could be interpreted as a sign of consolidation of market power among existing firms enabled by remaining product market regulations that restrict competition despite previous reforms Several policy-related factors can explain this result among them government interventions and regulations that restrict competition by reinforcing dominance or limiting entry facilitating collusive outcomes or increasing the cost to compete in markets and discriminating and protecting vested interests24 In this regard Pop and Ore Monago (2020) provide illustrative examples about the presence of regulations that still restrict competition in Romania drawing from the OECDndashWorld Bank Group (WBG) product market regulation (PMR) indicators data set which provides information across 70 countries25 The assessment uses the latest PMR round for Romania from 2013 and includes Romaniarsquos performance projected on the basis of information updated in 2017 Results suggest that the regulatory framework as it is in the books in Romania is less restrictive than that of countries such as Poland and the total sample average but it is more restrictive than that of the OECD and EU-15 countries However from an economywide perspective the overall restrictiveness of regulations in Romania is mainly associated with the state control of the economy and several remaining barriers to entry and rivalry (see figure 7)
24 In principle greater competition outcomes are enabled through an effective competition policy framework which involves three key pillars (a) fostering pro-competition regulations and government interventions (b) promoting competitive neutrality and non-distortive public aid and (c) enabling effective competition law and antitrust enforcement 25 The current PMR database used for this study includes Argentina Australia Austria Belgium Bolivia Brazil Bulgaria Canada Chile China Colombia Costa Rica Croatia Cyprus the Czech Republic Denmark the Dominican Republic Ecuador Arab Republic of Egypt El Salvador Estonia Finland France Germany Greece Guatemala Honduras Hungary Iceland India Indonesia Ireland Israel Italy Jamaica Japan Kenya the Republic of Korea Kuwait Latvia Lithuania Luxembourg Malta Mexico the Netherlands New Zealand Nicaragua Norway Panama Paraguay Peru the Philippines Poland Portugal Romania the Russian Federation Rwanda Senegal the Slovak Republic Slovenia South Africa Spain Sweden Switzerland Turkey Tunisia Ukraine Uruguay the United Kingdom and the United States
21
Figure 7 Product market regulation in Romania and comparator countries
Source Pop and Ore Monago 2020 Note The top five performers in the overall PMR indicator are the Netherlands United Kingdom Austria Denmark and New Zealand Figure shows 2013 information unless otherwise indicated PMR = product market regulation
Barriers to entry and rivalry still affect some service sectors In fact there are examples of regulations that hamper competition in retail trade which concentrates a substantial proportion of high-markup firms in the Romanian economy as seen previously Drawing from the OECD-WBG PMR data set Pop and Ore Monago (2020) show that although regulations in the retail trade sector are less restrictive than in the EU-15 and OECD there is still room for improvement to make the retail trade market more efficient The authors show that licenses and permit requirements may still be imposing an unnecessary burden on entry and increasing the costs to compete in the sector Companies operating in retail sectors in Romania are subject to requirements that go beyond the general conditions formalities and procedures applicable to any company For instance in Romaniarsquos clothing industry licenses and permits are always required compared with 57 percent of OECD countries and 60 percent of EU-15 countries which do not have such a requirement26 In addition Romania has regulations that impose restrictions on entry or expansion of business activities and constrain strategic options to compete in retail markets For instance most of the PMR countries and all top five performers do not restrict firms from selling below cost (beyond a prohibition of predatory pricing) and restrictions on sales promotions are not a common practice either27 In Romania sales below cost are prohibited or restricted beyond a prohibition of predatory pricing Likewise sales promotions are restricted to a particular time of the year28
43 DO FIRM MARKUPS DIFFER ACROSS FIRMS WITH DIFFERENT ATTRIBUTES
To answer this question the analysis explores how markup performance differs across different types of firms To assess the heterogeneity in markups the analysis relates markups to firm-level characteristics such as size age ownership status RampD status and location
26 In this case the least restrictive countries such as Bulgaria Latvia and Sweden do not have such requirements 27 Among the Central and Eastern Europe comparator countries only the Czech Republic and the Slovak Republic apply restrictions on discounted sales pricing while only Poland applies constraints to sales promotions 28 Government Ordinance no 992000 prohibits sales below costs and provides for the conditions and periods when certain types of promotions can take occur
5156 51 52 47 49 53
62 55
3830 42 40 43 39
4333 41
1114
6 9 10 125 5 4
113129 133 134 141 148 156
165 169
0
05
1
15
2
25
3
0
05
1
15
2
25
3
Top 5 -PMR SlovakRepublic
Hungary EU-15average
CzechRepublic
OECDaverage
2013
Romaniasim 2017
Poland Romania
State control (SC) Barriers to entry and rivalry (BER) Barriers to trade and investment (BTI)
Avg of all countries = 190
22
within narrowly defined product markets proxied by NACE 4-digit sectors The following regression is estimated
120583120583119888119888119895119895119894119894119895119895 = 1205751205750 + sum 12057512057511198961198961198791198791199001199001198991198991198961198961198881198881198951198951198941198941198951198957119896119896=2 + sum 1205751205752119903119903119904119904119886119886119904119904119886119886119903119903119888119888119895119895119894119894119895119895
3119903119903=2 + sum 1205751205752119902119902119886119886119886119886119886119886119902119902119888119888119895119895119894119894119895119895
3119902119902=2 + 1205751205753119889119889119888119888119895119895119894119894119895119895
119864119864119864119864119864119864 +1205751205754119889119889119888119888119895119895119894119894119895119895119877119877119877119877119889119889 + 1205751205755119896119896119888119888119895119895119894119894119895119895 + 120578120578119895119895 + 120588120588119895119895 + 120574120574119888119888 + 119906119906119888119888119895119895119894119894119895119895 (11)
where ownkcjit with k = 23hellip7 comprises a set of dummies defining the type of ownership of the firm Romanian private (omitted category) majority state-owned state-private ownership Romanian private and foreign fully foreign-owned public of national and local interest and other (cooperatives and craft organizations)29 The term sizercjit is a set of three dummies controlling for firmsrsquo sizemdashsmall or fewer than 50 employees (omitted category) medium or 51ndash250 employees and large more than 250 employees The term agercjit is a set of three age dummiesmdashyoung or less than 5 years old mature or 6ndash15 years old and older than 15 years Two dichotomous variables are also defined to capture export and RampD profiles dExp and dRnd which take a value of 1 if a firmrsquos direct exports represent more than 10 percent of a firmrsquos total revenue and if a firmrsquos RampD represents more than 1 percent of a firmrsquos total revenue respectively In addition kcjit is firmsrsquo total capital stock value (sum of tangible and intangible assets)30 Finally ηt ρj and γc are respectively time NACE 4-digit sector and county fixed effects Equation (11) is estimated separately for each 1-digit sector (that is manufacturing services and mining) and for the whole economy while the equation parameters are estimated by OLS always using heteroscedasticity-robust standard errors The complete set of results is displayed in table A15 in annex 1
Results show that ownership structure matters to explain markup differences across firms State-controlled companies tend to exert the highest markup premiums in the overall economy and especially in the manufacturing sector Table 5 displays the estimated coefficients of ownership categories multiplied by 100 Except for the mining sector most of estimated coefficients are statistically significant which suggests that ownership structure makes a difference to explain markup performance even for firms operating in the same product market (here proxied by NACE 4-digit sector) county location and year and with similar characteristics in terms of size age and export and RampD profile
In particular firms in which the state has majority or minority ownership demonstrate higher markups when compared with domestic privately owned companies (see table 5 column 4) The average difference in markup is higher for companies with minority state ownership (289 percent) than for fully state-owned companies (200 percent) In manufacturing markups of fully state-owned firms are the highest on average at 527 percent when compared with the reference category (domestic privately owned firms) Results in services are mixed with both private and state ownership extracting high premiums private firms with mixed domestic-foreign ownership show the highest average difference (279 percent) closely followed by minority state-owned companies for which the markup premium
29 More details about the original ownership classification in SBS and the aggregation used for the analysis can be found in table A13 and table A14 in annex 1 30 The variable lnTFPRkit is included as an additional control to test the robustness of the analysis See results in table A16 in annex 1
23
is 275 percent compared with the reference category 31 All results are robust to the inclusion of productivity as an additional control variable (see results in table A16 in annex 1)32
Table 5 Average markup differences by ownership structure relative to domestic privately owned firms
(1) Manufacturing
()
(2) Services
()
(3) Mining
()
(4) All sectors
() Majority state-owned 527 139 772 200 State-private ownership 352 275 ns 289 Domestic private + foreign 161 279 ns 229 Fully foreign-owned 105 263 ns 201 Public of national and local interest
209 149 ns 214
Source World Bank staff calculations based on SBS data set Note Numbers reflect estimated coefficients (multiplied by 100) for ownership dummy categoriesmdashrelative to Romanian private firms the omitted categorymdashin a fixed-effect regression model controlling for firm covariates plus year and NACE 4-digit sector fixed effects as displayed in equation (11) More details about the original ownership classification in SBS and aggregation used for the analysis can be found in table A13 and table A14 in annex 1 See table A15 in annex 1 for the complete set of results ns = not statistically significant
Larger firms and older companies wield higher markups when compared with their counterparts implying that firm size and age are relevant characteristics that influence markup differences As shown in figure 8 old companies (older than 15 years) display higher average markups than young ones (1ndash5 years old) even when they share similar attributes (in terms of ownership structure size and export and RampD profiles) and operate in the same NACE 4-digit sector county and year The estimated average markup premium for old companies (relative to young ones) is 54 percent for the whole economy It varies depending on how data are clustered across large sectors 79 percent in manufacturing 48 percent in services and 228 percent in mining Higher markup premiums for older companies can be interpreted in two ways it can reflect that more experienced firms are able to transpose learning returnsmdashwhich could positively affect their productivity or reduce their marginal costsmdashinto higher markups or that older firms are able to lobby better and create barriers to entry making it more difficult for younger firms to exert competitive pressure Firm size also matters to explain markup performance large companies (with more than 250 full-time employees) tend to display higher markups compared with small companies even when they operate in the same product market and share similar characteristics On average for the whole economy the
31 Results for the category ldquootherrdquo are not shown in table 5 As detailed in table A13 in annex 1 this ldquootherrdquo category refers to SBS ownership answer-codes 40 and 50 respectively ldquocooperativerdquo and ldquopublic of national and local interestrdquo The reason the corresponding results were not highlighted in the main text are twofold First the above-mentioned category accounts for only 006 percent of total companies in the sample Second an in-depth analysis would be needed to understand whether this ldquootherrdquo category reflects potential noise in the way firms self-classify their ownership structures or the way firms report cost expenditures (mainly) or whether this was influenced by SBS sampling design 32 Because the production approach applied in the current analysis delivers both markup and productivity estimates it is possible to further decompose the markup differences across firm characteristics and to verify whether after controlling for differences in marginal costs (that is productivity) certain groups of firms still have higher markups This is precisely one of the mitigating methods employed to reduce the conflation risk as highlighted before Results in table A16 in annex 1 should be interpreted as follows once productivity level is included in the equation differences in marginal cost are accounted for so the coefficient on ldquomajority state-ownedrdquo for instance captures the variation in average prices between majority state-owned and the size reference category (domestic privately owned firms)
24
markup premium for large companies is 122 percent higher than that of small firms (figure 9) Both size and age effects are still present even after controlling for productivity differences (see table A16 in annex 1)33
Figure 8 Average markup differences relative to young firms by age category
Figure 9 Average markup differences relative to small firms by size category
Source World Bank staff calculations based on SBS data set Note Numbers reflect estimated coefficients (multiplied by 100) for age dummy categoriesmdashrelative to young firms (1ndash5 years old) the omitted categorymdashin a fixed-effect regression model controlling for firm covariates plus year county and NACE 4-digit sector fixed effects as displayed in equation (11) All bars reflect statistically significant results See table A15 in annex 1 for the complete set of results
Source World Bank staff calculations based on SBS data set Note Numbers reflect estimated coefficients (multiplied by 100) for size dummy categoriesmdashrelative to small firms (1ndash50 employees) the omitted categorymdashin a fixed-effect regression model controlling for firm covariates plus year county and NACE 4-digit sector fixed effects as displayed in equation (11) All bars reflect statistically significant results See table A15 in annex 1 for the complete set of results
By the same token export intensity also influences markup performance with firms that export earning higher markups Being an exporter is a relevant firm feature to be analyzed when it comes to understanding markup performance Recent models of international trade predict that exporting firms earn higher markups than non-exporting firms either because they are relatively more productive and can thus undercut their rivals (see Melitz and Ottaviano 2008) or because they produce higher-quality goods and rely on higher-quality inputs which allow them to charge higher prices (see Hallak and Sivadasan 2009) In this regard the results summarized in figure 10 are consistent with the literature and suggest that exporting firmsmdashdefined as those whose direct exports represent more than 10 percent of total revenuemdashearn higher markups than non-exporting firms that operate in the same product market (NACE 4-digit sector) the difference ranges from 12 percent to 416 percent depending on how data are clustered across large sectors (manufacturing services and mining)
33 See footnote 32 on how to interpret results in table A16 in annex 1 (after including productivity as an additional control)
22
-160
158
7948
228
54
-505
101520253035
d
iffer
ence
Mature (between 6 and 15 years old)
Old (older than 15)
23
-830
090
327
169122
-15-55
152535
d
iffer
ence
Medium (between 51 and 250)
Large (more than 250 employees)
25
Figure 10 Average markup differences relative to non-exporters by export status
Figure 11 Average markup differences relative to non-RampD performers by RampD status
Source World Bank staff calculations based on SBS data set Note Numbers reflect estimated coefficients (multiplied by 100) for RampD dummy categorymdashrelative to non-RampD performer firms the omitted categorymdashin a fixed-effect regression model controlling for firm covariates plus year county and NACE 4-digit sector fixed effects as displayed in equation (11) All bars reflect statistically significant results See table A15 in annex 1 for the complete set of results
Source World Bank staff calculations based on SBS data set Note Numbers reflect estimated coefficients (multiplied by 100) for export dummy categorymdashrelative to non-exporters the omitted categorymdashin a fixed-effect regression model controlling for firm covariates plus year county and NACE 4-digit sector fixed effects as displayed in equation (11) All bars reflect statistically significant results See table A15 in annex 1 for the complete set of results
Performing RampD activities is positively correlated with markup differences while location proxied by county also matters to explain markup performance Results displayed in figure 11 show that RampD performersmdashidentified by those firms whose RampD expenses surpass more than 1 percent of their total revenuemdashtend to earn higher markups than non-RampD performers The markup premium for RampD performers is always positive suggesting that this group of firms is able to recoup fixed costs associated with RampD activities The magnitude of the premium varies from 16 percent to 46 percent depending how data are clustered across large sectors (manufacturing services and mining) In addition results displayed in figure 12 show that firms in the same product market (at NACE 4-digit level) and with similar characteristics (in terms of ownership age size and export and RampD profiles) charge different markups depending on the county in which they operate Except for Dolj firms in all other counties demonstrate lower average markups than Bucharest the negative markup premium in relation to Bucharest varies from minus154 percent (Vrancea) to minus36 percent (Satu-Mare)
12
258
416
119
05
101520253035404550
d
iffer
ence
160
340
460
273
05
101520253035404550
d
iffer
ence
26
Figure 12 Average markup differences by county relative to Bucharest
Source World Bank staff calculations based on SBS data set Note Numbers reflect estimated coefficients (multiplied by 100) for county fixed effectsmdashrelative to Bucharest the omitted categorymdashin a fixed-effect regression model controlling for firm covariates plus year and NACE 4-digit sector fixed effects as displayed in equation (11) All bars reflect statistically significant results See table A15 in annex 1 for the complete set of results
A variance decomposition analysis suggests that ownership is the most relevant characteristic to explain total variance of markup performance across firms in Romania followed by capital intensity and export status Drawing from estimations of equation (11) it is possible to evaluate the relative importance of each variable to explain the variance of the markup Letting dExp represent any of the explanatory variables of equation (11) the contribution to the variance of the markup of that variable can be defined as
119862119862119879119879119899119899119886119886119889119889119864119864119864119864119864119864 = 12057512057532119881119881119886119886119903119903119889119889119864119864119864119864119864119864+21205751205753119872119872119862119862119862119862(119889119889119864119864119864119864119864119864120583120583minus1205751205753119889119889119864119864119864119864119864119864)119881119881119886119886119903119903(120583120583)
(12)
or as the variance of the variable plus 2 times the covariance of the variable with the part of the markup not explained by that variable A similar expression can be derived for any of the remaining explanatory variables The relative contribution of each variable is computed after discounting the residuals sector and year contributions Results are displayed in figure 13 Ownership structure is shown to be the most relevant feature to explain the variance of markup performance across firms it accounts for 347 percent of the explained variance of markup performance (after removing NACE 4-digit sector and year contributions) The second most important characteristic is capital intensity corresponding to 214 percent of the variance of the markup performance Export status accounts for the third largest share in explained variance 113 percent
d
iffer
ence
27
Figure 13 Contribution by each firm characteristic to explain total variance of markup performance across firms
Source World Bank staff calculations based on SBS data set Note The pie chart reflects markup variance decomposition results It decomposes the variance of markup performance across firms after removing the proportion accounted for by omitted factors NACE 4-digit sector and year contributions
44 WHAT WOULD BE THE PRODUCTIVITY DIVIDENDS FROM MARKUP REDUCTION
While it became evident that aggregate market power in Romania has been rising it is important to analyze its consequences for economic growth An indirect way to measure this is to estimate the productivity dividends that would come from markup reduction The association between markup and productivity can be positive or negative depending on the nature of competition in the specific marketssectors As shown by Autor et al (2017) and Van Reenen (2018) there are marketsmdashsuch as high-tech sectors or knowledge-intensive onesmdashwhere the nature of competition tends to emphasize the importance of network effects economies of scale and scope and intangible assets so the most productive and dynamic firms exert higher markups and obtain larger market shares On the other hand in certain markets where recouping fixed costs (such as RampD) because of higher-risk investments is not that relevant high-markup firms are not necessarily more productive and efficient Another way to look at this contrast is through the inverted-U relationship of innovation and competition to an increase in productivity as explored by Aghion et al (2005) According to this view stronger competition (proxied here by smaller markups) encourages neck-and-neck firms to innovatemdashthe ldquoescape competitionrdquo effectmdashand therefore to increase productivity growth At the same time this view discourages laggard firms from innovating (the Schumpeterian effect) therefore reducing productivity growth The combination of the two effectsmdashescaping competition and discouraging innovationmdashexplains the inverted-U relationship of competition and innovation with productivity growth
To assess the correlation between productivity growth and markups in Romania the analysis uses firm-level estimations of TFPR and markups obtained so far Thus it estimates the specification presented in Aghion Braun and Fedderke (2008) as follows
Δ119889119889119899119899119879119879119897119897119897119897119877119877119888119888119895119895119894119894119895119895 = 1206011206010 + 1206011206011120583120583119888119888119895119895119894119894119895119895 + 120578120578119895119895 + 120588120588119895119895 + 120574120574119888119888 + 120592120592119888119888119895119895119894119894119895119895 (13)
where the left-hand-side variable represents TFPR growth of firm i in NACE 4-digit sector j in year t 120583120583119894119894119895119895119895119895minus1 is the lagged value of firm irsquos markup in sector j in year t ηt ρj and γc are
214
113
79
47
347
64
136
capital intensity Export status RampD status age ownership size region
28
respectively time NACE 4-digit sector and county fixed effects Equation (13) is estimated separately for each 1-digit sector (that is manufacturing services and mining) and for the whole economy while the equation parameters are estimated by OLS always using heteroscedasticity-robust standard errors
Figure 14 Productivity (TFPR) growth dividends from a 10 percent reduction of average markup by sector
Source World Bank staff calculations based on SBS data set Note Results from year county and 4-digit sector fixed effects Coefficient for mining was not statistically significant
Results shows that on average reducing markups would have a positive impact on aggregate productivity expansion Results displayed in table A18 in annex 1 suggest that lower (past) markups are associated with higher (current) productivity growth all coefficients for lagged markups are negative and statistically significant at conventional values for all sectors except mining Overall this negative correlation between past markup level and productivity growth is an indication of a positive association between competition and productivity growth which would be driven by the escape competition effect described by Aghion et al (2008)34
The magnitude of the economic effect of markup reduction on productivity growth is sizable Figure 14 shows that a 10 percent decrease in the average markup of 61 percent for the overall economy in the 2008ndash17 period would imply an increase in productivity (TFPR) growth of 082 percentage point per year The economic effect for the manufacturing sector would be substantially higher reducing the average markup of 403 percent for manufacturing in the same period would imply an increase in TFPR growth of 147 percentage points per year
Further productivity dividends stemming from markup reduction vary substantially across NACE 4-digit sectors The same specification expressed in equation (9) is estimated for each NACE 4-digit sector separately controlling for year and county fixed effects The TFPR growth dividends from markup reduction are computed for each NACE 4-digit sector drawing from the estimated coefficients (see table A18 in annex 1) Results vary substantially
34 An extended specificationmdashwhere the squared value of lagged markup is included as an additional dependent variablemdashwas also estimated The estimated coefficient of the squared term was not statistically significant (see results in table A17 in annex 1)
147
048
082
0
02
04
06
08
1
12
14
16
Manufacturing Services All
Perc
enta
ge p
oint
s per
yea
r
29
across sectors among those 4-digit sectors where the estimated coefficients are statistically significant the productivity growth dividends of a 10 percent decrease in markup vary from 701 percentage points to 016 percentage points respectively for NACE sector 1041ndashManufacture of oil and fats and sector 4649ndashWholesale of other household goods (figure 15)35 Productivity dividends from a potential markup reduction are also positive in sectors where the top decile firms in the markup distribution are overly represented for instance in sector 4711ndashRetail sale in non-specialized stores with food beverages or tobacco predominating a 10 percent decrease of average markup would be associated with an increase in TFPR growth of 022 percentage points per year For sector 4690ndashNon-specialized wholesale trade and sector 4673ndashWholesale of wood construction materials and sanitary equipment the productivity dividends would be 018 and 021 percentage points respectively
Figure 15 Productivity (TFPR) growth dividends from a 10 percent reduction of average markup Results by NACE 4-digit sector
Source World Bank staff calculations based on SBS data set
35 There are however some sectors where markup reduction brings detrimental impacts to productivity expansion See complete set of results in table A18in annex 1 for instance in NACE sector 8010ndashPrivate security activities and sector 2432ndashPrecious metals production where a reduction of average markup in the 2008ndash17 period would imply a decrease of TFPR growth of 030 percentage points and 663 percentage points respectively Following Aghion Braun and Fedderke (2008) the Schumpeterian effect of product market competition would be the underlying driver behind this result in these sectors competition reduces innovation incentives and therefore productivity growth by reducing the rents from innovations of firms below the technological frontier
00
10
20
30
40
50
60
70
80
Perc
enta
ge p
oint
s per
yea
r
30
5 CONCLUSIONS
A stylized fact emerging in the recent empirical literature is the increase in average levels of market power across countries in both developed and emerging economies This paper aims to bring new evidence about the evolution of corporate market power in Romania and the implications for competition dynamics It uses markups as a proxy for market power and explores firm-level heterogeneity to identify the underlying drivers of aggregate trends The paper applies the production approachmdashfollowing De Loecker and Warzynski (2012) De Loecker and Eeckhout (2018) and De Loecker Eeckhout and Unger (2020)mdashto estimate markup at the firm-year level for Romania The Romanian Structural Business Survey data set is used to apply this methodology
Results show that the aggregate markup in Romania increased by around 15 percent between 2008 and 2017 However this aggregate performance masks a lot of heterogeneity the first being heterogeneity of markups across the main sectors While in manufacturing (sales-weighted) average markups experienced a declining pattern of minus57 percent during 2008ndash17 there was an opposite and much more rapid trend in services with an aggregate change of 422 percent
Second at the firm level results suggest that a key driving force behind this aggregate trend was the ability of the top decile of firms in the markup distribution to increase their markups This increase has been faster than for the rest of the firms Firms in the 90th percentile of the markup distribution increased their (sales-weighted) average markup by 285 percent between 2008 and 2017 while the rest of firms (that is those below the top decile firms) experienced a completely opposite trend their weighted markup contracted by 83 percent over the same period
This sample of top decile firms does not seem to follow the typical superstar firmsrsquo profile which suggests that the increase in markups in Romania might be associated with an environment that is less conducive to competition The top decile firms in the markup distribution are 468 percent smaller 910 percent less productive and 33 percent less likely to invest in intangible assets than the rest of the firms in the markup distribution and they are overrepresented in less knowledge-intensive service sectors Therefore they do not seem to follow the typical superstar firmsrsquo profile (typically larger more productive and more likely to invest in intangible assets) This suggests that the increase in markups in Romania might be more due to relatively weak competition rather than to changes in the nature of competition where superstar firms (usually more efficient and innovative) are rewarded with greater market share In fact a decomposition exercise shows that the increase in aggregate markups has been driven mostly by incumbents rather than by new entrants and exiting firms These results could be interpreted as a sign of consolidation of market power among existing firms Several policy-related factors could explain this result among them government interventions and regulations that restrict competition by reinforcing dominance or limiting entry facilitating collusive outcomes or increasing the cost to compete in markets and by discriminating and protecting vested interests In this regard illustrative evidence provided by Pop and Ore Monago (2020) shows that despite reforms regulations that restrict entry and rivalry are still present in the retail trade sector which concentrates a substantial proportion of high-markup firms in the Romanian economy
31
Results also show that certain firm characteristics matter in explaining differences in markup performance size age RampD profile export propensity location and notably ownership State-controlled companies tend to demonstrate the highest markup premiums when compared with domestic privately owned companies 289 percent higher for minority state-owned companies and 20 percent higher for fully state-owned companies Old companies (older than 15 years) display 54 percent higher markups on average than young ones no matter the product market (at NACE 4-digit level) where they operate The markup premium for large companies (with more than 250 full-time employees) is 122 percent higher than that of small firms in the overall economy Exporting firmsmdashthose whose direct exports represent more than 10 percent of total revenuemdashearn 119 percent higher markups than non-exporting firms that operate in the same sector At the same time results show that the markup premium for RampD performers (compared with non-RampD performers) is 273 percent for the whole economy and that firms operating in the same product market charge different markups depending on the county where they operate Overall while all these features matter to explain markup performance a variance decomposition analysis suggests that ownership is the most relevant characteristic to explain total variance of markup performance across firms in Romania
In this context given that ownership assumes a prominent role to explain markup performance it is important to ensure competitively neutral policies across markets where private and public enterprises compete The prominent role of ownership in explaining total variance of markup performance across firms combined with the evidence that state-controlled companies tend to exert the highest markup premiums in the overall economy highlights the importance of ensuring competitive neutrality in Romania so that private and public enterprises compete on a fair basis Analysis presented in Pop and Ore Monago (2020) shows that state-owned enterprises (SOEs) in Romania compete on uneven terms with the private sector because of gaps in terms of both the current regulatory framework as well as its implementation As for the regulatory framework itself lack of competitive neutrality emerges from restrictive SOE governance rules and the exemption of newly setup SOEs from the corporate governance law lack of rules mandating the separation of commercial and noncommercial functions despite legal separation (for example in the railway and energy sectors) and the lack of specific provisions that require SOE investments to show positive rates of returns With regard to implementation of the regulatory framework competitive neutrality gaps stem from (a) the protracted application of corporate governance rules (b) fragmentation of SOE oversight across institutions with frequent overlaps (c) inconsistent reporting of SOE performance that prevents full monitoring and comparability with the private sector performance in comparable situations (d) little clarity in terms of compensation for public service obligations and (e) lack of transparency in state aid allocation
Finally the analysis shows that productivity dividends arise from increased competition in Romania As such lowering markups can boost productivity growth A 10 percent decrease in the average markup for the overall economy during 2008ndash17 would imply an increase in productivity (TFPR) growth of 082 percentage point per year The effect for the manufacturing sector is higher (147 percentage points per year) but lower for services (048 percentage point per year) The ldquoescape competitionrdquo effect described by Aghion Braun and Fedderke (2008)mdashthrough which fiercer competition induces firms to innovate to escape competition with the fringe therefore increasing productivity growthmdashwould be the underlying driver behind these average results for the manufacturing industry Results vary substantially across sectors among
32
those 4-digit sectors where the estimated coefficients are statistically significant the productivity growth dividend of a 10 percent decrease in markup varies from 701 percentage points (sector 1041ndashManufacture of oil and fats) to 016 percentage point (sector 4649ndashWholesale of other household goods)
In this context boosting competition becomes a key part of the engine to drive productivity growth and help consolidate Romaniarsquos convergence to a high-income level Implementing pro-competition policies is instrumental Besides removing anticompetitive regulations and promoting competitive neutrality policy makers should ensure that state aid is allocated in a non-distortive way and enable more effective competition law and antitrust enforcement
33
REFERENCES
Ackerberg D K Caves and G Frazer 2015 ldquoIdentification Properties of Recent Production Function Estimatorsrdquo Econometrica 83 (6) 2411ndash51
Aghion P N Bloom R Blundell R Griffith and P Howitt 2005 ldquoCompetition and Innovation An Inverted-U Relationshiprdquo Quarterly Journal of Economics 120 (2) 701minus28
Aghion P M Braun and J Fedderke 2008 ldquoCompetition and Productivity Growth in South Africardquo Economics of Transition 16 (4) 741ndash68
Autor D D Dorn F Lawrence C Patterson and J Van Reenen 2017 ldquoThe Fall of the Labor Share and the Rise of Superstar Firmsrdquo NBER Working Paper 23396 National Bureau of Economic Research Cambridge MA
Barkai S 2020 ldquoDeclining Labor and Capital Sharesrdquo Journal of Finance 75 (5) 2421ndash63
Bartelsman E J and M Doms 2000 ldquoUnderstanding Productivity Lessons from Longitudinal Microdatardquo Journal of Economic Literature 38 (3) 569ndash94
Berry S J Levinsohn and A Pakes 1995 ldquoAutomobile Prices in Market Equilibriumrdquo Econometrica Journal of the Econometric Society 63 (4) 841ndash90
Berry S J Levinsohn and A Pakes 2004 ldquoDifferentiated Products Demand Systems from a Combination of Micro and Macro Data The New Car Marketrdquo Journal of Political Economy 112 (1) 68ndash105
Bessen J 2017 ldquoInformation Technology and Industry Concentrationrdquo Law and Economics Paper No 17-41 Boston University School of Law Boston
Bond S A Hashemi G Kaplan and P Zoch 2020 ldquoSome Unpleasant Markup Arithmetic Production Function Elasticities and their Estimation from Production Datardquo NBER Working Paper No 27002 National Bureau of Economic Research Cambridge MA
Bresnahan T F 1989 ldquoEmpirical Studies of Industries with Market Powerrdquo In Handbook of Industrial Organization Vol 2 edited by R Schmalensee and R Willig 1011ndash57 Amsterdam Elsevier
Cameron A C and P K Trivedi 2010 Microeconometrics Using Stata (Rev ed) College Station TX Stata Press
Crouzet N and J Eberly 2018 ldquoUnderstanding Weak Capital Investment The Role of Market Concentration and Intangiblesrdquo NBER Working Paper 25869 National Bureau of Economic Research Cambridge MA De Loecker J 2011 ldquoRecovering Markups from Production Datardquo International Journal of Industrial Organization 29 (3) 350ndash55
De Loecker J 2013 ldquoDetecting Learning by Exportingrdquo American Economic Journal Microeconomics 5 (3) 1ndash21
De Loecker J and J Eeckhout 2018 ldquoGlobal Market Powerrdquo NBER Working Paper 24768 National Bureau of Economic Research Cambridge MA
De Loecker J J Eeckhout and G Unger 2020 ldquoThe Rise of Market Power and the Macroeconomic Implicationsrdquo Quarterly Journal of Economics 135 (2) 561ndash644 httpsdoiorg101093qjeqjz041
34
De Loecker J and F Warzynski 2012 ldquoMark-ups and Firm-Level Export Statusrdquo American Economic Review 102 (6) 2437ndash71
Diacuteez F D Leigh and S Tambunlertchai 2018 ldquoGlobal Market Power and Its Macroeconomic Implicationsrdquo IMF Working Paper 18137 International Monetary Fund Washington DC
Grullon G Y Larkin and R Michaely 2018 ldquoAre US Industries Becoming More Concentratedrdquo Swiss Finance Institute Research Paper No 19-41 httpdxdoiorg102139ssrn2612047
Gutieacuterrez G and T Philippon 2017a ldquoDeclining Competition and Investment in the USrdquo NBER Working Paper 23583 National Bureau of Economic Research Cambridge MA Gutieacuterrez G and T Philippon 2017b ldquoInvestment-less Growth An Empirical Investigationrdquo Brookings Papers on Economic Activity (Fall) 89ndash182 Gutieacuterrez G and T Philippon 2018 ldquoHow EU Markets Became More Competitive than US Markets A Study of Institutional Driftrdquo NBER Working Paper 24700 National Bureau of Economic Research Cambridge MA
Hall R 1988 ldquoThe Relation between Price and Marginal Cost in US Industryrdquo Journal of Political Economy 96 (5) 921ndash47
Hallak J and J Sivadasan 2009 ldquoExporting Behavior under Quality Constraintsrdquo NBER Working Paper 14928 National Bureau of Economic Research Cambridge MA
IMF (International Monetary Fund) 2019 World Economic Outlook April 2019 Growth Slowdown Precarious Recovery Washington DC International Monetary Fund
Koujianou Goldberg P and R Hellerstein 2012 A Structural Approach to Identifying the Sources of Local Currency Price Stability Review of Economic Studies 80 (1) 175ndash210
Melitz M J and G Ottaviano 2008 ldquoMarket Size Trade and Productivityrdquo Review of Economic Studies 75 (1) 295ndash316
Melitz M J and S Polanec 2015 ldquoDynamic Olley-Pakes Productivity Decomposition with Entry and Exitrdquo RAND Journal of Economics 46 (2) 362ndash75
Motta M 2004 Competition Policy Theory and Practice Cambridge MA Cambridge University Press
Pop G and T Ore Monago 2020 ldquoCompetition and Government Interventions in Romania An Assessment with Focus on Product Market Regulations and Competitive Neutralityrdquo Background paper for Markets and People Romania Country Economic Memorandum International Development in Focus World Bank Washington DC
Shapiro C 2018 ldquoAntitrust in a Time of Populismrdquo International Journal of Industrial Organization 61 714ndash48
Syverson C 2004 ldquoProduct Substitutability and Productivity Dispersionrdquo Review of Economics and Statistics 86 (2) 534ndash50
Van Reenen J 2018 ldquoIncreasing Differences between Firms Market Power and the Macroeconomyrdquo CEPR Discussion Paper 1576 Center for Economic and Policy Research Washington DC
35
World Bank 2020a ldquoMarkets and People Romania Country Economic Memorandumrdquo International Development in Focus World Bank Washington DC
World Bank 2020b ldquoAssessing the Direct and Indirect Impact of State Aid in Romania An Ex-post Evaluationrdquo World Bank Washington DC
36
ANNEX 1 ADDITIONAL FIGURES AND TABLES
Figure A11 Evolution of (sales-weighted) average markup in manufacturing sector by technology intensity 2008ndash17
Source World Bank staff calculations based on SBS data set
Table A11 Manufacturing industry groups by technology intensity Eurostat classification
85
99
51
Mar
k-up i
ndex
(200
8 = 1
)
2008 2009 2010 2011 2012 2013 2014 2015 2016 2017Year
Manuf High-tech
37
Source Eurostat Indicators on High-Tech Industry and KnowledgendashIntensive Services annex 3 httpseceuropaeueurostatcachemetadataAnnexeshtec_esms_an3pdf
38
Figure A12 Evolution of (sales-weighted) average markup in services sector by knowledge intensity
39
Table A12 Services groups by knowledge intensity Eurostat classification
40
Source Eurostat Indicators on High-Tech Industry and KnowledgendashIntensive Services annex 3 httpseceuropaeueurostatcachemetadataAnnexeshtec_esms_an3pdf
41
Table A13 Original ownership classification from SBS SBS Code Description
10 Fully state-owned Majority state-owned (statepublic capital gt 50 of equity)
21 State + Romanian private 22 State + foreign 23 State + Romanian private + foreign
Majority privately owned (private capital ge 50 of equity) 26 State + Romanian private 27 State + foreign 28 State + Romanian private + foreign
Fully privately owned 31 Romanian private 32 Romanian private + foreign 40 Cooperative 50 Craft organizations 60 Fully foreign-owned 70 Public of national and local interest
Source World Bank staff calculations based on SBS data set
Table A14 Ownership classification adopted in the analysis SBS codes (combined) Description
10 21 22 23 State owned (fully + majority state-owned) 26 27 28 Private-public (majority private)
31 Fully private (domestic) 32 Fully private (domestic + foreign) 60 Fully private (fully foreign) 70 Public of national and local interest
40 50 Other Source World Bank staff calculations based on SBS data set
Table A15 Conditional correlations between firm characteristics and markup performance regression results
Variable Manufacturing Services Mining All Capital stock (ln) minus0150 minus0039 minus0067 minus0066 Export dummy 0120 0258 0416 0119 RampD dummy 0160 0340 0460 0273 Mature 0022 minus0016 0158 minus0005 Old 0079 0048 0228 0054 Majority state-owned 0527 0139 0772 0200 State-private ownership 0352 0275 0111 0289 Romanian private + foreign 0161 0279 0096 0229 Fully foreign-owned 0105 0263 0 0201 Public of national and local interest 0209 0149 (omitted) 0214 Other 0884 0555 (omitted) 0758 Medium 0230 minus0083 0011 0009 Large 0327 0169 minus0015 0122 1 Alba 0106 minus0087 minus0151 minus0042 2 Arad 0038 minus0090 minus0148 minus0077 3 Arges minus0005 minus0053 minus0195 minus0060
42
Variable Manufacturing Services Mining All 4 Bacau 0092 minus0090 minus0194 minus0055 5 Bihor 0036 minus0115 minus0256 minus0088 6 Bistrita-Nasaud minus0064 minus0156 minus0069 minus0144 7 Botosani 0046 minus0089 minus0438 minus0076 8 Brasov 0041 minus0047 0049 minus0040 9 Braila 0133 minus0055 minus0265 minus0025 10 Buzau 0017 minus0123 minus0025 minus0100 11 Caras-Severin 0035 minus0187 minus0005 minus0139 12 Cluj minus0004 minus0094 minus0119 minus0088 13 Constanta 0057 minus0105 0062 minus0088 14 Covasna 0038 minus0056 minus0151 minus0052 15 Dambovita 0005 minus0183 minus0154 minus0144 16 Dolj 0195 0060 minus0042 0079 17 Galati 0106 minus0007 minus0276 0004 18 Gorj 0084 0028 minus0116 0026 19 Harghita 0101 minus0102 minus0007 minus0045 20 Hunedoara 0167 minus0031 minus0057 0011 21 Ialomita 0138 minus0049 minus0265 minus0027 22 Iasi minus0014 minus0038 minus0384 minus0058 23 Ilfov 0011 0009 0314 0010 24 Maramures 0094 minus0020 minus0042 0 25 Mehedinti 0113 minus0136 minus0720 minus0096 26 Mures 0048 minus0063 minus0093 minus0048 27 Neamt 0001 minus0108 minus0428 minus0102 28 Olt 0073 minus0005 minus0397 minus0011 29 Prahova 0018 minus0034 minus0028 minus0043 30 Satu-Mare 0033 minus0024 minus0056 minus0036 31 Salaj 0075 minus0045 minus0448 minus0031 32 Sibiu 0044 minus0038 minus0154 minus0041 33 Suceava 0044 minus0087 minus0111 minus0074 34 Teleorman 0103 minus0099 minus0299 minus0062 35 Timis 0030 minus0020 minus0341 minus0037 36 Tulcea 0142 minus0149 0096 minus0078 37 Vaslui 0091 minus0017 minus0105 minus0007 38 Valcea 0078 minus0008 minus0122 minus0002 39 Vrancea minus0061 minus0163 minus0608 minus0154 51 Calarasi 0080 minus0122 0672 minus0075 52 Giurgiu 0052 minus0064 minus0334 minus0066
_cons 2147 1150 2291 2246 NACE 4-digit fixed effects Yes Yes Yes Yes
Year fixed effects Yes Yes Yes Yes
R2 0345 0235 0254 0279 Source World Bank staff calculations based on SBS data set Note Dependent variable = ln(markup) denotes significance level at 1 percent at 5 percent and at 10 percent
43
44
Table A16 Conditional correlations between firm characteristics (including productivity) and markup performance regression results
Variable Manufacturing Services Mining All Capital stock (ln) minus0149 minus0038 minus0065 minus0066 Export dummy 0116 0257 0400 0118 RampD dummy 0182 0366 0449 0295 Mature 0021 minus0014 0164 minus0003 Old 0079 0052 0228 0057 Majority state-owned 0529 0147 0758 0209 State-private ownership 0351 0274 0118 0288 Romanian private + foreign 0156 0275 0090 0225 Fully foreign-owned 0096 0254 minus0011 0192 Public of national and local interest 0179 0165 (omitted) 0233 Other 0879 0561 (omitted) 0759 Medium 0232 minus0083 0002 0010 Large 0327 0170 minus0016 0122
Productivity (TFPR) 0051 0020 0041 0024 1 Alba 0114 minus0081 minus0156 minus0035 2 Arad 0045 minus0085 minus0135 minus0071 3 Arges 0001 minus0049 minus0196 minus0056 4 Bacau 0098 minus0084 minus0188 minus0049 5 Bihor 0042 minus0111 minus0268 minus0083 6 Bistrita-Nasaud minus0057 minus0150 minus0055 minus0137 7 Botosani 0053 minus0082 minus0443 minus0069 8 Brasov 0045 minus0042 0033 minus0035 9 Braila 0139 minus0048 minus0243 minus0018 10 Buzau 0022 minus0118 minus0002 minus0094 11 Caras-Severin 0042 minus0178 minus0001 minus0131 12 Cluj minus0001 minus0089 minus0120 minus0083 13 Constanta 0067 minus0101 0056 minus0084 14 Covasna 0045 minus0050 minus0166 minus0046 15 Dambovita 0010 minus0180 minus0162 minus0140 16 Dolj 0202 0068 minus0054 0087 17 Galati 0114 minus0001 minus0289 0010 18 Gorj 0091 0037 minus0118 0035 19 Harghita 0108 minus0096 minus0005 minus0039 20 Hunedoara 0173 minus0025 minus0055 0018 21 Ialomita 0144 minus0045 minus0256 minus0023 22 Iasi minus0005 minus0034 minus0394 minus0053 23 Ilfov 0013 0012 0296 0013 24 Maramures 0101 minus0013 minus0038 0007 25 Mehedinti 0128 minus0132 minus0729 minus0090 26 Mures 0053 minus0057 minus0105 minus0042 27 Neamt 0010 minus0101 minus0434 minus0094
45
Variable Manufacturing Services Mining All 28 Olt 0082 0002 minus0402 minus0004 29 Prahova 0023 minus0029 minus0032 minus0039 30 Satu-Mare 0038 minus0018 minus0047 minus0030 31 Salaj 0081 minus0039 minus0433 minus0025 32 Sibiu 0044 minus0034 minus0147 minus0038 33 Suceava 0051 minus0081 minus0105 minus0068 34 Teleorman 0117 minus0092 minus0296 minus0053 35 Timis 0033 minus0014 minus0340 minus0032 36 Tulcea 0147 minus0142 0078 minus0072 37 Vaslui 0101 minus0011 minus0104 0 38 Valcea 0087 minus0002 minus0120 0004 39 Vrancea minus0053 minus0158 minus0602 minus0148 51 Calarasi 0086 minus0118 0673 minus0071 52 Giurgiu 0059 minus0060 minus0334 minus0061
_cons 1632 0993 1934 2036 NACE 4-digit fixed effects Yes Yes Yes Yes
Year fixed effects Yes Yes Yes Yes
R2 0347 0235 0255 0280 Source World Bank staff calculations based on SBS data set Note Dependent variable = ln(markup) denotes significance level at 1 percent at 5 percent and at 10 percent
Table A17 Productivity growth and markup performance regression results
All Manufacturing Services Mining
Lag markup minus0025 minus0028 minus0026 minus0027 minus0025 minus0027 minus0012 minus0024
Lag markup squared 0001 0000 0001 0003 NACE 4-digit sector fixed effects Yes Yes Yes Yes Yes Yes Yes Yes County fixed effects Yes Yes Yes Yes Yes Yes Yes Yes Year fixed effects Yes Yes Yes Yes Yes Yes Yes Yes
Observations 245525 245525 76694 76694 167120 167120 1711 1711 Source World Bank staff calculations based on SBS data set Note Dependent variable = TFPR growth denotes significance level at 1 percent at 5 percent and at 10 percent
46
Table A18 Productivity (TFPR) growth dividends from a 10 reduction of average markup results by NACE 4-digit sector
NACE 4-digit sector Gain in TFPR growth per
year (percentage points)
1041ndashManufacture of oils and fats 7015 4331ndashPlastering 5547 2060ndashManufacture of man-made fibers 5286 2824ndashManufacture of power-driven hand tools 4869 1072ndashManufacture of rusks and biscuits manufacture of preserved pastry goods and cakes
4145
1104ndashManufacture of other non-distilled fermented beverages 3984 1723ndashManufacture of paper stationery 3716 2812ndashManufacture of fluid power equipment 3566 2452ndashCasting of steel 3278 1101ndashDistilling rectifying and blending of spirits 3134 1420ndashRaising of other cattle and buffaloes 3072 2011ndashManufacture of industrial gases 3033 2593ndashManufacture of wire products chain and springs 2689 2829ndashManufacture of other general-purpose machinery nec 2641 4910ndashPassenger rail transport interurban 2629 2451ndashCasting of iron 2615 3821ndashTreatment and disposal of non-hazardous waste 2375 2059ndashManufacture of other chemical products nec 2336 2920ndashManufacture of bodies (coachwork) for motor vehicles manufacture of trailers and semi-trailers
2270
1051ndashOperation of dairies and cheese making 2224 3313ndashRepair of electronic and optical equipment 2160 1081ndashManufacture of sugar 2158 1073ndashManufacture of macaroni noodles couscous and similar farinaceous products 2081 4213ndashConstruction of bridges and tunnels 2077 2223ndashManufacture of buildersrsquo ware of plastic 2011 2550ndashForging pressing stamping and roll-forming of metal powder metallurgy 1949 2313ndashManufacture of hollow glass 1926 2825ndashManufacture of non-domestic cooling and ventilation equipment 1889 2020ndashManufacture of pesticides and other agrochemical products 1818 2571ndashManufacture of cutlery 1758 5914ndashMotion picture projection activities 1691 5920ndashSound recording and music publishing activities 1665 3514ndashTrade of electricity 1653 1310ndashPreparation and spinning of textile fibers 1616 4920ndashFreight rail transport 1613 4339ndashOther building completion and finishing 1586 2620ndashManufacture of computers and peripheral equipment 1543 4311ndashDemolition 1515 3832ndashRecovery of sorted materials 1404 3523ndashTrade of gas through mains 1382 2410ndashManufacture of basic iron and steel and of ferro-alloys 1353 2399ndashManufacture of other non-metallic mineral products nec 1272 2017ndashManufacture of synthetic rubber in primary forms 1258 7711ndashRental and leasing of cars and light motor vehicles 1256 4212ndashConstruction of railways and underground railways 1128 2453ndashCasting of light metals 1080 7410ndashSpecialized design activities 1068 5630ndashBeverage serving activities 1065 4211ndashConstruction of roads and motorways 0989 4677ndashWholesale of waste and scrap 0926 4676ndashWholesale of other intermediate products 0917 4120ndashConstruction of residential and non-residential buildings 0912 4623ndashWholesale of live animals 0890 6820ndashRental and operating of own or leased real estate 0826 4110ndashDevelopment of building projects 0824
47
NACE 4-digit sector Gain in TFPR growth per year
(percentage points) 4613ndashAgents involved in the sale of timber and building materials 0823 4322ndashPlumbing heat and air-conditioning installation 0731 5629ndashOther food service activities 0699 4791ndashRetail sale via mail order houses or via internet 0659 4941ndashFreight transport by road 0659 4618ndashAgents specialized in the sale of other particular products 0646 7219ndashOther research and experimental development on natural sciences and engineering 0623 4617ndashAgents involved in the sale of food beverages and tobacco 0609 5510ndashHotels and similar accommodation 0560 4615ndashAgents involved in the sale of furniture household goods hardware and ironmongery
0541
4633ndashWholesale of dairy products eggs and edible oils and fats 0540 4778ndashOther retail sale of new goods in specialized stores 0527 4621ndashWholesale of grain unmanufactured tobacco seeds and animal feeds 0517 4662ndashWholesale of machine tools 0501 6110ndashWired telecommunications activities 0491 4634ndashWholesale of beverages 0468 5610ndashRestaurants and mobile food service activities 0463 4631ndashWholesale of fruit and vegetables 0426 4532ndashRetail trade of motor vehicle parts and accessories 0394 1411ndashManufacture of leather clothes 0390 4511ndashSale of cars and light motor vehicles 0382 4637ndashWholesale of coffee tea cocoa and spices 0361 4645ndashWholesale of perfume and cosmetics 0354 1419ndashManufacture of other wearing apparel and accessories 0344 4643ndashWholesale of electrical household appliances 0335 4639ndashNon-specialized wholesale of food beverages and tobacco 0285 4619ndashAgents involved in the sale of a variety of goods 0281 4675ndashWholesale of chemical products 0249 4711ndashRetail sale in non-specialized stores with food beverages or tobacco predominating 0223 4673ndashWholesale of wood construction materials and sanitary equipment 0214 4690ndashNon-specialized wholesale trade 0188 4649ndashWholesale of other household goods 0158 8010ndashPrivate security activities minus0300 8220ndashActivities of call centres minus0323 2572ndashManufacture of locks and hinges minus0503 7120ndashTechnical testing and analysis minus0511 3315ndashRepair and maintenance of ships and boats minus0512 3600ndashWater collection treatment and supply minus0547 4754ndashRetail sale of electrical household appliances in specialized stores minus0627 2341ndashManufacture of ceramic household and ornamental articles minus0646 7111ndashArchitectural activities minus0649 6120ndashWireless telecommunications activities minus0746 7312ndashMedia representation minus1023 4334ndashPainting and glazing minus1200 5020ndashSea and coastal freight water transport minus1276 1052ndashManufacture of ice cream minus1367 5911ndashMotion picture video and television programme production activities minus1439 2592ndashManufacture of light metal packaging minus1619 2752ndashManufacture of non-electric domestic appliances minus1729 2521ndashManufacture of central heating radiators and boilers minus1843 4932ndashTaxi operation minus2568 2013ndashManufacture of other inorganic basic chemicals minus3524 1711ndashManufacture of pulp minus3631 4942ndashRemoval services minus4214 1092ndashManufacture of prepared pet foods minus4262 3040ndashManufacture of military fighting vehicles minus5508 2432ndashCold rolling of narrow strip minus6629
Source World Bank staff calculations based on SBS data set Note The table displays only sectors for which estimated coefficients are statistically significant
48
- 1 Introduction and motivation
- 2 Methodology
- 3 Data set
- 4 Results
-
- 41 Has corporate market power increased at the aggregate level How do aggregate trends differ across sectors Is there a group of firms driving the overall trend
- 42 How have firm dynamics influenced aggregate markup performance Are there signs of market power consolidation among incumbent firms
- 43 Do firm markups differ across firms with different attributes
- 44 What would be the productivity dividends from markup reduction
-
- 5 Conclusions
- References
- Annex 1 Additional figures and tables
-

16
percent18 smaller and 91 percent 19 less productive than the rest of the firms even within narrowly defined sectors (at NACE 4-digit level) Results in column 3 captures the differences between these two groups of firms in terms of their willingness to invest in intangible assetsmdashtheir ldquoknowledge capacityrdquomdasha key determinant of firmsrsquo expansion in the long term Results suggest that the sample of top decile firms are almost 33 percent less likely to invest in intangible fixed assets than the remaining firms even within NACE 4-digit sectors20 All these correlations are statistically significant at the 1 percent confidence level
Table 3 Characteristics of top decile firms Conditional correlations between markups and firm characteristics (OLS and Probit results)
(Estimation method) Dependent variable (1)
(OLS) Employment
(ln)
(2) (OLS)
TFPR discounted for markup (ln)
(3) (Probit)
Investment in intangibles
(yesno) Top _decile minus0632 minus2422 minus0386 NACE 4-digit sector fixed effects
Yes Yes Yes
County fixed effects Yes Yes Yes Year fixed effects Yes Yes Yes R2 (pseudo R2)a 0238 0728 0078 Observations 484604 403561 484594
Source World Bank staff calculations based on SBS data set Note All firm-year observations (for the 2008ndash17 period) are pooled together and NACE 4-digit sector and year fixed effects are included OLS = ordinary least squares TFPR = revenue-based total factor productivity a It is worth highlighting that R2 value does not influence the consistency of the estimators of each population parameter which is the objective of the current analysis See for instance Cameron and Trivedi (2010) for a theoretical discussion on this matter Moreover since the analysis draws on a large sample the standard errors of the coefficient estimators are not affected because of the law of large numbers The key issue would be the lack of correlation of omitted variables and the explanatory variables However given that the main (theoretical) determinants of the markup performance are included the omitted variables can be understood to be random Statistically significant at 1 percent
In addition the group of 10 top decile firms in the markup distribution operate mainly in the services sector and are overrepresented in less-knowledge-intensive services sectors with some exceptions Table 4 displays the distribution of top decile firms across NACE 2-digit sectors in 2017 To control for the fact that some sectors might be overrepresented (given the SBS survey sampling) the table shows only those sectors for which the probability of a firm being in the top decile is larger than the sectorrsquos frequency ratio Results show that firms in the 90th percentile of markup distribution are overrepresented in wholesale trade and retail trade sectors the probability of a top decile firm being in these two sectorsmdashclassified as less-knowledge-intensive services according to the Eurostat definition
18 This value results from the following expression 100[exp(beta)minus1] where beta equals estimated top 90 percent dummy coefficients in an OLS regression where size is the dependent variable controlling for 4-digit and county fixed effects (table 3 column 1) 19 This value results from the following expression 100[exp(beta)minus1] where beta equals estimated top 90 percent dummy coefficients in an OLS regression where TFPR is the dependent variable controlling for 4-digit and county fixed effects (table 3 column 2) 20 The odds-ratio is computed as the relative difference between the marginal effects for each category (that is 42 percent for the top decile firms and 56 percent for firms below the 90th percentile) Specifically it is computed as follows (56 percent minus 42 percent)(42 percent)
17
(see table A12 in annex 1)mdashis almost 40 percent21 It is worth highlighting however that these top decile firms also operate in some knowledge-intensive services sectors though the probability is much smaller 387 percent for computer programming and 268 percent for security and investigating activities22
When taken together these results suggest that the small group of firms leading the overall increase in markups in Romania does not seem to follow the typical superstar firmsrsquo profile As discussed by Van Reenen (2018) and Autor et al (2017) superstar firmsmdashtypically with higher markups larger and more productive ndash would be rewarded with larger market shares due to their innovative nature This hypothesis does not seem to be supported by data in Romania As results showed the group of firms who are driving the aggregate rise in markupsmdashthe top decile firms of the markup distributionmdashare typically smaller less productive less likely to invest in intangible assets and are mostly active in services sectors where use and diffusion of knowledge is less important This may suggest that the increase in markups in Romania might reflect a less competition-intensive environment rather than changes in the nature of competition where superstar firms would be rewarded with greater market share because they are more efficient and innovative
Table 4 Probability of a top decile firm (in the markup distribution) being in the following sectors
2-digit sector Probability Wholesale trade 2436 Retail trade 1477 Computer programming 387 Manufacturing of wearing apparel 321 Real estate activities 314 Security and investigation activities 268
Source World Bank staff calculations based on SBS data set Note The table shows only sectors for which the probability of a firm being in the top decile of markup distribution is higher than the sectorrsquos overall frequency ratio
42 HOW HAVE FIRM DYNAMICS INFLUENCED AGGREGATE MARKUP PERFORMANCE ARE THERE SIGNS OF MARKET POWER CONSOLIDATION AMONG INCUMBENT FIRMS
To indirectly assess whether the rise in markups is associated with weakening competition the analysis decomposes the evolution of aggregate markups into that of incumbents and of net entry of firms To do so the Melitz and Polanec (2015) decomposition technique is applied to the aggregate markup changes between 2008 and 2017 This approach follows two steps First the aggregate (ln) markup (μ) at year t is defined as
21 Under the NACE 2-digit wholesale trade sector the group of top decile firms are overrepresented in the following NACE 4-digit sectors sector 4690ndashNon-specialized wholesale trade sector 4673ndashWholesale of wood construction materials and sanitary equipment sector 4621ndashWholesale of grain unmanufactured tobacco seeds and animal feeds sector 4646ndashWholesale of pharmaceutical goods sector 4675ndashWholesale of chemical products and sector 4631ndashWholesale of fruit and vegetables Under the NACE 2-digit retail services sector the sample of top decile firms are overrepresented in the following NACE 4-digit sectors sector 4711ndashRetail sale in non-specialized stores with food beverages or tobacco predominating and sector 4730mdashRetail sale of automotive fuel in specialized stores 22 The same analysis is applied for ownership structure again controlling for overrepresentation Results show that the sample of top decile firms are overrepresented in the fully foreign-owned ownership category
18
120583120583119895119895119895119895 = sum sum 119904119904119895119895119894119894119895119895119894119894isinΩ119895119895 120583120583119895119895119894119894119895119895119894119894isin119896119896119895119895 (9)
where sjit is firm irsquos market share at moment t where the market share is defined in terms of firm irsquos revenue weight over the total revenue of sector j (kj) where sector j is the sector to which firm i belongs Then the change of (ln) markup between moments t and tminus1 is decomposed as
Δ120583120583119895119895119895119895 = Δ120583119878119878119895119895119895119895 + Δ119862119862119879119879119907119907119878119878120583120583119878119878119895119895119894119894119895119895 119904119904119878119878119895119895119894119894119895119895 + 119904119904119864119864119895119895119895119895120583120583119864119864119895119895119895119895 minus 120583120583119878119878119895119895119895119895 + 119904119904119883119883119895119895119895119895120583120583119878119878119895119895119895119895 minus 120583120583119883119883119895119895119895119895 (10)
where the subindex S refers to survivor firms (that is those operating in both years t and tminus1 the subindex X denotes firms exiting the market or those firms present in moment tminus1 but not in moment t and E denotes entrants or those firms operating in moment t but not in moment tminus1 Each component expressed in equation (10) represents different drivers to explain aggregate change in markup over the period The first term is the change of the
unweighted average ln markup of survivors or the ldquowithinrdquo component Likewise is the change in the covariance between ln markup and market share for
survivors only This is the ldquobetweenrdquo component and it measures the reallocation of resources among surviving firms The term is the ldquoentryrdquo component and it measures
the difference of the aggregate ln markup of entrants and that of survivors at moment t weighted by the share of entrants over the total population of firms ( ) The entry component will be
positive if the aggregate markup of those firms entering the market is larger than the aggregate markup of the survivors Finally is the exit component which measures the
difference between the aggregate ln markup of survivors and exiting firms at moment tminus1 likewise weighted by the proportion of firms exiting the market that is This term is
positive if the aggregate ln markup of the exiting firms is lower than the aggregate ln markup of survivors In other words and as displayed in equation (10) aggregate markup can growshrink because (a) incumbent firms have increaseddecreased their markups (the ldquowithinrdquo component) (b) incumbent firms with high markups have gainedlost market share (the ldquobetweenrdquo component) and (c) entrant firms have higherlower markups than exiting firms (the ldquoentryrdquo or ldquoexitrdquo component)23
Results show that the increase in aggregate markups has been driven mostly by incumbents rather than entrants and exiting firms Decomposition results for the full sample of firms are displayed in figure 6 Estimations suggest that a large proportion of the aggregate increase in markup in Romania was driven by increases within incumbent firms (the ldquowithinrdquo bar) And among incumbents results show that the rise in markups reflects mostly a markup increase within firms rather than a reallocation of market share away from low-markup to high-markup companies (the ldquobetweenrdquo bar) Meanwhile the entry of new firms with lower markups pulled the change in aggregate markups down (the ldquoentryrdquo bar) and contribution from
23 SBS tends to underestimate entry and exit (populational) figures as a result of its sampling design In this regard the proposed analysis captures entry and exit in the enumerated stratum (above 20 employees) so results will be representative at least for the population of firms in the enumerated stratum
19
exiting firms was negligible
20
Figure 6 Decomposition of percentage change of (sales-weighted) average markup 2008ndash17
Source World Bank staff calculations based on SBS data set
This result could be interpreted as a sign of consolidation of market power among existing firms enabled by remaining product market regulations that restrict competition despite previous reforms Several policy-related factors can explain this result among them government interventions and regulations that restrict competition by reinforcing dominance or limiting entry facilitating collusive outcomes or increasing the cost to compete in markets and discriminating and protecting vested interests24 In this regard Pop and Ore Monago (2020) provide illustrative examples about the presence of regulations that still restrict competition in Romania drawing from the OECDndashWorld Bank Group (WBG) product market regulation (PMR) indicators data set which provides information across 70 countries25 The assessment uses the latest PMR round for Romania from 2013 and includes Romaniarsquos performance projected on the basis of information updated in 2017 Results suggest that the regulatory framework as it is in the books in Romania is less restrictive than that of countries such as Poland and the total sample average but it is more restrictive than that of the OECD and EU-15 countries However from an economywide perspective the overall restrictiveness of regulations in Romania is mainly associated with the state control of the economy and several remaining barriers to entry and rivalry (see figure 7)
24 In principle greater competition outcomes are enabled through an effective competition policy framework which involves three key pillars (a) fostering pro-competition regulations and government interventions (b) promoting competitive neutrality and non-distortive public aid and (c) enabling effective competition law and antitrust enforcement 25 The current PMR database used for this study includes Argentina Australia Austria Belgium Bolivia Brazil Bulgaria Canada Chile China Colombia Costa Rica Croatia Cyprus the Czech Republic Denmark the Dominican Republic Ecuador Arab Republic of Egypt El Salvador Estonia Finland France Germany Greece Guatemala Honduras Hungary Iceland India Indonesia Ireland Israel Italy Jamaica Japan Kenya the Republic of Korea Kuwait Latvia Lithuania Luxembourg Malta Mexico the Netherlands New Zealand Nicaragua Norway Panama Paraguay Peru the Philippines Poland Portugal Romania the Russian Federation Rwanda Senegal the Slovak Republic Slovenia South Africa Spain Sweden Switzerland Turkey Tunisia Ukraine Uruguay the United Kingdom and the United States
21
Figure 7 Product market regulation in Romania and comparator countries
Source Pop and Ore Monago 2020 Note The top five performers in the overall PMR indicator are the Netherlands United Kingdom Austria Denmark and New Zealand Figure shows 2013 information unless otherwise indicated PMR = product market regulation
Barriers to entry and rivalry still affect some service sectors In fact there are examples of regulations that hamper competition in retail trade which concentrates a substantial proportion of high-markup firms in the Romanian economy as seen previously Drawing from the OECD-WBG PMR data set Pop and Ore Monago (2020) show that although regulations in the retail trade sector are less restrictive than in the EU-15 and OECD there is still room for improvement to make the retail trade market more efficient The authors show that licenses and permit requirements may still be imposing an unnecessary burden on entry and increasing the costs to compete in the sector Companies operating in retail sectors in Romania are subject to requirements that go beyond the general conditions formalities and procedures applicable to any company For instance in Romaniarsquos clothing industry licenses and permits are always required compared with 57 percent of OECD countries and 60 percent of EU-15 countries which do not have such a requirement26 In addition Romania has regulations that impose restrictions on entry or expansion of business activities and constrain strategic options to compete in retail markets For instance most of the PMR countries and all top five performers do not restrict firms from selling below cost (beyond a prohibition of predatory pricing) and restrictions on sales promotions are not a common practice either27 In Romania sales below cost are prohibited or restricted beyond a prohibition of predatory pricing Likewise sales promotions are restricted to a particular time of the year28
43 DO FIRM MARKUPS DIFFER ACROSS FIRMS WITH DIFFERENT ATTRIBUTES
To answer this question the analysis explores how markup performance differs across different types of firms To assess the heterogeneity in markups the analysis relates markups to firm-level characteristics such as size age ownership status RampD status and location
26 In this case the least restrictive countries such as Bulgaria Latvia and Sweden do not have such requirements 27 Among the Central and Eastern Europe comparator countries only the Czech Republic and the Slovak Republic apply restrictions on discounted sales pricing while only Poland applies constraints to sales promotions 28 Government Ordinance no 992000 prohibits sales below costs and provides for the conditions and periods when certain types of promotions can take occur
5156 51 52 47 49 53
62 55
3830 42 40 43 39
4333 41
1114
6 9 10 125 5 4
113129 133 134 141 148 156
165 169
0
05
1
15
2
25
3
0
05
1
15
2
25
3
Top 5 -PMR SlovakRepublic
Hungary EU-15average
CzechRepublic
OECDaverage
2013
Romaniasim 2017
Poland Romania
State control (SC) Barriers to entry and rivalry (BER) Barriers to trade and investment (BTI)
Avg of all countries = 190
22
within narrowly defined product markets proxied by NACE 4-digit sectors The following regression is estimated
120583120583119888119888119895119895119894119894119895119895 = 1205751205750 + sum 12057512057511198961198961198791198791199001199001198991198991198961198961198881198881198951198951198941198941198951198957119896119896=2 + sum 1205751205752119903119903119904119904119886119886119904119904119886119886119903119903119888119888119895119895119894119894119895119895
3119903119903=2 + sum 1205751205752119902119902119886119886119886119886119886119886119902119902119888119888119895119895119894119894119895119895
3119902119902=2 + 1205751205753119889119889119888119888119895119895119894119894119895119895
119864119864119864119864119864119864 +1205751205754119889119889119888119888119895119895119894119894119895119895119877119877119877119877119889119889 + 1205751205755119896119896119888119888119895119895119894119894119895119895 + 120578120578119895119895 + 120588120588119895119895 + 120574120574119888119888 + 119906119906119888119888119895119895119894119894119895119895 (11)
where ownkcjit with k = 23hellip7 comprises a set of dummies defining the type of ownership of the firm Romanian private (omitted category) majority state-owned state-private ownership Romanian private and foreign fully foreign-owned public of national and local interest and other (cooperatives and craft organizations)29 The term sizercjit is a set of three dummies controlling for firmsrsquo sizemdashsmall or fewer than 50 employees (omitted category) medium or 51ndash250 employees and large more than 250 employees The term agercjit is a set of three age dummiesmdashyoung or less than 5 years old mature or 6ndash15 years old and older than 15 years Two dichotomous variables are also defined to capture export and RampD profiles dExp and dRnd which take a value of 1 if a firmrsquos direct exports represent more than 10 percent of a firmrsquos total revenue and if a firmrsquos RampD represents more than 1 percent of a firmrsquos total revenue respectively In addition kcjit is firmsrsquo total capital stock value (sum of tangible and intangible assets)30 Finally ηt ρj and γc are respectively time NACE 4-digit sector and county fixed effects Equation (11) is estimated separately for each 1-digit sector (that is manufacturing services and mining) and for the whole economy while the equation parameters are estimated by OLS always using heteroscedasticity-robust standard errors The complete set of results is displayed in table A15 in annex 1
Results show that ownership structure matters to explain markup differences across firms State-controlled companies tend to exert the highest markup premiums in the overall economy and especially in the manufacturing sector Table 5 displays the estimated coefficients of ownership categories multiplied by 100 Except for the mining sector most of estimated coefficients are statistically significant which suggests that ownership structure makes a difference to explain markup performance even for firms operating in the same product market (here proxied by NACE 4-digit sector) county location and year and with similar characteristics in terms of size age and export and RampD profile
In particular firms in which the state has majority or minority ownership demonstrate higher markups when compared with domestic privately owned companies (see table 5 column 4) The average difference in markup is higher for companies with minority state ownership (289 percent) than for fully state-owned companies (200 percent) In manufacturing markups of fully state-owned firms are the highest on average at 527 percent when compared with the reference category (domestic privately owned firms) Results in services are mixed with both private and state ownership extracting high premiums private firms with mixed domestic-foreign ownership show the highest average difference (279 percent) closely followed by minority state-owned companies for which the markup premium
29 More details about the original ownership classification in SBS and the aggregation used for the analysis can be found in table A13 and table A14 in annex 1 30 The variable lnTFPRkit is included as an additional control to test the robustness of the analysis See results in table A16 in annex 1
23
is 275 percent compared with the reference category 31 All results are robust to the inclusion of productivity as an additional control variable (see results in table A16 in annex 1)32
Table 5 Average markup differences by ownership structure relative to domestic privately owned firms
(1) Manufacturing
()
(2) Services
()
(3) Mining
()
(4) All sectors
() Majority state-owned 527 139 772 200 State-private ownership 352 275 ns 289 Domestic private + foreign 161 279 ns 229 Fully foreign-owned 105 263 ns 201 Public of national and local interest
209 149 ns 214
Source World Bank staff calculations based on SBS data set Note Numbers reflect estimated coefficients (multiplied by 100) for ownership dummy categoriesmdashrelative to Romanian private firms the omitted categorymdashin a fixed-effect regression model controlling for firm covariates plus year and NACE 4-digit sector fixed effects as displayed in equation (11) More details about the original ownership classification in SBS and aggregation used for the analysis can be found in table A13 and table A14 in annex 1 See table A15 in annex 1 for the complete set of results ns = not statistically significant
Larger firms and older companies wield higher markups when compared with their counterparts implying that firm size and age are relevant characteristics that influence markup differences As shown in figure 8 old companies (older than 15 years) display higher average markups than young ones (1ndash5 years old) even when they share similar attributes (in terms of ownership structure size and export and RampD profiles) and operate in the same NACE 4-digit sector county and year The estimated average markup premium for old companies (relative to young ones) is 54 percent for the whole economy It varies depending on how data are clustered across large sectors 79 percent in manufacturing 48 percent in services and 228 percent in mining Higher markup premiums for older companies can be interpreted in two ways it can reflect that more experienced firms are able to transpose learning returnsmdashwhich could positively affect their productivity or reduce their marginal costsmdashinto higher markups or that older firms are able to lobby better and create barriers to entry making it more difficult for younger firms to exert competitive pressure Firm size also matters to explain markup performance large companies (with more than 250 full-time employees) tend to display higher markups compared with small companies even when they operate in the same product market and share similar characteristics On average for the whole economy the
31 Results for the category ldquootherrdquo are not shown in table 5 As detailed in table A13 in annex 1 this ldquootherrdquo category refers to SBS ownership answer-codes 40 and 50 respectively ldquocooperativerdquo and ldquopublic of national and local interestrdquo The reason the corresponding results were not highlighted in the main text are twofold First the above-mentioned category accounts for only 006 percent of total companies in the sample Second an in-depth analysis would be needed to understand whether this ldquootherrdquo category reflects potential noise in the way firms self-classify their ownership structures or the way firms report cost expenditures (mainly) or whether this was influenced by SBS sampling design 32 Because the production approach applied in the current analysis delivers both markup and productivity estimates it is possible to further decompose the markup differences across firm characteristics and to verify whether after controlling for differences in marginal costs (that is productivity) certain groups of firms still have higher markups This is precisely one of the mitigating methods employed to reduce the conflation risk as highlighted before Results in table A16 in annex 1 should be interpreted as follows once productivity level is included in the equation differences in marginal cost are accounted for so the coefficient on ldquomajority state-ownedrdquo for instance captures the variation in average prices between majority state-owned and the size reference category (domestic privately owned firms)
24
markup premium for large companies is 122 percent higher than that of small firms (figure 9) Both size and age effects are still present even after controlling for productivity differences (see table A16 in annex 1)33
Figure 8 Average markup differences relative to young firms by age category
Figure 9 Average markup differences relative to small firms by size category
Source World Bank staff calculations based on SBS data set Note Numbers reflect estimated coefficients (multiplied by 100) for age dummy categoriesmdashrelative to young firms (1ndash5 years old) the omitted categorymdashin a fixed-effect regression model controlling for firm covariates plus year county and NACE 4-digit sector fixed effects as displayed in equation (11) All bars reflect statistically significant results See table A15 in annex 1 for the complete set of results
Source World Bank staff calculations based on SBS data set Note Numbers reflect estimated coefficients (multiplied by 100) for size dummy categoriesmdashrelative to small firms (1ndash50 employees) the omitted categorymdashin a fixed-effect regression model controlling for firm covariates plus year county and NACE 4-digit sector fixed effects as displayed in equation (11) All bars reflect statistically significant results See table A15 in annex 1 for the complete set of results
By the same token export intensity also influences markup performance with firms that export earning higher markups Being an exporter is a relevant firm feature to be analyzed when it comes to understanding markup performance Recent models of international trade predict that exporting firms earn higher markups than non-exporting firms either because they are relatively more productive and can thus undercut their rivals (see Melitz and Ottaviano 2008) or because they produce higher-quality goods and rely on higher-quality inputs which allow them to charge higher prices (see Hallak and Sivadasan 2009) In this regard the results summarized in figure 10 are consistent with the literature and suggest that exporting firmsmdashdefined as those whose direct exports represent more than 10 percent of total revenuemdashearn higher markups than non-exporting firms that operate in the same product market (NACE 4-digit sector) the difference ranges from 12 percent to 416 percent depending on how data are clustered across large sectors (manufacturing services and mining)
33 See footnote 32 on how to interpret results in table A16 in annex 1 (after including productivity as an additional control)
22
-160
158
7948
228
54
-505
101520253035
d
iffer
ence
Mature (between 6 and 15 years old)
Old (older than 15)
23
-830
090
327
169122
-15-55
152535
d
iffer
ence
Medium (between 51 and 250)
Large (more than 250 employees)
25
Figure 10 Average markup differences relative to non-exporters by export status
Figure 11 Average markup differences relative to non-RampD performers by RampD status
Source World Bank staff calculations based on SBS data set Note Numbers reflect estimated coefficients (multiplied by 100) for RampD dummy categorymdashrelative to non-RampD performer firms the omitted categorymdashin a fixed-effect regression model controlling for firm covariates plus year county and NACE 4-digit sector fixed effects as displayed in equation (11) All bars reflect statistically significant results See table A15 in annex 1 for the complete set of results
Source World Bank staff calculations based on SBS data set Note Numbers reflect estimated coefficients (multiplied by 100) for export dummy categorymdashrelative to non-exporters the omitted categorymdashin a fixed-effect regression model controlling for firm covariates plus year county and NACE 4-digit sector fixed effects as displayed in equation (11) All bars reflect statistically significant results See table A15 in annex 1 for the complete set of results
Performing RampD activities is positively correlated with markup differences while location proxied by county also matters to explain markup performance Results displayed in figure 11 show that RampD performersmdashidentified by those firms whose RampD expenses surpass more than 1 percent of their total revenuemdashtend to earn higher markups than non-RampD performers The markup premium for RampD performers is always positive suggesting that this group of firms is able to recoup fixed costs associated with RampD activities The magnitude of the premium varies from 16 percent to 46 percent depending how data are clustered across large sectors (manufacturing services and mining) In addition results displayed in figure 12 show that firms in the same product market (at NACE 4-digit level) and with similar characteristics (in terms of ownership age size and export and RampD profiles) charge different markups depending on the county in which they operate Except for Dolj firms in all other counties demonstrate lower average markups than Bucharest the negative markup premium in relation to Bucharest varies from minus154 percent (Vrancea) to minus36 percent (Satu-Mare)
12
258
416
119
05
101520253035404550
d
iffer
ence
160
340
460
273
05
101520253035404550
d
iffer
ence
26
Figure 12 Average markup differences by county relative to Bucharest
Source World Bank staff calculations based on SBS data set Note Numbers reflect estimated coefficients (multiplied by 100) for county fixed effectsmdashrelative to Bucharest the omitted categorymdashin a fixed-effect regression model controlling for firm covariates plus year and NACE 4-digit sector fixed effects as displayed in equation (11) All bars reflect statistically significant results See table A15 in annex 1 for the complete set of results
A variance decomposition analysis suggests that ownership is the most relevant characteristic to explain total variance of markup performance across firms in Romania followed by capital intensity and export status Drawing from estimations of equation (11) it is possible to evaluate the relative importance of each variable to explain the variance of the markup Letting dExp represent any of the explanatory variables of equation (11) the contribution to the variance of the markup of that variable can be defined as
119862119862119879119879119899119899119886119886119889119889119864119864119864119864119864119864 = 12057512057532119881119881119886119886119903119903119889119889119864119864119864119864119864119864+21205751205753119872119872119862119862119862119862(119889119889119864119864119864119864119864119864120583120583minus1205751205753119889119889119864119864119864119864119864119864)119881119881119886119886119903119903(120583120583)
(12)
or as the variance of the variable plus 2 times the covariance of the variable with the part of the markup not explained by that variable A similar expression can be derived for any of the remaining explanatory variables The relative contribution of each variable is computed after discounting the residuals sector and year contributions Results are displayed in figure 13 Ownership structure is shown to be the most relevant feature to explain the variance of markup performance across firms it accounts for 347 percent of the explained variance of markup performance (after removing NACE 4-digit sector and year contributions) The second most important characteristic is capital intensity corresponding to 214 percent of the variance of the markup performance Export status accounts for the third largest share in explained variance 113 percent
d
iffer
ence
27
Figure 13 Contribution by each firm characteristic to explain total variance of markup performance across firms
Source World Bank staff calculations based on SBS data set Note The pie chart reflects markup variance decomposition results It decomposes the variance of markup performance across firms after removing the proportion accounted for by omitted factors NACE 4-digit sector and year contributions
44 WHAT WOULD BE THE PRODUCTIVITY DIVIDENDS FROM MARKUP REDUCTION
While it became evident that aggregate market power in Romania has been rising it is important to analyze its consequences for economic growth An indirect way to measure this is to estimate the productivity dividends that would come from markup reduction The association between markup and productivity can be positive or negative depending on the nature of competition in the specific marketssectors As shown by Autor et al (2017) and Van Reenen (2018) there are marketsmdashsuch as high-tech sectors or knowledge-intensive onesmdashwhere the nature of competition tends to emphasize the importance of network effects economies of scale and scope and intangible assets so the most productive and dynamic firms exert higher markups and obtain larger market shares On the other hand in certain markets where recouping fixed costs (such as RampD) because of higher-risk investments is not that relevant high-markup firms are not necessarily more productive and efficient Another way to look at this contrast is through the inverted-U relationship of innovation and competition to an increase in productivity as explored by Aghion et al (2005) According to this view stronger competition (proxied here by smaller markups) encourages neck-and-neck firms to innovatemdashthe ldquoescape competitionrdquo effectmdashand therefore to increase productivity growth At the same time this view discourages laggard firms from innovating (the Schumpeterian effect) therefore reducing productivity growth The combination of the two effectsmdashescaping competition and discouraging innovationmdashexplains the inverted-U relationship of competition and innovation with productivity growth
To assess the correlation between productivity growth and markups in Romania the analysis uses firm-level estimations of TFPR and markups obtained so far Thus it estimates the specification presented in Aghion Braun and Fedderke (2008) as follows
Δ119889119889119899119899119879119879119897119897119897119897119877119877119888119888119895119895119894119894119895119895 = 1206011206010 + 1206011206011120583120583119888119888119895119895119894119894119895119895 + 120578120578119895119895 + 120588120588119895119895 + 120574120574119888119888 + 120592120592119888119888119895119895119894119894119895119895 (13)
where the left-hand-side variable represents TFPR growth of firm i in NACE 4-digit sector j in year t 120583120583119894119894119895119895119895119895minus1 is the lagged value of firm irsquos markup in sector j in year t ηt ρj and γc are
214
113
79
47
347
64
136
capital intensity Export status RampD status age ownership size region
28
respectively time NACE 4-digit sector and county fixed effects Equation (13) is estimated separately for each 1-digit sector (that is manufacturing services and mining) and for the whole economy while the equation parameters are estimated by OLS always using heteroscedasticity-robust standard errors
Figure 14 Productivity (TFPR) growth dividends from a 10 percent reduction of average markup by sector
Source World Bank staff calculations based on SBS data set Note Results from year county and 4-digit sector fixed effects Coefficient for mining was not statistically significant
Results shows that on average reducing markups would have a positive impact on aggregate productivity expansion Results displayed in table A18 in annex 1 suggest that lower (past) markups are associated with higher (current) productivity growth all coefficients for lagged markups are negative and statistically significant at conventional values for all sectors except mining Overall this negative correlation between past markup level and productivity growth is an indication of a positive association between competition and productivity growth which would be driven by the escape competition effect described by Aghion et al (2008)34
The magnitude of the economic effect of markup reduction on productivity growth is sizable Figure 14 shows that a 10 percent decrease in the average markup of 61 percent for the overall economy in the 2008ndash17 period would imply an increase in productivity (TFPR) growth of 082 percentage point per year The economic effect for the manufacturing sector would be substantially higher reducing the average markup of 403 percent for manufacturing in the same period would imply an increase in TFPR growth of 147 percentage points per year
Further productivity dividends stemming from markup reduction vary substantially across NACE 4-digit sectors The same specification expressed in equation (9) is estimated for each NACE 4-digit sector separately controlling for year and county fixed effects The TFPR growth dividends from markup reduction are computed for each NACE 4-digit sector drawing from the estimated coefficients (see table A18 in annex 1) Results vary substantially
34 An extended specificationmdashwhere the squared value of lagged markup is included as an additional dependent variablemdashwas also estimated The estimated coefficient of the squared term was not statistically significant (see results in table A17 in annex 1)
147
048
082
0
02
04
06
08
1
12
14
16
Manufacturing Services All
Perc
enta
ge p
oint
s per
yea
r
29
across sectors among those 4-digit sectors where the estimated coefficients are statistically significant the productivity growth dividends of a 10 percent decrease in markup vary from 701 percentage points to 016 percentage points respectively for NACE sector 1041ndashManufacture of oil and fats and sector 4649ndashWholesale of other household goods (figure 15)35 Productivity dividends from a potential markup reduction are also positive in sectors where the top decile firms in the markup distribution are overly represented for instance in sector 4711ndashRetail sale in non-specialized stores with food beverages or tobacco predominating a 10 percent decrease of average markup would be associated with an increase in TFPR growth of 022 percentage points per year For sector 4690ndashNon-specialized wholesale trade and sector 4673ndashWholesale of wood construction materials and sanitary equipment the productivity dividends would be 018 and 021 percentage points respectively
Figure 15 Productivity (TFPR) growth dividends from a 10 percent reduction of average markup Results by NACE 4-digit sector
Source World Bank staff calculations based on SBS data set
35 There are however some sectors where markup reduction brings detrimental impacts to productivity expansion See complete set of results in table A18in annex 1 for instance in NACE sector 8010ndashPrivate security activities and sector 2432ndashPrecious metals production where a reduction of average markup in the 2008ndash17 period would imply a decrease of TFPR growth of 030 percentage points and 663 percentage points respectively Following Aghion Braun and Fedderke (2008) the Schumpeterian effect of product market competition would be the underlying driver behind this result in these sectors competition reduces innovation incentives and therefore productivity growth by reducing the rents from innovations of firms below the technological frontier
00
10
20
30
40
50
60
70
80
Perc
enta
ge p
oint
s per
yea
r
30
5 CONCLUSIONS
A stylized fact emerging in the recent empirical literature is the increase in average levels of market power across countries in both developed and emerging economies This paper aims to bring new evidence about the evolution of corporate market power in Romania and the implications for competition dynamics It uses markups as a proxy for market power and explores firm-level heterogeneity to identify the underlying drivers of aggregate trends The paper applies the production approachmdashfollowing De Loecker and Warzynski (2012) De Loecker and Eeckhout (2018) and De Loecker Eeckhout and Unger (2020)mdashto estimate markup at the firm-year level for Romania The Romanian Structural Business Survey data set is used to apply this methodology
Results show that the aggregate markup in Romania increased by around 15 percent between 2008 and 2017 However this aggregate performance masks a lot of heterogeneity the first being heterogeneity of markups across the main sectors While in manufacturing (sales-weighted) average markups experienced a declining pattern of minus57 percent during 2008ndash17 there was an opposite and much more rapid trend in services with an aggregate change of 422 percent
Second at the firm level results suggest that a key driving force behind this aggregate trend was the ability of the top decile of firms in the markup distribution to increase their markups This increase has been faster than for the rest of the firms Firms in the 90th percentile of the markup distribution increased their (sales-weighted) average markup by 285 percent between 2008 and 2017 while the rest of firms (that is those below the top decile firms) experienced a completely opposite trend their weighted markup contracted by 83 percent over the same period
This sample of top decile firms does not seem to follow the typical superstar firmsrsquo profile which suggests that the increase in markups in Romania might be associated with an environment that is less conducive to competition The top decile firms in the markup distribution are 468 percent smaller 910 percent less productive and 33 percent less likely to invest in intangible assets than the rest of the firms in the markup distribution and they are overrepresented in less knowledge-intensive service sectors Therefore they do not seem to follow the typical superstar firmsrsquo profile (typically larger more productive and more likely to invest in intangible assets) This suggests that the increase in markups in Romania might be more due to relatively weak competition rather than to changes in the nature of competition where superstar firms (usually more efficient and innovative) are rewarded with greater market share In fact a decomposition exercise shows that the increase in aggregate markups has been driven mostly by incumbents rather than by new entrants and exiting firms These results could be interpreted as a sign of consolidation of market power among existing firms Several policy-related factors could explain this result among them government interventions and regulations that restrict competition by reinforcing dominance or limiting entry facilitating collusive outcomes or increasing the cost to compete in markets and by discriminating and protecting vested interests In this regard illustrative evidence provided by Pop and Ore Monago (2020) shows that despite reforms regulations that restrict entry and rivalry are still present in the retail trade sector which concentrates a substantial proportion of high-markup firms in the Romanian economy
31
Results also show that certain firm characteristics matter in explaining differences in markup performance size age RampD profile export propensity location and notably ownership State-controlled companies tend to demonstrate the highest markup premiums when compared with domestic privately owned companies 289 percent higher for minority state-owned companies and 20 percent higher for fully state-owned companies Old companies (older than 15 years) display 54 percent higher markups on average than young ones no matter the product market (at NACE 4-digit level) where they operate The markup premium for large companies (with more than 250 full-time employees) is 122 percent higher than that of small firms in the overall economy Exporting firmsmdashthose whose direct exports represent more than 10 percent of total revenuemdashearn 119 percent higher markups than non-exporting firms that operate in the same sector At the same time results show that the markup premium for RampD performers (compared with non-RampD performers) is 273 percent for the whole economy and that firms operating in the same product market charge different markups depending on the county where they operate Overall while all these features matter to explain markup performance a variance decomposition analysis suggests that ownership is the most relevant characteristic to explain total variance of markup performance across firms in Romania
In this context given that ownership assumes a prominent role to explain markup performance it is important to ensure competitively neutral policies across markets where private and public enterprises compete The prominent role of ownership in explaining total variance of markup performance across firms combined with the evidence that state-controlled companies tend to exert the highest markup premiums in the overall economy highlights the importance of ensuring competitive neutrality in Romania so that private and public enterprises compete on a fair basis Analysis presented in Pop and Ore Monago (2020) shows that state-owned enterprises (SOEs) in Romania compete on uneven terms with the private sector because of gaps in terms of both the current regulatory framework as well as its implementation As for the regulatory framework itself lack of competitive neutrality emerges from restrictive SOE governance rules and the exemption of newly setup SOEs from the corporate governance law lack of rules mandating the separation of commercial and noncommercial functions despite legal separation (for example in the railway and energy sectors) and the lack of specific provisions that require SOE investments to show positive rates of returns With regard to implementation of the regulatory framework competitive neutrality gaps stem from (a) the protracted application of corporate governance rules (b) fragmentation of SOE oversight across institutions with frequent overlaps (c) inconsistent reporting of SOE performance that prevents full monitoring and comparability with the private sector performance in comparable situations (d) little clarity in terms of compensation for public service obligations and (e) lack of transparency in state aid allocation
Finally the analysis shows that productivity dividends arise from increased competition in Romania As such lowering markups can boost productivity growth A 10 percent decrease in the average markup for the overall economy during 2008ndash17 would imply an increase in productivity (TFPR) growth of 082 percentage point per year The effect for the manufacturing sector is higher (147 percentage points per year) but lower for services (048 percentage point per year) The ldquoescape competitionrdquo effect described by Aghion Braun and Fedderke (2008)mdashthrough which fiercer competition induces firms to innovate to escape competition with the fringe therefore increasing productivity growthmdashwould be the underlying driver behind these average results for the manufacturing industry Results vary substantially across sectors among
32
those 4-digit sectors where the estimated coefficients are statistically significant the productivity growth dividend of a 10 percent decrease in markup varies from 701 percentage points (sector 1041ndashManufacture of oil and fats) to 016 percentage point (sector 4649ndashWholesale of other household goods)
In this context boosting competition becomes a key part of the engine to drive productivity growth and help consolidate Romaniarsquos convergence to a high-income level Implementing pro-competition policies is instrumental Besides removing anticompetitive regulations and promoting competitive neutrality policy makers should ensure that state aid is allocated in a non-distortive way and enable more effective competition law and antitrust enforcement
33
REFERENCES
Ackerberg D K Caves and G Frazer 2015 ldquoIdentification Properties of Recent Production Function Estimatorsrdquo Econometrica 83 (6) 2411ndash51
Aghion P N Bloom R Blundell R Griffith and P Howitt 2005 ldquoCompetition and Innovation An Inverted-U Relationshiprdquo Quarterly Journal of Economics 120 (2) 701minus28
Aghion P M Braun and J Fedderke 2008 ldquoCompetition and Productivity Growth in South Africardquo Economics of Transition 16 (4) 741ndash68
Autor D D Dorn F Lawrence C Patterson and J Van Reenen 2017 ldquoThe Fall of the Labor Share and the Rise of Superstar Firmsrdquo NBER Working Paper 23396 National Bureau of Economic Research Cambridge MA
Barkai S 2020 ldquoDeclining Labor and Capital Sharesrdquo Journal of Finance 75 (5) 2421ndash63
Bartelsman E J and M Doms 2000 ldquoUnderstanding Productivity Lessons from Longitudinal Microdatardquo Journal of Economic Literature 38 (3) 569ndash94
Berry S J Levinsohn and A Pakes 1995 ldquoAutomobile Prices in Market Equilibriumrdquo Econometrica Journal of the Econometric Society 63 (4) 841ndash90
Berry S J Levinsohn and A Pakes 2004 ldquoDifferentiated Products Demand Systems from a Combination of Micro and Macro Data The New Car Marketrdquo Journal of Political Economy 112 (1) 68ndash105
Bessen J 2017 ldquoInformation Technology and Industry Concentrationrdquo Law and Economics Paper No 17-41 Boston University School of Law Boston
Bond S A Hashemi G Kaplan and P Zoch 2020 ldquoSome Unpleasant Markup Arithmetic Production Function Elasticities and their Estimation from Production Datardquo NBER Working Paper No 27002 National Bureau of Economic Research Cambridge MA
Bresnahan T F 1989 ldquoEmpirical Studies of Industries with Market Powerrdquo In Handbook of Industrial Organization Vol 2 edited by R Schmalensee and R Willig 1011ndash57 Amsterdam Elsevier
Cameron A C and P K Trivedi 2010 Microeconometrics Using Stata (Rev ed) College Station TX Stata Press
Crouzet N and J Eberly 2018 ldquoUnderstanding Weak Capital Investment The Role of Market Concentration and Intangiblesrdquo NBER Working Paper 25869 National Bureau of Economic Research Cambridge MA De Loecker J 2011 ldquoRecovering Markups from Production Datardquo International Journal of Industrial Organization 29 (3) 350ndash55
De Loecker J 2013 ldquoDetecting Learning by Exportingrdquo American Economic Journal Microeconomics 5 (3) 1ndash21
De Loecker J and J Eeckhout 2018 ldquoGlobal Market Powerrdquo NBER Working Paper 24768 National Bureau of Economic Research Cambridge MA
De Loecker J J Eeckhout and G Unger 2020 ldquoThe Rise of Market Power and the Macroeconomic Implicationsrdquo Quarterly Journal of Economics 135 (2) 561ndash644 httpsdoiorg101093qjeqjz041
34
De Loecker J and F Warzynski 2012 ldquoMark-ups and Firm-Level Export Statusrdquo American Economic Review 102 (6) 2437ndash71
Diacuteez F D Leigh and S Tambunlertchai 2018 ldquoGlobal Market Power and Its Macroeconomic Implicationsrdquo IMF Working Paper 18137 International Monetary Fund Washington DC
Grullon G Y Larkin and R Michaely 2018 ldquoAre US Industries Becoming More Concentratedrdquo Swiss Finance Institute Research Paper No 19-41 httpdxdoiorg102139ssrn2612047
Gutieacuterrez G and T Philippon 2017a ldquoDeclining Competition and Investment in the USrdquo NBER Working Paper 23583 National Bureau of Economic Research Cambridge MA Gutieacuterrez G and T Philippon 2017b ldquoInvestment-less Growth An Empirical Investigationrdquo Brookings Papers on Economic Activity (Fall) 89ndash182 Gutieacuterrez G and T Philippon 2018 ldquoHow EU Markets Became More Competitive than US Markets A Study of Institutional Driftrdquo NBER Working Paper 24700 National Bureau of Economic Research Cambridge MA
Hall R 1988 ldquoThe Relation between Price and Marginal Cost in US Industryrdquo Journal of Political Economy 96 (5) 921ndash47
Hallak J and J Sivadasan 2009 ldquoExporting Behavior under Quality Constraintsrdquo NBER Working Paper 14928 National Bureau of Economic Research Cambridge MA
IMF (International Monetary Fund) 2019 World Economic Outlook April 2019 Growth Slowdown Precarious Recovery Washington DC International Monetary Fund
Koujianou Goldberg P and R Hellerstein 2012 A Structural Approach to Identifying the Sources of Local Currency Price Stability Review of Economic Studies 80 (1) 175ndash210
Melitz M J and G Ottaviano 2008 ldquoMarket Size Trade and Productivityrdquo Review of Economic Studies 75 (1) 295ndash316
Melitz M J and S Polanec 2015 ldquoDynamic Olley-Pakes Productivity Decomposition with Entry and Exitrdquo RAND Journal of Economics 46 (2) 362ndash75
Motta M 2004 Competition Policy Theory and Practice Cambridge MA Cambridge University Press
Pop G and T Ore Monago 2020 ldquoCompetition and Government Interventions in Romania An Assessment with Focus on Product Market Regulations and Competitive Neutralityrdquo Background paper for Markets and People Romania Country Economic Memorandum International Development in Focus World Bank Washington DC
Shapiro C 2018 ldquoAntitrust in a Time of Populismrdquo International Journal of Industrial Organization 61 714ndash48
Syverson C 2004 ldquoProduct Substitutability and Productivity Dispersionrdquo Review of Economics and Statistics 86 (2) 534ndash50
Van Reenen J 2018 ldquoIncreasing Differences between Firms Market Power and the Macroeconomyrdquo CEPR Discussion Paper 1576 Center for Economic and Policy Research Washington DC
35
World Bank 2020a ldquoMarkets and People Romania Country Economic Memorandumrdquo International Development in Focus World Bank Washington DC
World Bank 2020b ldquoAssessing the Direct and Indirect Impact of State Aid in Romania An Ex-post Evaluationrdquo World Bank Washington DC
36
ANNEX 1 ADDITIONAL FIGURES AND TABLES
Figure A11 Evolution of (sales-weighted) average markup in manufacturing sector by technology intensity 2008ndash17
Source World Bank staff calculations based on SBS data set
Table A11 Manufacturing industry groups by technology intensity Eurostat classification
85
99
51
Mar
k-up i
ndex
(200
8 = 1
)
2008 2009 2010 2011 2012 2013 2014 2015 2016 2017Year
Manuf High-tech
37
Source Eurostat Indicators on High-Tech Industry and KnowledgendashIntensive Services annex 3 httpseceuropaeueurostatcachemetadataAnnexeshtec_esms_an3pdf
38
Figure A12 Evolution of (sales-weighted) average markup in services sector by knowledge intensity
39
Table A12 Services groups by knowledge intensity Eurostat classification
40
Source Eurostat Indicators on High-Tech Industry and KnowledgendashIntensive Services annex 3 httpseceuropaeueurostatcachemetadataAnnexeshtec_esms_an3pdf
41
Table A13 Original ownership classification from SBS SBS Code Description
10 Fully state-owned Majority state-owned (statepublic capital gt 50 of equity)
21 State + Romanian private 22 State + foreign 23 State + Romanian private + foreign
Majority privately owned (private capital ge 50 of equity) 26 State + Romanian private 27 State + foreign 28 State + Romanian private + foreign
Fully privately owned 31 Romanian private 32 Romanian private + foreign 40 Cooperative 50 Craft organizations 60 Fully foreign-owned 70 Public of national and local interest
Source World Bank staff calculations based on SBS data set
Table A14 Ownership classification adopted in the analysis SBS codes (combined) Description
10 21 22 23 State owned (fully + majority state-owned) 26 27 28 Private-public (majority private)
31 Fully private (domestic) 32 Fully private (domestic + foreign) 60 Fully private (fully foreign) 70 Public of national and local interest
40 50 Other Source World Bank staff calculations based on SBS data set
Table A15 Conditional correlations between firm characteristics and markup performance regression results
Variable Manufacturing Services Mining All Capital stock (ln) minus0150 minus0039 minus0067 minus0066 Export dummy 0120 0258 0416 0119 RampD dummy 0160 0340 0460 0273 Mature 0022 minus0016 0158 minus0005 Old 0079 0048 0228 0054 Majority state-owned 0527 0139 0772 0200 State-private ownership 0352 0275 0111 0289 Romanian private + foreign 0161 0279 0096 0229 Fully foreign-owned 0105 0263 0 0201 Public of national and local interest 0209 0149 (omitted) 0214 Other 0884 0555 (omitted) 0758 Medium 0230 minus0083 0011 0009 Large 0327 0169 minus0015 0122 1 Alba 0106 minus0087 minus0151 minus0042 2 Arad 0038 minus0090 minus0148 minus0077 3 Arges minus0005 minus0053 minus0195 minus0060
42
Variable Manufacturing Services Mining All 4 Bacau 0092 minus0090 minus0194 minus0055 5 Bihor 0036 minus0115 minus0256 minus0088 6 Bistrita-Nasaud minus0064 minus0156 minus0069 minus0144 7 Botosani 0046 minus0089 minus0438 minus0076 8 Brasov 0041 minus0047 0049 minus0040 9 Braila 0133 minus0055 minus0265 minus0025 10 Buzau 0017 minus0123 minus0025 minus0100 11 Caras-Severin 0035 minus0187 minus0005 minus0139 12 Cluj minus0004 minus0094 minus0119 minus0088 13 Constanta 0057 minus0105 0062 minus0088 14 Covasna 0038 minus0056 minus0151 minus0052 15 Dambovita 0005 minus0183 minus0154 minus0144 16 Dolj 0195 0060 minus0042 0079 17 Galati 0106 minus0007 minus0276 0004 18 Gorj 0084 0028 minus0116 0026 19 Harghita 0101 minus0102 minus0007 minus0045 20 Hunedoara 0167 minus0031 minus0057 0011 21 Ialomita 0138 minus0049 minus0265 minus0027 22 Iasi minus0014 minus0038 minus0384 minus0058 23 Ilfov 0011 0009 0314 0010 24 Maramures 0094 minus0020 minus0042 0 25 Mehedinti 0113 minus0136 minus0720 minus0096 26 Mures 0048 minus0063 minus0093 minus0048 27 Neamt 0001 minus0108 minus0428 minus0102 28 Olt 0073 minus0005 minus0397 minus0011 29 Prahova 0018 minus0034 minus0028 minus0043 30 Satu-Mare 0033 minus0024 minus0056 minus0036 31 Salaj 0075 minus0045 minus0448 minus0031 32 Sibiu 0044 minus0038 minus0154 minus0041 33 Suceava 0044 minus0087 minus0111 minus0074 34 Teleorman 0103 minus0099 minus0299 minus0062 35 Timis 0030 minus0020 minus0341 minus0037 36 Tulcea 0142 minus0149 0096 minus0078 37 Vaslui 0091 minus0017 minus0105 minus0007 38 Valcea 0078 minus0008 minus0122 minus0002 39 Vrancea minus0061 minus0163 minus0608 minus0154 51 Calarasi 0080 minus0122 0672 minus0075 52 Giurgiu 0052 minus0064 minus0334 minus0066
_cons 2147 1150 2291 2246 NACE 4-digit fixed effects Yes Yes Yes Yes
Year fixed effects Yes Yes Yes Yes
R2 0345 0235 0254 0279 Source World Bank staff calculations based on SBS data set Note Dependent variable = ln(markup) denotes significance level at 1 percent at 5 percent and at 10 percent
43
44
Table A16 Conditional correlations between firm characteristics (including productivity) and markup performance regression results
Variable Manufacturing Services Mining All Capital stock (ln) minus0149 minus0038 minus0065 minus0066 Export dummy 0116 0257 0400 0118 RampD dummy 0182 0366 0449 0295 Mature 0021 minus0014 0164 minus0003 Old 0079 0052 0228 0057 Majority state-owned 0529 0147 0758 0209 State-private ownership 0351 0274 0118 0288 Romanian private + foreign 0156 0275 0090 0225 Fully foreign-owned 0096 0254 minus0011 0192 Public of national and local interest 0179 0165 (omitted) 0233 Other 0879 0561 (omitted) 0759 Medium 0232 minus0083 0002 0010 Large 0327 0170 minus0016 0122
Productivity (TFPR) 0051 0020 0041 0024 1 Alba 0114 minus0081 minus0156 minus0035 2 Arad 0045 minus0085 minus0135 minus0071 3 Arges 0001 minus0049 minus0196 minus0056 4 Bacau 0098 minus0084 minus0188 minus0049 5 Bihor 0042 minus0111 minus0268 minus0083 6 Bistrita-Nasaud minus0057 minus0150 minus0055 minus0137 7 Botosani 0053 minus0082 minus0443 minus0069 8 Brasov 0045 minus0042 0033 minus0035 9 Braila 0139 minus0048 minus0243 minus0018 10 Buzau 0022 minus0118 minus0002 minus0094 11 Caras-Severin 0042 minus0178 minus0001 minus0131 12 Cluj minus0001 minus0089 minus0120 minus0083 13 Constanta 0067 minus0101 0056 minus0084 14 Covasna 0045 minus0050 minus0166 minus0046 15 Dambovita 0010 minus0180 minus0162 minus0140 16 Dolj 0202 0068 minus0054 0087 17 Galati 0114 minus0001 minus0289 0010 18 Gorj 0091 0037 minus0118 0035 19 Harghita 0108 minus0096 minus0005 minus0039 20 Hunedoara 0173 minus0025 minus0055 0018 21 Ialomita 0144 minus0045 minus0256 minus0023 22 Iasi minus0005 minus0034 minus0394 minus0053 23 Ilfov 0013 0012 0296 0013 24 Maramures 0101 minus0013 minus0038 0007 25 Mehedinti 0128 minus0132 minus0729 minus0090 26 Mures 0053 minus0057 minus0105 minus0042 27 Neamt 0010 minus0101 minus0434 minus0094
45
Variable Manufacturing Services Mining All 28 Olt 0082 0002 minus0402 minus0004 29 Prahova 0023 minus0029 minus0032 minus0039 30 Satu-Mare 0038 minus0018 minus0047 minus0030 31 Salaj 0081 minus0039 minus0433 minus0025 32 Sibiu 0044 minus0034 minus0147 minus0038 33 Suceava 0051 minus0081 minus0105 minus0068 34 Teleorman 0117 minus0092 minus0296 minus0053 35 Timis 0033 minus0014 minus0340 minus0032 36 Tulcea 0147 minus0142 0078 minus0072 37 Vaslui 0101 minus0011 minus0104 0 38 Valcea 0087 minus0002 minus0120 0004 39 Vrancea minus0053 minus0158 minus0602 minus0148 51 Calarasi 0086 minus0118 0673 minus0071 52 Giurgiu 0059 minus0060 minus0334 minus0061
_cons 1632 0993 1934 2036 NACE 4-digit fixed effects Yes Yes Yes Yes
Year fixed effects Yes Yes Yes Yes
R2 0347 0235 0255 0280 Source World Bank staff calculations based on SBS data set Note Dependent variable = ln(markup) denotes significance level at 1 percent at 5 percent and at 10 percent
Table A17 Productivity growth and markup performance regression results
All Manufacturing Services Mining
Lag markup minus0025 minus0028 minus0026 minus0027 minus0025 minus0027 minus0012 minus0024
Lag markup squared 0001 0000 0001 0003 NACE 4-digit sector fixed effects Yes Yes Yes Yes Yes Yes Yes Yes County fixed effects Yes Yes Yes Yes Yes Yes Yes Yes Year fixed effects Yes Yes Yes Yes Yes Yes Yes Yes
Observations 245525 245525 76694 76694 167120 167120 1711 1711 Source World Bank staff calculations based on SBS data set Note Dependent variable = TFPR growth denotes significance level at 1 percent at 5 percent and at 10 percent
46
Table A18 Productivity (TFPR) growth dividends from a 10 reduction of average markup results by NACE 4-digit sector
NACE 4-digit sector Gain in TFPR growth per
year (percentage points)
1041ndashManufacture of oils and fats 7015 4331ndashPlastering 5547 2060ndashManufacture of man-made fibers 5286 2824ndashManufacture of power-driven hand tools 4869 1072ndashManufacture of rusks and biscuits manufacture of preserved pastry goods and cakes
4145
1104ndashManufacture of other non-distilled fermented beverages 3984 1723ndashManufacture of paper stationery 3716 2812ndashManufacture of fluid power equipment 3566 2452ndashCasting of steel 3278 1101ndashDistilling rectifying and blending of spirits 3134 1420ndashRaising of other cattle and buffaloes 3072 2011ndashManufacture of industrial gases 3033 2593ndashManufacture of wire products chain and springs 2689 2829ndashManufacture of other general-purpose machinery nec 2641 4910ndashPassenger rail transport interurban 2629 2451ndashCasting of iron 2615 3821ndashTreatment and disposal of non-hazardous waste 2375 2059ndashManufacture of other chemical products nec 2336 2920ndashManufacture of bodies (coachwork) for motor vehicles manufacture of trailers and semi-trailers
2270
1051ndashOperation of dairies and cheese making 2224 3313ndashRepair of electronic and optical equipment 2160 1081ndashManufacture of sugar 2158 1073ndashManufacture of macaroni noodles couscous and similar farinaceous products 2081 4213ndashConstruction of bridges and tunnels 2077 2223ndashManufacture of buildersrsquo ware of plastic 2011 2550ndashForging pressing stamping and roll-forming of metal powder metallurgy 1949 2313ndashManufacture of hollow glass 1926 2825ndashManufacture of non-domestic cooling and ventilation equipment 1889 2020ndashManufacture of pesticides and other agrochemical products 1818 2571ndashManufacture of cutlery 1758 5914ndashMotion picture projection activities 1691 5920ndashSound recording and music publishing activities 1665 3514ndashTrade of electricity 1653 1310ndashPreparation and spinning of textile fibers 1616 4920ndashFreight rail transport 1613 4339ndashOther building completion and finishing 1586 2620ndashManufacture of computers and peripheral equipment 1543 4311ndashDemolition 1515 3832ndashRecovery of sorted materials 1404 3523ndashTrade of gas through mains 1382 2410ndashManufacture of basic iron and steel and of ferro-alloys 1353 2399ndashManufacture of other non-metallic mineral products nec 1272 2017ndashManufacture of synthetic rubber in primary forms 1258 7711ndashRental and leasing of cars and light motor vehicles 1256 4212ndashConstruction of railways and underground railways 1128 2453ndashCasting of light metals 1080 7410ndashSpecialized design activities 1068 5630ndashBeverage serving activities 1065 4211ndashConstruction of roads and motorways 0989 4677ndashWholesale of waste and scrap 0926 4676ndashWholesale of other intermediate products 0917 4120ndashConstruction of residential and non-residential buildings 0912 4623ndashWholesale of live animals 0890 6820ndashRental and operating of own or leased real estate 0826 4110ndashDevelopment of building projects 0824
47
NACE 4-digit sector Gain in TFPR growth per year
(percentage points) 4613ndashAgents involved in the sale of timber and building materials 0823 4322ndashPlumbing heat and air-conditioning installation 0731 5629ndashOther food service activities 0699 4791ndashRetail sale via mail order houses or via internet 0659 4941ndashFreight transport by road 0659 4618ndashAgents specialized in the sale of other particular products 0646 7219ndashOther research and experimental development on natural sciences and engineering 0623 4617ndashAgents involved in the sale of food beverages and tobacco 0609 5510ndashHotels and similar accommodation 0560 4615ndashAgents involved in the sale of furniture household goods hardware and ironmongery
0541
4633ndashWholesale of dairy products eggs and edible oils and fats 0540 4778ndashOther retail sale of new goods in specialized stores 0527 4621ndashWholesale of grain unmanufactured tobacco seeds and animal feeds 0517 4662ndashWholesale of machine tools 0501 6110ndashWired telecommunications activities 0491 4634ndashWholesale of beverages 0468 5610ndashRestaurants and mobile food service activities 0463 4631ndashWholesale of fruit and vegetables 0426 4532ndashRetail trade of motor vehicle parts and accessories 0394 1411ndashManufacture of leather clothes 0390 4511ndashSale of cars and light motor vehicles 0382 4637ndashWholesale of coffee tea cocoa and spices 0361 4645ndashWholesale of perfume and cosmetics 0354 1419ndashManufacture of other wearing apparel and accessories 0344 4643ndashWholesale of electrical household appliances 0335 4639ndashNon-specialized wholesale of food beverages and tobacco 0285 4619ndashAgents involved in the sale of a variety of goods 0281 4675ndashWholesale of chemical products 0249 4711ndashRetail sale in non-specialized stores with food beverages or tobacco predominating 0223 4673ndashWholesale of wood construction materials and sanitary equipment 0214 4690ndashNon-specialized wholesale trade 0188 4649ndashWholesale of other household goods 0158 8010ndashPrivate security activities minus0300 8220ndashActivities of call centres minus0323 2572ndashManufacture of locks and hinges minus0503 7120ndashTechnical testing and analysis minus0511 3315ndashRepair and maintenance of ships and boats minus0512 3600ndashWater collection treatment and supply minus0547 4754ndashRetail sale of electrical household appliances in specialized stores minus0627 2341ndashManufacture of ceramic household and ornamental articles minus0646 7111ndashArchitectural activities minus0649 6120ndashWireless telecommunications activities minus0746 7312ndashMedia representation minus1023 4334ndashPainting and glazing minus1200 5020ndashSea and coastal freight water transport minus1276 1052ndashManufacture of ice cream minus1367 5911ndashMotion picture video and television programme production activities minus1439 2592ndashManufacture of light metal packaging minus1619 2752ndashManufacture of non-electric domestic appliances minus1729 2521ndashManufacture of central heating radiators and boilers minus1843 4932ndashTaxi operation minus2568 2013ndashManufacture of other inorganic basic chemicals minus3524 1711ndashManufacture of pulp minus3631 4942ndashRemoval services minus4214 1092ndashManufacture of prepared pet foods minus4262 3040ndashManufacture of military fighting vehicles minus5508 2432ndashCold rolling of narrow strip minus6629
Source World Bank staff calculations based on SBS data set Note The table displays only sectors for which estimated coefficients are statistically significant
48
- 1 Introduction and motivation
- 2 Methodology
- 3 Data set
- 4 Results
-
- 41 Has corporate market power increased at the aggregate level How do aggregate trends differ across sectors Is there a group of firms driving the overall trend
- 42 How have firm dynamics influenced aggregate markup performance Are there signs of market power consolidation among incumbent firms
- 43 Do firm markups differ across firms with different attributes
- 44 What would be the productivity dividends from markup reduction
-
- 5 Conclusions
- References
- Annex 1 Additional figures and tables
-
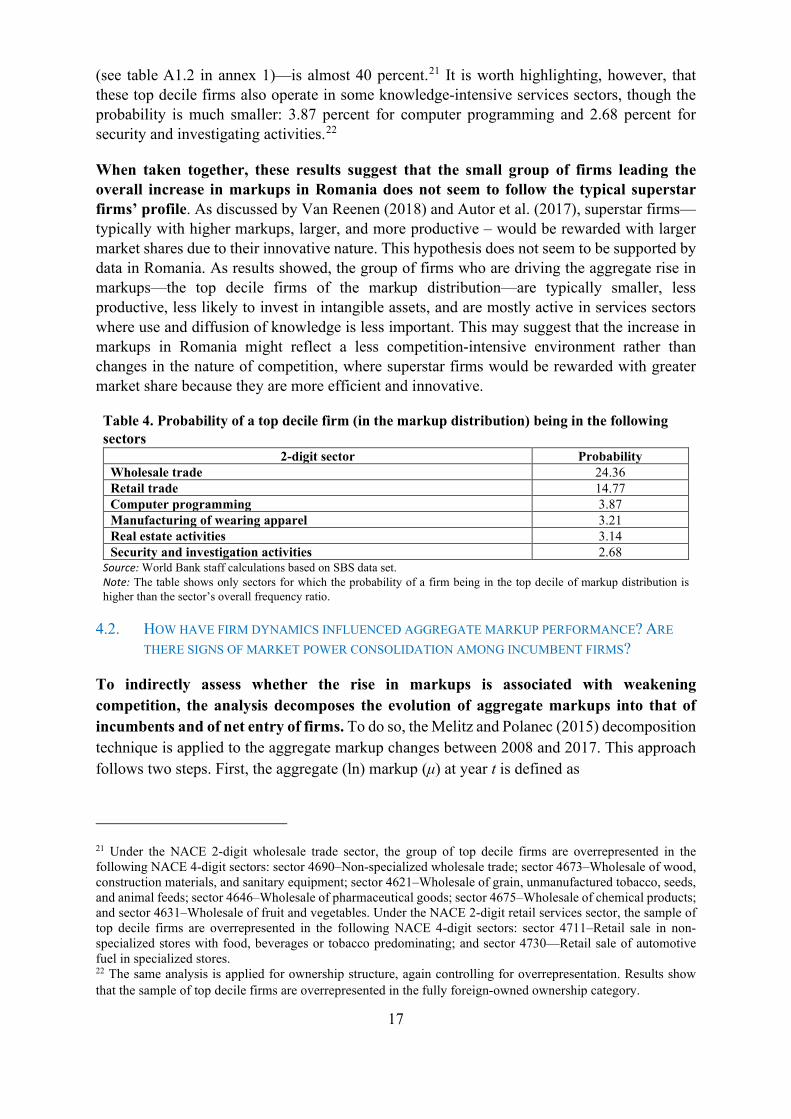
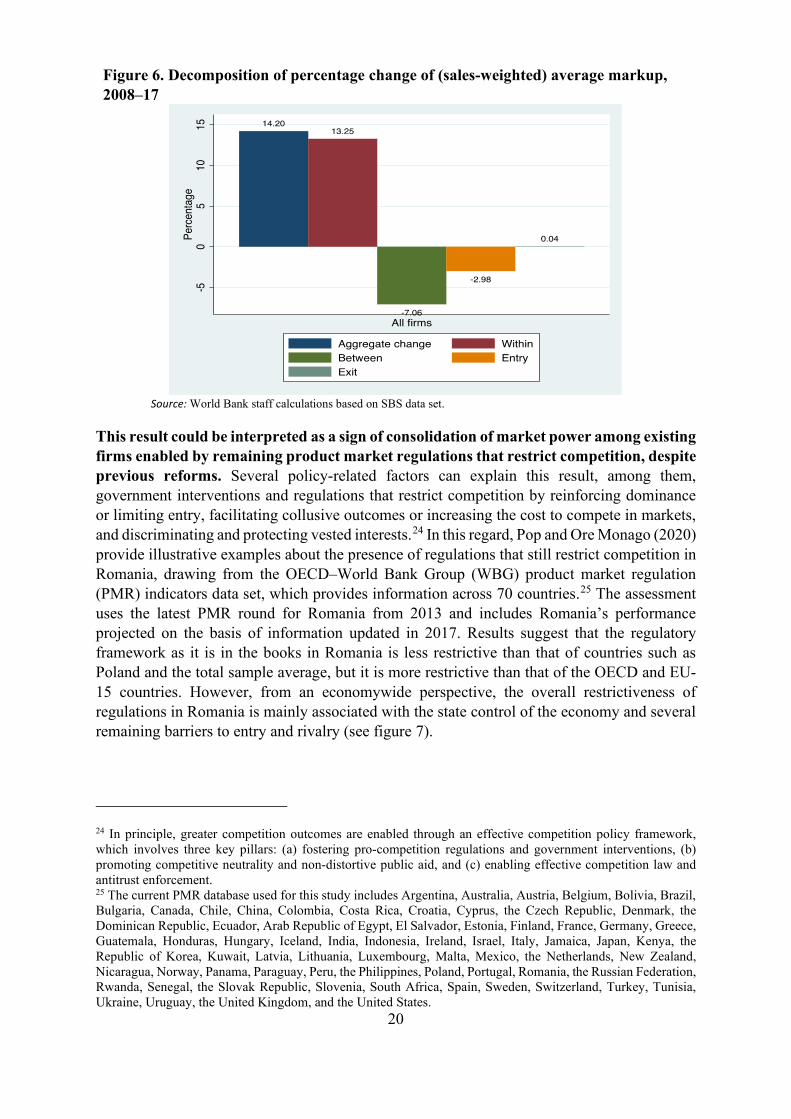
20
Figure 6 Decomposition of percentage change of (sales-weighted) average markup 2008ndash17
Source World Bank staff calculations based on SBS data set
This result could be interpreted as a sign of consolidation of market power among existing firms enabled by remaining product market regulations that restrict competition despite previous reforms Several policy-related factors can explain this result among them government interventions and regulations that restrict competition by reinforcing dominance or limiting entry facilitating collusive outcomes or increasing the cost to compete in markets and discriminating and protecting vested interests24 In this regard Pop and Ore Monago (2020) provide illustrative examples about the presence of regulations that still restrict competition in Romania drawing from the OECDndashWorld Bank Group (WBG) product market regulation (PMR) indicators data set which provides information across 70 countries25 The assessment uses the latest PMR round for Romania from 2013 and includes Romaniarsquos performance projected on the basis of information updated in 2017 Results suggest that the regulatory framework as it is in the books in Romania is less restrictive than that of countries such as Poland and the total sample average but it is more restrictive than that of the OECD and EU-15 countries However from an economywide perspective the overall restrictiveness of regulations in Romania is mainly associated with the state control of the economy and several remaining barriers to entry and rivalry (see figure 7)
24 In principle greater competition outcomes are enabled through an effective competition policy framework which involves three key pillars (a) fostering pro-competition regulations and government interventions (b) promoting competitive neutrality and non-distortive public aid and (c) enabling effective competition law and antitrust enforcement 25 The current PMR database used for this study includes Argentina Australia Austria Belgium Bolivia Brazil Bulgaria Canada Chile China Colombia Costa Rica Croatia Cyprus the Czech Republic Denmark the Dominican Republic Ecuador Arab Republic of Egypt El Salvador Estonia Finland France Germany Greece Guatemala Honduras Hungary Iceland India Indonesia Ireland Israel Italy Jamaica Japan Kenya the Republic of Korea Kuwait Latvia Lithuania Luxembourg Malta Mexico the Netherlands New Zealand Nicaragua Norway Panama Paraguay Peru the Philippines Poland Portugal Romania the Russian Federation Rwanda Senegal the Slovak Republic Slovenia South Africa Spain Sweden Switzerland Turkey Tunisia Ukraine Uruguay the United Kingdom and the United States
21
Figure 7 Product market regulation in Romania and comparator countries
Source Pop and Ore Monago 2020 Note The top five performers in the overall PMR indicator are the Netherlands United Kingdom Austria Denmark and New Zealand Figure shows 2013 information unless otherwise indicated PMR = product market regulation
Barriers to entry and rivalry still affect some service sectors In fact there are examples of regulations that hamper competition in retail trade which concentrates a substantial proportion of high-markup firms in the Romanian economy as seen previously Drawing from the OECD-WBG PMR data set Pop and Ore Monago (2020) show that although regulations in the retail trade sector are less restrictive than in the EU-15 and OECD there is still room for improvement to make the retail trade market more efficient The authors show that licenses and permit requirements may still be imposing an unnecessary burden on entry and increasing the costs to compete in the sector Companies operating in retail sectors in Romania are subject to requirements that go beyond the general conditions formalities and procedures applicable to any company For instance in Romaniarsquos clothing industry licenses and permits are always required compared with 57 percent of OECD countries and 60 percent of EU-15 countries which do not have such a requirement26 In addition Romania has regulations that impose restrictions on entry or expansion of business activities and constrain strategic options to compete in retail markets For instance most of the PMR countries and all top five performers do not restrict firms from selling below cost (beyond a prohibition of predatory pricing) and restrictions on sales promotions are not a common practice either27 In Romania sales below cost are prohibited or restricted beyond a prohibition of predatory pricing Likewise sales promotions are restricted to a particular time of the year28
43 DO FIRM MARKUPS DIFFER ACROSS FIRMS WITH DIFFERENT ATTRIBUTES
To answer this question the analysis explores how markup performance differs across different types of firms To assess the heterogeneity in markups the analysis relates markups to firm-level characteristics such as size age ownership status RampD status and location
26 In this case the least restrictive countries such as Bulgaria Latvia and Sweden do not have such requirements 27 Among the Central and Eastern Europe comparator countries only the Czech Republic and the Slovak Republic apply restrictions on discounted sales pricing while only Poland applies constraints to sales promotions 28 Government Ordinance no 992000 prohibits sales below costs and provides for the conditions and periods when certain types of promotions can take occur
5156 51 52 47 49 53
62 55
3830 42 40 43 39
4333 41
1114
6 9 10 125 5 4
113129 133 134 141 148 156
165 169
0
05
1
15
2
25
3
0
05
1
15
2
25
3
Top 5 -PMR SlovakRepublic
Hungary EU-15average
CzechRepublic
OECDaverage
2013
Romaniasim 2017
Poland Romania
State control (SC) Barriers to entry and rivalry (BER) Barriers to trade and investment (BTI)
Avg of all countries = 190
22
within narrowly defined product markets proxied by NACE 4-digit sectors The following regression is estimated
120583120583119888119888119895119895119894119894119895119895 = 1205751205750 + sum 12057512057511198961198961198791198791199001199001198991198991198961198961198881198881198951198951198941198941198951198957119896119896=2 + sum 1205751205752119903119903119904119904119886119886119904119904119886119886119903119903119888119888119895119895119894119894119895119895
3119903119903=2 + sum 1205751205752119902119902119886119886119886119886119886119886119902119902119888119888119895119895119894119894119895119895
3119902119902=2 + 1205751205753119889119889119888119888119895119895119894119894119895119895
119864119864119864119864119864119864 +1205751205754119889119889119888119888119895119895119894119894119895119895119877119877119877119877119889119889 + 1205751205755119896119896119888119888119895119895119894119894119895119895 + 120578120578119895119895 + 120588120588119895119895 + 120574120574119888119888 + 119906119906119888119888119895119895119894119894119895119895 (11)
where ownkcjit with k = 23hellip7 comprises a set of dummies defining the type of ownership of the firm Romanian private (omitted category) majority state-owned state-private ownership Romanian private and foreign fully foreign-owned public of national and local interest and other (cooperatives and craft organizations)29 The term sizercjit is a set of three dummies controlling for firmsrsquo sizemdashsmall or fewer than 50 employees (omitted category) medium or 51ndash250 employees and large more than 250 employees The term agercjit is a set of three age dummiesmdashyoung or less than 5 years old mature or 6ndash15 years old and older than 15 years Two dichotomous variables are also defined to capture export and RampD profiles dExp and dRnd which take a value of 1 if a firmrsquos direct exports represent more than 10 percent of a firmrsquos total revenue and if a firmrsquos RampD represents more than 1 percent of a firmrsquos total revenue respectively In addition kcjit is firmsrsquo total capital stock value (sum of tangible and intangible assets)30 Finally ηt ρj and γc are respectively time NACE 4-digit sector and county fixed effects Equation (11) is estimated separately for each 1-digit sector (that is manufacturing services and mining) and for the whole economy while the equation parameters are estimated by OLS always using heteroscedasticity-robust standard errors The complete set of results is displayed in table A15 in annex 1
Results show that ownership structure matters to explain markup differences across firms State-controlled companies tend to exert the highest markup premiums in the overall economy and especially in the manufacturing sector Table 5 displays the estimated coefficients of ownership categories multiplied by 100 Except for the mining sector most of estimated coefficients are statistically significant which suggests that ownership structure makes a difference to explain markup performance even for firms operating in the same product market (here proxied by NACE 4-digit sector) county location and year and with similar characteristics in terms of size age and export and RampD profile
In particular firms in which the state has majority or minority ownership demonstrate higher markups when compared with domestic privately owned companies (see table 5 column 4) The average difference in markup is higher for companies with minority state ownership (289 percent) than for fully state-owned companies (200 percent) In manufacturing markups of fully state-owned firms are the highest on average at 527 percent when compared with the reference category (domestic privately owned firms) Results in services are mixed with both private and state ownership extracting high premiums private firms with mixed domestic-foreign ownership show the highest average difference (279 percent) closely followed by minority state-owned companies for which the markup premium
29 More details about the original ownership classification in SBS and the aggregation used for the analysis can be found in table A13 and table A14 in annex 1 30 The variable lnTFPRkit is included as an additional control to test the robustness of the analysis See results in table A16 in annex 1
23
is 275 percent compared with the reference category 31 All results are robust to the inclusion of productivity as an additional control variable (see results in table A16 in annex 1)32
Table 5 Average markup differences by ownership structure relative to domestic privately owned firms
(1) Manufacturing
()
(2) Services
()
(3) Mining
()
(4) All sectors
() Majority state-owned 527 139 772 200 State-private ownership 352 275 ns 289 Domestic private + foreign 161 279 ns 229 Fully foreign-owned 105 263 ns 201 Public of national and local interest
209 149 ns 214
Source World Bank staff calculations based on SBS data set Note Numbers reflect estimated coefficients (multiplied by 100) for ownership dummy categoriesmdashrelative to Romanian private firms the omitted categorymdashin a fixed-effect regression model controlling for firm covariates plus year and NACE 4-digit sector fixed effects as displayed in equation (11) More details about the original ownership classification in SBS and aggregation used for the analysis can be found in table A13 and table A14 in annex 1 See table A15 in annex 1 for the complete set of results ns = not statistically significant
Larger firms and older companies wield higher markups when compared with their counterparts implying that firm size and age are relevant characteristics that influence markup differences As shown in figure 8 old companies (older than 15 years) display higher average markups than young ones (1ndash5 years old) even when they share similar attributes (in terms of ownership structure size and export and RampD profiles) and operate in the same NACE 4-digit sector county and year The estimated average markup premium for old companies (relative to young ones) is 54 percent for the whole economy It varies depending on how data are clustered across large sectors 79 percent in manufacturing 48 percent in services and 228 percent in mining Higher markup premiums for older companies can be interpreted in two ways it can reflect that more experienced firms are able to transpose learning returnsmdashwhich could positively affect their productivity or reduce their marginal costsmdashinto higher markups or that older firms are able to lobby better and create barriers to entry making it more difficult for younger firms to exert competitive pressure Firm size also matters to explain markup performance large companies (with more than 250 full-time employees) tend to display higher markups compared with small companies even when they operate in the same product market and share similar characteristics On average for the whole economy the
31 Results for the category ldquootherrdquo are not shown in table 5 As detailed in table A13 in annex 1 this ldquootherrdquo category refers to SBS ownership answer-codes 40 and 50 respectively ldquocooperativerdquo and ldquopublic of national and local interestrdquo The reason the corresponding results were not highlighted in the main text are twofold First the above-mentioned category accounts for only 006 percent of total companies in the sample Second an in-depth analysis would be needed to understand whether this ldquootherrdquo category reflects potential noise in the way firms self-classify their ownership structures or the way firms report cost expenditures (mainly) or whether this was influenced by SBS sampling design 32 Because the production approach applied in the current analysis delivers both markup and productivity estimates it is possible to further decompose the markup differences across firm characteristics and to verify whether after controlling for differences in marginal costs (that is productivity) certain groups of firms still have higher markups This is precisely one of the mitigating methods employed to reduce the conflation risk as highlighted before Results in table A16 in annex 1 should be interpreted as follows once productivity level is included in the equation differences in marginal cost are accounted for so the coefficient on ldquomajority state-ownedrdquo for instance captures the variation in average prices between majority state-owned and the size reference category (domestic privately owned firms)
24
markup premium for large companies is 122 percent higher than that of small firms (figure 9) Both size and age effects are still present even after controlling for productivity differences (see table A16 in annex 1)33
Figure 8 Average markup differences relative to young firms by age category
Figure 9 Average markup differences relative to small firms by size category
Source World Bank staff calculations based on SBS data set Note Numbers reflect estimated coefficients (multiplied by 100) for age dummy categoriesmdashrelative to young firms (1ndash5 years old) the omitted categorymdashin a fixed-effect regression model controlling for firm covariates plus year county and NACE 4-digit sector fixed effects as displayed in equation (11) All bars reflect statistically significant results See table A15 in annex 1 for the complete set of results
Source World Bank staff calculations based on SBS data set Note Numbers reflect estimated coefficients (multiplied by 100) for size dummy categoriesmdashrelative to small firms (1ndash50 employees) the omitted categorymdashin a fixed-effect regression model controlling for firm covariates plus year county and NACE 4-digit sector fixed effects as displayed in equation (11) All bars reflect statistically significant results See table A15 in annex 1 for the complete set of results
By the same token export intensity also influences markup performance with firms that export earning higher markups Being an exporter is a relevant firm feature to be analyzed when it comes to understanding markup performance Recent models of international trade predict that exporting firms earn higher markups than non-exporting firms either because they are relatively more productive and can thus undercut their rivals (see Melitz and Ottaviano 2008) or because they produce higher-quality goods and rely on higher-quality inputs which allow them to charge higher prices (see Hallak and Sivadasan 2009) In this regard the results summarized in figure 10 are consistent with the literature and suggest that exporting firmsmdashdefined as those whose direct exports represent more than 10 percent of total revenuemdashearn higher markups than non-exporting firms that operate in the same product market (NACE 4-digit sector) the difference ranges from 12 percent to 416 percent depending on how data are clustered across large sectors (manufacturing services and mining)
33 See footnote 32 on how to interpret results in table A16 in annex 1 (after including productivity as an additional control)
22
-160
158
7948
228
54
-505
101520253035
d
iffer
ence
Mature (between 6 and 15 years old)
Old (older than 15)
23
-830
090
327
169122
-15-55
152535
d
iffer
ence
Medium (between 51 and 250)
Large (more than 250 employees)
25
Figure 10 Average markup differences relative to non-exporters by export status
Figure 11 Average markup differences relative to non-RampD performers by RampD status
Source World Bank staff calculations based on SBS data set Note Numbers reflect estimated coefficients (multiplied by 100) for RampD dummy categorymdashrelative to non-RampD performer firms the omitted categorymdashin a fixed-effect regression model controlling for firm covariates plus year county and NACE 4-digit sector fixed effects as displayed in equation (11) All bars reflect statistically significant results See table A15 in annex 1 for the complete set of results
Source World Bank staff calculations based on SBS data set Note Numbers reflect estimated coefficients (multiplied by 100) for export dummy categorymdashrelative to non-exporters the omitted categorymdashin a fixed-effect regression model controlling for firm covariates plus year county and NACE 4-digit sector fixed effects as displayed in equation (11) All bars reflect statistically significant results See table A15 in annex 1 for the complete set of results
Performing RampD activities is positively correlated with markup differences while location proxied by county also matters to explain markup performance Results displayed in figure 11 show that RampD performersmdashidentified by those firms whose RampD expenses surpass more than 1 percent of their total revenuemdashtend to earn higher markups than non-RampD performers The markup premium for RampD performers is always positive suggesting that this group of firms is able to recoup fixed costs associated with RampD activities The magnitude of the premium varies from 16 percent to 46 percent depending how data are clustered across large sectors (manufacturing services and mining) In addition results displayed in figure 12 show that firms in the same product market (at NACE 4-digit level) and with similar characteristics (in terms of ownership age size and export and RampD profiles) charge different markups depending on the county in which they operate Except for Dolj firms in all other counties demonstrate lower average markups than Bucharest the negative markup premium in relation to Bucharest varies from minus154 percent (Vrancea) to minus36 percent (Satu-Mare)
12
258
416
119
05
101520253035404550
d
iffer
ence
160
340
460
273
05
101520253035404550
d
iffer
ence
26
Figure 12 Average markup differences by county relative to Bucharest
Source World Bank staff calculations based on SBS data set Note Numbers reflect estimated coefficients (multiplied by 100) for county fixed effectsmdashrelative to Bucharest the omitted categorymdashin a fixed-effect regression model controlling for firm covariates plus year and NACE 4-digit sector fixed effects as displayed in equation (11) All bars reflect statistically significant results See table A15 in annex 1 for the complete set of results
A variance decomposition analysis suggests that ownership is the most relevant characteristic to explain total variance of markup performance across firms in Romania followed by capital intensity and export status Drawing from estimations of equation (11) it is possible to evaluate the relative importance of each variable to explain the variance of the markup Letting dExp represent any of the explanatory variables of equation (11) the contribution to the variance of the markup of that variable can be defined as
119862119862119879119879119899119899119886119886119889119889119864119864119864119864119864119864 = 12057512057532119881119881119886119886119903119903119889119889119864119864119864119864119864119864+21205751205753119872119872119862119862119862119862(119889119889119864119864119864119864119864119864120583120583minus1205751205753119889119889119864119864119864119864119864119864)119881119881119886119886119903119903(120583120583)
(12)
or as the variance of the variable plus 2 times the covariance of the variable with the part of the markup not explained by that variable A similar expression can be derived for any of the remaining explanatory variables The relative contribution of each variable is computed after discounting the residuals sector and year contributions Results are displayed in figure 13 Ownership structure is shown to be the most relevant feature to explain the variance of markup performance across firms it accounts for 347 percent of the explained variance of markup performance (after removing NACE 4-digit sector and year contributions) The second most important characteristic is capital intensity corresponding to 214 percent of the variance of the markup performance Export status accounts for the third largest share in explained variance 113 percent
d
iffer
ence
27
Figure 13 Contribution by each firm characteristic to explain total variance of markup performance across firms
Source World Bank staff calculations based on SBS data set Note The pie chart reflects markup variance decomposition results It decomposes the variance of markup performance across firms after removing the proportion accounted for by omitted factors NACE 4-digit sector and year contributions
44 WHAT WOULD BE THE PRODUCTIVITY DIVIDENDS FROM MARKUP REDUCTION
While it became evident that aggregate market power in Romania has been rising it is important to analyze its consequences for economic growth An indirect way to measure this is to estimate the productivity dividends that would come from markup reduction The association between markup and productivity can be positive or negative depending on the nature of competition in the specific marketssectors As shown by Autor et al (2017) and Van Reenen (2018) there are marketsmdashsuch as high-tech sectors or knowledge-intensive onesmdashwhere the nature of competition tends to emphasize the importance of network effects economies of scale and scope and intangible assets so the most productive and dynamic firms exert higher markups and obtain larger market shares On the other hand in certain markets where recouping fixed costs (such as RampD) because of higher-risk investments is not that relevant high-markup firms are not necessarily more productive and efficient Another way to look at this contrast is through the inverted-U relationship of innovation and competition to an increase in productivity as explored by Aghion et al (2005) According to this view stronger competition (proxied here by smaller markups) encourages neck-and-neck firms to innovatemdashthe ldquoescape competitionrdquo effectmdashand therefore to increase productivity growth At the same time this view discourages laggard firms from innovating (the Schumpeterian effect) therefore reducing productivity growth The combination of the two effectsmdashescaping competition and discouraging innovationmdashexplains the inverted-U relationship of competition and innovation with productivity growth
To assess the correlation between productivity growth and markups in Romania the analysis uses firm-level estimations of TFPR and markups obtained so far Thus it estimates the specification presented in Aghion Braun and Fedderke (2008) as follows
Δ119889119889119899119899119879119879119897119897119897119897119877119877119888119888119895119895119894119894119895119895 = 1206011206010 + 1206011206011120583120583119888119888119895119895119894119894119895119895 + 120578120578119895119895 + 120588120588119895119895 + 120574120574119888119888 + 120592120592119888119888119895119895119894119894119895119895 (13)
where the left-hand-side variable represents TFPR growth of firm i in NACE 4-digit sector j in year t 120583120583119894119894119895119895119895119895minus1 is the lagged value of firm irsquos markup in sector j in year t ηt ρj and γc are
214
113
79
47
347
64
136
capital intensity Export status RampD status age ownership size region
28
respectively time NACE 4-digit sector and county fixed effects Equation (13) is estimated separately for each 1-digit sector (that is manufacturing services and mining) and for the whole economy while the equation parameters are estimated by OLS always using heteroscedasticity-robust standard errors
Figure 14 Productivity (TFPR) growth dividends from a 10 percent reduction of average markup by sector
Source World Bank staff calculations based on SBS data set Note Results from year county and 4-digit sector fixed effects Coefficient for mining was not statistically significant
Results shows that on average reducing markups would have a positive impact on aggregate productivity expansion Results displayed in table A18 in annex 1 suggest that lower (past) markups are associated with higher (current) productivity growth all coefficients for lagged markups are negative and statistically significant at conventional values for all sectors except mining Overall this negative correlation between past markup level and productivity growth is an indication of a positive association between competition and productivity growth which would be driven by the escape competition effect described by Aghion et al (2008)34
The magnitude of the economic effect of markup reduction on productivity growth is sizable Figure 14 shows that a 10 percent decrease in the average markup of 61 percent for the overall economy in the 2008ndash17 period would imply an increase in productivity (TFPR) growth of 082 percentage point per year The economic effect for the manufacturing sector would be substantially higher reducing the average markup of 403 percent for manufacturing in the same period would imply an increase in TFPR growth of 147 percentage points per year
Further productivity dividends stemming from markup reduction vary substantially across NACE 4-digit sectors The same specification expressed in equation (9) is estimated for each NACE 4-digit sector separately controlling for year and county fixed effects The TFPR growth dividends from markup reduction are computed for each NACE 4-digit sector drawing from the estimated coefficients (see table A18 in annex 1) Results vary substantially
34 An extended specificationmdashwhere the squared value of lagged markup is included as an additional dependent variablemdashwas also estimated The estimated coefficient of the squared term was not statistically significant (see results in table A17 in annex 1)
147
048
082
0
02
04
06
08
1
12
14
16
Manufacturing Services All
Perc
enta
ge p
oint
s per
yea
r
29
across sectors among those 4-digit sectors where the estimated coefficients are statistically significant the productivity growth dividends of a 10 percent decrease in markup vary from 701 percentage points to 016 percentage points respectively for NACE sector 1041ndashManufacture of oil and fats and sector 4649ndashWholesale of other household goods (figure 15)35 Productivity dividends from a potential markup reduction are also positive in sectors where the top decile firms in the markup distribution are overly represented for instance in sector 4711ndashRetail sale in non-specialized stores with food beverages or tobacco predominating a 10 percent decrease of average markup would be associated with an increase in TFPR growth of 022 percentage points per year For sector 4690ndashNon-specialized wholesale trade and sector 4673ndashWholesale of wood construction materials and sanitary equipment the productivity dividends would be 018 and 021 percentage points respectively
Figure 15 Productivity (TFPR) growth dividends from a 10 percent reduction of average markup Results by NACE 4-digit sector
Source World Bank staff calculations based on SBS data set
35 There are however some sectors where markup reduction brings detrimental impacts to productivity expansion See complete set of results in table A18in annex 1 for instance in NACE sector 8010ndashPrivate security activities and sector 2432ndashPrecious metals production where a reduction of average markup in the 2008ndash17 period would imply a decrease of TFPR growth of 030 percentage points and 663 percentage points respectively Following Aghion Braun and Fedderke (2008) the Schumpeterian effect of product market competition would be the underlying driver behind this result in these sectors competition reduces innovation incentives and therefore productivity growth by reducing the rents from innovations of firms below the technological frontier
00
10
20
30
40
50
60
70
80
Perc
enta
ge p
oint
s per
yea
r
30
5 CONCLUSIONS
A stylized fact emerging in the recent empirical literature is the increase in average levels of market power across countries in both developed and emerging economies This paper aims to bring new evidence about the evolution of corporate market power in Romania and the implications for competition dynamics It uses markups as a proxy for market power and explores firm-level heterogeneity to identify the underlying drivers of aggregate trends The paper applies the production approachmdashfollowing De Loecker and Warzynski (2012) De Loecker and Eeckhout (2018) and De Loecker Eeckhout and Unger (2020)mdashto estimate markup at the firm-year level for Romania The Romanian Structural Business Survey data set is used to apply this methodology
Results show that the aggregate markup in Romania increased by around 15 percent between 2008 and 2017 However this aggregate performance masks a lot of heterogeneity the first being heterogeneity of markups across the main sectors While in manufacturing (sales-weighted) average markups experienced a declining pattern of minus57 percent during 2008ndash17 there was an opposite and much more rapid trend in services with an aggregate change of 422 percent
Second at the firm level results suggest that a key driving force behind this aggregate trend was the ability of the top decile of firms in the markup distribution to increase their markups This increase has been faster than for the rest of the firms Firms in the 90th percentile of the markup distribution increased their (sales-weighted) average markup by 285 percent between 2008 and 2017 while the rest of firms (that is those below the top decile firms) experienced a completely opposite trend their weighted markup contracted by 83 percent over the same period
This sample of top decile firms does not seem to follow the typical superstar firmsrsquo profile which suggests that the increase in markups in Romania might be associated with an environment that is less conducive to competition The top decile firms in the markup distribution are 468 percent smaller 910 percent less productive and 33 percent less likely to invest in intangible assets than the rest of the firms in the markup distribution and they are overrepresented in less knowledge-intensive service sectors Therefore they do not seem to follow the typical superstar firmsrsquo profile (typically larger more productive and more likely to invest in intangible assets) This suggests that the increase in markups in Romania might be more due to relatively weak competition rather than to changes in the nature of competition where superstar firms (usually more efficient and innovative) are rewarded with greater market share In fact a decomposition exercise shows that the increase in aggregate markups has been driven mostly by incumbents rather than by new entrants and exiting firms These results could be interpreted as a sign of consolidation of market power among existing firms Several policy-related factors could explain this result among them government interventions and regulations that restrict competition by reinforcing dominance or limiting entry facilitating collusive outcomes or increasing the cost to compete in markets and by discriminating and protecting vested interests In this regard illustrative evidence provided by Pop and Ore Monago (2020) shows that despite reforms regulations that restrict entry and rivalry are still present in the retail trade sector which concentrates a substantial proportion of high-markup firms in the Romanian economy
31
Results also show that certain firm characteristics matter in explaining differences in markup performance size age RampD profile export propensity location and notably ownership State-controlled companies tend to demonstrate the highest markup premiums when compared with domestic privately owned companies 289 percent higher for minority state-owned companies and 20 percent higher for fully state-owned companies Old companies (older than 15 years) display 54 percent higher markups on average than young ones no matter the product market (at NACE 4-digit level) where they operate The markup premium for large companies (with more than 250 full-time employees) is 122 percent higher than that of small firms in the overall economy Exporting firmsmdashthose whose direct exports represent more than 10 percent of total revenuemdashearn 119 percent higher markups than non-exporting firms that operate in the same sector At the same time results show that the markup premium for RampD performers (compared with non-RampD performers) is 273 percent for the whole economy and that firms operating in the same product market charge different markups depending on the county where they operate Overall while all these features matter to explain markup performance a variance decomposition analysis suggests that ownership is the most relevant characteristic to explain total variance of markup performance across firms in Romania
In this context given that ownership assumes a prominent role to explain markup performance it is important to ensure competitively neutral policies across markets where private and public enterprises compete The prominent role of ownership in explaining total variance of markup performance across firms combined with the evidence that state-controlled companies tend to exert the highest markup premiums in the overall economy highlights the importance of ensuring competitive neutrality in Romania so that private and public enterprises compete on a fair basis Analysis presented in Pop and Ore Monago (2020) shows that state-owned enterprises (SOEs) in Romania compete on uneven terms with the private sector because of gaps in terms of both the current regulatory framework as well as its implementation As for the regulatory framework itself lack of competitive neutrality emerges from restrictive SOE governance rules and the exemption of newly setup SOEs from the corporate governance law lack of rules mandating the separation of commercial and noncommercial functions despite legal separation (for example in the railway and energy sectors) and the lack of specific provisions that require SOE investments to show positive rates of returns With regard to implementation of the regulatory framework competitive neutrality gaps stem from (a) the protracted application of corporate governance rules (b) fragmentation of SOE oversight across institutions with frequent overlaps (c) inconsistent reporting of SOE performance that prevents full monitoring and comparability with the private sector performance in comparable situations (d) little clarity in terms of compensation for public service obligations and (e) lack of transparency in state aid allocation
Finally the analysis shows that productivity dividends arise from increased competition in Romania As such lowering markups can boost productivity growth A 10 percent decrease in the average markup for the overall economy during 2008ndash17 would imply an increase in productivity (TFPR) growth of 082 percentage point per year The effect for the manufacturing sector is higher (147 percentage points per year) but lower for services (048 percentage point per year) The ldquoescape competitionrdquo effect described by Aghion Braun and Fedderke (2008)mdashthrough which fiercer competition induces firms to innovate to escape competition with the fringe therefore increasing productivity growthmdashwould be the underlying driver behind these average results for the manufacturing industry Results vary substantially across sectors among
32
those 4-digit sectors where the estimated coefficients are statistically significant the productivity growth dividend of a 10 percent decrease in markup varies from 701 percentage points (sector 1041ndashManufacture of oil and fats) to 016 percentage point (sector 4649ndashWholesale of other household goods)
In this context boosting competition becomes a key part of the engine to drive productivity growth and help consolidate Romaniarsquos convergence to a high-income level Implementing pro-competition policies is instrumental Besides removing anticompetitive regulations and promoting competitive neutrality policy makers should ensure that state aid is allocated in a non-distortive way and enable more effective competition law and antitrust enforcement
33
REFERENCES
Ackerberg D K Caves and G Frazer 2015 ldquoIdentification Properties of Recent Production Function Estimatorsrdquo Econometrica 83 (6) 2411ndash51
Aghion P N Bloom R Blundell R Griffith and P Howitt 2005 ldquoCompetition and Innovation An Inverted-U Relationshiprdquo Quarterly Journal of Economics 120 (2) 701minus28
Aghion P M Braun and J Fedderke 2008 ldquoCompetition and Productivity Growth in South Africardquo Economics of Transition 16 (4) 741ndash68
Autor D D Dorn F Lawrence C Patterson and J Van Reenen 2017 ldquoThe Fall of the Labor Share and the Rise of Superstar Firmsrdquo NBER Working Paper 23396 National Bureau of Economic Research Cambridge MA
Barkai S 2020 ldquoDeclining Labor and Capital Sharesrdquo Journal of Finance 75 (5) 2421ndash63
Bartelsman E J and M Doms 2000 ldquoUnderstanding Productivity Lessons from Longitudinal Microdatardquo Journal of Economic Literature 38 (3) 569ndash94
Berry S J Levinsohn and A Pakes 1995 ldquoAutomobile Prices in Market Equilibriumrdquo Econometrica Journal of the Econometric Society 63 (4) 841ndash90
Berry S J Levinsohn and A Pakes 2004 ldquoDifferentiated Products Demand Systems from a Combination of Micro and Macro Data The New Car Marketrdquo Journal of Political Economy 112 (1) 68ndash105
Bessen J 2017 ldquoInformation Technology and Industry Concentrationrdquo Law and Economics Paper No 17-41 Boston University School of Law Boston
Bond S A Hashemi G Kaplan and P Zoch 2020 ldquoSome Unpleasant Markup Arithmetic Production Function Elasticities and their Estimation from Production Datardquo NBER Working Paper No 27002 National Bureau of Economic Research Cambridge MA
Bresnahan T F 1989 ldquoEmpirical Studies of Industries with Market Powerrdquo In Handbook of Industrial Organization Vol 2 edited by R Schmalensee and R Willig 1011ndash57 Amsterdam Elsevier
Cameron A C and P K Trivedi 2010 Microeconometrics Using Stata (Rev ed) College Station TX Stata Press
Crouzet N and J Eberly 2018 ldquoUnderstanding Weak Capital Investment The Role of Market Concentration and Intangiblesrdquo NBER Working Paper 25869 National Bureau of Economic Research Cambridge MA De Loecker J 2011 ldquoRecovering Markups from Production Datardquo International Journal of Industrial Organization 29 (3) 350ndash55
De Loecker J 2013 ldquoDetecting Learning by Exportingrdquo American Economic Journal Microeconomics 5 (3) 1ndash21
De Loecker J and J Eeckhout 2018 ldquoGlobal Market Powerrdquo NBER Working Paper 24768 National Bureau of Economic Research Cambridge MA
De Loecker J J Eeckhout and G Unger 2020 ldquoThe Rise of Market Power and the Macroeconomic Implicationsrdquo Quarterly Journal of Economics 135 (2) 561ndash644 httpsdoiorg101093qjeqjz041
34
De Loecker J and F Warzynski 2012 ldquoMark-ups and Firm-Level Export Statusrdquo American Economic Review 102 (6) 2437ndash71
Diacuteez F D Leigh and S Tambunlertchai 2018 ldquoGlobal Market Power and Its Macroeconomic Implicationsrdquo IMF Working Paper 18137 International Monetary Fund Washington DC
Grullon G Y Larkin and R Michaely 2018 ldquoAre US Industries Becoming More Concentratedrdquo Swiss Finance Institute Research Paper No 19-41 httpdxdoiorg102139ssrn2612047
Gutieacuterrez G and T Philippon 2017a ldquoDeclining Competition and Investment in the USrdquo NBER Working Paper 23583 National Bureau of Economic Research Cambridge MA Gutieacuterrez G and T Philippon 2017b ldquoInvestment-less Growth An Empirical Investigationrdquo Brookings Papers on Economic Activity (Fall) 89ndash182 Gutieacuterrez G and T Philippon 2018 ldquoHow EU Markets Became More Competitive than US Markets A Study of Institutional Driftrdquo NBER Working Paper 24700 National Bureau of Economic Research Cambridge MA
Hall R 1988 ldquoThe Relation between Price and Marginal Cost in US Industryrdquo Journal of Political Economy 96 (5) 921ndash47
Hallak J and J Sivadasan 2009 ldquoExporting Behavior under Quality Constraintsrdquo NBER Working Paper 14928 National Bureau of Economic Research Cambridge MA
IMF (International Monetary Fund) 2019 World Economic Outlook April 2019 Growth Slowdown Precarious Recovery Washington DC International Monetary Fund
Koujianou Goldberg P and R Hellerstein 2012 A Structural Approach to Identifying the Sources of Local Currency Price Stability Review of Economic Studies 80 (1) 175ndash210
Melitz M J and G Ottaviano 2008 ldquoMarket Size Trade and Productivityrdquo Review of Economic Studies 75 (1) 295ndash316
Melitz M J and S Polanec 2015 ldquoDynamic Olley-Pakes Productivity Decomposition with Entry and Exitrdquo RAND Journal of Economics 46 (2) 362ndash75
Motta M 2004 Competition Policy Theory and Practice Cambridge MA Cambridge University Press
Pop G and T Ore Monago 2020 ldquoCompetition and Government Interventions in Romania An Assessment with Focus on Product Market Regulations and Competitive Neutralityrdquo Background paper for Markets and People Romania Country Economic Memorandum International Development in Focus World Bank Washington DC
Shapiro C 2018 ldquoAntitrust in a Time of Populismrdquo International Journal of Industrial Organization 61 714ndash48
Syverson C 2004 ldquoProduct Substitutability and Productivity Dispersionrdquo Review of Economics and Statistics 86 (2) 534ndash50
Van Reenen J 2018 ldquoIncreasing Differences between Firms Market Power and the Macroeconomyrdquo CEPR Discussion Paper 1576 Center for Economic and Policy Research Washington DC
35
World Bank 2020a ldquoMarkets and People Romania Country Economic Memorandumrdquo International Development in Focus World Bank Washington DC
World Bank 2020b ldquoAssessing the Direct and Indirect Impact of State Aid in Romania An Ex-post Evaluationrdquo World Bank Washington DC
36
ANNEX 1 ADDITIONAL FIGURES AND TABLES
Figure A11 Evolution of (sales-weighted) average markup in manufacturing sector by technology intensity 2008ndash17
Source World Bank staff calculations based on SBS data set
Table A11 Manufacturing industry groups by technology intensity Eurostat classification
85
99
51
Mar
k-up i
ndex
(200
8 = 1
)
2008 2009 2010 2011 2012 2013 2014 2015 2016 2017Year
Manuf High-tech
37
Source Eurostat Indicators on High-Tech Industry and KnowledgendashIntensive Services annex 3 httpseceuropaeueurostatcachemetadataAnnexeshtec_esms_an3pdf
38
Figure A12 Evolution of (sales-weighted) average markup in services sector by knowledge intensity
39
Table A12 Services groups by knowledge intensity Eurostat classification
40
Source Eurostat Indicators on High-Tech Industry and KnowledgendashIntensive Services annex 3 httpseceuropaeueurostatcachemetadataAnnexeshtec_esms_an3pdf
41
Table A13 Original ownership classification from SBS SBS Code Description
10 Fully state-owned Majority state-owned (statepublic capital gt 50 of equity)
21 State + Romanian private 22 State + foreign 23 State + Romanian private + foreign
Majority privately owned (private capital ge 50 of equity) 26 State + Romanian private 27 State + foreign 28 State + Romanian private + foreign
Fully privately owned 31 Romanian private 32 Romanian private + foreign 40 Cooperative 50 Craft organizations 60 Fully foreign-owned 70 Public of national and local interest
Source World Bank staff calculations based on SBS data set
Table A14 Ownership classification adopted in the analysis SBS codes (combined) Description
10 21 22 23 State owned (fully + majority state-owned) 26 27 28 Private-public (majority private)
31 Fully private (domestic) 32 Fully private (domestic + foreign) 60 Fully private (fully foreign) 70 Public of national and local interest
40 50 Other Source World Bank staff calculations based on SBS data set
Table A15 Conditional correlations between firm characteristics and markup performance regression results
Variable Manufacturing Services Mining All Capital stock (ln) minus0150 minus0039 minus0067 minus0066 Export dummy 0120 0258 0416 0119 RampD dummy 0160 0340 0460 0273 Mature 0022 minus0016 0158 minus0005 Old 0079 0048 0228 0054 Majority state-owned 0527 0139 0772 0200 State-private ownership 0352 0275 0111 0289 Romanian private + foreign 0161 0279 0096 0229 Fully foreign-owned 0105 0263 0 0201 Public of national and local interest 0209 0149 (omitted) 0214 Other 0884 0555 (omitted) 0758 Medium 0230 minus0083 0011 0009 Large 0327 0169 minus0015 0122 1 Alba 0106 minus0087 minus0151 minus0042 2 Arad 0038 minus0090 minus0148 minus0077 3 Arges minus0005 minus0053 minus0195 minus0060
42
Variable Manufacturing Services Mining All 4 Bacau 0092 minus0090 minus0194 minus0055 5 Bihor 0036 minus0115 minus0256 minus0088 6 Bistrita-Nasaud minus0064 minus0156 minus0069 minus0144 7 Botosani 0046 minus0089 minus0438 minus0076 8 Brasov 0041 minus0047 0049 minus0040 9 Braila 0133 minus0055 minus0265 minus0025 10 Buzau 0017 minus0123 minus0025 minus0100 11 Caras-Severin 0035 minus0187 minus0005 minus0139 12 Cluj minus0004 minus0094 minus0119 minus0088 13 Constanta 0057 minus0105 0062 minus0088 14 Covasna 0038 minus0056 minus0151 minus0052 15 Dambovita 0005 minus0183 minus0154 minus0144 16 Dolj 0195 0060 minus0042 0079 17 Galati 0106 minus0007 minus0276 0004 18 Gorj 0084 0028 minus0116 0026 19 Harghita 0101 minus0102 minus0007 minus0045 20 Hunedoara 0167 minus0031 minus0057 0011 21 Ialomita 0138 minus0049 minus0265 minus0027 22 Iasi minus0014 minus0038 minus0384 minus0058 23 Ilfov 0011 0009 0314 0010 24 Maramures 0094 minus0020 minus0042 0 25 Mehedinti 0113 minus0136 minus0720 minus0096 26 Mures 0048 minus0063 minus0093 minus0048 27 Neamt 0001 minus0108 minus0428 minus0102 28 Olt 0073 minus0005 minus0397 minus0011 29 Prahova 0018 minus0034 minus0028 minus0043 30 Satu-Mare 0033 minus0024 minus0056 minus0036 31 Salaj 0075 minus0045 minus0448 minus0031 32 Sibiu 0044 minus0038 minus0154 minus0041 33 Suceava 0044 minus0087 minus0111 minus0074 34 Teleorman 0103 minus0099 minus0299 minus0062 35 Timis 0030 minus0020 minus0341 minus0037 36 Tulcea 0142 minus0149 0096 minus0078 37 Vaslui 0091 minus0017 minus0105 minus0007 38 Valcea 0078 minus0008 minus0122 minus0002 39 Vrancea minus0061 minus0163 minus0608 minus0154 51 Calarasi 0080 minus0122 0672 minus0075 52 Giurgiu 0052 minus0064 minus0334 minus0066
_cons 2147 1150 2291 2246 NACE 4-digit fixed effects Yes Yes Yes Yes
Year fixed effects Yes Yes Yes Yes
R2 0345 0235 0254 0279 Source World Bank staff calculations based on SBS data set Note Dependent variable = ln(markup) denotes significance level at 1 percent at 5 percent and at 10 percent
43
44
Table A16 Conditional correlations between firm characteristics (including productivity) and markup performance regression results
Variable Manufacturing Services Mining All Capital stock (ln) minus0149 minus0038 minus0065 minus0066 Export dummy 0116 0257 0400 0118 RampD dummy 0182 0366 0449 0295 Mature 0021 minus0014 0164 minus0003 Old 0079 0052 0228 0057 Majority state-owned 0529 0147 0758 0209 State-private ownership 0351 0274 0118 0288 Romanian private + foreign 0156 0275 0090 0225 Fully foreign-owned 0096 0254 minus0011 0192 Public of national and local interest 0179 0165 (omitted) 0233 Other 0879 0561 (omitted) 0759 Medium 0232 minus0083 0002 0010 Large 0327 0170 minus0016 0122
Productivity (TFPR) 0051 0020 0041 0024 1 Alba 0114 minus0081 minus0156 minus0035 2 Arad 0045 minus0085 minus0135 minus0071 3 Arges 0001 minus0049 minus0196 minus0056 4 Bacau 0098 minus0084 minus0188 minus0049 5 Bihor 0042 minus0111 minus0268 minus0083 6 Bistrita-Nasaud minus0057 minus0150 minus0055 minus0137 7 Botosani 0053 minus0082 minus0443 minus0069 8 Brasov 0045 minus0042 0033 minus0035 9 Braila 0139 minus0048 minus0243 minus0018 10 Buzau 0022 minus0118 minus0002 minus0094 11 Caras-Severin 0042 minus0178 minus0001 minus0131 12 Cluj minus0001 minus0089 minus0120 minus0083 13 Constanta 0067 minus0101 0056 minus0084 14 Covasna 0045 minus0050 minus0166 minus0046 15 Dambovita 0010 minus0180 minus0162 minus0140 16 Dolj 0202 0068 minus0054 0087 17 Galati 0114 minus0001 minus0289 0010 18 Gorj 0091 0037 minus0118 0035 19 Harghita 0108 minus0096 minus0005 minus0039 20 Hunedoara 0173 minus0025 minus0055 0018 21 Ialomita 0144 minus0045 minus0256 minus0023 22 Iasi minus0005 minus0034 minus0394 minus0053 23 Ilfov 0013 0012 0296 0013 24 Maramures 0101 minus0013 minus0038 0007 25 Mehedinti 0128 minus0132 minus0729 minus0090 26 Mures 0053 minus0057 minus0105 minus0042 27 Neamt 0010 minus0101 minus0434 minus0094
45
Variable Manufacturing Services Mining All 28 Olt 0082 0002 minus0402 minus0004 29 Prahova 0023 minus0029 minus0032 minus0039 30 Satu-Mare 0038 minus0018 minus0047 minus0030 31 Salaj 0081 minus0039 minus0433 minus0025 32 Sibiu 0044 minus0034 minus0147 minus0038 33 Suceava 0051 minus0081 minus0105 minus0068 34 Teleorman 0117 minus0092 minus0296 minus0053 35 Timis 0033 minus0014 minus0340 minus0032 36 Tulcea 0147 minus0142 0078 minus0072 37 Vaslui 0101 minus0011 minus0104 0 38 Valcea 0087 minus0002 minus0120 0004 39 Vrancea minus0053 minus0158 minus0602 minus0148 51 Calarasi 0086 minus0118 0673 minus0071 52 Giurgiu 0059 minus0060 minus0334 minus0061
_cons 1632 0993 1934 2036 NACE 4-digit fixed effects Yes Yes Yes Yes
Year fixed effects Yes Yes Yes Yes
R2 0347 0235 0255 0280 Source World Bank staff calculations based on SBS data set Note Dependent variable = ln(markup) denotes significance level at 1 percent at 5 percent and at 10 percent
Table A17 Productivity growth and markup performance regression results
All Manufacturing Services Mining
Lag markup minus0025 minus0028 minus0026 minus0027 minus0025 minus0027 minus0012 minus0024
Lag markup squared 0001 0000 0001 0003 NACE 4-digit sector fixed effects Yes Yes Yes Yes Yes Yes Yes Yes County fixed effects Yes Yes Yes Yes Yes Yes Yes Yes Year fixed effects Yes Yes Yes Yes Yes Yes Yes Yes
Observations 245525 245525 76694 76694 167120 167120 1711 1711 Source World Bank staff calculations based on SBS data set Note Dependent variable = TFPR growth denotes significance level at 1 percent at 5 percent and at 10 percent
46
Table A18 Productivity (TFPR) growth dividends from a 10 reduction of average markup results by NACE 4-digit sector
NACE 4-digit sector Gain in TFPR growth per
year (percentage points)
1041ndashManufacture of oils and fats 7015 4331ndashPlastering 5547 2060ndashManufacture of man-made fibers 5286 2824ndashManufacture of power-driven hand tools 4869 1072ndashManufacture of rusks and biscuits manufacture of preserved pastry goods and cakes
4145
1104ndashManufacture of other non-distilled fermented beverages 3984 1723ndashManufacture of paper stationery 3716 2812ndashManufacture of fluid power equipment 3566 2452ndashCasting of steel 3278 1101ndashDistilling rectifying and blending of spirits 3134 1420ndashRaising of other cattle and buffaloes 3072 2011ndashManufacture of industrial gases 3033 2593ndashManufacture of wire products chain and springs 2689 2829ndashManufacture of other general-purpose machinery nec 2641 4910ndashPassenger rail transport interurban 2629 2451ndashCasting of iron 2615 3821ndashTreatment and disposal of non-hazardous waste 2375 2059ndashManufacture of other chemical products nec 2336 2920ndashManufacture of bodies (coachwork) for motor vehicles manufacture of trailers and semi-trailers
2270
1051ndashOperation of dairies and cheese making 2224 3313ndashRepair of electronic and optical equipment 2160 1081ndashManufacture of sugar 2158 1073ndashManufacture of macaroni noodles couscous and similar farinaceous products 2081 4213ndashConstruction of bridges and tunnels 2077 2223ndashManufacture of buildersrsquo ware of plastic 2011 2550ndashForging pressing stamping and roll-forming of metal powder metallurgy 1949 2313ndashManufacture of hollow glass 1926 2825ndashManufacture of non-domestic cooling and ventilation equipment 1889 2020ndashManufacture of pesticides and other agrochemical products 1818 2571ndashManufacture of cutlery 1758 5914ndashMotion picture projection activities 1691 5920ndashSound recording and music publishing activities 1665 3514ndashTrade of electricity 1653 1310ndashPreparation and spinning of textile fibers 1616 4920ndashFreight rail transport 1613 4339ndashOther building completion and finishing 1586 2620ndashManufacture of computers and peripheral equipment 1543 4311ndashDemolition 1515 3832ndashRecovery of sorted materials 1404 3523ndashTrade of gas through mains 1382 2410ndashManufacture of basic iron and steel and of ferro-alloys 1353 2399ndashManufacture of other non-metallic mineral products nec 1272 2017ndashManufacture of synthetic rubber in primary forms 1258 7711ndashRental and leasing of cars and light motor vehicles 1256 4212ndashConstruction of railways and underground railways 1128 2453ndashCasting of light metals 1080 7410ndashSpecialized design activities 1068 5630ndashBeverage serving activities 1065 4211ndashConstruction of roads and motorways 0989 4677ndashWholesale of waste and scrap 0926 4676ndashWholesale of other intermediate products 0917 4120ndashConstruction of residential and non-residential buildings 0912 4623ndashWholesale of live animals 0890 6820ndashRental and operating of own or leased real estate 0826 4110ndashDevelopment of building projects 0824
47
NACE 4-digit sector Gain in TFPR growth per year
(percentage points) 4613ndashAgents involved in the sale of timber and building materials 0823 4322ndashPlumbing heat and air-conditioning installation 0731 5629ndashOther food service activities 0699 4791ndashRetail sale via mail order houses or via internet 0659 4941ndashFreight transport by road 0659 4618ndashAgents specialized in the sale of other particular products 0646 7219ndashOther research and experimental development on natural sciences and engineering 0623 4617ndashAgents involved in the sale of food beverages and tobacco 0609 5510ndashHotels and similar accommodation 0560 4615ndashAgents involved in the sale of furniture household goods hardware and ironmongery
0541
4633ndashWholesale of dairy products eggs and edible oils and fats 0540 4778ndashOther retail sale of new goods in specialized stores 0527 4621ndashWholesale of grain unmanufactured tobacco seeds and animal feeds 0517 4662ndashWholesale of machine tools 0501 6110ndashWired telecommunications activities 0491 4634ndashWholesale of beverages 0468 5610ndashRestaurants and mobile food service activities 0463 4631ndashWholesale of fruit and vegetables 0426 4532ndashRetail trade of motor vehicle parts and accessories 0394 1411ndashManufacture of leather clothes 0390 4511ndashSale of cars and light motor vehicles 0382 4637ndashWholesale of coffee tea cocoa and spices 0361 4645ndashWholesale of perfume and cosmetics 0354 1419ndashManufacture of other wearing apparel and accessories 0344 4643ndashWholesale of electrical household appliances 0335 4639ndashNon-specialized wholesale of food beverages and tobacco 0285 4619ndashAgents involved in the sale of a variety of goods 0281 4675ndashWholesale of chemical products 0249 4711ndashRetail sale in non-specialized stores with food beverages or tobacco predominating 0223 4673ndashWholesale of wood construction materials and sanitary equipment 0214 4690ndashNon-specialized wholesale trade 0188 4649ndashWholesale of other household goods 0158 8010ndashPrivate security activities minus0300 8220ndashActivities of call centres minus0323 2572ndashManufacture of locks and hinges minus0503 7120ndashTechnical testing and analysis minus0511 3315ndashRepair and maintenance of ships and boats minus0512 3600ndashWater collection treatment and supply minus0547 4754ndashRetail sale of electrical household appliances in specialized stores minus0627 2341ndashManufacture of ceramic household and ornamental articles minus0646 7111ndashArchitectural activities minus0649 6120ndashWireless telecommunications activities minus0746 7312ndashMedia representation minus1023 4334ndashPainting and glazing minus1200 5020ndashSea and coastal freight water transport minus1276 1052ndashManufacture of ice cream minus1367 5911ndashMotion picture video and television programme production activities minus1439 2592ndashManufacture of light metal packaging minus1619 2752ndashManufacture of non-electric domestic appliances minus1729 2521ndashManufacture of central heating radiators and boilers minus1843 4932ndashTaxi operation minus2568 2013ndashManufacture of other inorganic basic chemicals minus3524 1711ndashManufacture of pulp minus3631 4942ndashRemoval services minus4214 1092ndashManufacture of prepared pet foods minus4262 3040ndashManufacture of military fighting vehicles minus5508 2432ndashCold rolling of narrow strip minus6629
Source World Bank staff calculations based on SBS data set Note The table displays only sectors for which estimated coefficients are statistically significant
48
- 1 Introduction and motivation
- 2 Methodology
- 3 Data set
- 4 Results
-
- 41 Has corporate market power increased at the aggregate level How do aggregate trends differ across sectors Is there a group of firms driving the overall trend
- 42 How have firm dynamics influenced aggregate markup performance Are there signs of market power consolidation among incumbent firms
- 43 Do firm markups differ across firms with different attributes
- 44 What would be the productivity dividends from markup reduction
-
- 5 Conclusions
- References
- Annex 1 Additional figures and tables
-