
Rolta India Glaucus
32
“You can fool all of the people some of the time, and some of the people all of the time, but you cannot fool all of the people all of the time.” - Abraham Lincoln THIS RESEARCH REPORT EXPRESSES SOLELY OUR OPINIONS. THIS REPORT RELATES SOLELY TO THE VALUATION OF PUBLICLY TRADED BONDS ISSUED BY FOREIGN COMPANIES NOT INCORPORATED IN INDIA (ROLTA’S DELAWARE, USA, SUBSIDIARY) AND TRADED OVER THE COUNTER OUTSIDE OF INDIA, AND DOES NOT EXPRESS ANY OPINION AS TO THE VALUE OF ANY SECURITIES TRADED ON PUBLIC EXCHANGES IN INDIA OR ANY INSTRUMENT OR SECURITY ISSUED BY ANY ENTITY INCORPORATED IN INDIA. We have no investment interest in any security traded on any exchange in India or issued by an entity incorporated or located in India. We have a short interest in Rolta’s Delaware issued bonds and therefore stand to realize gains in the event that the price of such credit instruments declines. This report relates solely to our good-faith opinion of the valuation of such bonds and we express no opinion whatsoever as to the value of Rolta’s equity. Use Glaucus Research Group California, LLC’s research opinions at your own risk. This is not investment advice nor should it be construed as such. You should do your own research and due diligence before making any investment decisions with respect to the securities covered herein. Please refer to our full disclaimer located on the last page of this report. COMPANY: Rolta India Limited INVESTMENT IDEA: Short Delaware Issued 2018 and 2019 Corporate Bonds Instruments: Delaware 2018 & 2019 Bonds Price (as of 4/16/2015): 2018 Bonds: USD 104.50 2019 Bonds: USD 99.75 Auditor: Walker Chandiok & Co. LLP; Grant Thornton India LLP Recommendation: Strong Sell Price Target: USD: 0.16 Rolta India Limited (“Rolta ” or the “Company ”) is an information technology company with operations primarily in India and North America. In 2013 and 2014, Rolta issued an aggregate of US$ 500 million of junk bonds (the “Junk Bonds ”), which are due in 2018 and 2019, and have attracted investors by offering tempting yields. In our opinion, bondholders and ratings agencies have fallen for the myth of Rolta. Fitch rated Rolta’s Junk Bonds BB- because of the Company’s “current profitability levels [and] ability to generate free cash flow, ” and expects Rolta’s capital expenditures to come down as the Company supposedly transforms itself from a high-margin, higher-capital-expenditure business to a lower-margin, lower-capital-expenditure model. This is rubbish. Based on the evidence and analysis presented in this report, we believe that Rolta has fabricated its reported capital expenditures in order to mask that it has materially overstated its EBITDA. The margin for error is narrowing: Rolta’s net d ebt has risen from US$ 319mm at FYE 2011 to US$ 740mm in Q3 2015 and the Company has almost nothing to show for its highly suspicious spending. Rolta’s shares rallied recently on news that it was part of one of two consortiums selected in the final round to bid for the Ministry of Defense’s battlefield management contract. This rally seems premature. Rolta, together with Bharat Electronics Limited (BEL), has yet to win the contract – it must compete in the final stage with a rival consortium led by India’s Tata Power and Larsen & Toubro. Moreover, any revenue or profits generated by this contract, if Rolta’s consortium wins, will only be realized in four to five years (at the earliest), by which time we expect Rolta’s serial capital raising scheme to have unraveled. We believe that in reality, Rolta’s business does not generate free cash flow and that Rolta cannot repay foreign bondholders without refinancing. Indeed, we suspect Rolta approached foreign bond markets because it was unable to borrow in India. Ultimately, we believe that bondholders and ratings agencies have failed to price in evidence that Rolta has materially misstated its financial performance and the risk that Rolta will default on its Junk Bonds. We value the bonds at the recovery value of the offshore assets, which we estimate to be USD 0.16 on the dollar. 1. Evidence Suggests Capital Expenditure Fraud. From FYs 2008-2014, Rolta spent INR 70 billion (US$ 1.4 bln) on capital expenditures, an amount far in excess of the INR 43 billion (US$ 858 mm) in EBITDA that Rolta supposedly earned over this period. Rolta has little to show for such spending: its fixed asset turnover ratio was a dismal 0.7x (FYs 2012-2014), which is 93% less than an average of its putative peers. Rolta’s reported capital expenditures are deeply suspicious, with much of the reported spending disappearing into phantom prototypes, mysterious construction projects and computer systems of questionable authenticity and utility. In our view, the preponderance of the evidence suggests that the vast majority of Rolta’s reported capital expenditures have been fabricated. a. Computer Systems. From FYs 2011-2014, Rolta spent INR 31 billion (US$ 594 mm) on computer systems, representing 64% of the Company’s total capital expenditures during this period. Suspiciously, during this same period, Rolta disposed or scrapped INR 21.1 billion (US$ 396 mm) of computer systems (including over INR 5.9 billion (US$ 108.1 mm) of recently purchased equipment) and in return received only INR 77.2 million (US$ 1.3 mm). Put simply, over this period, Rolta incurred a cash loss equal to almost 100% of the money invested to purchase such equipment. i. Buy, Depreciate, Sell, Lose Money, and Repeat. Rolta appears to have purchased computer equipment, only to depreciate its value and scrap or dispose of it (usually for minimal value) within a short time of purchase. In FY 2013 alone, by depreciating the value of recently purchased computer equipment before disposing it, we believe that Rolta was able to conceal from analysts and investors that it sold or scrapped INR 16 billion (US$ 295 mm) of computer equipment for an almost total loss (including INR 5.9 billion (US$ 108.1 mm) of equipment which was purchased the previous year). Such losses are so staggering that we question the authenticity of the capital expenditures and suspect that the function of such dispositions is simply to provide a black hole on paper to mask the overstatement of the Company’s EBITDA.
-
Upload
asianextractor -
Category
Business
-
view
3.357 -
download
3
Transcript of Rolta India Glaucus

“You can fool all of the people some of the time, and some of the people all of the time, but you
cannot fool all of the people all of the time.” - Abraham Lincoln
THIS RESEARCH REPORT EXPRESSES SOLELY OUR OPINIONS. THIS REPORT RELATES SOLELY TO THE VALUATION OF PUBLICLY TRADED BONDS ISSUED
BY FOREIGN COMPANIES NOT INCORPORATED IN INDIA (ROLTA’S DELAWARE, USA, SUBSIDIARY) AND TRADED OVER THE COUNTER OUTSIDE OF INDIA,
AND DOES NOT EXPRESS ANY OPINION AS TO THE VALUE OF ANY SECURITIES TRADED ON PUBLIC EXCHANGES IN INDIA OR ANY INSTRUMENT OR
SECURITY ISSUED BY ANY ENTITY INCORPORATED IN INDIA. We have no investment interest in any security traded on any exchange in India or issued by an entity
incorporated or located in India. We have a short interest in Rolta’s Delaware issued bonds and therefore stand to realize gains in the event that the price of such credit
instruments declines. This report relates solely to our good-faith opinion of the valuation of such bonds and we express no opinion whatsoever as to the value of Rolta’s
equity. Use Glaucus Research Group California, LLC’s research opinions at your own risk. This is not investment advice nor should it be construed as such. You should
do your own research and due diligence before making any investment decisions with respect to the securities covered herein. Please refer to our full disclaimer located on
the last page of this report.
COMPANY: Rolta India Limited
INVESTMENT IDEA: Short Delaware Issued 2018 and 2019 Corporate Bonds
Instruments:
Delaware 2018 &
2019 Bonds
Price (as of 4/16/2015):
2018 Bonds:
USD 104.50
2019 Bonds:
USD 99.75
Auditor:
Walker Chandiok
& Co. LLP; Grant
Thornton India
LLP
Recommendation:
Strong Sell
Price Target:
USD: 0.16
Rolta India Limited (“Rolta” or the “Company”) is an information technology company with operations primarily in India and
North America. In 2013 and 2014, Rolta issued an aggregate of US$ 500 million of junk bonds (the “Junk Bonds”), which are
due in 2018 and 2019, and have attracted investors by offering tempting yields.
In our opinion, bondholders and ratings agencies have fallen for the myth of Rolta. Fitch rated Rolta’s Junk Bonds BB-
because of the Company’s “current profitability levels [and] ability to generate free cash flow,” and expects Rolta’s capital expenditures to come down as the Company supposedly transforms itself from a high-margin, higher-capital-expenditure
business to a lower-margin, lower-capital-expenditure model. This is rubbish.
Based on the evidence and analysis presented in this report, we believe that Rolta has fabricated its reported capital
expenditures in order to mask that it has materially overstated its EBITDA. The margin for error is narrowing: Rolta’s net debt
has risen from US$ 319mm at FYE 2011 to US$ 740mm in Q3 2015 and the Company has almost nothing to show for its highly suspicious spending.
Rolta’s shares rallied recently on news that it was part of one of two consortiums selected in the final round to bid for the
Ministry of Defense’s battlefield management contract. This rally seems premature. Rolta, together with Bharat Electronics
Limited (BEL), has yet to win the contract – it must compete in the final stage with a rival consortium led by India’s Tata Power and Larsen & Toubro. Moreover, any revenue or profits generated by this contract, if Rolta’s consortium wins, will
only be realized in four to five years (at the earliest), by which time we expect Rolta’s serial capital raising scheme to have
unraveled.
We believe that in reality, Rolta’s business does not generate free cash flow and that Rolta cannot repay foreign bondholders
without refinancing. Indeed, we suspect Rolta approached foreign bond markets because it was unable to borrow in India. Ultimately, we believe that bondholders and ratings agencies have failed to price in evidence that Rolta has materially
misstated its financial performance and the risk that Rolta will default on its Junk Bonds. We value the bonds at the recovery
value of the offshore assets, which we estimate to be USD 0.16 on the dollar.
1. Evidence Suggests Capital Expenditure Fraud. From FYs 2008-2014, Rolta spent INR 70 billion (US$ 1.4 bln) on
capital expenditures, an amount far in excess of the INR 43 billion (US$ 858 mm) in EBITDA that Rolta supposedly earned over this period. Rolta has little to show for such spending: its fixed asset turnover ratio was a dismal 0.7x (FYs
2012-2014), which is 93% less than an average of its putative peers. Rolta’s reported capital expenditures are deeply
suspicious, with much of the reported spending disappearing into phantom prototypes, mysterious construction projects and computer systems of questionable authenticity and utility. In our view, the preponderance of the evidence suggests
that the vast majority of Rolta’s reported capital expenditures have been fabricated.
a. Computer Systems. From FYs 2011-2014, Rolta spent INR 31 billion (US$ 594 mm) on computer systems,
representing 64% of the Company’s total capital expenditures during this period. Suspiciously, during this same
period, Rolta disposed or scrapped INR 21.1 billion (US$ 396 mm) of computer systems (including over INR 5.9 billion (US$ 108.1 mm) of recently purchased equipment) and in return received only INR 77.2 million (US$
1.3 mm). Put simply, over this period, Rolta incurred a cash loss equal to almost 100% of the money invested to
purchase such equipment.
i. Buy, Depreciate, Sell, Lose Money, and Repeat. Rolta appears to have purchased computer equipment,
only to depreciate its value and scrap or dispose of it (usually for minimal value) within a short time of
purchase. In FY 2013 alone, by depreciating the value of recently purchased computer equipment before
disposing it, we believe that Rolta was able to conceal from analysts and investors that it sold or scrapped INR
16 billion (US$ 295 mm) of computer equipment for an almost total loss (including INR 5.9 billion (US$ 108.1 mm) of equipment which was purchased the previous year). Such losses are so staggering that we
question the authenticity of the capital expenditures and suspect that the function of such dispositions is
simply to provide a black hole on paper to mask the overstatement of the Company’s EBITDA.

2
Rolta www.glaucusresearch.com
ii. Why Spend So Much on Computer Systems? On a gross basis (i.e., ex depreciation), as of FYE 2014, Rolta’s balance
sheet had US$ 99,873 (INR 6 mm) in computer systems per employee, which is 45 times more than a broad group of
Indian based IT companies, which strongly indicates that such purchases were not authentic.
b. Missing Buildings. Rolta’s reported capital expenditures on buildings are also highly suspicious. Between FYs 2010 and
2014, Rolta claims to have spent INR 9.5 billion (US$ 185 mm) on buildings. This is almost the value of the Mumbai
Indians, an IPL cricket club. Yet, during that time, Rolta did not disclose the acquisition or construction of any new buildings
or real property. In short, the Company appears to have nothing to show for its reported spending. Where did this money go?
c. Phantom Prototypes. In FY 2014, Rolta reported INR 8.4 billion (US$ 139.4 mm) of capital expenditures on the
development of prototypes. This is suspicious because Rolta’s maximum possible expenditure for prototypes for its two
most significant prospective procurement contracts is US$ 23.4 million (because the Indian Ministry of Defense covers 80%
of the cost of such prototypes). If Rolta spent a maximum of US$ 23.4 million on its two most salient prospective contracts,
we are highly suspicious that it spent another US$ 112.1 million in FY 2014 on prototypes for projects not disclosed to
investors.
d. Ikea be Damned. Perhaps the most absurd line item in Rolta’s capital spending is the reported investment in office furniture.
As of FYE 2014, Rolta’s balance sheet had US$ 10,493 of furniture and fixtures per employee, which is 7.1x greater than
Google, which has some of the most lavish corporate facilities of any business. Again, such capital expenditures simply
appear fabricated.
e. Capital Expenditures for the Benefit of Chairman’s Private Company. On its FY 2009 earnings call, Rolta’s CFO told
analysts that the Company planned to spend INR 1.5 billion (US$ 31 mm) on a new facility at Gurgaon. But Rolta failed to
disclose that the Gurgaon facility was (and is) owned by the Chairman’s private company. Worse still, following completion,
Rolta appears to pay the Chairman INR 156 million (US$ 2.5 mm) per year to lease the facility. Why would a Company pay
to construct a facility that it does not own and then also pay to lease it? We believe that either such spending is fabricated or
is simply a naked transfer of wealth to the Chairman.
f. Capex Significantly Exceeds Guidance. Typically, capital investment is reasonably foreseeable, at least in the near term.
Not for Rolta’s management team. Since FY 2009, Rolta has spent an average of 178% more on capital expenditures per year
than management guided to analysts in Q1 or Q2. A predictable pattern has emerged: early in each calendar year, Company
managers promise analysts and shareholders that capital expenditures will come down significantly, only for such
expenditures to skyrocket in Q3 and Q4. In our opinion, this indicates that management is either incompetent and does not
remotely understand its business or it is simply fabricating capital expenditures in Q3 and Q4 in order to mask overstated
earnings. We believe the latter.
2. Past is Prologue: 2004 Accounting and Tax Scandals. In 2004, the Securities and Exchange Board of India (“SEBI”)
concluded that Rolta had inappropriately inflated its reported revenues by 12-34% each year from 1996 through 2001, by
including the cost of capital equipment in its top-line revenue figures. Just one month later, India’s Income Tax Department (ITD)
deployed 100 agents to execute a simultaneous raid of the Company’s offices (and the residences of some directors and officers)
in an investigation alleging that Rolta claimed depreciation on fictitious assets in order to avoid taxes. Unbelievably, despite both
major tax and accounting scandals, neither Rolta’s independent directors on its audit committee nor its auditor were fired or
resigned. Nor, to our knowledge, was any other top level executive fired or forced to resign. In our view, such accounting and
tax scandals not only show that Rolta and its top-level managers have a propensity to manipulate the accounting of capital
expenditures in order to artificially inflate financial performance, but also that the Company’s senior managers appear almost
indifferent to the accounting, legal and ethical requirements to participate in global bond markets.
3. Undisclosed Procurement Scandal. In 2011, the Indian Defense Minister reportedly initiated an investigation into a lucrative
procurement contract awarded to Rolta. In January 2014, a television segment by Headlines Today reported that Col. Sujit
Banerjee, an Indian army officer who was a key witness in the case (it is unclear whether it was the same case from 2011 or new
allegations of corruption against the Company), was found dead in his hotel room before he was supposed to appear in a special
deposition before the Army’s court of inquiry regarding the matter.1 The salacious investigation appears to be ongoing, but Rolta
failed to disclose it in either its 2013 or 2014 bond prospectuses, which in our view is a material omission because the scandal
could jeopardize future contracts with the Indian government (Rolta’s largest source of revenue for its Indian business). These
incidents are also further evidence of the lack of transparency or accountability at Rolta.
______________________________________
1 http://headlinestoday.intoday.in/programme/intelligence-scandal-indian-army-rolta-geospatial-information-system-spook-purchases/1/340320.html
3
Rolta www.glaucusresearch.com
4. Questionable Transactions with Chairman. Rolta has engaged in numerous arrangements with Chairman
K.K. Singh to enrich him at the expense of bondholders.
a. Dividends Paid with Borrowed Funds. Since 2008, Rolta has paid out an aggregate of INR 4 billion
(US$ 82 mm) in dividends to shareholders. This primarily benefited Chairman K.K. Singh, who
during this period owned between 40%-50% of the Company’s outstanding shares. The problem is
that Rolta fails to generate free cash flow (net of capital expenditures), meaning that the Company is
borrowing money to pay such dividends, a practice which enriches its Chairman at the expense (and to
the risk) of bondholders.
b. Chairman’s Compensation Structure Incentivizes Overstatement of Profits. Publicly available
records from the Indian Ministry of Corporate Affairs show that the Chairman is entitled to a
commission equal to 5% of the net profits of the Company. Yet the Chairman was paid INR 61
million (US$ 1.2 mm) in commissions in FY 2012, even though Rolta reported a significant loss for
the year. The Chairman’s compensation structure is murky, appears arbitrary and incentivizes
accounting gimmicks to promote paper profits and massaged earnings.
5. Myth of Rolta. Rolta’s bond rating is based on the perception among ratings agencies and bond holders that
the Company is profitable (~35% EBITDA margins) and purportedly generates free cash flow. Looking deeper
undermines both supposed pillars of Rolta’s bond rating.
a. Rolta’s +70% Indian EBITDA Margins Are Not Credible. Rolta’s North American business loses
money (FYs 2011-2014), meaning that Rolta’s reported profitability is driven by suspiciously high
EBITDA margins for its Indian operations, which exceeded +70% in FYs 2013 and 2014. Such
margins, in our opinion, are simply absurd for any business. But it is doubly suspicious that Rolta’s
wildly profitable Indian subsidiary is also the entity responsible for Rolta’s pattern of questionable
capital expenditures.
b. Negative Free Cash Flow. Despite reporting consistent revenue growth and high EBITDA margins,
Rolta has not reported positive free cash flow before financing since 2006. This is a significant red
flag and similar to China Metal Recycling, a Hong Kong listed company which collapsed under
suspicion of fraud following our whistle-blower report to the market.
6. Valuation. Rolta tells bondholders that its debt to EBITDA ratio is ~4 to 1 (as of Q3 2015). We believe that in
reality, Rolta fails to generate positive EBITDA (in either its offshore or its Indian business). In our view,
Rolta has fabricated dubious capital expenditures in order to conceal the overstatement of profitability to
bondholders. We believe that Rolta will only be able to pay coupons with capital raised from debt or equity
markets, and that the Company will be unable to repay the bonds at maturity because they will not be able to
refinance them. Because foreign creditors must attempt to enforce their rights through India’s byzantine,
corrupt and slow judicial system, we think that much like international bondholders in other situations of Indian
corporate bond defaults (i.e., Zenith Infotech), any recovery of assets in India will be very difficult if not
impossible. Therefore, we think the bonds are worth the recovery value of the offshore assets and the offshore
business. All but two of Rolta’s international subsidiaries lose money, so we assumed that in a recovery
scenario creditors would be able to liquidate such subsidiaries for 7x EBT (a generous assumption). Assuming
Rolta kept US$ 50 million in cash offshore (67% of its cash balance as of Q3 2015), combined with US$ 5.8
million in offshore fixed assets (mostly real property), we estimate that offshore creditors will recover US$
0.16 cents on the dollar.
Ultimately, we believe that Rolta’s dubious capital expenditures are a smoking gun indicating that far from the
profitable and cash-flow-generating business that bondholders and ratings agencies thought they were
evaluating, in reality Rolta’s business is not profitable, and it does not and will not generate sufficient cash
to service its foreign debt or repay bondholders upon maturity (without refinancing). We believe that
neither bondholders nor ratings agencies have priced such information into Rolta’s Delaware bonds. This was
avoidable. After all, Rolta has done this before.
4
Rolta www.glaucusresearch.com
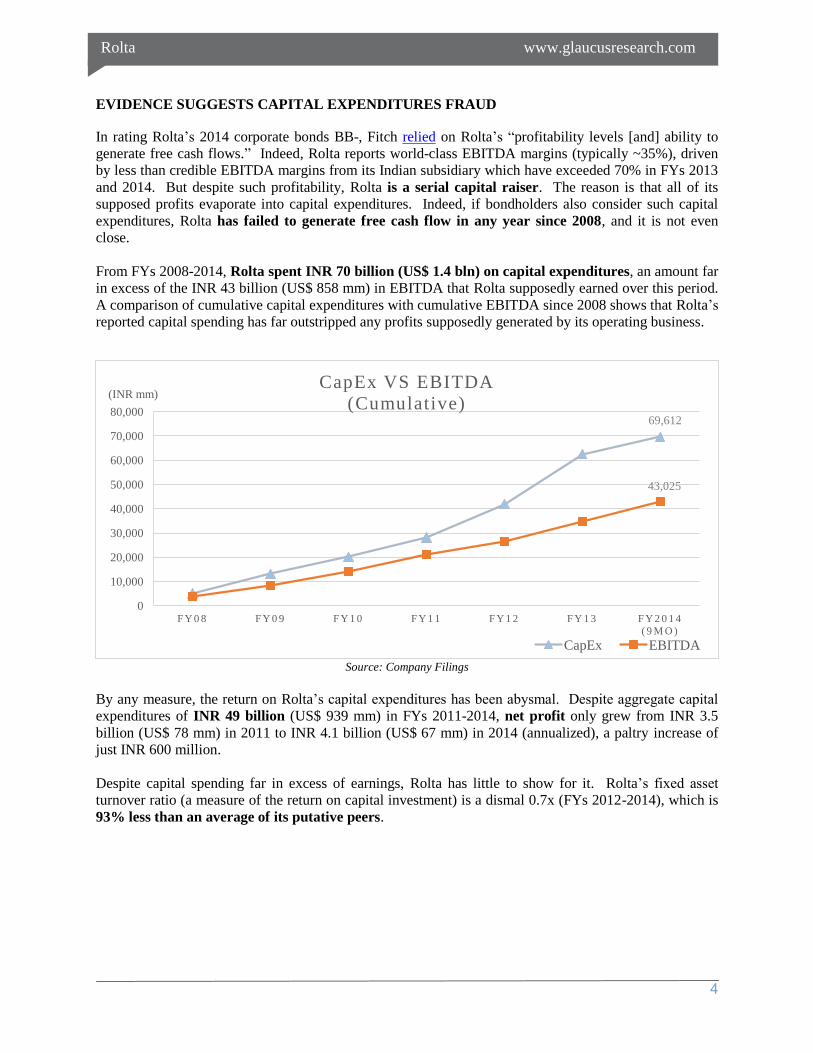
EVIDENCE SUGGESTS CAPITAL EXPENDITURES FRAUD
In rating Rolta’s 2014 corporate bonds BB-, Fitch relied on Rolta’s “profitability levels [and] ability to
generate free cash flows.” Indeed, Rolta reports world-class EBITDA margins (typically ~35%), driven
by less than credible EBITDA margins from its Indian subsidiary which have exceeded 70% in FYs 2013
and 2014. But despite such profitability, Rolta is a serial capital raiser. The reason is that all of its
supposed profits evaporate into capital expenditures. Indeed, if bondholders also consider such capital
expenditures, Rolta has failed to generate free cash flow in any year since 2008, and it is not even
close.
From FYs 2008-2014, Rolta spent INR 70 billion (US$ 1.4 bln) on capital expenditures, an amount far
in excess of the INR 43 billion (US$ 858 mm) in EBITDA that Rolta supposedly earned over this period.
A comparison of cumulative capital expenditures with cumulative EBITDA since 2008 shows that Rolta’s
reported capital spending has far outstripped any profits supposedly generated by its operating business.
Source: Company Filings
By any measure, the return on Rolta’s capital expenditures has been abysmal. Despite aggregate capital
expenditures of INR 49 billion (US$ 939 mm) in FYs 2011-2014, net profit only grew from INR 3.5
billion (US$ 78 mm) in 2011 to INR 4.1 billion (US$ 67 mm) in 2014 (annualized), a paltry increase of
just INR 600 million.
Despite capital spending far in excess of earnings, Rolta has little to show for it. Rolta’s fixed asset
turnover ratio (a measure of the return on capital investment) is a dismal 0.7x (FYs 2012-2014), which is
93% less than an average of its putative peers.
69,612
43,025
0
10,000
20,000
30,000
40,000
50,000
60,000
70,000
80,000
F Y 0 8 F Y 0 9 F Y 1 0 F Y 1 1 F Y 1 2 F Y 1 3 F Y 2 0 1 4
( 9 M O )
(INR mm) CapEx VS EBITDA
(Cumulative)
CapEx EBITDA

5
Rolta www.glaucusresearch.com
Fixed Asset Turnover
Company Name Industry 2012 2013 2014
NIIT IT Consulting and Other Services 8.5x 6.6x 7.9x
NIIT Technologies Systems Software 6.1x 6.6x 6.4x
Mindtree IT Consulting and Other Services 7.5x 9.0x 9.5x
Infosys IT Consulting and Other Services 6.5x 6.6x 6.6x
Tata Consulting IT Consulting and Other Services 8.6x 8.9x 9.0x
Siemens India Industrial Conglomerates 9.0x 7.8x 7.5x
Siemens Industrial Conglomerates 8.0x 7.5x 7.5x
Tech Mahindra IT Consulting and Other Services 7.3x 7.8x 12.0x
Wipro IT Consulting and Other Services 5.6x 6.8x 8.5x
Punj Loyd Construction and Engineering 4.2x 3.9x 3.6x
Bharat Electronics Aerospace and Defense 9.8x 8.4x 7.1x
Accenture IT Consulting and Other Services 35.6x 36.6x 38.1x
Honeywell Aerospace and Defense 7.7x 7.6x 7.6x
Capgemini IT Consulting and Other Services 18.9x 19.5x 20.1x
IBM IT Consulting and Other Services 7.5x 7.2x 7.5x
Microsoft Systems Software 9.0x 8.5x 7.6x
Cognizant IT Consulting and Other Services 8.5x 8.6x 8.8x
HCL Technologies IT Consulting and Other Services 10.1x 10.3x 10.9x
Rolta IT Consulting and Other Services 0.7x 0.6x 0.8x
Source: Capital IQ
* Rolta's 2014 operating results include Q1 2015 to adjust for change in FYE from
June to March 2014.
Company FYs 2012-2014 Fixed Asset Turnover Ratio
Rolta 0.7x
Putative Peer Group 10.1x
Difference -93%

6
Rolta www.glaucusresearch.com
Source: Capital IQ
A comparison of fixed asset turnover ratios shows that Rolta’s return for its capital expenditures is
abysmal. Compared to putative competitors (including other Indian IT solutions firms), Rolta’s return on
its investments is an order of magnitude lower. So if Rolta’s capital expenditures did not go into
increasing returns, where did the money go?
Rolta’s reported capital expenditures are deeply suspicious, with much of the reported spending
disappearing into phantom prototypes, mysterious construction projects and computer systems of
questionable authenticity and utility. In our view, the preponderance of the evidence suggests that most
of Rolta’s reported capital expenditures have either been fabricated or have been inappropriately
capitalized in order to inflate the Company’s reported EBITDA.

7
Rolta www.glaucusresearch.com
1) Computer Systems
Rolta claims that beginning in 2008, the Company underwent a transformation from a service-centric
business to a business centered on Rolta’s supposedly world-class intellectual property.1 The Company’s
2013 annual report even included a picture of a butterfly to underscore this process.
Source: Rolta 2013 Annual Report, p. 4-5.
Rolta told credit analysts and bondholders that its aggressive capital investments were necessary to
acquire and develop IP.2 But this was not the case. In reality, only 17% of Rolta’s capital expenditures
over this period went to intangible assets and acquisitions. The vast majority went to buildings and
computer systems.
1 Rolta 2013 Annual Report, p. 4-5. 2 Rolta 2013 Annual Report, p. 4-5.
Reported Annual Capex Spend - By Segment
Figures are in Rs million 2008 2009 2010 2011 2012 2013 2014 (9mo) Total
Freehold Land 2 5 89 - 12 - - 108
Leasehold Land - - - - - - - -
Buildings 483 1,640 1,266 843 3,190 3,434 815 11,670
Computer Systems 2,685 4,547 2,350 4,277 8,921 13,350 4,910 41,039
Office equipment 16 167 1,020 583 58 716 311 2,872
Furniture & Fixtures 43 275 467 480 5 588 158 2,017
Vehicles 42 1 - 2 - - 27 71
Intangibles - 454 1,868 1,759 1,511 1,097 909 7,598
Acquisitions 1,833 909 24 - - 1,470 - 4,236
Total 5,103 7,998 7,084 7,945 13,696 20,656 7,131 69,612
Computer Systems as % of TOTAL 52.6% 56.8% 33.2% 53.8% 65.1% 64.6% 68.9% 59.0%
Intangibles+Acquisitions 35.9% 17.0% 26.7% 22.1% 11.0% 12.4% 12.7% 17.0%
Source: Company Annual Reports FY09 AR
p100, 110-
111
FY10 AR
p104, 114
FY11 AR
p104, 112-
114
FY11 AR
p104, 112-
114
FY13 AR
p.97, 106
FY14 AR
p. 111, 122
FY14 AR
p. 111, 121-
122

8
Rolta www.glaucusresearch.com
Suspiciously, the Company has spent so much money on computer systems that such spending has almost
exceeded the EBITDA supposedly generated by the business.
Source: Company Annual Reports and Bond Prospectuses
What does Rolta have to show for such expenditures? Almost nothing.
a. Buy, Depreciate, Sell, Lose Money, Repeat
From FYs 2011-2014, Rolta spent INR 31 billion (US$ 594 mm) on computer systems, representing 64%
of the Company’s total capital expenditures during this period. Suspiciously, during this same period,
Rolta disposed of INR 21.1 billion (US$396 mm) of computer systems and in exchange received only
INR 77.2 million (US$ 1.3 mm). Rolta fell into a predictable pattern of acquiring computer systems and
then disposing such systems at a loss:
Source: Company Annual Reports and Bond Prospectuses

9
Rolta www.glaucusresearch.com
This resulted in wasted cash (or cash losses) exceeding INR 25.5 billion (US$ 493.1 mm) from FY
2008-2014, simply by purchasing and quickly disposing of computer equipment!
In the following chart, we analyze the disposal of computer systems to show Rolta’s highly suspicious
pattern of purchasing computer equipment only to dispose of it soon thereafter at a massive loss. In order
to filter out Rolta’s accounting gimmicks, we analyze the disposals of computer equipment on a gross
basis, assuming no depreciation. We also assume a FIFO system, meaning that we assume that in the
event of disposals, Rolta sold the oldest computer equipment first.
FY 2008 2009 2010 2011 2012 2013 2014 (9mo) Total
INRm
Opening balance 5,270.1 7,051.3 9,673.3 10,279.9 * 12,190.8 19,372.2 16,603.2
Additions 2,684.8 4,546.6 2,349.5 4,277.1 8,920.9 13,350.2 4,910.3 41,039.4
Acquisition 17.4 17.4
Disposals (903.6) (1,924.6) (1,695.4) (2,366.3) (1,953.0) (16,170.1) (642.6) (25,655.5)
Net exchange difference 213.5 33.5 17.8 264.9
Closing balance 7,051.3 9,673.3 10,327.4 12,190.8 19,372.2 16,603.2 20,888.8
6 years 0.0 0.0 0.0
5 years 0.0 0.0 0.0 0.0
4 years 0.0 0.0 0.0 0.0 0.0
3 years 746.5 1,017.5 3,611.1 0.0 0.0 5,375.1
2 years 2,441.9 2,684.8 4,546.6 2,349.5 0.0 2,559.5 14,582.4
1 year 4,366.5 2,684.8 4,546.6 2,349.5 4,277.1 3,202.1 13,401.1 34,827.8
New 2,684.8 4,546.6 2,349.5 4,277.1 9,134.4 13,401.1 4,928.1 41,321.7
Total 7,051.3 9,673.3 10,327.4 12,190.8 19,372.2 16,603.2 20,888.8 96,106.9
4 years 0.0 0.0 746.5 1,017.5 3,611.1 0.0 5,375.1
3 years 0.0 1,695.4 1,667.3 935.5 2,349.5 0.0 6,647.7
2 years 903.6 1,924.6 0.0 0.0 0.0 4,277.1 642.6 7,747.9
1 year 0.0 0.0 0.0 0.0 0.0 5,932.3 0.0 5,932.3
Total 903.6 1,924.6 1,695.4 2,413.8 1,953.0 16,170.1 642.6 25,703.0
Disposal of computer systems (no D&A)** 903.6 1,924.6 1,695.4 2,413.8 1,953.0 16,170.1 642.6 25,703.0
Cash from disposals 9.5 4.1 63.6 4.5 0.5 12.2 60.0 154.3
Loss assuming no depreciation** 894.1 1,920.6 1,631.8 2,409.3 1,952.5 16,157.9 582.5 25,548.7
% of loss** 99.0% 99.8% 96.2% 99.8% 100.0% 99.9% 90.7% 99.4%
Depreciation disposed
Computer equipment 903.5 1,885.5 1,667.2 1,973.1 1,494.9 16,050.4 642.3 24,617.0
Loss on disposal** (9.4) 35.1 (35.4) 436.2 457.6 107.5 (59.8) 931.7
Source: 2014 Bond Prospectus and Annual Reports
* Took out 47.5 INR million of the opening balance in 2011 to reflect the change in Rolta's FY11 annual report
** Glaucus calculation
Computer System Disposals as Reported by Rolta
Age of remaining computer systems**
Age of disposed computer systems**
Cash loss on disposal**

10
Rolta www.glaucusresearch.com
Assuming a FIFO disposal process, we can calculate both the age of the disposed computer systems and
Rolta’s cash loss on disposal (removing the effect of depreciation). Remarkably, during this period,
most of Rolta’s losses occurred on the disposition of relatively new computer equipment:
Source: 2014 Bond Prospectus, Rolta Annual Reports, Glaucus calculation
The most egregious example occurred in FY 2013, when Rolta purportedly disposed of INR 16 billion
(US$ 294.6 mm) of computer systems including INR 4.3 billion (US$ 77.9 mm) of equipment that was
only two years old and INR 5.9 billion (US$ 108.1 mm) of equipment that was purchased the
previous year.
In FY 2013, in exchange for selling or scrapping computer systems supposedly valued at INR 16 billion
(US$ 294.6 mm) (ex depreciation), Rolta received only INR 12.2 million (US$ 222,000)! In other
words, Rolta took an almost total loss on recently purchased equipment.
Worse, Rolta hid this loss from analysts and investors with an accounting gimmick. Rolta reduced the
useful asset lives of computer equipment from 4-10 years to 2-6 years, which permitted the Company to
depreciate the value of the disposed equipment to almost zero. This is why the Company took a massive
depreciation hit on computer equipment in FY 2013 (INR 12.4 billion (US$ 227 mm) in depreciation) and
reported a net loss for the year.
Source: 2014 Bond Prospectus p. 55

11
Rolta www.glaucusresearch.com
Rolta explained that it revised the estimated useful life of its assets out of ‘prudence.’ We believe that in
reality, Rolta revised the estimate so that it could depreciate the book value of the disposed computer
equipment to zero, saving Rolta from having to record a loss from the sale. Rolta was therefore able to
deduct such losses as an exceptional item and maintain the fiction with ratings agencies and bondholders
that such losses would not impact the Company’s future profitability.
Bondholders should also note that Rolta gives very little detail on such dispositions (or purchases),
making such transactions appear even more suspicious. From whom is Rolta purchasing such computer
systems? To whom is it disposing them?
Ultimately, Rolta’s cumulative cash losses on dispositions of recently acquired computer systems nearly
surpassed the Company’s reported cumulative EBITDA from FY 2008 through FY 2014. This leads
us to believe that rather than being bona fide capital investments, such purchases and related dispositions
are simply fabricated to mask similarly fabricated EBITDA.
Source: 2014 Bond Prospectus, Rolta Annual Reports, Glaucus calculation
b. Why Spend So Much Money on Computer Systems?
It is still unclear why Rolta needed to spend so much money on computer systems. On a gross basis (i.e.,
without accounting for depreciation), as of FYE 2014, Rolta balance sheet shows US$ 99,873 (INR 6
million) worth of computer systems per employee, which is as least 45 times more than its Indian
competitors. The apparent absence of utility supports other evidence suggesting such purchases were not
authentic.

12
Rolta www.glaucusresearch.com
Source: Capital IQ, Bloomberg, Company Filings, Company websites
There is no reason that Rolta’s spending on computer systems should so far exceed other companies
offering IT solutions. That Rolta has spent 45 times more on computer systems per employee than its
putative peers is simply further evidence, in our opinion, that such reported investments are merely
fabricated.
Computer Equipment per Employee at Last FYE
Name of Company Industry1
Market Cap
(in INR mm) 2
# of
Employees3
Computer
Equipment
(INR mm)3
Computer
Equipment per
Employee
(in INR)
Computer
Equipment per
Employee
(in USD)
Rolta
Spending
Multiples
Rolta IT Consulting and Other Services 27,732 3,500 20,889 5,968,214 99,873 -
NIIT IT Consulting and Other Services 6,417 2,942 1,697 576,798 9,652 10 x
Mindtree IT Consulting and Other Services 113,428 12,926 1,570 121,461 2,033 49 x
Infosys IT Consulting and Other Services 2,496,721 160,405 21,780 135,781 2,272 44 x
Tata Consulting IT Consulting and Other Services 4,980,360 300,464 34,642 115,293 1,929 52 x
Tech Mahindra IT Consulting and Other Services 607,801 98,009 10,075 102,797 1,720 58 x
Wipro IT Consulting and Other Services 1,563,385 133,425 8,508 63,766 1,067 94 x
Capgemini IT Consulting and Other Services 1,035,104 131,430 45,590 346,874 5,786 17 x
Cognizant IT Consulting and Other Services 2,257,899 211,500 25,488 120,513 2,017 50 x
HCL Technologies IT Consulting and Other Services 1,322,549 95,522 15,978 167,266 2,799 36 x
NIIT Technologies Systems Software 22,355 8,282 1,314 158,638 2,655 38 x
Note: The computer equipment balances are presented ex depreciation. Average 45 x
Source:
1. Capital IQ
2. Market Cap on Apr. 1 2015 on Bloomberg
3. Each company's latest fiscal year end annual report and its official website
13
Rolta www.glaucusresearch.com
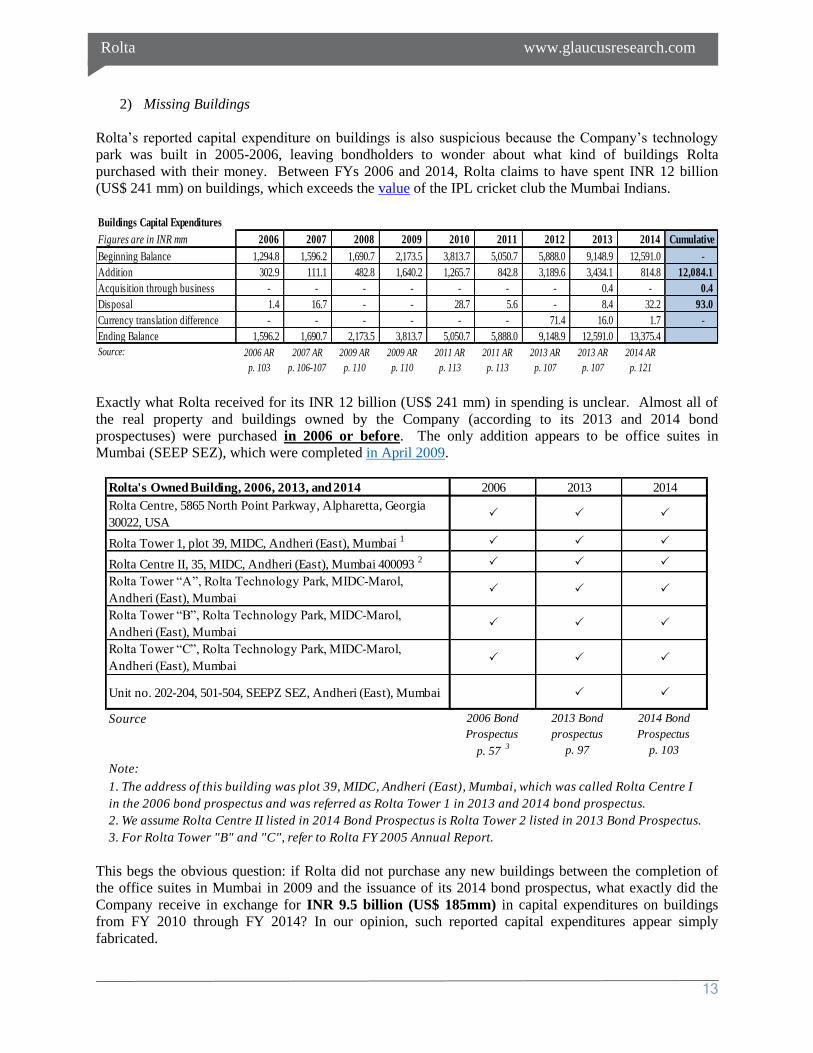
2) Missing Buildings
Rolta’s reported capital expenditure on buildings is also suspicious because the Company’s technology
park was built in 2005-2006, leaving bondholders to wonder about what kind of buildings Rolta
purchased with their money. Between FYs 2006 and 2014, Rolta claims to have spent INR 12 billion
(US$ 241 mm) on buildings, which exceeds the value of the IPL cricket club the Mumbai Indians.
Exactly what Rolta received for its INR 12 billion (US$ 241 mm) in spending is unclear. Almost all of
the real property and buildings owned by the Company (according to its 2013 and 2014 bond
prospectuses) were purchased in 2006 or before. The only addition appears to be office suites in
Mumbai (SEEP SEZ), which were completed in April 2009.
This begs the obvious question: if Rolta did not purchase any new buildings between the completion of
the office suites in Mumbai in 2009 and the issuance of its 2014 bond prospectus, what exactly did the
Company receive in exchange for INR 9.5 billion (US$ 185mm) in capital expenditures on buildings
from FY 2010 through FY 2014? In our opinion, such reported capital expenditures appear simply
fabricated.
Buildings Capital Expenditures
Figures are in INR mm 2006 2007 2008 2009 2010 2011 2012 2013 2014 Cumulative
Beginning Balance 1,294.8 1,596.2 1,690.7 2,173.5 3,813.7 5,050.7 5,888.0 9,148.9 12,591.0 -
Addition 302.9 111.1 482.8 1,640.2 1,265.7 842.8 3,189.6 3,434.1 814.8 12,084.1
Acquisition through business - - - - - - - 0.4 - 0.4
Disposal 1.4 16.7 - - 28.7 5.6 - 8.4 32.2 93.0
Currency translation difference - - - - - - 71.4 16.0 1.7 -
Ending Balance 1,596.2 1,690.7 2,173.5 3,813.7 5,050.7 5,888.0 9,148.9 12,591.0 13,375.4
Source: 2006 AR
p. 103
2007 AR
p. 106-107
2009 AR
p. 110
2009 AR
p. 110
2011 AR
p. 113
2011 AR
p. 113
2013 AR
p. 107
2013 AR
p. 107
2014 AR
p. 121
Rolta's Owned Building, 2006, 2013, and 2014 2006 2013 2014
Rolta Centre, 5865 North Point Parkway, Alpharetta, Georgia
30022, USAP P P
Rolta Tower 1, plot 39, MIDC, Andheri (East), Mumbai 1
P P P
Rolta Centre II, 35, MIDC, Andheri (East), Mumbai 400093 2
P P P
Rolta Tower “A”, Rolta Technology Park, MIDC-Marol,
Andheri (East), MumbaiP P P
Rolta Tower “B”, Rolta Technology Park, MIDC-Marol,
Andheri (East), MumbaiP P P
Rolta Tower “C”, Rolta Technology Park, MIDC-Marol,
Andheri (East), MumbaiP P P
Unit no. 202-204, 501-504, SEEPZ SEZ, Andheri (East), Mumbai P P
Source 2006 Bond
Prospectus
p. 57 3
2013 Bond
prospectus
p. 97
2014 Bond
Prospectus
p. 103
Note:
3. For Rolta Tower "B" and "C", refer to Rolta FY 2005 Annual Report.
1. The address of this building was plot 39, MIDC, Andheri (East), Mumbai, which was called Rolta Centre I
in the 2006 bond prospectus and was referred as Rolta Tower 1 in 2013 and 2014 bond prospectus.
2. We assume Rolta Centre II listed in 2014 Bond Prospectus is Rolta Tower 2 listed in 2013 Bond Prospectus.

14
Rolta www.glaucusresearch.com
3) Phantom Prototypes
In FY 2014, Rolta reported INR 8.4 billion (US$ 139.4 mm) of capital expenditures on the development
of prototypes for defense and homeland security. No further information is given on such prototypes, but
there is reason to doubt the authenticity of these reported expenditures.
The two largest defense and homeland security contracts for which Rolta is bidding require prototypes,
but such prototypes are paid for mostly (80%) by India’s Ministry of Defense and are projected to cost
well below US$ 139.4 million reportedly spent by the Company in FY 2014, even if Rolta is wins the
prospective contracts.
First, Rolta is bidding to provide a battlefield management system (“BMS”) to the Indian Army. The
procurement process requires a prototype projected to cost $67 million, with the MOD picking up 80% of
the cost.3 This means that Rolta’s total expenditures for a BMS prototype would be $13.4 million.
However, Rolta is bidding for the project as part of a consortium with Bharat Electronics,4 suggesting it
would share such expenses.
Second, Rolta is also bidding for a contract to build a tactical communication system (“TCS”) for the
Indian army. The prototype for the TCS is projected to cost US$ 50 million, with the MOD bearing 80%
of the cost.5 Rolta’s maximum total expenditure for this prototype (assuming it is bidding by itself) is
US$10 million.
Given that Rolta’s maximum expenditure for the prototypes for its two largest bids is a combined US$
23.4 million, we are highly suspicious that Rolta spent US$ 139.4 million on prototypes in FY 2014.
We are doubly suspicious considering that Rolta’s reported expenditures on prototypes exceeded the
reported EBITDA generated by the Indian business in FYs 2013 and 2014, respectively.
Where did this money go? What prototypes did Rolta build which supposedly swallowed almost all of the
firm’s profit? We believe, based on the preponderance of the evidence, that such expenditures were
simply fabricated to mask overstated earnings.
3 http://www.defensenews.com/article/20130722/DEFFEAT02/307220013/India-Goes-Local-Battle-System 4 2014 Bond Prospectus, p. 79. 5 http://www.defensenews.com/article/20131126/DEFREG03/311260019/Experts-Make-India-Approach-May-Undercut-New-
Comm-System
Maud Prototypes - Reported Expenditures
Figures are in INR mm 2013 (9 mo) FY14 (9 mo)
Revenue (Indian Business) 9,584 11,429
EBITDA (Indian Business) 6,947 8,089
Expenditures on prototypes 9,006 8,379
Note: numbers are for 9 months ended March 31 of each year
Source:
1. 2013 Bond Prospectus, p.66
2. 2013 Unconsolidated Annual Result
3. 2014 Bond Prospectus, p.70
4. 2015 Q2 Unconsolidated quarterly result

15
Rolta www.glaucusresearch.com
4) Ikea be Damned
Perhaps the most absurd line item in Rolta’s capital spending is its reported investment in office furniture
and fixtures. As of FYE 2014 (9 months), Rolta’s balance sheet had US$ 10,493 of furniture and fixtures
per employee, which is 7.1x greater than even Google, the Silicon Valley giant, which boasts some of
the most lavish and renowned corporate facilities of any business.
Rolta’s reported spending on fixtures and furniture appear prima facie absurd. We googled “most
expensive office chairs” and found the following list. One chair, the Wegner Swivel, costs $10,600, but
even on a list of the priciest chairs, most of the models appear to only cost around $4,000-$5,000. So
how is Rolta spending US$ 10,493 per person on furniture and fixtures?
By comparison, Google has perhaps the world’s most lavish (and renowned) corporate campus. Yet
Rolta’s balance of furniture and fixtures per employee is 7.1x greater than Google’s.
Much like reported capital expenditures on computer systems, buildings and prototypes, Rolta’s reported
spending on furniture and fixtures appears fabricated.
Rolta Gross Furniture and Fixtures
Figures are in INRm 2011 2012 2013 2014
Opening balance 1,027.5 1,506.7 1,529.9 2,117.2
Additions 480.4 4.6 588.4 158.4
Acquisition through business - - - -
Disposals (1.1) (6.6) (4.8) (1.6)
Net exchange difference - 25.2 3.7 2.4
Closing balance 1,506.7 1,529.9 2,117.2 2,276.4
Source: FY12 AR
p. 106
FY13 AR
p. 107
FY14 AR
p. 122
FY14 AR
p. 121
Rolta Gross Furniture and Fixture Per Employee
Figures are calculated per
employee (US$) 2011 2012 2013 2014
Opening balance 5,830.8 8,783.3 9,612.7 9,758.9
Additions 2,726.0 27.1 3,697.0 730.2
Acquisition through business - - - -
Disposals (6.3) (38.6) (30.0) (7.6)
Net exchange difference - 146.7 23.2 11.0
Closing balance 8,550.5 8,918.4 13,302.9 10,492.5
Source: Company's FY12-14 annual report
Gross Furniture and Fixture Per Employee
Figures are calculated per
employee (US$) 2011 2012 2013 2014
Rolta 8,550.5 8,918.4 13,302.9 10,492.5
Google 2,002.0 1,373.9 1,612.4 1,473.9
Accenture 1,368.2 1,219.3 1,117.1 1,050.3
Wipro 1,326.5 1,040.3 1,012.8 1,035.3
Source: Companies' public filings

16
Rolta www.glaucusresearch.com
5) Capital Expenditures for the Benefit of the Chairman’s Private Company
On Rolta’s FY 2009 earnings call, management projected that the Company’s largest capital
expenditure in 2010 would be for a new facility in Gurgaon, a city outside of Delhi. Hiranya Ashar,
Rolta’s Director of Finance and Chief Financial Officer, told analysts and investors that the Gurgaon
facility would cost Rolta roughly INR 1.5 billion (150 crores) (US$ 31 mm):
Source: FY 2009 Earnings Conference Call
There is evidence that Rolta actually built the Gurgaon facility. The Company discloses in its 2014 Bond
Prospectus that it is currently involved in litigation over an air conditioning system that it paid to have
installed in the building.
2014 Bond Prospectus, p. 104.
Despite evidence that Rolta incurred capital expenditures to build the Gurgaon facility, it appears that this
project was for the benefit Chairman’s private company!
Publicly available records from the Indian Ministry of Corporate Affairs show that Rolta Limited, a
private company owned and controlled by Chairman K.K. Singh, owns the building and land at
Gurgaon. The Indian records show that the Chairman’s private company, Rolta Limited, pledged the
Gurgaon land as collateral to the Union Bank of India to secure a loan.
Source: MCA Filings

17
Rolta www.glaucusresearch.com
Furthermore, Rolta discloses that it pays Rolta Limited INR 156.4 million (US$ 2.5 mm) per annum to
lease the Gurgaon building.6 If the facility was completed in 2010, Rolta has presumably paid an
aggregate of INR 821 million (US$ 13 mm) simply to lease the property from the Chairman.
We could find no evidence from Rolta’s annual reports or bond prospectuses that the Company ever
received consideration for either selling the building to the Chairman or a reimbursement for the
expenditures, therefore we presume that such expenditures are still on Rolta’s balance sheet.
We believe that there are two likely explanations for this transaction. Perhaps this transaction was a
naked transfer of wealth from the public Company to the Chairman, and in that case, would underscore
that the Chairman seems to run Rolta for his personal benefit (at the expense of the best interests of the
Company and its bondholders) and that Rolta has consistently failed to achieve in the minimum level of
transparency regarding its operations and business. But it could also be another example in a long line of
recurring expenditures for which Rolta has little or nothing to show, suggesting, in our opinion, that such
capital expenditures were fabricated.
6) Capital Expenditures Significantly Exceeds Guidance
Typically, capital investment is reasonably foreseeable, especially in the near term. Not for Rolta’s
management team. Despite annual (and typically quarterly) promises from Rolta’s management to limit
capital spending, in reality Rolta’s capital expenditures significantly and routinely exceed management’s
guidance. Since 2009, Rolta has spent an average of 178% more on capital expenditures each year
than it guided to analysts in Q1 or Q2.
The following chart compares management earliest capital expenditures guidance (typically in Q1 or Q2)
with amount that the Company reportedly spent on capital expenditures in that year.
The following are particularly egregious examples of misleading guidance to analysts and investors. On
the 2011 Q2 earnings call, management claimed that capital expenditures were poised to decrease in the
second half of FY 2011 and reiterated that it expected to spend a total of INR 3 billion (US$ 66 mm) for
the entire year. True to form, the Company actually spent INR 8.4 billion (US$ 185 mm) in FY 2011,
with an additional INR 6.7 billion (US$ 148 mm) coming in the second half.
6 2014 Bond Prospectus, p. F-29. Rolta paid Rolta Limited INR 117.3 million rent for the nine months ended March 31 2014, so
the 12 month rent would be INR 156.4 million.
Capital Expenditures: Spending Exceeds Q1/Q2 Guidance
Figures are in INRmm
Year
Earliest Q
guided Guidance
CapEx per
AR Difference
% Increase in
Spending vs.
Guidance
2009 Q2 4,800 9,037 4,237 88.3%
2010 Q1 3,000 6,653 3,653 121.8%
2011 Q2 3,000 8,393 5,393 179.8%
2012 Q2 3,000 13,932 10,932 364.4%
2013 Q1 3,000 17,483 14,483 482.8%
2014 (9m) Q1 6,199* 8,462 2,263 36.5%
Total 22,999 63,961 40,962 178.1%
* During Q1 2014 conference call, Maud disclosed target CapEx was US$ 100 mm so
we used the average exchange rate on FY14 AR p. 107 to convert it to INR million.
Source: Company Conference Calls and public filings

18
Rolta www.glaucusresearch.com
On the 2012 Q2 conference call, management stated that capital expenditures would not exceed INR 3
billion (US$ 60 mm) for the year and reported spending INR 1.6 billion to INR 1.65 billion (US$ 32 to 33
mm) in the first half. The Company spent a further INR 12 billion (US$ 244 mm) in 2H 2012, meaning
Rolta’s aggregate capital expenditures for the year were 364% higher than guided to analysts after the
first half.
In 2013, management guidance in Q1 was INR 3 billion (US$ 55 mm) for the year, even though Rolta
ended up spending INR 17.5 billion (US$319 mm) for the year, 483% above what management told
analysts to expect.
Another example is particularly egregious. In Rolta’s 2013 bond prospectus, the Company stated that its
budgeted capital expenditures for FY 2013 (ending June) were US$ 200 million, of which Rolta had
already spent US$ 143 million as of March 2013.7 However, in Rolta’s subsequent filings, the Company
reported that capital expenditures for FY 2013 were US$ 350 million.8 In just three months, the
Company spent an additional US$ 207 million, bringing its total expenditures for FY 2013 to 75% over
budget. How could management, in March 2013, not have foreseen such large capital expenditures in the
last three months of the fiscal year?
Management’s erroneous and misleading capital expenditures guidance suggests two alternatives. First,
management could be totally incompetent. Capital expenditures are usually longer term investments,
which those closest to the business should be able to reliably anticipate and model, at least in the near
term. Perhaps management is so incapable that they routinely fail to make even remotely correct
assumptions about the near-term investments necessary to remain competitive and grow their business.
The second possibility is more sinister. Management could be deliberately misleading the market as to
Rolta’s future capital expenditures because such expenditures are not driven by a business need or the
Company’s strategy, but rather are an accounting gimmick designed to conceal fabricated earnings.
We believe that the sinister explanation is most likely correct, simply because the Company, and the same
management team, has manipulated capital expenditures to fabricate revenues once before.
7 Rolta 2013 Bond Prospectus, p. 65. 8 Rolta 2014 Bond Prospectus, p. F-137.

19
Rolta www.glaucusresearch.com
PAST IS PROLOGUE – 2004 ACCOUNTING & TAX SCANDALS
In 2004, the Securities and Exchange Board of India (“SEBI”) concluded that Rolta had inappropriately
inflated its reported revenue figures by including the cost of capital equipment transferred between its
subsidiaries in its top-line sales figures for seven years.9
For example, by recognizing the cost of capitalized fixed assets in its revenue figures, Rolta reported
18.1% year-over-year revenue growth in 2001, despite the fact that the Company’s actual revenue growth
was 7.3%.10
The following chart, taken from SEBI’s findings in its investigation, shows that Rolta
artificially inflated sales by 12-34% each year from 1996 through 2001.
Source: SEBI Order
Sources: SEBI Order; Glaucus Calculation
The obvious impact of the accounting manipulation was to boost the Company’s reported sales,
misleading investors into believing that Rolta’s sales were both greater and growing faster than was true.
This in turn artificially inflated Rolta’s stock price and presumably allowed the Company to raise more
9 http://articles.economictimes.indiatimes.com/2004-07-23/news/27411724_1_capital-equipment-sebi-accounting-practices 10 http://articles.economictimes.indiatimes.com/2004-07-23/news/27411724_1_capital-equipment-sebi-accounting-practices
Year
Reported
Revenues
Capitalized Costs Which
Should NOT Have Been
Included
% Inflation
of Sales
1996 76.31 8.23 12%
1997 100.63 23.43 30%
1998 120.69 13.80 13%
1999 184.85 27.29 17%
2000 255.86 45.09 21%
2001 302.65 76.03 34%

20
Rolta www.glaucusresearch.com
money from the capital markets than it otherwise would have been able had it reported its true sales
figures.
In July 2004, SEBI issued a show cause notice to the Company and declared that the practice was a
violation of the provisions of the Prohibition of Fraudulent and Unfair Trade Practice for its potential to
mislead investors.11
Despite evidence that Rolta systematically and repeatedly misled investors about its financial
performance, SEBI merely ordered the Company to “discontinue its practice of including the cost of self-
assembled capital equipment or any capitalizable item in the sales/revenue henceforth, and not to adopt,
in future, any accounting practice inconsistent with relevant Indian or international Accounting
standards.”12
This punishment seems extraordinarily light. In our opinion, the practice of inflating revenue by
including capitalized costs does not seem like an honest accounting error or a misinterpretation of an
accounting standard – such a practice seems a deliberate manipulative action to artificially inflate a
Company’s stock price by overstating reported financial performance.
Rolta’s troubles continued. In August 2004, just one month after SEBI’s show-cause notice, India’s
Income Tax Department (ITD) deployed 100 agents to execute a simultaneous raid of the Company’s
headquarters and nearly 24 other premises in an investigation alleging that Rolta claimed depreciation on
fictitious assets in order to avoid taxes. ITD agents also raided the residences of Rolta’s CEO and several
directors.
Ordinarily, evidence of possible accounting fraud from ten years ago may not concern bondholders –
except in this case. That is because, amazingly, neither the audit committee members nor the
auditors who presided over the tax and accounting scandals were fired or replaced – they continued
to serve the Company in the same functions until 2013!
Independent director R.R. Kumar served as an independent director and a member of the audit committee
from 1997 to November 2013. K.R. Modi served as an independent director and a member of the audit
committee from 1997 until the present day. Both were independent directors and members of the audit
committee during the period in which SEBI reported that Rolta inappropriately inflated revenues and in
2004, when agents from the Indian Tax Department raided the Company’s offices.
Likewise, Khandelwal Jain & Co served as the Company’s auditors from FY 1997 to FY 2013, including
during the period from 1997-2001 during which Rolta reportedly manipulated capital expenditures to
inflate its revenues.
Unbelievably, despite the occurrence of major accounting and tax scandals, neither the independent
directors nor the auditor were replaced. To our knowledge, neither was any top level executive.13
11 http://www.thehindubusinessline.com/2004/07/24/stories/2004072401751500.htm 12 http://articles.economictimes.indiatimes.com/2004-07-23/news/27411724_1_capital-equipment-sebi-accounting-practices 13 CFO V.L. Ganesh resigned in 2006, but there is no indication that he resigned in connection with either the findings of
accounting misconduct by SEBI nor the allegations of the ITD that Rolta claimed depreciation on fictitious assets to avoid taxes.

21
Rolta www.glaucusresearch.com
Source: Company Annual Reports, FYs 1997-2014.
This is a significant red flag. The audit committee members and the external auditor were either
complicit in the inappropriate inflation of revenues or were not sufficiently vigilant or competent to detect
it. By even the most lax corporate governance standards, both should have been replaced following
SEBI’s 2004 findings of material misrepresentations in Rolta’s financial statements.
In our view, the tax and accounting scandals not only show that Rolta and its top-level managers have a
propensity to manipulate the accounting of capital expenditures in order to artificially inflate financial
performance, but also that the Company’s senior managers appear almost indifferent to the accounting,
legal and ethical standards required to participate in global bond markets.
Mr R R Kumar Mr K R Modi
2014 M/s. Walker Chandiok & Co. 2014Independent Director*
Retired Nov. 2013Independent Director
2013 M/s. Khandelwal Jain & Co. 2013Independent Director
Audit Committee Member
Independent Director
Audit Committee Member
2012 M/s. Khandelwal Jain & Co. 2012Independent Director
Audit Committee Member
Independent Director
Audit Committee Member
2011 M/s. Khandelwal Jain & Co. 2011Independent Director
Audit Committee Member
Independent Director
Audit Committee Member
2010 M/s. Khandelwal Jain & Co. 2010Independent Director
Audit Committee Member
Independent Director
Audit Committee Member
2009 M/s Khandelwal Jain & Co. 2009Independent Director
Audit Committee Member
Independent Director
Audit Committee Member
2008 M/s Khandelwal Jain & Co. 2008Independent Director
Audit Committee Member
Independent Director
Audit Committee Member
2007 M/s Khandelwal Jain & Co. 2007Independent Director
Audit Committee Member
Independent Director
Audit Committee Member
2006 M/s Khandelwal Jain & Co. 2006Independent Director
Audit Committee Member
Independent Director
Audit Committee Member
2005 M/s Khandelwal Jain & Co. 2005Independent Director
Audit Committee Member
Independent Director
Audit Committee Member
2004 M/s Khandelwal Jain & Co. 2004Independent Director
Audit Committee Member
Independent Director
Audit Committee Member
2003 M/s Khandelwal Jain & Co. 2003Independent Director
Audit Committee Member
Independent Director
Audit Committee Member
2001 M/s Khandelwal Jain & Co. 2001Independent Director
Audit Committee Member
Independent Director
Audit Committee Member
2000 M/s Khandelwal Jain & Co. 2000Director
Audit Committee Member
Director
Audit Committee Member
1999 M/s Khandelwal Jain & Co. 1999 Director Director
1998 M/s Khandelwal Jain & Co. 1998 Director Director
1997 M/s Khandelwal Jain & Co. 1997 Director Director
Auditor

22
Rolta www.glaucusresearch.com
INVESTIGATIONS INTO ARMY CONTRACTS
In 2011, Indian Defense Minister A.K. Antony reportedly ordered an investigation into possible
corruption regarding a lucrative procurement contract that the Ministry of Defense awarded to Rolta.
Neither the existence nor the results of this investigation were discussed in either of Rolta’s bond
prospectuses (2013 or 2014) nor to our knowledge, ever disclosed to bondholders.
In December 2011, respected Indian daily The Hindu published an investigative report alleging that the
Indian army’s defense capabilities were compromised by flawed and possibly corrupt procurement
contracts awarded to Rolta. In 1996, the Ministry of Defense awarded a contract to Rolta to provide
photogrammetric and geographical information system software to India’s military intelligence division,
MI17. The Hindu reported that in 2008, dubious negotiations relieved Rolta’s burden of upgrading the
software, which reportedly resulted in a material degradation of performance.
The investigative report alleged that procurement negotiations were possibly corrupt. It pointed out that
Brigadier Anjum Shahab, who was a member of the committee that renewed Rolta’s contract in 2008,
went to work for Rolta shortly thereafter, raising the specter of a corrupt quid pro quo. Indeed, Rolta’s
2008-2009 Annual Report lists Shahab as its regional director of defense.
The Hindu also alleged that under the contract, Rolta was supplying the Ministry of Defense with
Integraph’s GIS software without a license, implying that rather than develop its own proprietary
solutions, Rolta had simply misappropriated the intellectual property of an American company and resold
under the Rolta brand name to the Indian Army.
In 2011, following the investigative report, Indian Defense Minister A.K. Anthony reportedly ordered a
full investigation into the allegations of corruption against Rolta. Coverage of the investigation is not
available – most likely because of the classified nature of defense proceedings.
In January 2014, a television spot by Headlines Today reported that the Indian Army had begun
investigation into secret surveillance equipment worth ~300 crore which the army had purchased from
Rolta. It is unclear whether the report referred to a new corruption investigation into defense contracts
awarded to Rolta or is a continuation of 2011 investigation, but proceedings took a macabre turn.
Headlines Today reported that Col. Sujit Banerjee, an Indian army officer was a key witness in the case
against Rolta, was found dead in his hotel room before he was supposed to appear in a special
deposition before the Army’s court of inquiry regarding the matter.14
Allegations of corruption are troubling. Reports of the suspicious death of a key witness against Rolta
before he could testify are salacious. But the failure to disclose the investigation or proceedings to
bondholders is a material omission because this scandal could result in a fine or financial penalty and it
could undermine Rolta’s eligibility to qualify for or obtain future contracts from the Ministry of Defense
or the Indian Army. Because the Indian government is Rolta’s primary source of revenue, the scandal
could have a material impact on the Company’s future performance.15
14 http://headlinestoday.intoday.in/programme/intelligence-scandal-indian-army-rolta-geospatial-information-system-spook-
purchases/1/340320.html. 15 2014 Bond Prospectus, p. 57.

23
Rolta www.glaucusresearch.com
CHAIRMAN’S QUESTIONABLE DEALINGS
We believe that Chairman K.K. Singh runs Rolta for his own benefit and to the detriment of other
stakeholders. The Company has continued to engage in a number of questionable transactions which
appear to enrich its Chairman at the expense of the Company and bondholders.
1) Dividends Funded by Borrowings
Rolta has paid out an aggregate of INR 4 billion (US$ 82 mm) in dividends from 2008 through 2014.
During this period, the Chairman owned between 40%-50% of the Company’s outstanding shares.
Therefore, he was the primary beneficiary of any dividends declared and distributed by the Company.
Normally, this would not be a problem, but in this case, Rolta pays out large dividends each year despite
the fact that it fails to generate free cash flow because of its highly suspicious capital expenditures.
Source: Company Filings
The above graph illustrates that despite the fact that Rolta consistently fails to generate free cash flows,
the Company aggressively pays out dividends for the primary benefit of its Chairman. Rolta raises or
borrows cash to pay such dividends, to the detriment to bondholders.
2) Chairman’s Murky Compensation Structure
Nor is Rolta remotely transparent regarding the Chairman’s compensation. It discloses to bondholders
that K.K. Singh’s is compensated through a commission calculated on the net profits of the Company, but
does not disclose either the amount of such commission nor how it is calculated.
(3,468) (2,769) (2,593)
(637)
(3,645)
(6,841)
(2,222)
(450)
1,581 1,745
507
3,485
8,149
1,165
470
572 573
615 656
563
566
-
100
200
300
400
500
600
700
(8,000)
(6,000)
(4,000)
(2,000)
-
2,000
4,000
6,000
8,000
10,000
2008 2009 2010 2011 2012 2013 2014 - 9mo
Reported Cash Flows
CFO +CFI CFF Dividend paid
Unit: INRm

24
Rolta www.glaucusresearch.com
Source: 2014 Bond Prospectus, p. 114.
A public record search on the website of India’s Ministry of Corporate Affairs (“MCA”) shows that K.K.
Singh is entitled to 5% of the net profits of the Company and various other amenities, including
servants.
Source: MCA Public Records
This incentive structure seems to be arbitrarily applied, because in FY 2012, Rolta paid Chairman Singh
INR 61 million (US$ 1.2 mm) even though Rolta reported a net loss. Even by Wall St. standards, a
compensation package entitling the Chairman to 5% of net profits appears shamefully generous. But at
the very least, the Chairman should abide by this deal when the Company loses money.
In addition, the Company amended a royalty agreement in 2012 to license the right to use the ‘Rolta’
trademark from a K.K. Singh-owned shell company. In exchange, Rolta agreed to pay the Chairman
0.2% of the Company’s annual revenues.16
In 2013 and 2014, Rolta has already paid the Chairman
almost INR 96 million (US$ 1.7 mm) simply to use the trademark.17
The Chairman’s commission for the use of the trademark ‘Rolta’ is especially egregious because for the
22 years prior to 2012 amendment, K.K. Singh assigned the brand name to the Company royalty free.18
In our opinion, it appears that the more cash Rolta is able to borrow from foreign creditors, the greater the
Chairman’s appetite.
The problem with the Chairman’s murky compensation structure is that it clearly incentivizes him to use
accounting gimmicks to artificially inflate both revenues and profits when the Company’s underlying
performance is middling or poor. K.K. Singh presided over Rolta when the Company inappropriately
manipulated its reported financial performance from 1997-2001, which in our view, creates a reasonable
suspicion that given the proper incentives, he might do so again.
16 2014 Bond Prospectus, p. 121-122. 17 2014 Annual Report, p.128, 143 and 144. 18 2014 Bond Prospectus, p. 121-122.

25
Rolta www.glaucusresearch.com
MYTH OF ROLTA
In rating Rolta’s 2014 corporate bonds BB-, Fitch relied on Rolta’s “profitability levels [and] ability to
generate free cash flows.” Indeed, Rolta reports world-class EBITDA margins (typically ~35%) and
supposedly generates cash from operations. But a deeper look undermines both supposed pillars of
Rolta’s bond rating.
1) Rolta’s +70% Indian EBITDA Margins are Not Credible
Although Rolta reports consolidated EBITDA margins of ~35%, Rolta’s North American business
operates at a loss, meaning that such reported profitability is driven by EBITDA margins from Indian
operations which have topped 70% in FYs 2013 and 2014. Such disparities are not driven by inter-
company transactions or transfer pricing between Rolta’s subsidiaries, as Rolta discloses few related party
transactions between off-shore subsidiaries and the Indian parent company.19
19 Rolta 2014 Bond Prospectus, p. 162.
Reported Sales Breakdown
Figures are in INR mm FYE2011 FYE2012 FYE2013 FYE2014
Consolidated - Rolta1 18,056 18,288 21,788 25,017
North American and Australia Subsidiaries2 3,085 3,473 11,326 12,939
Standalone - Rolta India Limited (Indian Operating Subsidiary)3 14,488 14,681 13,109 11,429
Reported EBITDA Breakdown
Figures are in INR mm FYE2011 FYE2012 FYE2013 FYE2014
Consolidated - Rolta1 7,147 5,358 7,917 8,441
North American and Australia Subsidiaries2 (259) (206) (243) (132)
Standalone - Rolta India Limited (Indian Operating Subsidiary)3 7,822 8,621 9,350 8,089
Reported EBITDA Margin FYE2011 FYE2012 FYE2013 FYE2014
Consolidated - Rolta 40% 29% 36% 34%
North American and Australia Subsidiaries -8% -6% -2% -1%
Standalone - Rolta India Limited (Indian Operating Subsidiary) 54% 59% 71% 71%
Source:
1. Company's FY11 AR p. 103, FY13 AR p. 96, FY14 AR p. 110
2. Company's 2013 Bond Prospectus p. F-40, 2014 Bond Prospectus p, F-149
3. Company's FY11 AR p. 128, FY12 AR p. 121, FY13 AR p. 123, FY14 AR p. 137
5. Rolta's Europe and Middle East subsidiaries are not included as their revenue contribution are negligible.
4. Rolta consolidated financial statements follow IFRS; Rolta India standalone financial statements follow Indian GAAP;
North American and Australia Subsidiaries' financial statements follow US GAAP.

26
Rolta www.glaucusresearch.com
Source: Company Filings
As the above charts make clear, Rolta’s North American business is a loss leader, and the profitability so
critical to the Company’s bond rating is driven by an Indian subsidiary which reported EBITDA margins
of 71% in FYs 2013 and 2014. We struggle to understand how Rolta could post 70%+ EBITDA margins
when Oracle, a technology solutions leader which owns and builds the software platforms upon which
many of Rolta’s ‘solutions’ are based, reports 46% EBITDA margins.
It is also critical to note that even though Rolta’s North American business contributes an increasing
amount of the Company’s revenues (and is the primary driver of revenue growth), it is Rolta’s Indian
business which owns of the vast majority of the Company’s non-current assets and which binges on
questionable capital expenditures.
Reported Revenue and Non-current Asset by Geographic Location
Figures are in INR mmRevenue
Non-cureent
AssetRevenue
Non-cureent
AssetRevenue
Non-cureent
AssetRevenue
Non-cureent
Asset
India 11,291 21,799 10,517 31,375 9,590 42,227 9,260 47,697
North America 4,516 3,524 5,473 4,185 11,326 7,090 13,605 6,797
Other Countries 2,249 11 2,298 10 872 10 2,152 16
Total 18,056 25,334 18,288 35,570 21,788 49,328 25,017 54,510
Source:
RevenueNon-cureent
AssetRevenue
Non-cureent
AssetRevenue
Non-cureent
AssetRevenue
Non-cureent
Asset
India 63% 86% 58% 88% 44% 86% 37% 88%
North America 25% 14% 30% 12% 52% 14% 54% 12%
Other Countries 12% 0% 13% 0% 4% 0% 9% 0%
Total 100% 100% 100% 100% 100% 100% 100% 100%
2011 2012 2014 9months
2011 AR p. 121 2013 AR p. 115 2013 AR p. 115 2014 AR p. 130
2013
2014 9months2011 2012 2013

27
Rolta www.glaucusresearch.com
Source: Company Filings
The 71% EBITDA margin reported in FYs 2013 and 2014 by Rolta’s Indian operation is a priori not
credible. But it is even more suspicious that Rolta’s Indian business is also the asset-heavy subsidiary
which engages in a pattern of capital spending which, in our opinion, appears clearly fabricated.
The implications are profound for bondholders. A pillar of Fitch’s rating on Rolta’s bonds was the
Company’s supposed profitability. But upon closer examination such figures appear not credible, and
support evidence discussed in this report suggesting in our opinion, that Rolta’s fabricated capital
expenditures are simply masking overstated earnings.
2) No Free Cash Flow
The second pillar of Rolta’s bond rating, a record of generating free cash flow, is simply not true. If
bondholders also consider Rolta’s questionable capital expenditures, Rolta has failed to generate free
cash flow in any year since 2006. It is not even close. That is why despite such spectacular profitability,
Rolta is a serial capital raiser.

28
Rolta www.glaucusresearch.com
Source: Company Filings
Rolta does not generate free cash despite reporting staggering profitability because such cash is “spent”
on capital expenditures of dubious authenticity. This is a significant red flag and similar to China Metal
Recycling and China Lumena, two listed companies which collapsed under suspicion of fraud following
our whistle-blower reports to the markets.
Ultimately, the two pillars of Rolta’s bond rating, profitability and free cash flow, are undermined by a
deep dive into the Company’s capital expenditures. We do not believe that Rolta’s business is profitable,
and evidence shows it fails to generate cash – yet bondholders and ratings agencies appear to have failed,
thus far, to price such details into either the value or ratings of Rolta’s bonds. Yet.
29
Rolta www.glaucusresearch.com
VALUATION
History may not repeat itself, but it rhymes. In 2004, an investigation by Indian securities regulators
found that Rolta’s management team manipulated the accounting of capital expenditures to inflate the
Company’s revenue figures and thereby materially misled investors. Despite the scandal, the Rolta’s
auditor, Chairman, CEO and audit committee members did not resign and were not fired. We believe that
something similar is going on today.
Rolta’s shares rallied recently on news that it was part of one of two consortiums selected in the final
round to bid for the Ministry of Defense’s BMS contract. This rally seems premature. Rolta, together
with Bharat Electronics Limited (BEL), has yet to win the contract – it must compete in the final stage
with a rival consortium led by India’s Tata Power and Larsen & Toubro. Moreover, any revenue or
profits generated by this contract, if Rolta’s consortium wins, will only be realized in four-five years (at
the earliest), by which time we expect Rolta’s serial capital raising scheme to have long unraveled. One
propsective contract does not change Rolta’s proclivity for deceit nor will make a losing business
suddenly a winner.
Fitch rated Rolta’s Junk Bonds BB- because of the Company’s “current profitability [and] ability to
generate free cash flow].” Rolta tells bondholders that its debt to EBITDA ratio is ~4 to 1 (as of Q3
2015).
But based on the evidence and analysis presented in this report, we believe that Rolta has fabricated its
reported capital expenditures in order to mask fabricated EBITDA. Such capital expenditures have easily
exceeded reported EBITDA, meaning, in our view, that Rolta’s Indian business is not profitable and does
not (and will not) generate sufficient cash to service its debt or repay it upon maturity.
Because foreign creditors must attempt to enforce their rights through India’s byzantine, corrupt and slow
judicial system, we think that any recovery of assets in India will be very difficult if not impossible.
Indian bankruptcy law offers few protections for foreign creditors. In the recent past, several Indian
companies have defaulted on foreign currency bonds, including Zenith Infotech, which defaulted on
foreign bonds in the fall of 2011. As of today, despite the filing of petitions for the winding up of the
firm, foreign lenders have not obtained any meaningful recovery.
In October 2012, troubled Indian firm Suzlon Energy defaulted on $200 million in foreign currency
bonds, which triggered a cross default on $270 million of other high yield bonds maturing in 2014 and
2016. Suzlon attempted to raise capital in India to repay bondholders, but in 2013, Indian banks
participating in the firm’s restructuring forbade any cash payments to foreign debtors from the proceeds
raised from Indian banks. Suzlon forced foreign bondholders into a restructuring.
The lesson of Suzlon and Zenith is that it is almost impossible for foreign bondholders to enforce a claim
in India or to achieve any meaningful recovery assets located in India. In our opinion, bondholders will
likely suffer a similar fate with Rolta. Therefore, we think the bonds are worth the recovery value of the
offshore (i.e. non-Indian) assets.
Unfortunately for bondholders, Rolta’s non-Indian business loses money. The Company discloses that
only two of its offshore subsidiaries generated EBT in 2014:

30
Rolta www.glaucusresearch.com
As discussed, we believe that the profitability of Rolta’s Indian business is fabricated. If we assign a very
generous multiple of 7x trailing EBT for the two offshore subsidiaries that appear to at least break even
(Rolta UK and recent acquisition AdvizeX), in a recovery scenario such businesses are unlikely to be
worth more than US$ 26.6 million.
Assuming that Rolta kept US$ 50 million of cash from its recent bond offering offshore (67% of its cash
balance as of Q3 2015), combined with US$ 5.8 million in offshore fixed assets (mostly real property),
we estimate that offshore creditors will recover US$ 0.16 cents on the dollar.
Reported Earnings Before Taxes
US$ million 2011 2012 2013 2014
Offshore Subsidiary
Rolta International Inc (5.83) (7.85) (12.14) (13.58)
Rolta Canada Ltd (2.33) (2.79) (2.47) (1.44)
Rolta Asia Pacific Pty Ltd (0.09) (0.21) (0.01) (0.21)
Rolta LLC - - (0.83) (2.78)
AT Solutions LLC - - 3.17 (0.01)
Advize X Technologies LLC - - - 2.81
Rolta Saudi Arabia Ltd (0.08) (0.25) (0.05) (0.35)
Rolta Middle East FZ-LLC (2.02) (4.45) (3.96) (4.58)
Rolta UK Ltd (1.42) (3.37) (3.39) 1.04
Rolta Benelux B.V (0.84) (0.54) (0.32) (0.23)
Rolta Deutschland GmbH (3.11) (0.01) (0.01) (0.00)
Onshore Subsidiary
Rolta India Limited 123.01 71.67 (134.02) 59.82
Rolta Thales Limited (0.13) 0.00 (0.01) (0.01)
Total 107.17 52.21 (154.04) 40.47
Source: FY11 AR
p. 100, 128
FY12 AR
p. 121, 130
FY13 AR
p. 119, 123
FY14 AR
p. 107, 137
Note: The numbers above were converted from INR to USD with the average
exchange rate for the year disclosed in annual report of each year.
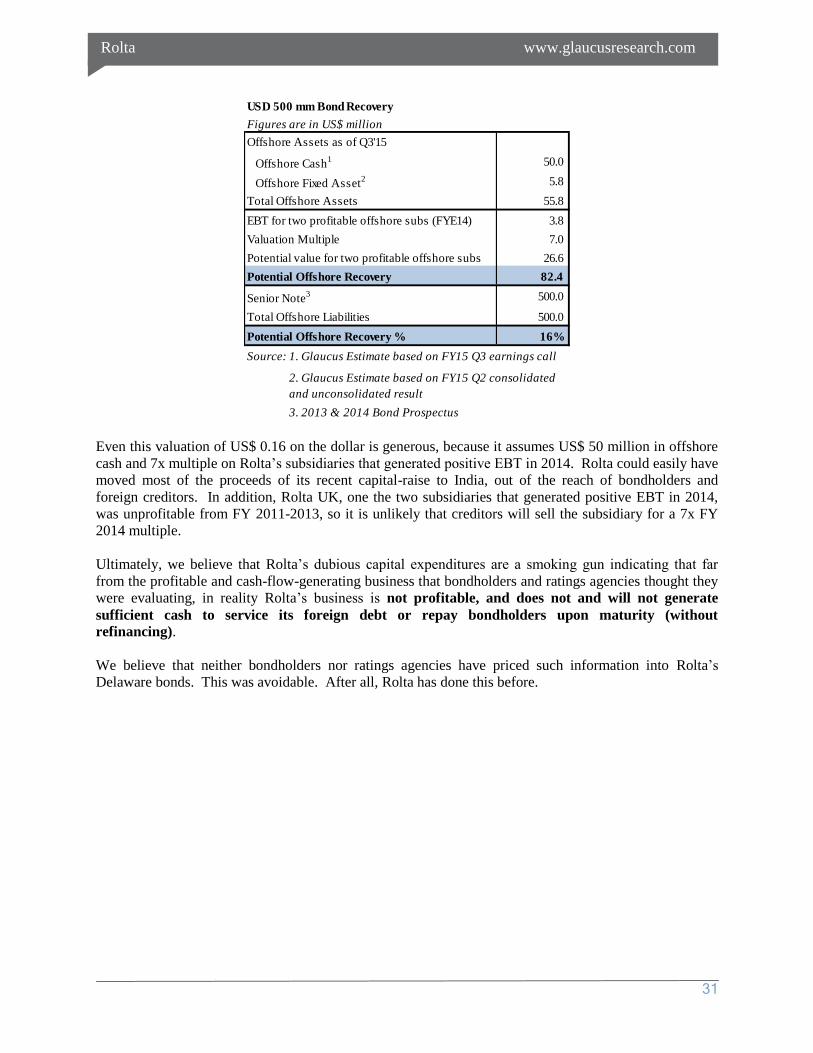
31
Rolta www.glaucusresearch.com
Even this valuation of US$ 0.16 on the dollar is generous, because it assumes US$ 50 million in offshore
cash and 7x multiple on Rolta’s subsidiaries that generated positive EBT in 2014. Rolta could easily have
moved most of the proceeds of its recent capital-raise to India, out of the reach of bondholders and
foreign creditors. In addition, Rolta UK, one the two subsidiaries that generated positive EBT in 2014,
was unprofitable from FY 2011-2013, so it is unlikely that creditors will sell the subsidiary for a 7x FY
2014 multiple.
Ultimately, we believe that Rolta’s dubious capital expenditures are a smoking gun indicating that far
from the profitable and cash-flow-generating business that bondholders and ratings agencies thought they
were evaluating, in reality Rolta’s business is not profitable, and does not and will not generate
sufficient cash to service its foreign debt or repay bondholders upon maturity (without
refinancing).
We believe that neither bondholders nor ratings agencies have priced such information into Rolta’s
Delaware bonds. This was avoidable. After all, Rolta has done this before.
USD 500 mm Bond Recovery
Figures are in US$ million
Offshore Assets as of Q3'15
Offshore Cash1 50.0
Offshore Fixed Asset2 5.8
Total Offshore Assets 55.8
EBT for two profitable offshore subs (FYE14) 3.8
Valuation Multiple 7.0
Potential value for two profitable offshore subs 26.6
Potential Offshore Recovery 82.4
Senior Note3 500.0
Total Offshore Liabilities 500.0
Potential Offshore Recovery % 16%
Source: 1. Glaucus Estimate based on FY15 Q3 earnings call
3. 2013 & 2014 Bond Prospectus
2. Glaucus Estimate based on FY15 Q2 consolidated
and unconsolidated result

32
Rolta www.glaucusresearch.com
DISCLAIMER
We are short sellers. We are biased. So are long investors. So is Rolta. So are the banks that raised money for the Company. If you are
invested (either long or short) in Rolta, so are you. Just because we are biased does not mean that we are wrong. We, like everyone else,
are entitled to our opinions and to the right to express such opinions in a public forum. We believe that the publication of our opinions
about the public companies we research is in the public interest.
THIS REPORT RELATES SOLELY TO THE VALUATION OF PUBLICLY TRADED BONDS ISSUED BY FOREIGN COMPANIES NOT
INCORPORATED IN INDIA (ROLTA’S DELAWARE, USA, SUBSIDIARY) AND TRADED OVER THE COUNTER OUTSIDE OF INDIA, AND DOES NOT EXPRESS ANY OPINION AS TO THE VALUE OF ANY SECURITIES TRADED ON PUBLIC EXCHANGES IN INDIA OR ANY
INSTRUMENT OR SECURITY ISSUED BY ANY ENTITY INCORPORATED IN INDIA. We have no investment interest in any security
traded on any exchange in India or issued by an entity incorporated or located in India. We have a short interest in Rolta’s Delaware
issued bonds, and this report relates solely to our good-faith opinion of the valuation of such bonds.
You are reading a short-biased opinion piece. Obviously, we will make money if the price of Rolta’s Delaware-issued corporate bonds
declines. This report and all statements contained herein are the opinion of Glaucus Research Group California, LLC, and are not
statements of fact. Our opinions are held in good faith, and we have based them upon publicly available facts and evidence collected and
analyzed, which we set out in our research report to support our opinions. We conducted research and analysis based on public
information in a manner that any person could have done if they had been interested in doing so. You can publicly access any piece of
evidence cited in this report or that we relied on to write this report. Think critically about our report and do your own homework before
making any investment decisions. We are prepared to support everything we say, if necessary, in a court of law.
As of the publication date of this report, Glaucus Research Group California, LLC (a California limited liability company) (possibly
along with or through our members, partners, affiliates, employees, and/or consultants) along with our clients and/or investors has a
direct or indirect short position in the Delaware-issued corporate bonds of the company covered herein, and therefore stands to realize
significant gains in the event that the price of such bonds declines. Use Glaucus Research Group California, LLC’s research at your own
risk. You should do your own research and due diligence before making any investment decision with respect to the debt instruments
covered herein. The opinions expressed in this report are not investment advice nor should they be construed as investment advice or any
recommendation of any kind.
Following publication of this report, we intend to continue transacting in the debt instruments covered therein, and we may be long,
short, or neutral at any time hereafter regardless of our initial opinion. This is not an offer to sell or a solicitation of an offer to buy any
security, nor shall any security be offered or sold to any person, in any jurisdiction in which such offer would be unlawful under the
securities laws of such jurisdiction. To the best of our ability and belief, all information contained herein is accurate and reliable, and has
been obtained from public sources we believe to be accurate and reliable, and who are not insiders or connected persons of the stock
covered herein or who may otherwise owe any fiduciary duty or duty of confidentiality to the issuer. As is evident by the contents of our
research and analysis, we expend considerable time and attention in an effort to ensure that our research analysis and written materials
are complete and accurate. We strive for accuracy and completeness to support our opinions, and we have a good-faith belief in
everything we write, however, all such information is presented “as is,” without warranty of any kind– whether express or implied.
If you are in the United Kingdom, you confirm that you are subscribing and/or accessing Glaucus Research Group California, LLC
research and materials on behalf of: (A) a high net worth entity (e.g., a company with net assets of GBP 5 million or a high value trust)
falling within Article 49 of the Financial Services and Markets Act 2000 (Financial Promotion) Order 2005 (the “FPO”); or (B) an
investment professional (e.g., a financial institution, government or local authority, or international organization) falling within Article
19 of the FPO.
Glaucus Research Group California, LLC makes no representation, express or implied, as to the accuracy, timeliness, or completeness of
any such information or with regard to the results to be obtained from its use. All expressions of opinion are subject to change without
notice, and Glaucus Research Group California, LLC does not undertake a duty to update or supplement this report or any of the
information contained herein. By downloading and opening this report you knowingly and independently agree: (i) to abide by the terms
of service posted on our website (www.glaucusresearch.com), which are hereby fully incorporated herein, (ii) that any dispute arising
from your use of this report or viewing the material herein shall be governed by the laws of the State of California, without regard to any
conflict of law provisions; (iii) to submit to the personal and exclusive jurisdiction of the superior courts located within the State of
California and waive your right to any other jurisdiction or applicable law, given that Glaucus Research Group California, LLC is a
California limited liability company that operates in California; and (iv) that regardless of any statute or law to the contrary, any claim or
cause of action arising out of or related to use of this website or the material herein must be filed within one (1) year after such claim or
cause of action arose or be forever barred. The failure of Glaucus Research Group California, LLC to exercise or enforce any right or
provision of this disclaimer shall not constitute a waiver of this right or provision. If any provision of this disclaimer is found by a court
of competent jurisdiction to be invalid, the parties nevertheless agree that the court should endeavor to give effect to the parties'
intentions as reflected in the provision and rule that the other provisions of this disclaimer remain in full force and effect, in particular as
to this governing law and jurisdiction provision.