Role of Food Corporation of India › pdf › report-presentiton › 2015 › 13feb › Role-… ·...
35
Role of Food Corporation of India By:- Prasant Kumar Satapathy, Deputy General Manager(Quality Control / General) & Prince Hemraj Verma, Asst. General Manager(General) Institute of Food Security, Food Corporation of India, Gurgaon, India. 12.02.2015 ASEAN India Co-operation in Food Security, World Trade Centre, Mumbai 1
Transcript of Role of Food Corporation of India › pdf › report-presentiton › 2015 › 13feb › Role-… ·...

Role of Food Corporation of India By:-
Prasant Kumar Satapathy,
Deputy General Manager(Quality Control / General)
&
Prince Hemraj Verma, Asst. General Manager(General)
Institute of Food Security,
Food Corporation of India,
Gurgaon, India.
12.02.2015
ASEAN India Co-operation in Food Security,
World Trade Centre, Mumbai
1
FCI’s Mandate
Food Corporation of India was set up under the Food Corporations Act, 1964 for:
Effective price support operations for safeguarding the interests of the farmers
Maintaining satisfactory level of operational and buffer stocks of foodgrains to ensure National Food Security
Movement of foodgrains throughout the country for public distribution system
Market intervention for price stabilization
2

Headquarters
Zonal Offices 5
Regional Offices 25
District Offices 170
Depots (1971)
Organizational Structure of FCI
Owned (548) Hired (1423)
3

(a) Chairman;
(b) Three directors to represent respectively the Ministries
of the Central Government dealing with:
(i) Food,
(ii) Finance, and
(iii) Co-operation
(c) Managing Director of the Central Warehousing
Corporation, ex-officio;
(d) Managing Director, FCI;
(e) six other Directors;
Constitution of FCI’s Board of Directors
4

Procurement in Mandi (Purchase Centre)
5

Production, Procurement & MSP of Wheat
RMS Production Procurement MSP+Bonus
(Rs. Per qtl.)
2004-05 721.5 167.96 630
2005-06 686.4 147.87 640
2006-07 693.5 92.26 700
2007-08 758.1 111.28 850
2008-09 785.7 226.89 1000
2009-10 806.8 253.82 1080
2010-11 808.0 225.14 1100
2011-12 868.7 283.34 1170
2012-13 948.8 381.48 1285
2013-14 935.1 250.92 1350
2014-15 959.1 280.23 1400
(Figures in LMT; Rs./qtl)
6

7
Production, Procurement of Rice & MSP of
Paddy
(Figures in LMT; Rs/qtl))
KMS Production of rice Procurement of rice MSP+Bonus of Paddy
Common Grade A
2004- 05 831.3 246.85 560 590
2005-06 917.9 276.56 570 600
2006-07 933.6 251.06 620 650
2007-08 966.9 287.36 745 775
2008-09 991.8 341.04 900 930
2009-10 890.9 320.34 1000 1030
2010-11 959.8 341.98 1000 1030
2011-12 1053.0 350.60 1080 1110
2012-13 1044.0 340.44 1250 1280
2013-14 1065.4 313.77 1310 1345
2014-15 1360 1400

8
Procurement of Coarse Grains
Marketing Year Qty. Procured
2009-10 4.07
2010-11 1.28
2011-12 0.36
2012-13 0.72
2013-14 12.31
2014-15 -
Figures in lakh MT
MSP of Coarse Grains in 2013-14
(Rs/Quintal) :
Jowar: 1520 (maldandi); 1500 (hybrid), Bajra: 1250, Ragi: 1500, Maize: 1310
Coarse grains are not procured by FCI directly

(Figures in Lakh MT)
Share of FCI and State Agencies in
Procurement of Wheat
Description RMS 2012-13 RMS 2013-14 RMS 2014-15
Quantity % Quantity % Quantity %
Procurement by FCI
50 13 % 39 16 % 35 12%
Procurement by State Agencies
331 87 % 212 84% 245 88%
Total 381 100% 251 100% 280 100%
9

(Figures in Lakh MT)
Share of FCI and State Agencies in
Procurement of Paddy
Description KMS 2011-12 KMS 2012-13 KMS 2013-14
(As on 01.10.2014)
Quantity % Quantity % Quantity %
Procurement by FCI 4 1% 6 2% 5.01 1.5%
Procurement by State Agencies
364 99% 382 98% 348.50 98.5%
Total 368 100% 388 100% 353.51 100%
10
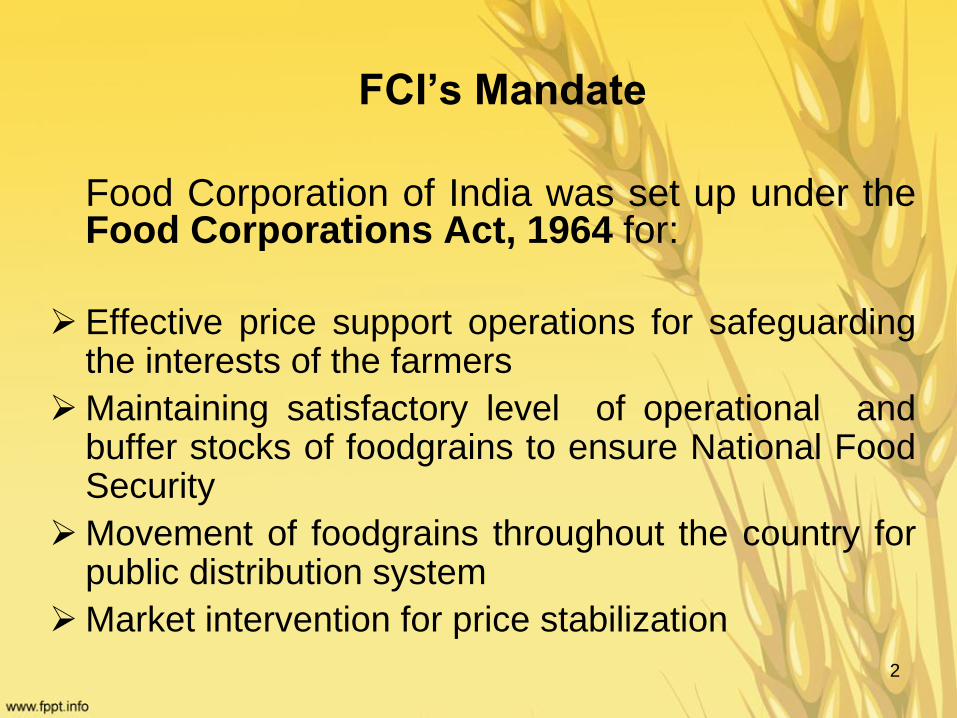
(Figures in Lakh MTs)
Share of FCI and State Agencies in Procurement of Rice
Description KMS 2011-12 KMS 2012-13 KMS 2013-14
(As on 01.10.2014)
Quantity %age Quantity %age Quantity %age
Procurement
by FCI
196.06 60 217.67 69 194.98 69
Procurement
by State
Agencies
130.83 40 96.17 31 88.09 31
Total 326.89 100 313.84 100 283.07 100
11

12
Wheat Purchase Centers
(RMS 2014-15) S. No. States FCI State
Agencies
Total
1 Punjab 483 1316 1799
2 Haryana 63 309 372
3 Uttar Pradesh 75 5925 6000
4 Rajasthan 90 287 377
5 Madhya Pradesh 0 3000 3000
6 Delhi 2 0 2
7 Bihar 0 8997 8997
8 Himachal Pradesh 6 0 6
9 Gujarat 28 205 233
10 Jharkhand 0 0 0
11 Chhattisgarh * * 0
12 J&k 6 0 6
13 Maharashtra 0 68 68
14 Uttrakhand 20 183 203
15 West Bengal 0 25 25
Total 773 20,315 21,088

13
Procurement of Wheat in DCP States (RMS
2014-15) S. No. State Procurement
(in LMT)
DCP
w.e.f
1 Madhya Pradesh 70.94 1999-2000
2 Rajasthan (Alwar District) 0.89 2013-14
3 Punjab (For TPDS) 8.69 2014-15
4 Bihar 0.00 2014-15
5 Uttrakhand 0.01 2003-04
6 Gujarat 0.00 2004-05
7 Chhattisgarh 0.00 2001-02
8 West Bengal 0.00 2010-11
Total 80.53
Punjab partially DCP state to procure and meet its own requirement and Rajasthan
DCP only in Alwar district.

14
Paddy Purchase Centers
(KMS 13-14) S. No. States FCI State Agencies Total
1 AP 0 2000 2000
2 Assam 14 40 54
3 Bihar -- 9187 9187
4 Chhattisgarh 0 1975 1975
5 Delhi 4 0 4
6 Gujrat 0 55 55
7 Haryana 39 146 185
8 HP 5 0 5
9 Jharkhand 10 886 896
10 JK 5 0 5
11 Karnataka 0 50 50
12 Kerela 0 690 690
13 Maharashtra 0 519 519
14 MP 0 825 825
15 Orissa 30 3296 3326
16 Puducherry 0 0 0
17 Punjab 270 1518 1788
18 Rajasthan 0 0
19 Tamil Nadu 0 1650 1650
20 UP 68 2750 2818
21 Uttrakhand 5 57 62
22 WB 0 10900 10900
Grand Total
414
36954 37368
15
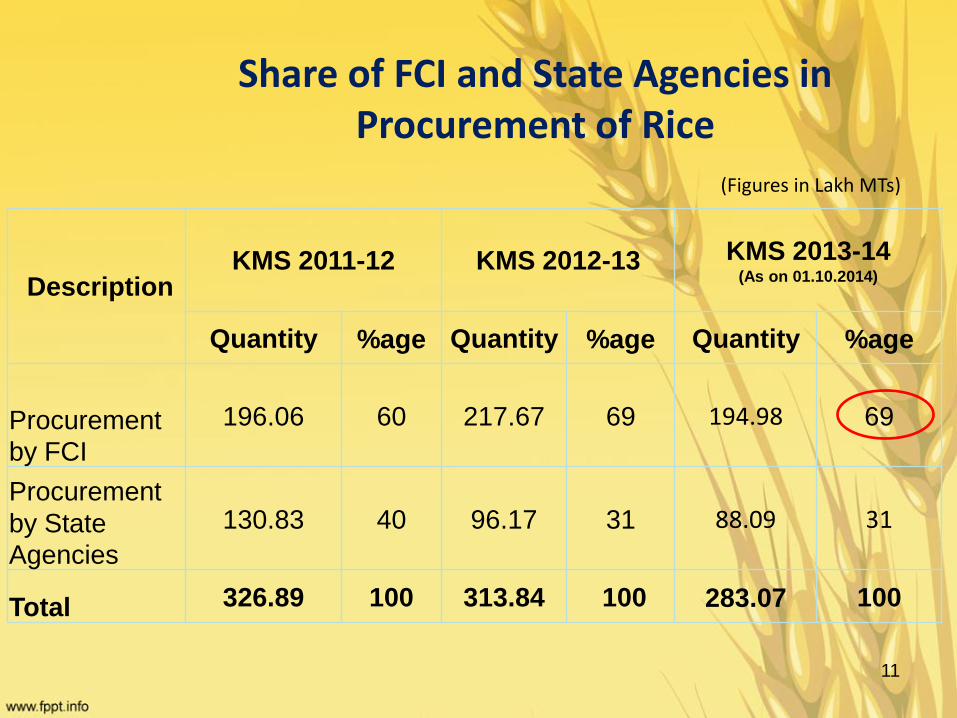
Procurement of Rice in DCP States
(KMS 2013-14)
S. No. States Procurement
(in LMT)
DCP
W.e.f
1 Andhra Pradesh
(6 Districts) 7.63
2012-13
2 Telangana (4 Districts ) 9.29
3 Bihar 8.28 2013-14
4 Chhattisgarh 42.90 2001-02
5 Kerala 3.59 2004-05
6 Karnataka 0.00 2009-10
7 Madhya Pradesh 10.45 2007-08
8 Odisha 28.19 2003-04
9 Tamil Nadu 6.84 2002-03
10 Uttrakhand 4.63 2002-03
11 West Bengal 12.80 1997-98
Total 134.60

16
Rice Procurement in DCP and non DCP States
KMS 09-10 KMS 10-11 KMS 11-12 KMS 12-13 KMS 13-14
AS on 01/10/14
Procurement in DCP 93.11 104.46 123.63 133.62 134.60
% of total 29.07% 30.55 % 35.27 % 39.24% 42.52 %
Procurement in Non DCP
227.23 237.52 226.97 206.82 181.92
% of total 70.93% 69.45 % 64.73 % 60.76 % 57.48%
Total procurement 320.34 341.98 350.60 340.44 316.52
( Fig in LMT)
Wheat Procurement in DCP and non DCP States
RMS 2010-
11
RMS 2011-
12
RMS 2012-
13 RMS 2013-14 RMS 2014-15
Procurement in DCP 38.17 56.68 93.31 64.16 80.53
% of total 17.0% 20.0% 24.46% 25.57 % 28.74 %
Procurement in Non DCP 186.97 226.67 288.17 186.76 199.70
% of total 83.0% 80.0% 75.54% 74.43 % 71.26 %
Total Procurement 225.14 283.35 381.48 250.92 280.23

Procurement Issues
Open ended procurement
Bonus increases procurement
High taxation reduces private trade
17

18
Stock Position in Central Pool
in last 10 Years (As on 1st June 2014)
Year
Rice
(including paddy in
terms of rice)
Wheat Total
2004 122.51 193.90 316.41
2005 115.95 161.31 277.26
2006 119.51 93.20 212.71
2007 126.14 133.08 259.22
2008 121.29 241.23 362.52
2009 204.03 331.22 535.25
2010 252.66 351.62 604.28
2011 276.41 378.32 654.73
2012 321.48 501.69 823.17
2013 333.06 443.89 776.95
2014 282.57 415.86 698.43
(Figures in Lakh MTs)
19
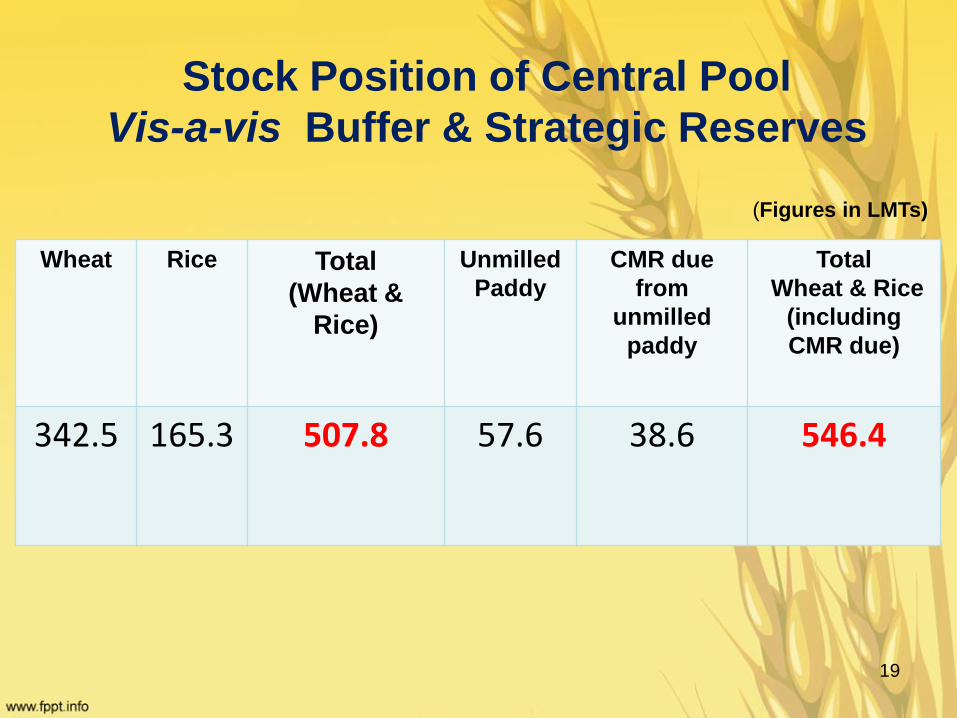
Stock Position of Central Pool
Vis-a-vis Buffer & Strategic Reserves
Wheat Rice Total
(Wheat &
Rice)
Unmilled
Paddy
CMR due
from
unmilled
paddy
Total
Wheat & Rice
(including
CMR due)
342.5 165.3 507.8 57.6 38.6 546.4
(Figures in LMTs)

PEG Godown in Punjab
20

Storage Capacity Scenario
(As on 01.09.2014)
(Figures in LMTs)
Total Storage Capacity
with FCI (Owned/Hired )
Total Storage Capacity
with State Agencies
(excluding capacities
given to FCI) for storage
of central pool stocks
Grand Total
Covered CAP Total
State Agencies Covered CAP Total
Covere
d CAP Total
355.47 30.80 386.27 219.86 150.41 370.98 575.33 181.21 756.54
21

22
PEG Scheme at a Glance (As on 01.09.2014)
Total capacity approved by Government of India – 203.76 LMT
Capacity sanctioned : 153.86 LMT
Capacity completed - 119.20 LMT
Capacity under construction – 16.93 LMT
Work yet to Start – 17.73 LMT
Capacity reserved for Silos - 20 LMT

23
Movement of Food Grains

24
Movement of Foodgrains
Year Foodgrain movement % of increase
2009-2010 312 21
2010-2011 341 9
2011-2012 368 8
2012-2013 408 11
2013-2014 448 10
2014-2015
(April to August)
188
(Figures in Lakh MT)

25
Offtake - Wheat & Rice
Year Wheat Rice Total
2009-10 224 276 500
2010-11 231 300 531
2011-12 243 320 563
2012-13 332 326 658
2013-14 306 292 598
2014-15
(April – August’ 14) 97 125 222
(Figures in Lakh MT)

26
Allotment & Offtake of Wheat and Rice in 2013-14
Scheme Wheat Rice Total
Allotmen
t Offtake
Allotmen
t Offtake
Allotmen
t Offtake
TPDS 247 204 300 257 547 461
OWS 16 14 34 29 50 43 Addl. for
Relief/
Festivals
etc.
7 3 8 4 15 7
OMSS(D) 92 61 2 2 94 63
Export 20 24 - - 20 24
TOTAL 382 306 344 292 726 598
(Figures in Lakh MT)

CIP of Rice wef 01.07.2002
APL BPL AAY Rice (Grade A) 8.30 5.65 3.00
Rice (Common) 7.95 5.65 3.00
CIP of Wheat (Rs./Kg) wef 01.07.2002
APL BPL AAY
6.10 4.15 2.00
Central Issue Price (CIP) & Issue Price
under NFSA
Issue Prices Under NFSA (Rs. / Kg.)
Rice Wheat Coarse grains
3.00 2.00 1.00 27

28
National Food Security Act
The NFSA came into force w.e.f. 5th July 2013.
Covers 75% of rural population & 50% of urban population in two
categories – i) Households covered under Antyodaya Anna Yojna and; ii)
Priority Households .
Households covered under Antyodaya Anna Yojna are entitled to 35 Kg
of foodgrains per household per month.
Every person belonging to Priority Households are entitled to 5 Kg of
foodgrains per person per month.
Contd…../
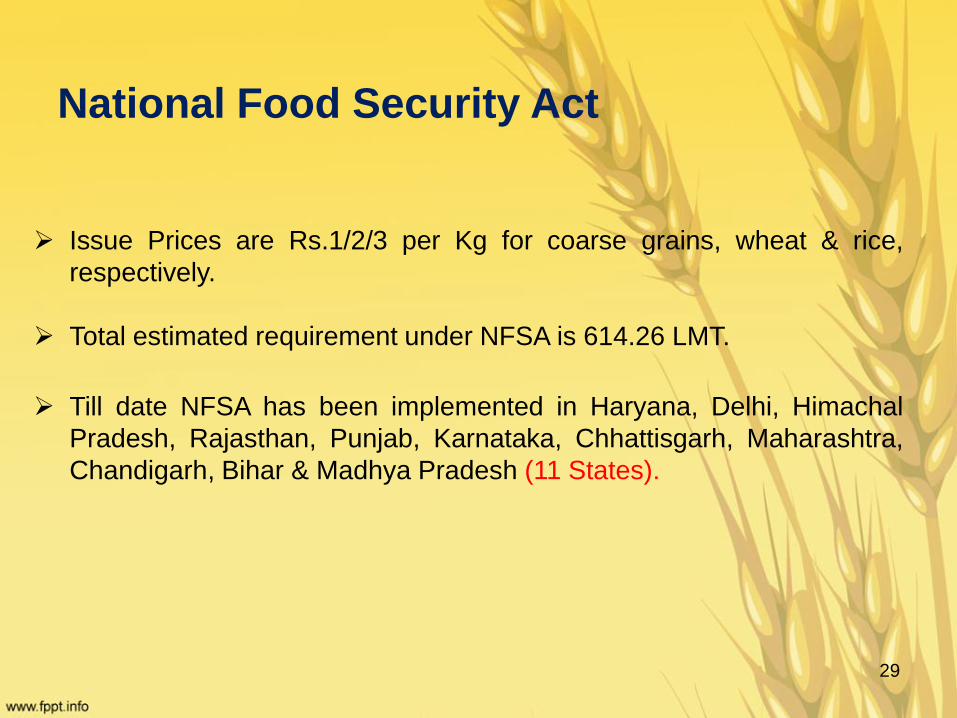
Issue Prices are Rs.1/2/3 per Kg for coarse grains, wheat & rice,
respectively.
Total estimated requirement under NFSA is 614.26 LMT.
Till date NFSA has been implemented in Haryana, Delhi, Himachal
Pradesh, Rajasthan, Punjab, Karnataka, Chhattisgarh, Maharashtra,
Chandigarh, Bihar & Madhya Pradesh (11 States).
National Food Security Act
29

30
Personnel
Category Sanctioned
Strength
Existing Strength
Vacant
/ Excess
Category I 1012 791 -221
Category II 6292 4126 -2166
Category III 26831 12730 -14101
Category IV 2380 4697 2317
Total 36515 22344 -14171
As on 30.06.2014

31
Labour Strength
Zone Type of Labour Depots No. of
Labour
All India Total
Departmental 162 17,088
Direct Payment
System(DPS) 219 27,565
No Work No Pay
(NWNP) 83 6,352
Total 464 51,005
Contract Labour System and Coop. Societies 1507
1 lakh
(approx.)
(As on 30.06.2014)

Efficiency Improvements over the Years
Year Staff Turnover
(MT/Employee
)
Storage
Loss
(%)
Transit
Loss
(%)
Damage
d
Foodgrai
ns (%)
Reductio
n in
spread
over
PLR/bas
e rate
(bps)
Staff
Strength
(in
position)
2000-01 706 0.42 0.84 1.066 340 60915
2013-14 4568 0.22 0.46 0.047 65 22480

33
Recent Initiatives
Average age of stocks brought down to less than 2 years
Multimodal transportation implemented for moving rice from:
• Andhra Pradesh to Kerala
• Andhra Pradesh to Tripura (via Ashuganj Port in Bangladesh)
• Fresh attempts from AP / West Bengal to Karimganj (Assam)
being made
Zero PV of depots introduced
All FCI depots graded based on level of available infrastructure and
100 godowns upgraded
Mechanization of handling operations introduced in 21 depots
34
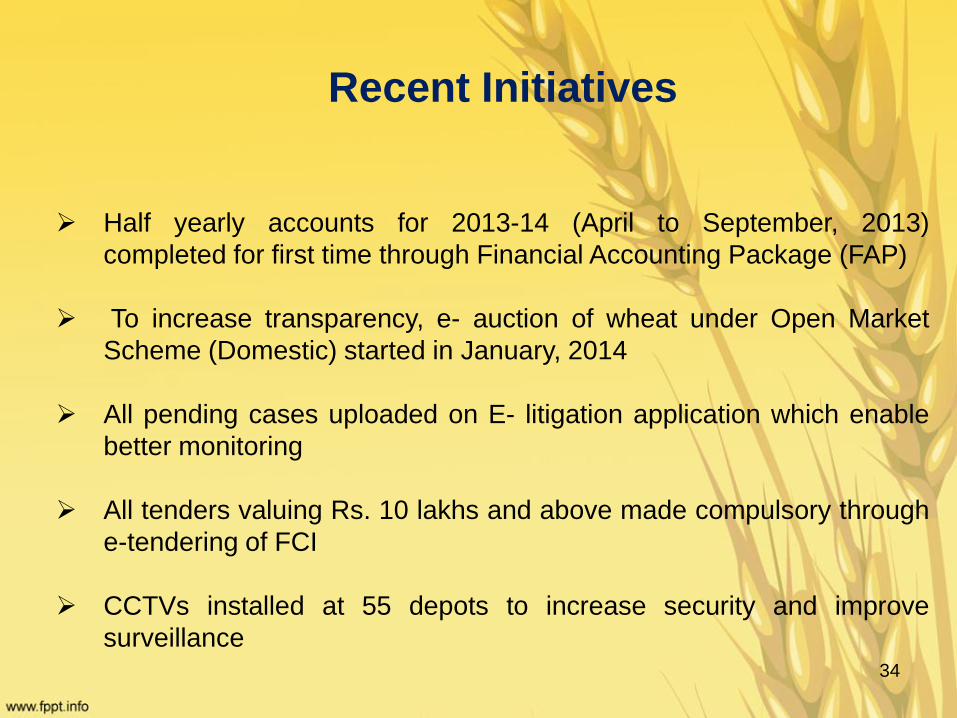
Recent Initiatives
Half yearly accounts for 2013-14 (April to September, 2013)
completed for first time through Financial Accounting Package (FAP)
To increase transparency, e- auction of wheat under Open Market
Scheme (Domestic) started in January, 2014
All pending cases uploaded on E- litigation application which enable
better monitoring
All tenders valuing Rs. 10 lakhs and above made compulsory through
e-tendering of FCI
CCTVs installed at 55 depots to increase security and improve
surveillance

35