Roeback Data Acquisition ENGT279 S1C - Faculty...
13
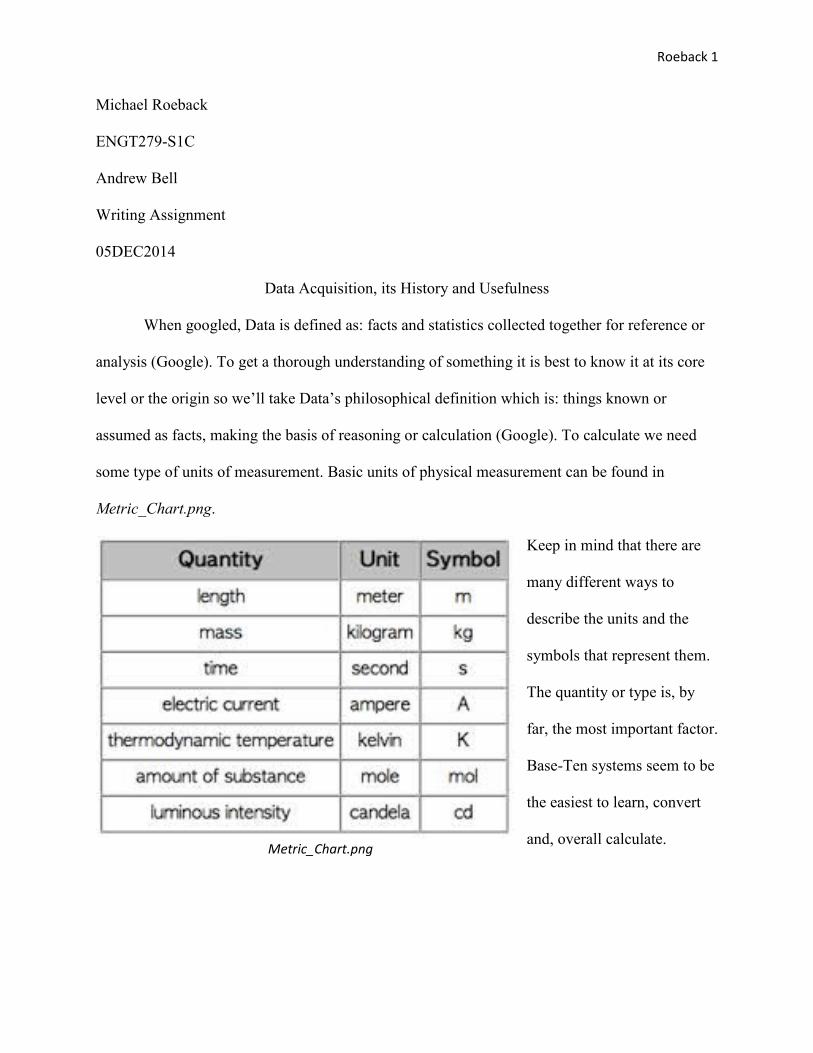
Roeback 1 Michael Roeback ENGT279-S1C Andrew Bell Writing Assignment 05DEC2014 Data Acquisition, its History and Usefulness When googled, Data is defined as: facts and statistics collected together for reference or analysis (Google). To get a thorough understanding of something it is best to know it at its core level or the origin so we’ll take Data’s philosophical definition which is: things known or assumed as facts, making the basis of reasoning or calculation (Google). To calculate we need some type of units of measurement. Basic units of physical measurement can be found in Metric_Chart.png. Keep in mind that there are many different ways to describe the units and the symbols that represent them. The quantity or type is, by far, the most important factor. Base-Ten systems seem to be the easiest to learn, convert and, overall calculate. Metric_Chart.png
Transcript of Roeback Data Acquisition ENGT279 S1C - Faculty...
Roeback 1
Michael Roeback
ENGT279-S1C
Andrew Bell
Writing Assignment
05DEC2014
Data Acquisition, its History and Usefulness
When googled, Data is defined as: facts and statistics collected together for reference or
analysis (Google). To get a thorough understanding of something it is best to know it at its core
level or the origin so we’ll take Data’s philosophical definition which is: things known or
assumed as facts, making the basis of reasoning or calculation (Google). To calculate we need
some type of units of measurement. Basic units of physical measurement can be found in
Metric_Chart.png.
Keep in mind that there are
many different ways to
describe the units and the
symbols that represent them.
The quantity or type is, by
far, the most important factor.
Base-Ten systems seem to be
the easiest to learn, convert
and, overall calculate.
Metric_Chart.png

Roeback 2
Metric units of measure are commonly referred
to as the International System of Units or SI.
A series of base units define each measurement
in an absolute way without directly referring to
any other unit. Now that we have a set
measuring system we have a consistent way to
record our data. These records can then be
compared to others and evaluated for
predictability through trends. Data may not seem
like such a powerful tool at first, but throughout these writings I will prove its worth.
Since Astronomy is the first known science, we will use it to confirm the power of Data Analysis.
Hieroglyphics, a very primitive form of data, of early man help us understand that the moon,
planets, sun and stars had been around since man’s ability to record data (History of Astronomy).
Advancements came when the Babylonians (~1600 B.C.) recorded position of planets,
times of eclipses, etc. The ancient Greeks inherited astronomical records from the Babylonians
and applied the data to construct a cosmological framework. The early Greeks also had figured out
that the Earth was a sphere based on the shadow of Earth on the Moon during lunar eclipses. By
220 B.C. Eratosthenes, with
this knowledge and - at that
time-complicated mathematics,
was able to calculate the earth’s
circumference. Around this
same time period Heraclides
LANG_Metric_a3.png
Eratosthenes.gif

Roeback 3
developed the first Solar System model, in which all the planets, moon sun and stars revolved
around the earth. A couple hundred more years of collecting and analyzing data led Astronomers
to the conclusion that the planets - earth included - actually revolved around the sun, though it took
many years for this theory to become widely accepted (History of Astronomy). So through the
primitive collection and analysis of data, and with the help of some earlier mathematics, the sun
and planets - to include our moon - of the entire solar system (as it was known) had been charted
and explained.
The first of many powerful tools used to justify the importance of accurate data collection and
analysis would be developed sometime within the first millennium. No one person can be credited
as the inventor of the experimental method (later to be known as “the scientific method”), as it was
really not “invented” but recognized and developed as the natural methodology of obtaining
reliable knowledge (Scientific Method History). The scientific method that has become widely
Heraclides_SS.gif
Roeback 4
popular and accepted has four core components; Characterizations, Hypotheses, Predictions and
Experiments. By using the four core components as a guideline we can construct a more linear and
easily followed procedure such as:
1. Define a question
2. Gather information and resources (observe)
3. Form an explanatory hypothesis
4. Test the hypothesis by performing an experiment and collecting data in a reproducible
manner
5. Analyze the data
6. Interpret the data and draw conclusions that serve as a starting point for new hypothesis
7. Publish results
8. Retest (frequently done by other scientists)
(Scientific Method). Using this method, through the steps within the above procedure, we can
make better use of the data collected than previously possible.
Calculations can be a bit tricky depending on the numbering system being used to
perform the calculations. The Greeks were accustomed to using letters as their numeric system.
This made complex calculations very difficult, to say the least. In the early thirteenth century, a
scholar going by the name of Leonardo Pisano Bigollo, had traveled to the middle east and learn
a numbering system that used symbols instead of letters to represent numbers. His book, Liber
Abaci (translated: Book of the Abacus) was a story of these numbers - and their usefulness. It
received the endorsement of the Holy Roman Emperor, Frederick II (Bernstein XXVI). This new

Roeback 5
numbering system would quickly become the choice for mathematicians throughout the Western
World.
Jumping ahead five hundred years or so to 1730, Abraham De Moivre introduced the
structure of Normal Distribution and with it came the concept of standard deviation (Bernstein
5). We have come to use this powerful tool and
other statistical tools, when dealing with data.
Statistical mathematics coupled with the
scientific method allows us great predictability
and reproducibility. Mathematical probability
proves that with a greater sample size (population) of data
we grow more confident of our result. The same can be said
about standard deviation and reproducibility. As you can see
from the bell-curve (also known as the normal curve) chart,
the more standard deviations (noted by sigma) - within the
level of tolerance - the higher our percentage of probability.
Next we will introduce modern statistical computer software to make these mathematical
analyses of the data easier to decipher and help eliminate the human errors made with hand
calculations. As an added bonus, the data will be held in an electronic format file making it
easier to store or send elsewhere. The use of spreadsheet programs such as Microsoft Excel and
Minitab, not only help log and store data in a well-organized fashion but include some very
powerful statistical tools to analyze it as well. After the data is entered into the spreadsheet the
use of these tools are as easy as a mouse click away. Below are the results from a fuel economy
test being performed to evaluate the capability of a pick-up and delivery truck test procedure.
Normalcurve3.jpg
standa5.gif

Roeback 6
This spreadsheet and matching graphical chart samples were completed in MiniTab16 from a Six Sigma
Black Belt Chapter that was completed and approved in the Fall of 2011.
321
1.05
1.00
0.95
Sample Mean
__X=0.9850
UCL=1.0370
LCL=0.9330
321
0.2
0.1
0.0Sample Range
_R=0.0901
UCL=0.1905
LCL=0
3.02.52.01.51.0
1.05
1.00
0.95
Sample
Values
1.041.000.960.92
LSL USL
LSL 0.92
USL 1.07
Specifications
1.11.00.9
Within
O v erall
Specs
StDev 0.03873
Cp 0.65
Cpk 0.56
PPM 60759.27
Within
StDev 0.03783
Pp 0.66
Ppk 0.57
Cpm *
PPM 55180.75
Overall
P&D Capability
Xbar Chart
Tests performed with unequal sample sizes
R Chart
Tests performed with unequal sample sizes
Last 3 Subgroups
Capability Histogram
Normal Prob PlotAD: 0.538, P : 0.137
Capability Plot
The total tolerance for any given run was ±2.0% for this test.

Roeback 7
Now that we have a common understanding of the usefulness of collecting data,
converting it into numeric form and performing calculations to analyze it we can move on to
modern data acquisition. Though it is
sometimes effective to measure and record
data by hand, it is not always the most practical
way of doing it. Modern technology now
allows us to capture several types of measurements in an electronic form. These electronic
measurements can be performed and recorded at a much greater rate, thus called sampling rate,
then humanly possible.
Just as data may need to be given a numeric value to be calculated, analog (physical)
values such as pressure, light intensity, movement, force, temperature and flow must be
converted to an electronic value to be captured by today’s data acquisition systems. Sensors, also
known as transducers, help us make these conversions. Hall-Effect and magnetic pickup sensors
are used to record pulses from exciter rings which are mostly used to indicate the speed of
rotation. By altering an input voltage, variable resistance or capacitance sensors allow us to
convert pressure and force to a lower recordable output voltage. Thermistors and thermocouples
transfer temperatures into electrical signals. Photo-sensitive cells can indicate a change in light.
All of these types of sensors, and more, can be used to
convert physical values into electrical ones.
Modern sensors have become linear in their
output signals making them much easier to work with
and calibrate than their older non-linear counter parts.
Once converted they can be recorded and with the help
a29837_99c47370c24b436cbfa0d404
4e98470d.jpg

Roeback 8
of modern software, uploaded right into a spreadsheet. This allows instant access to calculation
tools used to analyze the data collected.
The accuracy of the analog to digital conversion is directly related to the
sampling rate. The lower the sampling rate the lower
the resolution and accuracy of the captured signal,
such is the case in the example to the left. The blue
points indicate the sampling rate is too slow to
accurately record the signal. On the other hand, the faster we sample the signal, the more
memory and processing power
we will need. This is a trade-
off that must be pondered when
writing test procedures. The
image to the right expresses
this frequency verses memory
size trade-off. Processing
speeds increase and RAM
(Random Access Memory) cost
decrease over time allowing us
to increase our sampling rates,
as well as accuracy and
resolution, at the same cost we previously captured
data at just a few years prior. The number of
channels being sample must also be considered (see
hsda1.jpg
Aliasing-plot.png
data-logger-timevmemory01.gif
Roeback 9
hsda1.jpg). The Effective throughput is the speed at which the data can be recorded to the
memory. We conclude that three major considerations must be made when using a data
acquisition system to record our physical environment; Number of channels being monitored, the
sample rate at which we are capable of monitoring them and the resolution needed to accurately
capture the data.
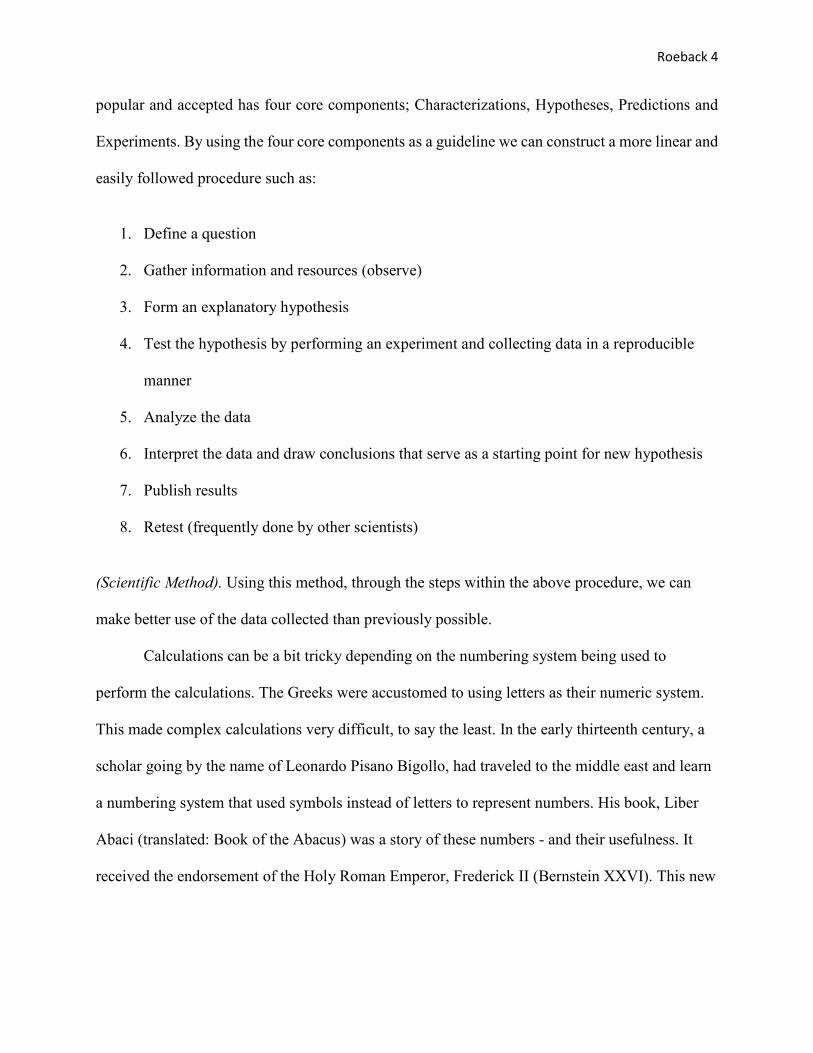
The IBM 7700 Data Acquisition System, released on December 2, 1963, was the first
data acquisition system. “It was capable of
collecting data from as many as 32 sources
simultaneously, process the data and transmit
results to up to 16 remote printers, display units
or plot boards”(IBM 7700 Data Acquisition
System). Since the IBM 7700’s release, data
acquisition systems have both increased in
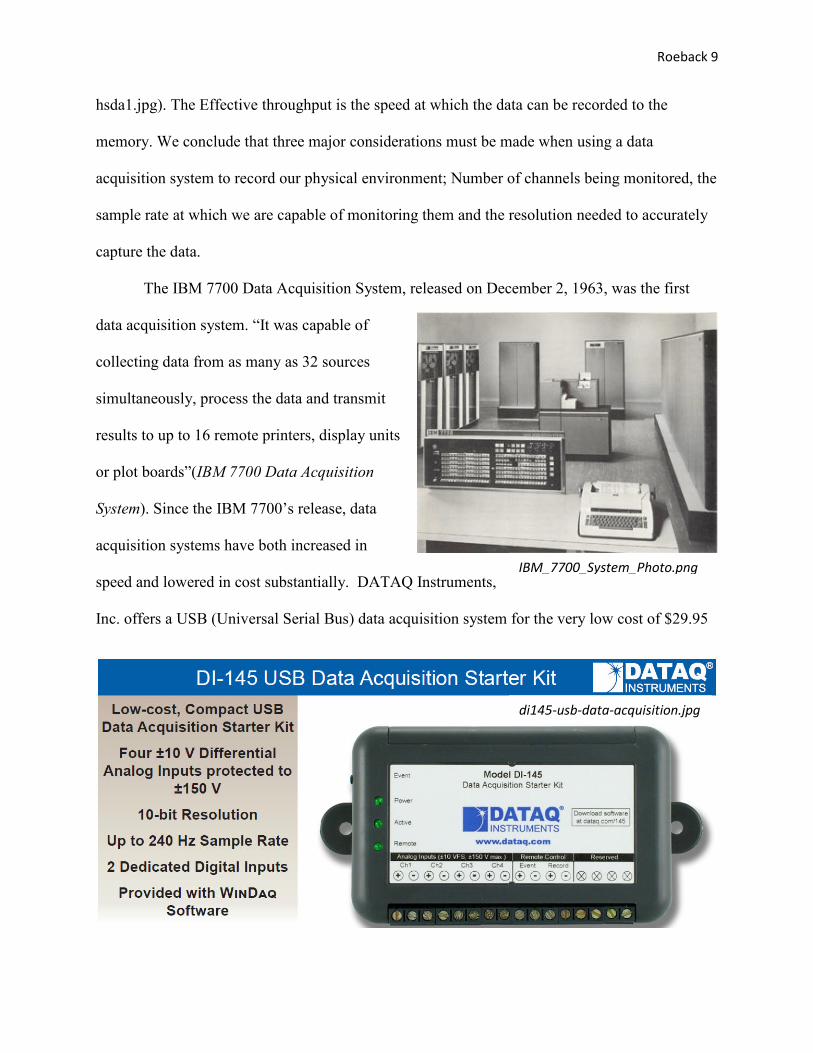
speed and lowered in cost substantially. DATAQ Instruments,
Inc. offers a USB (Universal Serial Bus) data acquisition system for the very low cost of $29.95
IBM_7700_System_Photo.png
di145-usb-data-acquisition.jpg

Roeback 10
(USD) plus S/H that is capable of handling smaller, lower frequency task (DI-145 USB Data
Acquisition).
National Instruments, Inc. offers a state-of-the-art high-speed data acquisition capable of
monitoring several
cards that each boast
32 channels at 24 bit
resolution and a 1MS/s
sampling rate for
thousands of dollars
(cDAQ-9139).
Task and budget dependent, there seems to be a Data
Acquisition system to meet the necessary need. As these
systems become more advanced so does modern
technology as a result of it, and vice versa. The importance
of data collection and analysis is, by far, one of the major
causes of technological advancement among the human race and
will continue to be the future of advancement for generations to come.
03201244_9139_m.jpg
040729_crio9215_t.jpg

Roeback 11
Works Cited
"a29837_99c47370c24b436cbfa0d4044e98470d.jpg." Buy Sensor Film Kit. Andrew Clark, n.d.
Web. 3 Dec. 2014. <https://grandst.com/marketplace/sensorfilmkit>.
"Aliasing-plot.png." SVI | NyquistRate. N.p., n.d. Web. 3 Dec. 2014.
<http://www.svi.nl/NyquistRate>.
Bernstein, Peter L. Against the Gods: The Remarkable Story of Risk. Paperback ed. N.p.: Wiley,
(August 31, 1998). Print.
cDAQ-9139. National Instruments, n.d. Web. 3 Dec. 2014.
<http://sine.ni.com/nips/cds/view/p/lang/en/nid/210718#overview>.
DI-145 USB Data Acquisition Starter Kit. DATAQ Instruments, n.d. Web. 3 Dec. 2014.
<http://www.dataq.com/products/di-145/>.
Google. Google, n.d. Web. 30 Oct. 2014.
History of Astronomy. University of Oregon, n.d. Web. 12 Nov. 2014.
<http://abyss.uoregon.edu/~js/ast121/lectures/lec02.html>.
"hsda1.jpg." Secrets for Successful High Speed Data Acquisition. DATAQ Instruments, n.d.
Web. 3 Dec. 2014. <http://www.dataq.com/blog/data-acquisition/secrets-successful-high-
speed-data-acquisition/>.
"IBM_7700_System_Photo.png." IBM 7700 Data Acquisition System. Wikimedia Foundation,
n.d. Web. 3 Dec. 2014.
<http://en.wikipedia.org/wiki/IBM_7700_Data_Acquisition_System>.
"Metric_Chart.png, LANG_Metric_a3.png." Metrics. Next.cc, n.d. Web. 12 Nov. 2014.
<http://www.next.cc/journey/language/metrics>.

Roeback 12
"Normalcurve3.jpg." Normal Distribution. Oswego City School District, n.d. Web. 17 Nov.
2014. <http://www.regentsprep.org/regents/math/algtrig/ats2/normallesson.htm>.
Scientific Method. Wikimedia Foundation, 3 Nov. 2014. Web. 12 Nov. 2014.
<http://en.wikipedia.org/wiki/Scientific_method>.
Scientific Method History. Norman W. Edmund, Dec. 2011. Web. 12 Nov. 2014.
<http://scientificmethod.com/sm5_smhistory.html>.
"standa5.gif." Minimum Sample Size Calculation. Barcelona Field Studies Centre S.L., 5 Nov.
2013. Web. 4 Dec. 2014. <http://geographyfieldwork.com/MinimumSampleSize.htm>.

Roeback 13
If at first you don't succeed, that's one data point. (Unknown)