Rocky Mountain Research Station Publications Mountain Research Station Publications Questions or...
65
This is a legacy archive publication from the former Intermountain Research Station (INT) or Rocky Mountain Forest and Range Experimental Station (RM). The content may not reflect current scientific knowledge, policies, or practices. This PDF may have been generated by scanning the original printed publication. Errors identified by the OCR software have been corrected; however, some errors may remain. Rocky Mountain Research Station Publications www.fs.fed.us/rm/publications www.treesearch.fs.fed.us Questions or problems? Please email us: [email protected]
Transcript of Rocky Mountain Research Station Publications Mountain Research Station Publications Questions or...

This is a legacy archive publication from the former Intermountain Research Station (INT) or Rocky Mountain Forest and Range Experimental Station (RM). The content may not reflect current scientific knowledge, policies, or practices.
This PDF may have been generated by scanning the original printed publication. Errors identified by the OCR software have been corrected; however, some errors may remain.
Rocky Mountain Research StationPublications
www.fs.fed.us/rm/publicationswww.treesearch.fs.fed.us
Questions or problems? Please email us: [email protected]

l
United States Department of Agriculture
Forest Service
lntermountaln Research Station
General Technical Report INT-259
April 1989
Wilderness Campsite Monitoring Methods: A Sourcebook David N. Cole
.•

THE AUTHOR DAVID N. COLE is Project Leader and research biologist with the lntermountain Station's Wilderness Management Research Work Unit at the Forestry Sciences Laboratory on the University of Montana campus, Missoula. Dr. Cole received his B.A. degree in geography from the University of California, Berkeley, in 1972. He received his Ph.D., also in geography, from the University of Oregon in 1977. He has written many papers on wilderness management, particularly the ecological effects of recreational use.
PREFACE The original objective of this report was to provide a hand
book for managers on how to develop and use a campsitemonitoring system. The state of knowledge appeared to be sufficient to make this possible. As the project advanced, however, it became clear that many problems and un9nswered questions remain. Therefore, the objective of the project turned toward compiling a summary of knowledge and identifying problems and areas in need of research. Managers able to recognize and modify ideas with merit and who are careful to avoid the problems identified should find useful techniques in this report. Managers looking for a system that can be applied without modttication or creative application will find this report frustrating. Researchers should find the discussion of problems and needed research of value in identifying important projects.
The review and discussion that follows, then, is an attempt to summarize and evaluate experience with campsite monitoring systems, to identify situations where more research is needed, and to provide additional sources of information.
The discussion of existing systems purposefully is critical. My intent is to identtty limitations and weaknessess, as well as to suggest useful approaches. Despite these shortcomings, those who have developed existing systems deserve much credit as pioneers in the field of monitoring. Others can learn from what has been accomplished and contribute to the development and use of increasingly effective monitoring systems. Finally, the opinions in this report are mine alone and as such are open to questioning, which I encourage.
RESEARCH SUMMARY This report summarizes information on techniques that
have been developed for monitoring campsites, particularly those in wilderness and backcountry. It is organized as a series of steps as follows: (1) evaluating system needs and constraints, (2) deciding on impact parameters and evaluation procedures, (3) testing of monitoring techniques, (4) training and documentation, (5) collecting field data, (6) analyzing and displaying data, and (7) applying data to management. For each step, existing techniques are described and evaluated, problems are discussed, and sources of information are listed. Detailed examples are included in a series of appendixes.
A wide variety of monitoring techniques have been developed. They range in format from photographic techniques to field measurement procedures of varying complexities. The techniques have been adapted to many diverse environments and many different types of impact. Experience in analyzing and using monitoring data is less developed. There is a critical need to develop low-cost monitoring systems w~h sufficiently high levels of precision. Opportunities for further research are numerous.
The use of trade or firm names in this publication is for reader information and does not imply endorsement by the U.S. Department of Agriculture of any product or service.
lntermountain Research Station 324 25th Street
Ogden, UT 84401

CONTENTS Page Page
Introduction .......................................................................... 1 Step 6. Data Analysis and Display ..................................... 25 Step 1. Evaluate System Needs and Constraints ................ 1 Analysis of the Current Situation .................................... 25
Decision Making ............................................................... 1 Analysis of Trends .......................................................... 30 Evaluation Criteria ............................................................ 2 Automatic Data Processing ............................................ 30 Photographic Techniques ................................................ 3 Research Needs ............................................................ 31 Condition Class Es1imates ...................... ; ........................ 4 Sources of Information ................................................... 31 Measurements on Permanent Sampling Units ................ 5 Step 7. Management Applications of Monitoring Data ....... 31 Measurements and Estimates Without Permanent Establishing Management and Budget Priorities ........... 31
Sampling Units ............................................................... 7 Management of Specific Sites ........................................ 31 Time Estimates ................................................................ 8 Relationship to Standards .............................................. 32 Research Needs .............................................................. 8 Use in Developing Visitor-Use Capacities ...................... 32 Sources of Information ..................................................... 9 Research Needs ............................................................ 33
Step 2. Decide on Impact Parameters and Sources of Information ................................................... 33 Evaluation Procedures ................................................ ~ 1 O References ........................................................................ 33
Decision Making ............................................................. 1 O Appendixes A-K: Selected Procedures Used To Monitor Impact Parameter Descriptions ...................................... 11 Wilderness Campsites ....................................................... 36 Research Needs ............................................................ 18 A. Photopoint Photography ......................................... 36 Sources of Information ................................................... 19 B. The Frissell Condition Class System ...................... 37
Step 3. Testing of Monitoring Techniques ......................... 20 C. The Sequoia-Kings Canyon Campsite Refinement of Techniques ............................................. 20 Class System ...................................................... 37 Calibration Procedures .................................................. 20 D. The Eagle Cap Method of Measurements Estimation of Measurement Error .................................. 20 on Permanent Sampling Units ............................. 40 Research Needs ............................................................ 23 E. The Sequoia Method of Measurements Sources of Information ................................................... 23 on Permanent Plots ............................................. 43
Step 4. Documentation and Training ................................. 23 F. The Olympic Bare Ground Technique .................... 44 Documentation ............................................................... 23 G. The Great Smoky Mountains Areal Training .......................................................................... 24 Measurement Technique ..................................... 46
Step 5. Field Data Collection Procedures .......................... 24 H. The Bob Marshall Rapid Estimation Procedure ...... 47 Data Forms .................................................................... 24 I. The Canyon lands Rapid Estimation Procedure ...... 51 Electronic Field Data Recorders .................................... 25 J. The Delaware Water Gap Rapid Estimation Research Needs ............................................................ 25 Procedure ............................................................ 54 Sources of Information ................................................... 25 K. The Hardware and Software Used To Collect
Data at Yosemite ................................................. 57 Hardware ......................................................... 57 Software ........................................................... 57


Wilderness Campsite Monitoring Methods: A Sourcebook David N. Cole
INTRODUCTION According to the Wilderness Act of 1964, recreational
use of wilderness is to be managed "so as to preserve its [the wilderness'] natural conditions" and such that "the imprint of man's work [is] substantially unnoticeable." Natural conditions have been most severely altered by recreational use on campsites. A first step that must be taken to control campsite impacts is to document campsite conditions and how they are changing over time. This information need has spurred considerable interest in the development of methods for monitoring campsites in wilderness and other backcountry areas.
The first publication to propose a specific method for systematically monitoring campsites was the Code-A-Site system (Hendee and others 1976). This was followed by a number of papers suggesting somewhat different approaches to campsite monitoring (Cole 1983a; Frissell 1978; Parsons and MacLeod 1980; Schreiner and Moorhead 1979). Since the publication of these reports, there has been considerable campsite monitoring activity-most of it unpublished and difficult to access.
This report discusses the monitoring technologies that have been developed for use on wilderness campsites and suggests where improvement is needed. The report is organized into a series of steps that must be taken in developing a monitoring system. The discussion of each step begins with a statement of purpose. For steps that require crucial decisions, a sequence of questions or issues that must be addressed is laid out. This is followed by a description of procedural details. Where there are alternative courses of action, the strengths and weaknesses of each alternative are discussed. Areas of needed research and development are highlighted, and finally, source$ of additional information are suggested. Detailed descriptions of representative examples of monitoring approaches are included in an appendix.
STEP 1. EVALUATE SYSTEM NEEDS AND CONSTRAINTS
The purpose of this step is to determine what type of monitoring system is needed and feasible and to establish a priority for the monitoring effort. The procedure is as follows:
1. Establish the need for a campsite monitoring system.
2. Identify the most serious types of campsite impact.
3. Identify the types of information a monitoring system needs to provide.
4. Evaluate funding and work force constraints.
5. Decide among several alternative approaches to monitoring.
The product is the selection of a monitoring approach, a decision that carries with it certain implications for funding and work force needs.
Decision Making The first question is, "Do I need a campsite monitoring
program?" Any wilderness that receives overnight use probably needs monitoring. Even where campsites are currently perceived as satisfactory, conditions may deteriorate or it may be important to document conditions for those who feel that impacts are excessive. Monitoring systems are generally most necessary in places with large numbers of sites or severe campsite impacts, places where use patterns are unpredictable or in a state of flux, and places where campsite management programs are changing or have not been evaluated. The overall importance of monitoring is underscored by the fact that most wilderness areas meet at least some of these criteria. Nevertheless it is valuable to document, in a written format, how critical campsite monitoring is to management. This decision will guide later decisions about funding for monitoring, decisions that will influence the quality of the information collected.
A related question is, "How do I plan to use this information?" Management applications of monitoring data are discussed in a subsequent section of this report. If you can develop a clear picture of how monitoring data will be used, however, it will be easier to design an efficient system.
The next question is, "Do I need an inventory of all sites?" Systems can be established to monitor either a sample of sites or all sites in the area. Monitoring a sample of sites can identify the.kinds of impacts that are occurring, as well as how conditions are changing over time. A carefully stratified sample can also provide information on how impacts and trends in impact vary with such factors as amount of use or location. But it is usually desirable to have information on changes in the number or spatial distribution of sites and information on the condition of all individual sites in the area. To obtain this information, a census of all sites is necessary.
If a census is not needed, sampling can reduce costs considerably. Several sites in each of a variety of environments and use situations (different amounts and types of use) could be examined. See such studies as Cole (1982, 1983b) and Marion (1984) for examples of this designreally more a research approach than monitoring.

The next question-regardless of the decision between a census and a sample-is, "How frequently do campsites need to be monitored?" It is unlikely that all campsites will need to be monitored every year. Once every 5 years seems to be a reasonable frequency for most situations. This is a long enough time for subtle changes to develop into measurable changes (at least on some sites), but a short enough time to identify impacts before they get out of control. Although many sites are unlikely to exhibit measurable changes, if the interval between observations is longer than 5 years, there is little opportunity to halt undesired changes. Appropriate monitoring frequencies must be decided on by each area.
Additional questions must be asked to decide which monitoring approach to adopt. One of those questions is, "What types of impact are of most concern and ne~d to be monitored?" Although the nature of impacts on wilderness campsites does not differ greatly between areas, management objectives will differ, and this should be reflected in the types of impact that are monitored. From field visits to representative campsites and the experience of on-theground managers, the most important types of impact to monitor should be identified. Types of impact that can be monitored, along with specific procedures for each, are described in step 2.
Another question to address is, "About how many campsites are there to monitor?" Although there is relatively little variation between most wilderness areas in the need for monitoring, the types of impact that are occurring, and the importance of monitoring all sites, there can be pronounced differences in the number and accessibility of sites. Some areas have a small number of sites, either because camping is allowed only on designated sites or because use levels are low and only a few places are suitable for camping. Other areas have thousands of sites widely scattered over areas as large as several million acres. Obviously, monitoring systems can be less costly in those 'areas with fewer sites.
A rough guess about number of campsites, along with decisions about monitoring frequency and types of impact to monitor, are needed to answer the question, "How much time will it take to complete an inventory using each of the various alternative methods?" The basic monitoring approaches available are described below. These descriptions conclude with an estimation of the time requirements per site, recognizing that such estimates would vary greatly, particularly with the type and number of impact parameters being evaluated. Estimate time requirements for each of these approaches, without making an initial judgment about a preferred approach.
As an example, if an area has about 500 campsites, and they are to be inventoried every 5 years, 100 sites will have to be visited each year. A technique that takes two people 2 hours per site would require 400 staff-hours in addition to travel time. A technique that takes one person only 5 minutes would require only 8 to 9 person-hours in addition to travel time. It should be noted that, for many of these techniques, travel time may exceed the time spent monitoring. This makes differences in the time required for monitoring less critical. It also suggests the value of combining monitoring tasks with other tasks, such as patrol or cleanup, to make the most use of travel time.
2
With an estimate of the time it would take to get the job done using each of these techniques, the next question is, "How much time can I afford to spend on monitoring?" Funding levels for management of wilderness and backcountry differ greatly between areas, as does the proportion of those funds allocated to monitoring. Areas with more resources available and fewer sites have a number of options available; those areas with fewer resources and/or more sites have few options. The more precise and informative approaches inevitably take more time and are more costly. Therefore, a fundamental decision about funding priorities must be made.
Once this decision has been made, the final question is, "Of those approaches that I can afford, which will best meet my needs?" Review the pros and cons of each approach described below in the context of the types of information needed and the types of impact of most importance. Select a technique that maximizes accuracy, precision, sensitivity, and the amount and quality of information (criteria that will be discussed below) for those types of impact and information of most importance. If information needs cannot be met with available funds, more funds should be sought. Many monitoring funds have been wasted because the information collected is inadequate (often reflecting limited available funds).
Evaluation Criteria
In order to evaluate alternative approaches, evaluation criteria are needed. All acceptable systems must have several basic features. As was mentioned before, a census of sites is vastly preferable to a sample of sites. Without a census, there is no information on number of campsites. It is also necessary for any system to be set up in such a way that the same sites can be relocated at a later date. Finally, a system will be of little use if it cannot identify change in the most important impact parameters.
Much of the difference between acceptable systems is in their relative accuracy and precision. Accuracy describes how close an estimate is to a true value; precision describes how close several estimates are to each other, regardless of how close they are to the true value. Using a dartboard as an analogy, accuracy would be measured by the proximity of the darts to the bull's-eye. Precision would be measure·d by the proximity of the darts to each other, regardless of how close they were to the bull's-eye. Accuracy is important because we want to assess the current situation for campsites. We want a system that will tell us as accurately as possible, for the most important parameters, how much impact has occurred. Precision is important because we want to identify trends over time. If techniques are imprecise we will not be able to distinguish real changes from separate imprecise estimates of the same value. To monitor trends, precision is more important than accuracy.
The quality of the information collected is influenced by the scale of measurement-whether nominal, ordinal, or interval (Schuster and Zuuring 1986). Nominal measures involve placing observations in categories that do not imply order. An example is noting whether a campsite is located in a lodgepole pine forest, a Douglas-fir forest, or

a f escue grassland. Ordinal measures place observations in categories that do imply a relative order, but there is no information about the distance between observations or categories. An example is noting whether trash on the site is absent, evident, or abundant. We know that sites with abundant trash have received more impact than those on which trash is evident, but we do not know how different they are. Interval measures do provide information on the difference between two observations. For example, a site with 25 pounds of trash has 10 pounds more than a site with 15 pounds. Not only do we know which site is more impacted, we also know how much more impacted it is. Clearly, the amount of information generated by interval measures exceeds that of ordinal measures which, in turn, exceeds that of nominal measures. Another advantage of interval measures, as will be discussed later, is that they can be combined into synthetic summary indexes of impact. Although such indexes have frequently been constructed from ordinal measures (Cole 1983a; Parsons and MacLeod 1980), this procedure is mathematically inappropriate.
Sensitivity, another important criterion, describes how large a change must be for it to be identified confidently as a change. Sensitivity is dependent on both precision and quality of information. High sensitivity requires both precise measurements and either interval measures or ordinal measures in narrow classes. High sensitivity is desirable because it permits the identification of subtle changes.
Another important criterion is amount of information. Obviously, a system that generates information on a number of different types of impact is preferable to one that collects just one bit of information, as long as both the quality and importance of the information are similar. Sometimes information is collected on several parameters, but the information is combined in a single index. Unless information on each parameter can be disaggregated, such an approach loses all but a single bit of information.
The final criterion, which unfortunately is often the most important, is cost. Although it is possible to design lowcost systems that meet some of our criteria for a highquality monitoring system, those that meet all of our criteria are the most costly.
As a final important note, the techniques described below were developed for a variety of purposes. Some were intended as monitoring systems; others were not. Those systems that do not rate highly in this critical review of each as the basis for a monitoring system are not necessarily "bad." They are described here because they have merits; unfortunately, all systems also have drawbacks. The important thing is to understand each alternative's pros and cons and to choose and modify a system that will -closely meet specified· needs. That is precisely why this first step of evaluating system needs is so important.
Evaluations of the monitoring systems described below are summarized in table 1.
Photographic Techniques Some of the earliest attempts at monitoring relied pri
marily on photographic techniques. Magill and Twiss (1965), for example, describe how repeated photographs from permanent camera points can be used to detect changes in wildland resources, including campsites. The attraction of photography is that subjectivity can be reduced; consequently, precision should be high. The fatal flaw in most systems based entirely on photography is that the most basic assumption-that the most important types of impact Will be monitored-is seldom met. Surprisingly few types of impact can be accurately evaluated in photographs, and essentially none of them can be assigned an interval level rating. Moreover, contrary to popular belief, photographs can lie. Photographs taken at different times of the day, under different lighting conditions, with different films, cameras, and lenses, or from slightly different vantage points can give misleading impressions.
Table 1-Strengths and weaknesses of alternative systems for monitoring campsites
Evaluation criteria
Scale of Amount of Monitoring system Accuracy Precision measurement Sensitivity information Cost
Photopoints (A) 1 Low High Low Mod. low Mod. low
Condition class estimates Frissell (B) Mod. High Ordinal Mod. low Low Low Parsons/Macleod (C) Mod. high Mod. high Ordinal Mod. low Low Low
Permanent measures Cole (0) High High Interval High High High Stohlgren/Parsons (E) High High Interval High High High
Nonpermanent measures Schreiner/Moorhead (F) Mod. high Mod. Interval Mod. Mod. low Mod. Bratton (G) Mod. Mod. low Interval Mod. Mod. Mod. high Cole (H) Mod. high Mod. Ordinal Mod. High Mod. low Kitchell/Connor (I) Mod. high Mod. Ordinal Mod. High Mod. low Marion (J) Mod. high Mod. low Interval Mod. Mod. high Mod. low
1 Letters in parentheses refer to the appendix that provides a detailed description of each monitoring system.
3

In conclusion, although the accuracy and precision of photographs can be high, this is not always the case and accuracy and precision are irrelevant if important types of impact cannot be monitored. Sensitivity is low in most cases, as is the amount of information collected. Two reviews of available photographic techniques have concluded, consequently, that photographs should enhance but not replace the field measurements that are the foundation of most monitoring programs (Brewer and Berrier 1984; Cole 1983a).
Photographs can play several extremely important roles, however. They can be an indispensable means of determining if you are on the correct site when returning to reexamine a site. For relocational purposes, it is helpful to include in the photograph- unusual landmarks or features likely to be around for a long time. Photographs are also an important tool for teaching evaluators to make consistent judgments when monitoring sites. This will be described in detail in step 4-documentation and training.
Photographs can also be a useful way to illustrate cl!anges documented with field measurements. This can increase the effectiveness of written documents and presentations in communicating information on conditions and trends. Consequently, it is a good idea to take periodic photographs from permanent photopoints on a sample of sites. The sample should include as wide a range of situations (impact levels, types of impact, environments, and so forth) as possible. Guidance on establishing permanent photopoints can be found in Magill and Twiss (1965), Brewer and Berrier (1984), and in appendix A.
Condition Class Estimates These systems involve assigning each campsite to a
condition class category based on defined levels and/or types of impact. The presence, absence, or degree of change in certain critical parameters is quickly noted and forms the basis for an impact rating, usually between 1 and 5. Such systems can provide relatively accurate and precise estimates of overall impact. Sensitivity is low to moderate, depending on the number of categories that are defined. Sensitivity is higher when more classes are recognized, but this reduces precision because it increases the likelihood of differences of opinion about which class a site should be assigned to. The critical limitation of this technique, however, is that only one bit of information is provided and this information is only of an ordinal level. The only information that can be gleaned from such systems is the relative overall impact level on each site and whether conditions have improved or deteriorated enough, over time, to assign the site to another class. Information about specific types of impact and trends in specific impacts is lacking.
These systems are a good choice for areas with little funding per site. Only a few minutes are needed to locate each site on a map and record its condition class. This provides a gross estimate of impact levels and distribution. Such estimates are likely to be acceptably accurate and precise without spending much time on each site.
Two examples of condition class systems will be presented. The first example is the system proposed by Frissell (1978), based on his experience in the Boundary
4
Waters Canoe Area Wilderness and in what is now the Lee Metcalf Wilderness. This system consists of descriptions of five condition states based on extent of vegeta.tion loss, mineral soil exposure, tree root exposure, erosion, and tree mortality. Frissell's classes are as follows:
1. "Ground vegetation flattened but not permanently injured. Minimal physical change except for possibly a simple rock fireplace."
2. "Ground vegetation worn away around fireplace or center of activity."
3. "Ground vegetation lost on most of the site, but humus and litter still present in all but a few areas."
4. "Bare mineral soil obvious. Tree roots exposed on the surface."
5. "Soil erosion obvious. Trees reduced in vigor and dead."
Each campsite is simply assigned to the class that most accurately describes the condition of the site.
One problem with this system occurs when sites do not meet all of the criteria of any single class. For example, it is not uncommon for sites to have extensive tree root exposure (class 4), but retain litter and humus in all but a few places (class 3). This problem can be handled by assigning the site a value equal to the midpoint of two classes-for example, 3.5 in the example just described. Having done this, however, it is not possible to tell whether a 3.5 site has root exposure but little mineral soil or abundant soil exposure but no root exposure. In the Boundary Waters Canoe Area Wilderness, Marion (1986) found sites that fit all five condition classes, as well as each of the four midpoints between classes.
Another alternative would be to reword the definitions in such a way that if either of several conditions were found, the site would be assigned to that class. For example, the definition of class 4 could be changed to "Bare mineral soil obvious or tree roots exposed on the surface." If either of these conditions occurs, the site is assigned to class 4.
The problems that result from a combination of moderately low sensitivity and the provision of only one bit of information are more serious. In a study of campsites in Eagle Cap Wilderness, 71 percent of the sites examined were condition class 4 sites, despite considerable variability in site conditions, amount of impact, and amount of use (Cole 1982). In a study of a wide range of campsites in the Boundary Waters Canoe Area Wilderness, Marion (1986) assigned about two-thirds of all sites to classes between 2 and 3. Moreover, dramatic changes in condition must occur before they will be reflected in a change in condition class. Over a 5-year period, only one of the 22 Eagle Cap sites changed an entire condition class.
A final problem is that, while Frissell's system works well in coniferous forests with conspicuous ground cover vegetation and thick organic horizons, it does not apply to many other environments, such as areas above timberline, grasslands, or deserts. This problem can be dealt with by developing similar class definitions that are adapted to these other environments. In wilderness areas with a variety of structurally distinctive environments, however, it may be impossible to develop readily comparable rating systems that work well in all environments.

This problem-of a system working well in some environments but not in others--is avoided with a condition class system that was devised by Parsons and MacLeod (1980) for use in Sequoia and Kings Canyon National Parks. They also recognize five condition classes, in this case based on eight criteria: density of vegetation, composition of vegetation, total area of the campsite, barren core area, campsite development, litter and duff, social trails, and tree mutilations. For each of these criteria, the site is assigned a rating from 1 to 5, based on descriptions (see appendix C for more detail). The condition class is then the closest integer, between 1 and 5, to the mean of these ratings. With practice, the evaluator can simply look at a site and assign it to a condition class without going through the process of assigning a rating to each criterion and determining a mean. This results in a system quite similar to that ofFrissell in which "a class one campsite would usually be no more than a small sleep site and possibly a fire ring, with little or no vegetative change or trampling evident," while "a class five site would be a large, heavily used barren area" (Parsons and MacLeod 1980).
Compared with Frissell's (1978) system, this approach avoids the problem of sites not fitting into a single class. By including more impact parameters, as well as a range of conditions for each parameter, the distribution of sites across the range of condition class values is more equitable. The Parsons and MacLeod (1980) system is probably less precise than the Frissell system because more decisions (one for each criterion) must be made before a class rating can be assigned. Moreover, the practice of assigning a class rating without evaluating each criterion, once considerable experience with the system has been gained, also increases the likelihood of bias and loss of precision.
The Parsons and MacLeod ( 1980) system is a more accurate predictor of impact, h_owever. Two studies have correlated condition class ratings with impact indexes derived from careful measurements on campsites. High correlations were found in both the Eagle Cap (Cole 1982) and Boundary Waters Canoe Area Wildernesses (Marion 1986), indicating that both systems accurately portray impact levels on campsites. In the latter wilderness, where both the Frissell system and a modification of the Parsons and MacLeod system were compared, the correlation coefficient was considerably higher for the Parsons and MacLeod method.
Such systems clearly achieve some of the goals of an inventory and monitoring system and can be a good choice in places with severe funding constraints-a common situation in wilderness and backcountry. They provide relatively accurate and precise information on (1) the number and distribution of sites, (2) changes in the number and distribution of sites, (3) relative impact levels in different portions of the wilderness, and ( 4) relative impact levels for individual sites. Their value in monitoring changes in the condition of individual sites is more limited. Moderately low sensitivity and low information content mean that only sizable changes in. overall condition can be detected and no information is available on what types oflmpact are particularly severe or either deteriorating or improving.
5
This means that monitoring information cannot be used to develop campsite management programs that target specific types of impact in particular places. Problem areas can be flagged, but it will be up to managers to guess how they have changed and to decide, on the basis of field examinations, what should be done.
Two other problems are of a more technical nature. One problem is that use of condition class systems locks managers into the current set of impact parameters and their implicit equal weighting. If managers change their opinions on the parameters to be used or their relative importance, they will raise serious problems. If they redefine the condition classes, the information generated will no longer be comparable to previous ratings. on· the other hand, if they continue to use definitions that are no longer appropriate, the survey may be largely irrelevant.
The second problem is confined to the Parsons and MacLeod (1980) system. It results from performing the mathematically improper procedure of calculating the mean of several ordinal ratings. Because the intervals between ordinal ratings are unknown-they undoubtedly differ both within and between criteria-a mean cannot be readily interpreted (Schuster and Zuuring 1986). Although a class 5 site would clearly be more highly impacted than a class 1 site, certain class 4 sites may not be more impacted than class 3 sites. Although the high correlations between these inappropriate means and interval scale measurements suggest that a site with a high mean is usually highly impacted, use of this improper procedure interjects_ potential for misleading results.
Measurements on Permanent Sampling Units
A very different approach is to take detailed measurements of a number of impact parameters on permanently located sampling units, usually quadrats, transects, or the entire campsite. Periodic repeat measures of such parameters as vegetation cover and composition, mineral soil cover, and bulk density or number of damaged trees can provide highly accurate and precise measures of impact. If designed properly, such data are highly sensitive and the amount of information is high because many parameters can be examined and interval measures can be obtained. Such systems rate highest in all evaluation criteria with the exception of cost. Measurements of this type usually require several people spending several hours on each site, and additional office time is required for data reduction.
Because costs are so high, it is unlikely that measurement systems based on permanent sampling units can do more than sample sites. Therefore, these techniques are more common in research studies than in a true monitoring program. Given a relatively small number of sites, measurements of this type could form the basis for a monitoring program that provides a large quantity of accurate and precise information. More commonly, detailed measurements on a sample of sites might be used to supplement less precise rapid estimates taken on all sites.

Two alternative designs will be described here. The first design was initially used in a study of changes on a sample of 26 campsites in the Eagle Cap Wilderness initiated in 1979 (Cole 1982, 1986a). It has subsequently been used, in modified form, on samples of campsites in various areas, including the Bob Marshall Wilderness (Cole 1983b), Grand Canyon National Park (Cole 1986b), and Delaware Water Gap National Recreation Area (Cole and Marion 1988). It has proven to be a useful design for describing both current impact levels and changes over time. A more detailed description of the procedure is included in appendix D.
The procedure calls for a large nail to be buried near the center of each campsite. For subsequent monitoring purposes, this nail can be.found with a lightweight pin locator (a type of metal detector). From this point, the distance to the edge of the obviously disturbed part of the site is measured in 16 directions. The polygon enclosed by straight lines connecting transect end points defines the camp area, within which damage to trees and density of tree reproduction (number of stems/acre) is evaluated.
Four transects between the center point and campsite boundary are established at right angles to each other. Nails are buried at the end of each transect to facilitate reestablishment of each transect. Approximately fifteen 3.3- by 3.3-ft (1- by 1-m) quadrats are located along these transects. The number of quadrats on each transect is proportional to the relative length of each transect. The distance between successive quadrats decreases with distance from the center point so that there is less tendency to oversample the center of the site.
The canopy cover of total ground cover vegetation, exposed mineral soil, and each plant species is estimated for each quadrat. Measures of the depth of organic horizons and the penetration resistance of the soil are also taken in each quadrat. Means for each of these parameters are then calculated for the campsite as a whole. Four soil samples are taken in the central part of the campsite to obtain measures of soil bulk density, moisture content, and chemical composition. Finally, four measures of water infiltration rate are taken close to these soil samples.
While these measures provide information about the condition of the campsite, they do not indicate how much change has occurred on the site. For example, a site with a vegetation cover of 50 percent may be perfectly natural or it could have lost as much as half of its vegetation cover. To obtain estimates of how much change has occurred on campsites, similar measures are taken on environmentally similar undisturbed sites (controls) in the vicinity.
Selection of suitable controls demands great care. The idea is to select a site that you think the campsite would have looked like before it was camped on. The best controls will be similar to the campsite in tree canopy density, rockiness, and slope, and have ground cover species similar to those surviving in protected places on the campsite. It is also desirable to find a control as close to the campsite as possible.
Once selected, the control must be referenced to the campsite so it can be relocated. Then a nail should be buried at the site center. The most efficient size for a control will vary with environmental heterogeneity;
6
controls should be larger in more heterogeneous environments. In the Eagle Cap, circular controls of 1,000 to 2,000 ft2 (100 to 200 m2 ) were used.
In order to characterize amount of impact, campsite conditions are compared to those on controls. For example, the difference between vegetation cover on the campsite and the control provides an estimate of how much vegetation has been lost from the campsite. To characterize change over time, one can either examine the difference between campsite conditions obtained during successive observation periods or examine the change in the amount of impact (the campsite/control comparison). For example, on Eagle Cap sites receiving moderate levels of use, vegetation cover decreased from 6.1 percent in 1979 to 5. 7 percent in 1984; vegetation loss (the difference between cover on campsites and controls, expressed as a proportion of cover on controls) increased from 75 percent in 1979 to 79 percent in 1984 (Cole 1986a).
A different design was employed to follow change on closed campsites in Sequoia National Park (Stohlgren and Parsons 1986). Refer to appendix E for more detail. On each campsite, a 32.8- by 32.8-ft (10- by 10-m) study area is identified. Permanent stakes are placed around the perimeter at 3.3-ft (1 m) intervals. Buried nails at each of the four corners can serve to permit relocation of these stakes. String is set up between stakes to establish a grid of 10.8-ft2 (l-m2) squares. Each quarter of each square is then subjectively stratified into core, intermediate, or periphery. Core areas are the most denuded places, located close to the center of the site. Intermediate areas exhibit obvious impact, but have more vegetation cover, less litter and duff pulverization, and some pockets of intact surface sod. Periphery areas, essentially controls, appear to be unimpacted. Of all the quarter squareseach 2. 7 ft2 (0.25 m 2 ) -that fall entirely in one of these strata, five to 10 are randomly selected. In each, canopy cover of each plant species is estimated and bulk density, soil penetration resistance, litter accumulation, soil moisture, and soil chemistry are measured.
Both the Eagle Cap (Cole 1982) and Sequoia (Stohlgren and Parsons 1986) systems will provide quite precise measures of change because each employs replicable measures on plots that can be readily relocated. There can still be measurement error, however, if for example, estimates of vegetation cover tend to be high one year and low the next year. If campsites are compared with controls, this problem should be reduced because the same bias would be applied to controls and, therefore, canceled out when the differences between campsite and control are calculated.
Levels of accuracy and information provided are likely to be very different depending on which of these techniques is used. The Eagle Cap technique provides only one measure of each type of impact, characteristic of the entire campsite. The Sequoia technique recognizes that conditions within the campsite are not homogeneous and provides one measure characteristic of the most highly impacted parts of the site and another measure for the parts of the site that are intermediate in impact. Depending on information needs, this added information provided by the Sequoia technique can be useful or it can add unnecessary complexity. It provides a more accurate picture

....
of intrasite variability but does not provide a single summary measure for the entire site.
Several features of the Sequoia technique reduce its accuracy, relative to the Eagle Cap technique. First, measurements are taken on only a very small proportion of the site. Measurements on the core and intermediate areas are taken in a total area of no more than 50 ft2 (5 m2
) compared to 150 ft2 (15 m2) on Eagle Cap sites. Moreover, on most sites much of the campsite is likely to be outside of the 1,076-ft2 (100-m2) area that was sampled. (The median camp area in the Eagle Cap was almost twice this size.) Second, using periphery measures as control values can be misleading. Areas less than 16 feet (5m) from the center of the site are likely to either be quite disturbed or, if they have not been disturbed, they are likely to be environmentally distinct from the campsite proper (for example, under a tree or among rocks).
Both the Eagle Cap and Sequoia techniques provide useful, precise, and sensitive information on change to the campsite. As Stohlgren and Parsons (1986) have shown, the added information provided by stratifying the campsite into core and intermediate zones may be preferable for examining recoyery of closed sites because intermediate parts of the site recover more rapidly than core parts. But the Eagle Cap technique appears more likely to provide accurate estimates of how much impact has occurred to the site as a whole because the entire campsite is included in the sample, the size of the area sampled is larger, and controls are likely to be more representative. It appears that it should also require less time and therefore should be less costly.
Other variations on these techniques can and have been tried (Echelberger 1971; LaPage 1967; Leonard and others 1983; Magill 1970; Merriam and others 1973). The most useful ones will provide accurate measures of how much impact has occurred to the campsite and be designed to facilitate precise replication of measurements on the same sampling units. It is the care that goes into precise replication that takes so much time and makes these techniques costly.
Measurements and Estimates Without Permanent Sampling Units
With the preceding techniques much time is spent establishing permanent sampling units on campsites. Several alternative systems take measurements and estimates of impact on campsites without establishing permanent plots. Schreiner and Moorhead (1979) developed such a system in the early 1970's for use in Olympic National Park. They measured the distance to the first live plant along eight transects radiating from the center of the site. The average distance was used as the radius of a circle to calculate bare ground area. They also counted the number of access trails radiating from the site to water, the main trail, or other campsites, as well as the number of places that had been trampled heavily by horses, within 100 feet of the site.
In a study of campsites in Eagle Cap Wilderness, the bare radius proved to be highly correlated with a synthetic index of change in a number of impact parameters
7
(Cole 1982). This suggests that it does provide an accurate indicator of overall impact. Precision is more of a problem, however. Centerpoints were not permanently marked and slight shifts in the center resulted in sizable differences in bare radius and area. With a large measurement error, only sizable changes in bare radius or area can be interpreted as definite changes in impact; consequently, sensitivity is only moderate. Only three types of information were collected. Although interval scale measures were taken, the advantage of interval measures over ordinal measures is reduced by the sizable measurement error. Costs are moderately low because these techniques require little time on the campsite. One variation of this system required that a scale map be drawn; this required considerable time, making it costly as well.
Another system based on areal measures was used on backcountry campsites in Great Smoky Mountains National Park (Bratton and others 1978). In this system, the lengths and widths of various types of impact were measured. The types of disturbance measured were bare rock, mud, slope erosion, and bare soil (all of which could be combined in a measure of total bare soil), leaf litter (areas in which litter remained but all vegetation was lost), and trampled vegetation. In addition, trash, tree damage, and firewood clearing were quantified by measuring out along at least two axes to where these disturbances ceased and then calculating the area involved.
The data generated by this system are only moderately accurate. As Bratton and others (1978) noted, defining all of these disturbances as rectangles overestimates damage. Moreover, the only data provided are areal measures of impact. No data can be generated, for example, on how many trees have been damaged or how much vegetation has been lost. In addition, the lack of controls makes it impossible to estimate how different campsites are from undisturbed areas.
The precision level of this system is likely to be moderately low. No permanent center points or transects were established. In future remeasurements, new center points and axes will be selected. The resultant areal measurements are likely to be very different, even if no change in impact occurs. Given the sizable measurement error, differences in areal measures would have to also be sizable before they could be interpreted as definitive evidence of a change; therefore, sensitivity is only moderate. Compared to the Schreiner/Moorhead technique, information is collected on more types of impact, although many important types (such as tree damage, soil compaction, access trails, or change in vegetation composition) are left out. Again the value of interval scale data is reduced by the sizable measurement error. Finally, it appears that this technique would be quite time consuming, suggesting that the cost of implementation would be moderately high.
In evaluating these systems in relation to the permanent plot approach, the question that arises is whether or not the lower cost is worth the loss of precision and sensitivity that comes with not establishing permanent sampling units. If the cost savings is worthwhile, would it be worthwhile to cut costs even further by relying less on detailed measurements? ·

Much of the progress in recent years has come in the search for techniques that will provide a suitable compromise between costly measurement systems and systems that provide little specific information. The nagging problem with all of these techniques is their relatively low precision levels. How can one rapidly estimate impact parameters while still keeping measurement error small?
A series of estimation systems have been developed that draw heavily on earlier ideas, particularly s0me of those advanced by Schreiner and Moorhead (1979) and Parsons and MacLeod (1980). The major differences have been attempts to (1) collect information on more parameters than Schreiner and Moorhead did, (2) avoid the problem inherent to the Parsons and MacLeod system of not being able to disaggregate data on each parameter, and (3) maximize precision levels but use interval measures where possible. Progress has been made, but problems remain. Despite these problems, I believe that once refined, these systems will provide the best compromise for the budgets of most backcountry areas.
A system developed by Cole (1983a) is patterned closely after that of Parsons and MacLeod (1980). The most important change is that each parameter is recorded separately in the field. While this adds a few minutes to the time it takes to complete the form-requiring an average of about 10 to 15 minutes for experienced evaluators to measure a site-it increases the amount of available information greatly. Other changes include (1) use of more precisely defined techniques for evaluating change in vegetation density and litter and duff cover, (2) deletion of the vegetation composition parameter, (3) separation of the mutilation parameter into a count of both trees that have trunk damage and trees with exposed roots, and (4) separation of campsite development into both development and cleanliness parameters. See appendix H for a detailed description of the procedure.
The accuracy of this system was evaluated by Marion (1986) and found to be moderately high, as the Parsons and MacLeod (1980) system was. Precision is less high, however; it is only moderate. This results from the fact that many more judgments must be made in the field. The fact that categories are broad suggests that, with training, judgments should be acceptably precise, but differences of opinion will be more common than with condition class systems or measurements taken on permanent plots.
The primary advantage of the system is the large amount of information that can be collected in a short period of time. Of all systems, this produced the most information per unit of cost. Although the system initially consisted entirely of ordinal estimates, it was eventually modified to consist of interval estimates that were recorded and then used to assign each parameter an ordinal ranking. This provides even more information, although the precision of the interval estimates must be questioned. Measurement error needs to be minimized (see step 4) and quantified (see step 3).
With all of this information, it is clearly advantageous to assign a single summary impact rating (essentially a condition class) to each site. This is done by multiplying each parameter by a weight assigned to each parameter (more important types of impact are assigned higher
8
weights). These products are then summed to provide a summary rating. Dividing these ratings into, for example, five classes will produce five condition classes. Changes over time in summary rating can be followed, as can changes in the individual impact parameters.
As was the case with the Parsons and MacLeod (1980) system, this procedure improperly sums a series of ordinal rankings. This makes the summary ratings difficult to interpret. Widely divergent ratings should accurately reflect the relative impact of different sites; however, interpretations of even relative differences between sites with proximate summary ratings are suspect. A site with a rating of 50 may be less impacted than a site with a rating of 47, for example. This merely reinforces the major problem with this type of system-a precision level that is lower than desirable, and a paucity of information on just how low precision is.
Despite these problems, modifications and similar systems have been developed for use in such widely divergent situations as canoe campsites in the Boundary Waters Canoe Area Wilderness and the readily accessible Delaware Water Gap National Recreation Area (see appendix J), sites on whitewater rivers such as the Middle Fork of the Salmon and Colorado Rivers, and backpacker sites in the deserts of Canyonlands (see appendix I) and Grand Canyon, as well as sites in mountainous areas similar to those where such systems were first developed. Although parameters and procedures differ (these will be described more fully, with examples, in step 2), the approach of making rapid estimates of a number of parameters remains consistent.
At the Delaware Water Gap, however, problems with low precision have led managers to base as many methods on counts and measurements as possible. As methods for the area have developed, managers have felt it necessary to spend more time and to use more precise techniques (see appendix J).
Time Estimates Clearly, the time required to use any of these ap
proaches will be highly variable. Nevertheless, it seems important to provide some general estimates of time required. Photopoint systems might take one person about 30 to 60 minutes per site, depending on the number of photographs to be taken. The condition class systems take one person from 3 to 5 minutes per site. The systems of measurements on permanent plots usually take two people between 1and3 hours per site, depending on the parameters to be measured. The measurement and estimation systems without permanent plots are highly variable; the Cole (1983a) system might take one person 10 to 15 minutes per site, while a system similar to that used by Bratton and others (1978) might take several people several hours per site.
Research Needs The primary research need is to refine rapid estimation
techniques that provide information on a number of separate impact parameters but do not take very much time per site. The problems with these techniques are low

precision levels, uncertain measurement errors, and use of inappropriate summary impact ratings. Some means of increasing precision levels are described in steps 2, 3, and 4, steps that involve the development, testing, and documentation of specific procedures. Research needs to go further toward identifying the most precise estimation procedures and suggesting means of maximizing precision. The issue of measurement error and its estimation is dealt with in step 4. Very little evaluation of error has been conducted, however; more research is needed on this subject. Several appropriate ways to calculate summary impact ratings are described in step 2; more work on this subject would also be valuable.
Sources of Information Bratton, Susan Power; Hickler, Matthew G.; Graves,
James H. 1978. Visitor impact on backcountry campsites in the Great Smoky Mountains. Environmental Management. 2: 431-442. (Describes the system of areal measurements used to measure the condition of campsites in Great Smoky Mountains National Park.)
Brewer, Les; Berrier, Debbie. 1984. Photographic techniques for monitoring resource change at backcountry sites. Gen. Tech. Rep. NE-86. Broomall, PA: U.S. Department of Agriculture, Forest Service, Northeastern Forest Experiment Station. 13 p. (Describes and evaluates a variety of photographic techniques that can be used to monitor conditions on campsites and trails.)
Cole, David N. 1982. Wilderness campsite impacts: effect of amount of use. Res. Pap. INT-284. Ogden, UT: U.S. Department of Agriculture, Forest Service, Intermountain Forest and Range Experiment Station. 34 p. (Describes measurement techniques for monitoring change on permanent plots. Also correlation between these measures of impact and individual indicators of impact, including Frissell's condition class.)
Cole, David N. 1983. Monitoring the condition of wilderness campsites. Res. Pap. INT-302. Ogden, UT: U.S. Department of Agriculture, Forest Service, Intermountain Forest and Range Experiment Station. 10 p. (Describes the uses and desirable characteristics of a monitoring system. Includes a detailed description of a system based on rapid estimates of many different impact parameters.)
Cole, David N. 1984. An inventory of campsites in the Flathead National Forest portion of the Bob Marshall Wilderness. Unpublished report on file at: U.S. Department of Agriculture, Forest Service, Intermountain Research Station, Forestry Sciences Laboratory, Missoula, MT. 19 p. (Describes a monitoring system, based on rapid estimates, that was used in the Bob Marshall Wilderness. Includes form, instructions, results of the inventory, and suggestions for further work.)
Cole, David N. 1985. Ecological impacts on backcountry campsites in Grand Canyon National Park. Unpublished report on file at: U.S. Department of the Interior, National Park Service, Western Regional Office, San Francisco, CA. 96 p. (Describes techniques for monitoring campsite conditions on permanent plots. Also describes a monitoring system based on rapid estimates of a number of different parameters.)
9
Echelberger, Herbert E. 1971. Vegetative changes at Adirondack campgrounds: 1964 to 1969. Res. Note NE-142. Upper Darby, PA: U.S. Department of Agriculture, Forest Service, Northeastern Forest Experiment Station. 8 p. (Describes changes on automobile campgrounds.)
Frissell, Sidney S. 1978. Judging recreation impacts on wilderness campsites. Journal of Forestry. 76: 481-483. (Describes the Frissell condition class monitoring system.)
Hart, James B., Jr. 1982. Ecological effects ofrecreation use on campsites. In: Countryman, David W.; Sofranko, Denise M., eds. Guiding land use decisions: planning and management for forests and recreation. Baltimore, MD: Johns Hopkins University Press: 150-182. (Discusses impacts on developed campsites and describes a series of impact measurements.)
Hendee, John C.; Clark, Roger N .; Hogans, Mack L.; Wood, Dan.; Koch, Russell W. 1976. Code-A-Site: a system for inventory of dispersed recreational sites in roaded areas, backcountry, and wilderness. Res. Pap. PNW-209. Portland, OR: U.S. Department of Agriculture, Forest Service, Pacific Northwest Forest and Range Experiment Station. 33 p. (Describes the Code-A-Site system for monitoring campsites.)
Kitchell, Katherine P.; Connor, Jeff. 1984. Canyonlands and Arches National Parks and Na~ural Bridges National Monument draft recreational impact assessment and monitoring program. Unpublished paper on file at: U.S. Department of the Interior, National Park Service, Moab, UT. 80 p. (Describes rapid estimate monitoring systems for river, four-wheel-drive, and backpack campsites.)
LaPage, Wilbur F. 1967. Some observations on campground trampling and ground cover response. Res. Pap. NE-68. Upper Darby, PA: U.S. Department of Agriculture, Forest Service, Northeastern Forest Experiment Station. 11 p. (Describes changes over a 3-year period on a previously unused automobile campground in Pennsylvania.)
Leonard, R. E.; McBride, J.M.; Conkling, P. W.; McMahon, J. L. 1983. Ground cover changes resulting from camping stress on a remote site. Res. Pap. NE-530. Broomall, PA: U.S. Department of Agriculture, Forest Service, Northeastern Forest Experiment Station. 4 p. (Describes changes over a 2-year period on previously unused sites on islands off the Maine coast.)
Magill, Arthur W. 1970. Five California campgrounds ... conditions improve after 5 years' recreational use. Res. Pap. PSW-62. Berkeley, CA: U.S. Department of Agriculture, Forest Service, Pacific Southwest Forest and Range Experiment Station. 18 p. (Describes changes in the condition of automobile campgrounds.)
Magill, Arthur W.; Twiss, R. H. 1965. A guide for recording esthetic and biologic changes with photographs. Res. Note PSW-77. Berkeley, CA: U.S. Department of Agriculture, Forest Service, Pacific Southwest Forest and Range Experiment Station. 8 p. (Describes the use of photopoints to monitor changes in resources, including campsites.)
Marion, Jeffrey L. 1986. Campsite assessment systems: application, evaluation, and development. In: Popadic, Joseph S.; [and others], eds. Proceedings, 1984 river recreation symposium. Baton Rouge, LA: Louisiana State University, School of Landscape Architecture: 561-573. (Describes the results of tests of the accuracy of the Frissell and Cole rating systems and describes some refinements to the system used in the Boundary Waters Canoe Area Wilderness.)
Marion, Jeffrey L.; Cole, David N. 1987. Recreational impact assessment and monitoring systems: past, present, and future. Paper presented at the National Park Service Science Conference; 1986 July 13-18; Fort Collins, CO. (Describes the historical development of monitoring systems, as well as recent refinements, innovations, and areas of needed research.)
Merigliano, Linda. 1987. The identification and evaluation of indicators to monitor wilderness conditions. Moscow, ID: University of Idaho. 273 p. Thesis. (Describes a variety of monitoring techniques for many resource parameters, including vegetation and soils).
Merriam, L. C., Jr.; Smith, C. K.; Miller, D. E.; [and others]. 1973. Newly developed campsites in the Boundary Waters Canoe Area: a study of 5 years' use. Stn. Bull. 511, For. Ser. 14. St. Paul, MN: University of Minnesota, Agricultural Experiment Station. 27 p. (Describes changes on previously unused campsites over a 5-year period.)
Moir, William H.; Lukens, William M. 1979. Resource monitoring system, Chiricahua National Monument, Arizona. In: Linn, Robert M., ed. Proceedings, first conference on scientific research in the national parks; 1976 November 9-12; New Orleans, LA. Transactions and Proceedings Series No. 5. Washington, DC: U.S. Department of the Interior, National Park Service: 1189-1200. (Describes a system of measurements on permanent plots.)
Parsons, David J.; MacLeod, Susan A. 1980. Measuring impacts of wilderness use. Parks. 5(3): 8-12. (Describes the campsite class rating system used at Sequoia and Kings Canyon National Parks.)
Schreiner, Edward S.; Moorhead, Bruce B. 1979. Human impact inventory and management in the Olympic National Park backcountry. In: Ittner, Ruth; Potter, Dale R.; Agee, James K.; Anschell, Susie, eds. Proceedings, recreational impact on wildlands; 1978 October 27-29; Seattle, WA. R-6-001-1979. Portland, OR: U.S. Department of Agriculture, Forest Service, Pacific Northwest Region: 203-212. (Describes the monitoring system at Olympic, based primarily on measures of bare area.)
Schuster, Ervin G.; Zuuring, Hans R. 1986. Quantifying the unquantifiable: or, have you stopped abusing measurement scales? Journal of Forestry. 84: 25-30. (Discusses the proper uses of different measurement scales and common abuses, particularly in index construction.)
Stohlgren, Thomas J.; Parsons, David J. 1986. Vegetation and soil recovery in wilderness campsites closed to visitor use. Environmental Management. 10: 375-380. (Describes measurements taken on permanent plots to monitor change on closed campsites. Advocates stratifying sites into core and intermediate parts of the site.)
10
Sydoriak, Charisse A. 1987. Yosemite's wilderness trail and campsite impacts monitoring system. Paper presented at the National Park Service Science Conference· 1986 July 13-18; Fort Collins, CO. (Describes the camp-' site monitoring system used at Yosemite National Park-a modified version of the Parsons-MacLeod system.)
STEP 2. DECIDE ON IMPACT PARAMETERS AND EVALUATION PROCEDURES
The next step is to decide what to monitor and how to conduct the monitoring. At this point a monitoring approach should already have been selected and some of the most important types of impact should have been identified. Clearly it is most important to monitor the impact parameters considered to be the most critical.
Decision Making
If you have selected a photopoint system, step 2 can be skipped, although it might be worth reading for hints on what to photograph. Details on how to establish a photopoint system are included in appendix A. Some of the discussion in step 4-documentation-is also relevant to photopoint systems.
For all of the other approaches, decisions must be made about which impacts are most critical and, within the constraints of the three basic types of systems-condition class, measurements with permanent plots, and measurements or estimates without permanent plots--how each type of impact should be monitored. While it is not necessary or even desirable to collect information on all possible types of impact, it would be worthwhile to collect information on types of impact that require different management strategies. For example, because the size of the site and number of access trails might be controlled with site management techniques that are very different from the behavioral controls needed to deal with tree damage, it would be worthwhile to assess each of these different types of impact.
If a condition class system was selected in step 1, it is time to select the impact parameters to form the basis for the rating. The parameters Frissell (1978) used are well suited to forested areas with abundant understory vegetation and thick soil organic horizons; other parameters will have to be selected in very different environments, such as those above timberline, in grasslands, or in the desert. Considerable thought and creativity need to go into developing a system of this type. A sequence of progressive impact stages must be described, followed by definitions of each stage in terms of the most important impact parameters. It is important that categories are mutually exclusive so that all sites can be assigned to one and only one category.
It is a simpler matter to develop a condition class system similar to that described by Parsons and MacLeod (1980). Each type of impact is described separately so that the relationships between different types of impact need not be understood. Moreover, the large number of

parameters examined makes it likely that many different types of environment can be evaluated with this technique. Decisions must be made about which parameters to use, how each parameter will be evaluated, and how a summary rating will be derived. Assessment techniques for impact parameters and means of deriving a summary rating are described below.
If an approach similar to that of Parsons and MacLeod (1980) is selected, however, it is worthwhile to take the little additional effort to separately record information on each parameter. This increases the amount of information available many times. Although this requires more time, the added time is usually minor in comparison to the time spent in transportation. Separately recording each parameter should also increase the objectivity and precision of summary ratings because the procedure of deciding on a rating is not shortcut.
This simple change-recording each parameter separately-results in the type of system described by Cole (1983a, 1984) and used in such places as the Bob Marshall, Canyonlands (Kitchell and Connor 1984), and the Boundary Waters Canoe Area. As with the Parsons and MacLeod (1980) system, parameters and evaluation procedures can be selected from the following examples (although other parameters or procedures could certainly be developed). Generally, with these systems, each individual estimate does not require much time. Therefore, once on a site, it is usually worth collecting information on as many important parameters as possible.
If a system based on measurements in permanent plots was selected in step 1, each measurement can be quite time consuming, so it is more important to select only the most critical parameters. Much of the requisite time on the site, however, is involved in establishing and relocating permanent sampling units. Given this investment of time, it would be unfortunate to not collect information on as many important parameters as is feasible.
Impact Parameter Descriptions In the following sections, impact parameters that have
been included in monitoring systems will be described. A final section will discuss the derivation of summary ratings and condition class ratings. More detail on some of these procedures can be found in the appendixes.
Campsite Area-One of the most obvious measures of impact is the area affected by camping. Assuming a similar level of vegetation loss, soil compaction, and so forth, larger campsites can be considered to be more heavily impacted. For example, the quantity of vegetation lost from a 200-ft2 campsite that has lost 50 percent of its cover is twice that of a 100-ft2 site that has also lost 50 percent of its cover. In addition, size of the campsite is one of the most useful parameters for distinguishing between lightly and heavily used sites and it is more likely than most parameters to change over time (see, for example, Cole 1982, 1986a; Marion and Merriam 1985).
Although it is an obvious impact parameter, camp area can be difficult to measure accurately or precisely. Two problems contribute to inaccuracy. First, it can be difficult to define the edge of the site. In areas of dense fragile
11
vegetation, a boundary can be consistently defined by a contrast between untrampled vegetation and trampled vegetation or bare ground. Where vegetation is sparse, boundary definition can be difficult unless obvious disturbance of organic horizons can be used. In areas of rock outcrops, sand, and gravel, or in resistant vegetation such as dry grassland or meadows, it can be virtually impossible to define a nonarbitrary campsite boundary.
Even where a boundary can be defined, another problem stems from the difficulty of measuring the area of an irregular figure. If a site is a perfect circle or rectangle, its area can be measured precisely and quickly. Because this is never the case, accurate and precise estim~tes of the area of sites that differ greatly from simple geometrical shapes is time consuming.
The method that Cole (1982) used to monitor changes on sites in Eagle Cap is relatively precise. A permanent center point is used. From this point, 16 radial transects are extended out to the edge of the site. The distances from center point to boundary are plotted on radial maps and then the area of the site is determined with a polar planimeter. Accuracy increases with the number of transects; precision is increased by using a permanent center point. The Schreiner and Moorhead (1979) system, on which the Eagle Cap technique was based, is an example of a less accurate and precise system. It does not use a permanent center point, it uses only eight transects, and area was calculated on the basis of a mean radiusan assumption that would only produce an accurate result if the site was circular.
Cole's (1982) technique requires about 90 staff-minutes per site. The Schreiner/Moorhead technique might require only about 25 staff-minutes per site because it is not necessary to find the buried center point and it is not necessary to map the transect end points or use the planimeter.
If campsites are relatively regular in shape (without many peninsulas and islands that are not trampled), Cole's technique can be used to measure area, without plotting transects or using the planimeter. The 16 radial transects define two sides of 16 triangles; a straight line between transect end points is the third side. The area of the campsite is the sum of the area of the triangles, each of which can be calculated as 0.5 times the sine of the angle (0.383 for the 22.5-degree angles created by 16 transects) times the product of the two transect lengths. Any number of transects could be used, although the appropriate angle would vary. Use of this procedure would reduce time requisites considerably. Managers at Delaware Water Gap plan to use this technique in an effort to obtain more precise areal estimates than they have in the past (see appendix J).
More rapid areal estimates are also possible. If the area can be considered to approXimate either a circle or a rectangle, or a combination of simple geometric forms, a radius or lengths and widths can be paced off. Using the appropriate formulas, areas can be calculated quickly. While these areal estimates may not be very precise, they can be completed in a few minutes by one person. Moreover, in places where it is difficult to define a nonarbitrary boundary, these estimates may be as precise as the most careful measurements.

. -. - ~'
If rapid estimates of area are used, it is important to invest considerable time in training and in deriving a rough estimate of measurement error. This measurement error can be used to establish confidence limits around an estimate. Iffuture estimates are not beyond these limits, the interpretation should be that there is a high likelihood that no real change in area has occurred. More discussion of measurement error, its importance and use will be presented in step 3 .
Another way to both reduce estimation times and handle problems with precision is to merely assign each site to a class based on a range of areas. For example, in the Bob Marshall Wilderness (Cole 1984), three classes were defined: 0-500 ft2 (0-46 m2); 501-2,000 ft2
(47-186 m2); and >2,000 ft2 (>186 m2
). The system used in Sequoia and Kings Canyon National Parks recognized five classes: 0-20 ft2 (0-2 m2); 21-100 ft2 (3-9 m2); 101-500 ft2
(10-46 m2); 501-1,000 ft2 (47-93 m2 ); and >1,000 ft2
(>93 m 2). With experience, it is usually possible to assign a size class to many campsites without any pacing or measurement. As the number of classes increases, precision decreases-because the likelihood of assigning a site to the wrong class increases-but sensitivity increases. More classes are preferable, if relatively high precision can be maintained through training and calibration of evaluators. Ideally, classes should be as broad as the confidence interval around estimates, for whatever technique is used.
A final option, utilized in the Bob Marshall Wilderness (Cole 1984), is to estimate the area of the site and to then assign each site to a class, on the basis of this estimate. The ordinal class rating is used to compare the size of different sites or to evaluate change over time. The interval estimate is a help in interpreting change, particularly if estimates are close to the boundary of classes. For example, a change of one class is less meaningful if the original estimate was close to the boundary of the class assigned during a subsequent rating.
Although campsite area is an important measure of impact and has been monitored in most systems in use, its problems are considerable. Where defining nonarbitrary boundaries is difficult, it might be best to not measure area. Often there is a strong correlation between the devegetated area of the site and the total area of the site. Where devegetated area can be determined much more precisely than total area, it might be monitored instead. Across a variety of environments, however, devegetated area cannot be considered a surrogate for camp area. In general, the proportion of the camp that is devegetated should increase as vegetation fragility, amount of use, and roughness of the local environment increase.
Other problems with defining campsite area include how to handle separate sites that have grown together, satellite tent pads, and places offsite where stock have been tethered. The problem of intermingled sites is discussed in detail in step 5-field data collection procedures. Satellite sites and stock-holding areas either can be ignored (this reduces the accuracy of areal estimates of damage) or their area can be measured or estimated and then either reported separately or added to the total camp area. Problems can arise with deciding to which site one should assign a satellite site or stock holding area. One
12
should avoid contaminating a precise estimate of camp area with an imprecise estimate of satellite area. If techniques with different precision levels are used, the two estimates should be kept separate.
Campsite Development-Another common item to address is the extent of development; that is, the number and elaborateness of either agency or user-built facilities such as fire pits, rings, grates, or places; seats; tables; shelters; and so on. The usual technique has been to record the presence or absence of each, with or without a count of the number of each type of facility. In addition, development classes have been suggested by Parsons and MacLeod (1980) and by Cole (1983a) (see appendix H). The difference between the two is primarily in the number of classes and that Cole chose to separate cleanliness aspects (such as amount of trash) from development.
The ability to quantify this parameter is limited. Several systems require a count of firepits. A rapid estimate system developed for the desert environment of Canyonlands National Park (Kitchell and Connor 1984) also records the number of rocks larger than 6 inches in diameter that have been moved either to create flatter tent pads or to construct tables or seats. This number is then used to assign the site to one of four classes for rock displacement.
Cleanliness-Cleanliness refers to trash, human waste, horse manure, and campfire remnants, particularly charcoal. Again, quantification is difficult. In a study of campsites along the New and Delaware Rivers, the number of 33-gallon trash bags of garbage found on each site and the number of separate piles of toilet paper, with or without feces, within 164 ft (50 m) of the center of the site were counted (Cole and Marion 1988). This did not effectively distinguish between clean sites and ones with a small amount of trash. Counts of number of trash items have been used-for example, in the Canyonlands system (Kitchell and Connor 1984)-but this fails to distinguish between large items, such as a tarp, and small items, such as a cigarette butt. For human waste, Kitchell and Connor (1984) count pieces of toilet paper and piles of feces and note the presence or absence of urine odor. Such estimates vary with the eyesight of the evaluator and the time spent searching.
Problems with quantification can be dealt with through classification. For backpacker sites, Kitchell and Connor (1984) suggest classes for trash (none, 1-3 pieces, 4-6 pieces, and >6 pieces), toilet paper (none, 1-2 pieces, 3-4 pieces, and >4 pieces), and feces (none, 1 pile, 2 piles, or >2 piles). They have different categories for sites used by visitors in four-wheel-drive vehicles and sites used by boaters. Cole's (1983a) system deals simultaneously with all aspects of cleanliness. Categories are: (1) no more than scattered charcoal from one firering; (2) remnants of more than one firering or some litter or horse manure; and (3) either some human waste evident or much litter or horse manure.
Cleanliness and extent of development can have a profound effect on visitors. For example, Lee (1975) found that cleanliness and development were the site conditions most critical to the enjoyment of visitors in the Yosemite backcountry. But they are not a lasting ecological impact on the land; they are easily removed. A strong argument

can be built for noting cleanliness and development but separating them from ecological impact parameters. Counts of facilities, including firepits and the number of places where fires have been built, seem worthwhile. The problems with quantification of trash and human waste suggest, however, that a system of classes (such as none, some, and abundant) provides as much information and as high a level of precision.
In a study of impacts on camping beaches in Glen Canyon National Recreation Area, Carothers and others (1984) developed techniques for quantifying trash and charcoal accumulation. Trash accumulation was established by counting, removing, and weighing all human trash within 16 ft (5 m) of a 49- to 164-ft (15- to 50-m) transect running through the center of each site. Sand discoloration was used as a measure of ash incorporation into the sand. A 50-mL surface sample of sand was collected in each of 10 quadrats located along the transect and passed through a sieve (mesh size 150 microns). These samples were then shaken 75 times against a circular disk of coarse Fisher Filter Paper. A discoloration index was then obtained by matching the color of the filter paper to colors obtained from a series of beach sands containing known charcoal-ash concentrations. The index ranged from 1 (sand with no ash or charcoal) to 16 (sand that contains 10 percent residue by volume). It might be possible to design a similar technique for use in environments other than sand beaches.
A unique parameter used at Canyonlands (Kitchell and Connor 1984) is the abundance of ants, flies, and rodents on and around campsites. The idea is that sites with more of these pests tend to be more highly impacted. Four classes were derived for backpacker sites from "no pests within 50 feet [15 m] of the site" to "greater than 1 ant colony; ants throughout site; numerous signs of rodents, tracks, burrows and nests within 20 feet [6 m] of site."
Damage to Overstory Trees--Most systems attempt to monitor the extent of damage to overstory trees on campsites. Some of the questions that need to be addressed include how many different types of damage to assess separately, whether or not to consider only trees within the campsite boundaries, at what height or diameter does a tree become an overstory tree, at what level of damage should a tree be considered damaged, how to deal with felled trees and stumps, and whether to provide an interval level count of trees or a damage classification. One problem in some situations is distinguishing recreational damage from "natural" damage.
In the Eagle Cap and Bob Marshall Wildernesses, Cole (1982, 1983b) counted all trees greater than 4.5 ft (140 cm) tall on the campsite, noting the extent of damage to each tree. The number and percentage of trees that had been felled or that had trunk scars or exposed roots was calculated. The number and percentage of trees with any damage was also noted.
Marion (1984; Marion and Merriam 1985) distinguished four levels of damage to standing trees: none (no tree damage other than from obviously natural causes); slight (nails, nail holes, small branches cut off or broken, small superficial trunk scars); moderate (large branches cut off
13
or broken, trunk scars and mutilations that may be numerous but do not total more than 1 ft2 [0.09 m2] of area); or severe (trunk scars that total more than 1 ft2 [0.09 m2
] or complete girdling of the tree). Each standing tree within the campsite boundaries was counted and classified according to damage level. In this system, trees with a diameter at breast height greater than 0.8 inch (2 cm) were considered to be trees. A damage index was calculated by multiplying the number of trees in the "none" category by 1 and the number of trees in the slight, moderate, and severe categories by 2, 3, and 4, respectively. These products were summed, and this sum was divided by the total number of trees. The index, which varies between 1 and 4, can be interpreted as the average damage to trees on the site. For example, an index of 2.5 suggests that the average tree is about halfway between slight and moderate damage. Felled trees were recorded separately, although they might, more appropriately, have been placed in a fifth damage class.
A similar classification of root exposure was as follows: none (no root exposure other than from obviously natural causes); slight (the tops of many of the major roots exposed or more severe exposure on only one or two major roots); moderate (the tops and sides of many of the major roots exposed or very severe exposure on only one or two major roots); and severe (the tops, sides and undersides·ofmany of the major roots exposed). An index was calculated as for tree damage.
One problem with this approach is that many of the damaged trees are found offsite. Visitors usually tie their horses offsi te, causing root exposure, or fell trees for firewood or tent poles offsite rather than onsite. Thus, a count of damaged trees onsite will usually vastly underestimate amount of damage. The problem with counting trees offsite is that different evaluators may go different distances from the site to search for damaged trees. This reduces precision.
Bratton and others (1978) quantified tree damage in terms of the maximum distance from the center of the site along at least two axes. This measure is difficult to interpret (for example, it says nothing about the proportion of damaged trees or the severity of damage) and is not likely to be very precise.
Other systems have assigned rankings to sites based on the extent of tree damage. With the Parsons and MacLeod (1980) system, the number of mutilations is counted, regardless of their nature or whether they occur on one or more trees. Highly obtrusive mutilations are distinguished from other mutilations. Categories are: none, 1-2; 3-5; 6-10, or 1-2 highly obtrusive; and >10 or >2 highly obtrusive mutilations. Apparently, only trees on the campsite are included, although this and the definition of a highly obtrusive mutilation is not inclu~ed in their paper.
In the system developed for the Bob Marshall, Cole (1984) had evaluators count and record the number of trees that have been scarred or felled, as well as the number that have exposed roots that are obviously associated with the site being examined (regardless of whether they are onsite or not). Then sites are assigned to a class. For damage, the classes are: rio more than broken lower branches, 1-8 scarred trees or 1-3 badly scarred or felled trees, and >8 scarred trees or >3 badly scarred or felled trees.

; -~· '· :
··,·.·
To be "badly-scarred," the surface area of scars must exceed 1 ft2 (0.09 m2). The classes for root exposure are: none, 1-6, and >6 trees with exposed roots.
There are problems with any means of evaluating tree damage. Confining the monitoring to the campsite itself increases precision, but reduces the accuracy of the estimate of impact. Perhaps the best compromise for a lowcost system would be to count trees both onsite and offsite, but only count trees with pronounced damage, such as those in the moderate and severe classes that Marion and Merriam (1985) define. Recording the number counted, as well as an impact class, also seems a useful compromise between the low-information classification option and the problem, with a count, of having the number appear more precise.than it really is. Both can add to the interpretation.
Tree Reproduction-Loss of tree reproduction has been monitored using measurements on permanent plots, but I know of no examples ofrapid estimates. The technique is to count reproduction-defined in the Eagle Cap (Cole 1982) as trees between 6 and 55 inches (15 and 140 cm) tall-on the campsite and then calculate a density (such as number of stems/ha). Seedlings are then counted on a control-a 538-ft2 (50-m2) circle in the Eagle Capand density is calculated again. Subtracting campsite density from control density provides an estimate of the amount of reproduction per unit area (such as, per hectare) that has been lost on the site. Dividing this value by the control density provides an estimate of the proportion ofreproduction that has been lost.
One problem with this technique is how to handle reproduction growing in protected places on the campsite. Often all reproduction on the site can be found in protected clumps that are never trampled. In the Eagle Cap study, reproduction in "untrampled islands" was excluded as being unrepresentative of the trampled portion of the campsite. Excluding reproduction in untrampled islands overestimates impact on the campsite and reduces precision because it requires a judgment about whether or not a clump ofreproduction should be included. While counting all reproduction within the campsite boundaries may underestimate impact on the trampled portion of the site, this estimate should be more precise and it does provide an accurate representation of impact to the entire site.
Although there appear to be no examples, it should be possible to evaluate the density ofreproduction in classes similar to those for density of vegetation in the Parsons and MacLeod (1980) system. These classes could be: same as surroundings, moderately less dense than surroundings, and considerably less dense than surroundings. Because tree reproduction is often more patchily distributed than ground cover vegetation, it can be more difficult to get an accurate and precise estimate.
Shrub Damage-Iflarge resistant shrubs are a significant component of the vegetation, it can be worthwhile assessing damage to shrubs. This might be particularly important in places where trees are lacking and shrubs form the tallest vegetation layer. The only cases I know of where shrub damage has been assessed are in desert environments.
14
On backcountry campsites at Grand Canyon National Park, Cole (1985) counted number of shrubs and calculated shrub densities on campsites in twenty-five 10.8-ft2
(1-m2 ) permanently located quadrats. Shrub density was determined in a circular 538-ft2 (50-m2 ) control plot. Only shrubs rooted in plots were counted. There was often a problem deciding consistently how many individual shrubs to count in a shrub clump. The decision rule used was to count each clump of stems as one shrub. The main problem with this technique is that shrub density may not reflect impact because trampling damage often results in a higher density of smaller plants. In such cases, cover estimates might be a better choice.
At Canyonlands, classes have been delineated for both damage to shrubs and for root exposure (Kitchell and Connor 1984). On backpacker sites, damage classes are: none show any damage; 10 percent of shrubs show damage (for example, broken limbs, crushed appearance); 10 to 30 percent of shrubs show damage or one or two shrubs show reduced vigor as a result of damage; and >30 percent of shrubs show damage, more than two show reduced vigor, or dead and dying shrubs are present. Root exposure classes are: no roots exposed; roots exposed on one shrub; roots exposed on two shrubs; and roots exposed on more than two shrubs. Including both counts and percentages in a single definition can cause problems. For example, if there are only a few shrubs on the site, one or two damaged shrubs might represent damage to a majority of shrubs.
Damage to Ground Cover Vegetation-Several different aspects of ground cover vegetation damage are regularly monitored. The most common are the area that is devegetated, reduction in vegetation density or cover, and change in species composition. Each of these can and has been measured in permanent sampling units and estimated rapidly.
The Eagle Cap technique (Cole 1982), in addition to measuring the distance from permanent center point to the edge of the campsite, measured the distance from center point to the first significant amount of vegetation, along each of the 16 transects. This was a modification of Schreiner and Moorhead's (1979) use of eight transects without a permanent center point. These end points were plotted on a radial map and the area of the polygon (devegetated area) was determined with a planimeter. As mentioned before, summing the area of triangles is a more rapid means of calculating area.
It is important to decide on a vegetation cover or density that will be considered a "significant amount" of vegetation. The definition used in the Eagle Cap was at least 15 percent cover in a 1.09- by 3.28-ft (0.33- by 1-m) quadrat oriented perpendicular to and bisected by the tape. This boundary can usually be determined more consistently than the edge of the campsite, so estimates of devegetated area should usually be more precise than estimates of camp area. Only where ground cover is very sparse and patchily distributed is it difficult to determine the boundary of the devegetated area.
This technique only measures the area of a devegetated core close to the center of the site. Sometimes there are several devegetated places on a single campsite. These

could all be measured in the same manner, although this would be quite time consuming. The area of these other places could be estimated and added to the central area, without too much loss of accuracy, if they were much smaller than the central area that was measured. It would be unfortunate, however, to significantly contaminate a careful measurement of the central core with rough estimates of other barren places. It is also important to define how large a barren area must be to be included in such an estimate. Perhaps only devegetated areas larger than, say 10 m2, should be included.
The other alternative is to estimate the area of either the central devegetated area or all devegetated areas. As with camp area, radii, lengths, and widths can be estimated and then the appropriate area formulas can be used to determine area. In most systems only the size of the central area is estimated. This probably results in more precise estimates, although this provides a less useful estimate of vegetation loss on the entire site. Estimates can be either to the closest whole unit of measurement (for example, meter) or sites can be classified. For example, Parsons and MacLeod's (1980) classes for barren core area are: absent, 5-50 ft2 (0.5-4.6 m2), 51-200 ft2 (4.7-18.6 m2 ), 201-500 ft2 (18. 7-46 m 2
), and >500 ft2 ( 46 m2
).
Rapid estimate systems for the Bob Marshall (Cole 1983a, 1984) and the Grand Canyon (Cole 1985) also have classes for size of the devegetated center.
Most monitoring systems have used ocular estimates of vegetation cover rather than more precise measurements (for example, by using tools such as a point-frequency frame [Chambers and Brown 1983; Mueller-Dombois and Ellenberg 1974]) of cover or density. Most systems differ primarily in the size of the sampling unit for which cover is estimated.
With the more precise systems, cover is estimated in permanent quadrats-in fifteen to twenty 10.8-ft2 (1-m2 )
quadrats in the system that Cole (1982, 1983b, 1986b) has used in various places, or in ten to twenty 2.7-ft2 (0.25-m2)
quadrats in the system that Stohlgren and Parsons (1986) have used. Usually cover is estimated to the nearest 5 or 10 percent. The mean cover from all the quadrats provides an estimate of cover on the site. Such estimates should be quite precise; if the sample size is large enough and the samples are properly distributed, the estimate should also be quite accurate.
Few systems have attempted statistical determination of an adequate sample size. Such techniques do exist (see, for example, Chambers and Brown 1983; MuellerDombois and Ellenberg 1974). A sample of 5 to 10 percent of the site would probably be adequate in most cases. Because of the pronounced disturbance gradient on campsites from center to periphery, a systematic placement of quadrats provides a more accurate assessment for a given sample size than does a random placement.
The other quantitative alternative is to estimate cover on the entire site. This method is less precise simply because it is difficult to visualize cover of the entire site at one time. This reduction in precision should be reflected in how the data are displayed. For example, it would be misleading, although quite feasible, to record
15
cover to the nearest percent ifit could not be accurately estimated even to the nearest 10 percent. For the Bob Marshall system, Cole (1983a, 1984) recommends estimating cover in the following classes: 0-5 percent, 6-25 percent, 26-50 percent, 51-75 percent, and 76-100 percent. This might be improved by dividing the latter category into 76-95 percent and 96-100 percent classes. The midpoints of each category can be used as a single estimate of cover.
With either of these quantitative estimates of cover, the impact parameter of concern is not cover itself, but loss of cover. This can be assessed by estimating cover on an undisturbed control plot and then comparing campsite cover, to cover on a neighboring undisturbed control site. Identical techniques should be employed on both campsite and control. Vegetation loss can be expressed as either the difference between campsite and control as a proportion of the cover on the control. For example, if vegetation cover was 40 percent on the campsite and 80 percent on the control, loss could be either 40 percent (80 percent - 40 percent)-the amount less on the camp-or 50 percent ([80 percent - 40 percent]/80 percent), indicating that half of the vegetation has been lost.
In the Bob Marshall rapid estimate system (Cole 1983a, 1984), vegetation is estimated in categories, both on campsites and on a nearby unused comparative area. The rating for vegetation loss is based on the difference in number of coverage classes between campsite and control. The site is rated 1 (if there is no difference); 2 (if there is a difference of one class); or 3 (if there is a difference of two or more classes). In the Canyonlands system (Kitchell and Connor 1984), cover loss classes, when compared with control, are: <10 percent reduction, 10-30 percent reduction, 31-60 percent reduction, and >60 percent reduction.
Other modifications of this technique could be developed. The important elements are to make estimates in classes that reflect the precision of estimates, to make estimates both on campsites and controls, and then to express vegetation loss in terms of a comparison between the two.
Another alternative is to express vegetation loss in terms that are not quantitatively defined. The Parsons and MacLeod (1980) system asks for a rating of vegetation density as: same as surroundings, moderately less dense than surroundings, or considerably less dense than surroundings. Although not quantitatively defined, these categories probably reflect quantitative differences similar to those just noted.
Vegetation composition has also been assessed in similar terms. Parsons and MacLeod (1980) ask for a rating of composition, relative to surrounding vegetation, of: same as surroundings, moderately dissimilar, or significantly dissimilar.
In Canyonlands (Kitchell and Connor 1984), compositional changes are indicated by the proportion of the cover that consists of exotic and/or disturbance species (Kitchell and Connor 1984). For example, a site with none of these species is given the lowest rating, while a site on which >50 percent of the cover consists of exotic and/or disturbance species is given the highest rating (most impacted).

When estimates of the presence and/or cover of each species are available, both on campsite and control, it is possible to calculate various indexes of the difference in composition between campsites and controls. Cole (1982, 1983b) has calculated an index as follows:
Floristic dissimilarity= 0.5 x I. I P 1 - P 2 I,
where P 1 is the relative cover of a given species on the campsite and P 2 is the relative cover of the same species on the control. Relative cover is the cover of a species expressed as a percentage of the total cover of all species. It is calculated by summing the cover of all species and then dividing the cover of each species by this sum. The sum of the relative coverages of all species on a site will equal 100 percent. Good discussions of indexes that are based on presence or measures of importance other than relative cover, or that utilize other formulas, can be found in Mueller-Dombois and Ellenberg (1974) and Chambers and Brown (1983).
Most of these indexes range from 0 to 100 percent, with higher numbers indicating a greater compositional change. Interpretation is hampered by the fact that there is always some dissimilarity between two samples of the same area of vegetation. This inherent dissimilarity varies between vegetation types and with the sampling procedure and type of index. By comparing several replicate samples of control plots, an idea of inherent variability can be obtained. Unless floristic dissimilarity is substantially greater than this inherent dissimilarity, change in composition should be considered negligible.
An important type of impact in arid environments is disturbance of the fragile cryptogamic soil crusts that are so prevalent in deserts. Cryptogamic soils are formed by algae, fungi, lichens, and mosses growing in a matrix of soil. They often form conspicuous black pedestaled surfaces that are readily destroyed by trampling. In Canyonlands (Kitchell and Connor 1984), cryptogamic disturbance has been assessed with categories ranging from "no disturbance, (crust) still intact in appropriate habitat" to ">60 percent reduction of crust (when compared to adjacent undisturbed area)."
Impacts to Soil Organic Horizons-Three common measures of organic horizon disturbance are reduction in organic horizon cover, reduction in organic horizon depth, and an assessment of the degree to which the litter and duff has been disturbed. Reduction in organic horizon cover is estimated in a manner similar to that of vegetation loss. Estimates of cover can be made either in a set of quadrats or for the entire site. Cover classes are frequently used to reflect the precision level of such estimates. In most cases it is exposure of mineral soil that has been estimated. Mineral soil exposure is inversely related to organic horizon cover because it is only exposed after organic horizons are removed. Campsite cover is compared to cover on a control to determine increase in mineral soil exposure.
A problem that surfaces when estimating mineral soil exposure is how to deal with the situation where most organic matter has been removed but there are still thin patches of litter remaining. An explicit judgment must be made about where to draw the line between bare soil and
16
litter. I have tended to ignore thin, obviously disturbed patches of litter and treat such areas as exposed mineral soil.
There are two common problems with measuring a reduction in thickness of organic horizons. The first is the problem of defining the boundary between organic and mineral horizons. Although this boundary is usually gradational, with training and calibration, consistent definitions can be made. This source of error will be most serious when organic horizons are quite thin (for example, less than 1 to 2 cm).
The more serious problem relates to where to locate samples. The thickness of organic horizons frequently increases from the center of the site to the edge. This pattern is superimposed upon a pattern of random variation in thickness related to litter fall and decomposition rates. Enough samples must be taken to adequately account for the random variation and they must be distributed in a consistent manner, from year to year, relative to the disturbance gradient. If permanent quadrats have been established, a good solution is to take one sample from each quadrat. These locations will be precisely replicated each year and a sample of 15 to 20 measurements should be more than adequate to account for random variations. Without permanent quadrats or a large sample size, it is doubtful that this parameter would change rapidly enough to be measured with sufficient precision.
Again, similar measures must be taken on controls. The difference between measures on campsites and controls provides an estimate of the reduction in thickness of organic horizons.
Parsons and MacLeod (1980) suggest categories based on evidence of disturbance of the organic layers. These categories range from "trampling discernible; some needles broken, scattered cones," to "heavily trampled; (litter) clumped and pulverized; cones absent," and finally to "litter, cones and duff completely absent." Kitchell and Connor (1984) use categories based on the proportion of the litter cover that appears to be crushed or broken. They also note the distribution oflitter, whether it is evenly distributed or confined to the edge of the site or protected locations. The highest impact category is assigned to sites in which >60 percent of the litter cover appears crushed or broken and to sites in which >80 percent of the litter occurs around the edge of the site or stable objects.
Impacts to Mineral Soil-In contrast to many of the preceding parameters, most of the methods available for evaluating impacts to mineral soil are time consuming. Consequently, these are seldom estimated except in measurement systems on permanent plots. The most common impacts to assess are soil compaction, water infiltration rates, moisture content, organic matter content, and chemical composition.
Soil compaction has usually been estimated by measuring either bulk density or the resistance of the soil to penetration. Bulk density is the ratio between the dry weight and volume of a soil sample; penetration resistance is a measure of the force required to push a penetrometer a given distance into the soil. Either measure

increases as soil compaction increases. There are a number of alternative methods and tools for each of these measurements (Gifford and others 1977).
Each measure has advantages and disadvantages. Penetration resistance is a simpler measure to take because there is no need to take a soil sample and, if using a pocket penetrometer, the instrument is light. In addition, penetration resistance is a more sensitive measure of impact than bulk density; more subtle increases in compaction can be detected with a penetrometer.
Penetration resistance measures are quite variable in space, and they vary with soil moisture. Therefore, the difference between penetration resistance measures at two points in time may reflect soil moisture rather than a change in level of compaction. This problem can be corrected by taking measures at a standard moisture level, such as field capacity, but this is not practical in most situations; it takes too much time. Another option is to compare the difference between campsite and control at two points in time, assuming that the influence of different moisture levels on campsites and controls would cancel each other out. Unfortunately, it is likely that the magnitude of the effect of moisture levels would differ between campsites and controls.
Another problem with penetration resistance measures is the difficulty of obtaining readings in sandy, rocky, or gravelly soils. Finally, with pocket penetrometers, penetration resistance levels on campsites frequently exceed the maximum resistance that can be measured-4.5 tons/ft2 (kg/cm2 ). Moreover, the instrument is pushed only 0.25 inch (6 mm) into the soil. This may not provide an adequate representation of compaction. For example, it is not uncommon for a highly compacted soil layer to be covered by a centimeter of pulverized soil. The pocket penetrometer would detect no resistance in the upper layer, where most measures are taken. One option here would be to record penetration resistance at various depths in the soil.
Bulk density measures are less variable through space or time; however, they are also difficult to take in rocky or gravelly soil. In such soils, it can be impossible to use a soil corer without distorting the sample; instead, a technique such as the paraffin clod or irregular hole method (Howard and Singer 1981) must be used. These are quite time consuming. Even after using one of these techniques it may be necessary to remove rocks and gravel from the soil samples to obtain a meaningful measure of bulk density. Other researchers have used instruments such as the air permeameter, volumeasure, and gamma ray scattering device (Gifford and others 1977), although these are not practical for use in the backcountry.
As was the case with thickness of organic horizons, there is a gradient of compaction, related to amount of trampling, from the center of the site to its edge. This gradient is superimposed on a pattern of random variation on the site. Therefore, it is important to take an adequate number of samples, to take samples along the entire disturbance gradient, and to make certain that repeat measures reflect a similar distribution of samples.
The requisite number of samples will vary from place to place. It appears that five to 10 samples of bulk density or 10 to 20 measures of penetration resistance are usually
17
needed. It might be useful to separate these samples into core and intermediate locations, as Stohlgren and Parsons (1986) did. They took five to 10 measurements of both bulk density and penetration resistance from core and intermediate parts of the site, as well as from undisturbed controls.
One of the most ecologically significant effects of soil compaction is a reduction in the rate at which water infiltrates soil. As with bulk density, there are standard techniques available to measure infiltration rates. Unfortunately, the most reliable techniques require taking measurements on soils at a standard moisture level, usually field capacity. Otherwise, rates will be strongly influenced by soil moisture levels. This requirement, along with the variability of rates, makes it a time-consuming task to obtain precise and accurate estimates. Sample size and distribution would have to be similar to that just described for bulk density.
Measures of soil moisture, organic matter, and chemistry all require obtaining soil samples that must then be analyzed in a laboratory. Moisture can be determined relatively simply by immediately placing soil samples in airtight containers. Gravimetric moisture is the difference between the weight of the soil sample, before and after being dried, divided by the dry soil weight. Volumetric moisture is the difference in weight divided by the volume of the soil sample. The other methods are more complicated and require more specialized equipment. Again, sample size and distribution should be similar to that suggested for bulk density.
Al though these measures of mineral soil characteristics provide relatively accurate estimates of current levels of impact, a prohibitively large number of time-consuming samples must be obtained to identify anything more than the most sizable changes over time. Further work on the development of efficient techniques for monitoring changes in mineral soil impacts would be worthwhile.
At Grand Canyon, soil compaction is being estimated in the following categories: "minimal evidence of surface disturbance"; "much of surface compacted or loosened, but not cementlike"; or "most of surface cementlike in appearance" (Cole 1985). Sites at Canyonlands (Kitchell and Connor 1984) are evaluated in terms of the proportion of the site-from 0 to >60 percent of the site-that has either compacted fine soils or loosened coarse soils. These evaluations are useful in distinguishing between highly compacted and relatively undisturbed sites. The gross categories are not likely to be sensitive enough to detect subtle changes, however. It is also not clear how consistent evaluators can be in categorizing campsites.
Erosion-Only a few systems have attempted to assess erosion in a systematic manner. It is not even clear how common or severe a problem erosion is, since most campsites are located on flat ground. It is particularly difficult to arrive at a quantitative assessment of erosion. Legg and Schneider (1977) used depth to the A2 horizon as a measure of erosion on campsites. They measured depth to this distinctive layer at four points, in each of six quadrats with an Oakfield soil tube. Bratton and others (1978) measured the area on the site with evident erosion. Few other studies have attempted to do more than state

whether or not erosion is evident on the site. This is a parameter that might be assessed with the use of photopoints.
Offsite Impacts-It is also possible to assess the severity of certain impacts that occur off the main part of the campsite. The most common of these are access trails and the impacts associated with firewood collection, confinement of packstock, and the loading and unloading of boats.
Access trails (often called social trails) connect the campsite to the main trail, water sources, and other campsites and attractions. The usual procedure for access trails has been to count them and note whether or not they are well developed and/or eroded. In most cases this information is the basis for categorizing sites. Categories in the Parsons and MacLeod system (1980), for example, range from none, to two trails discernible, to more than two well-developed trails. Problems result when trails are only discernible at certain times of the year and when definitions of the difference between a discernible and a well-developed trail are inconsistent.
Bratton and others (1978) estimated the area disturbed by firewood collection by recording the maximum distance disturbed by firewood collection from the center of the site along at least two axes and then multiplying these measures. They also quantified the reduction in woody fuels, using standard woody fuel inventory techniques on firewood collection areas and undisturbed controls (Bratton and others 1982). While providing information on what impacts have occurred and how large an area is affected, these techniques are not sufficiently precise to identify subtle trends.
Shorelines oflakes and streams are disturbed where visitors travel by boat. Disturbance occurs when boats are loaded and unloaded, as well as during recreational activities along the shore. Marion (1984) has recorded the length of shoreline that has been disturbed at campsites in the Boundary Waters Canoe Area Wilderness. Where the extent of disturbance can be consistantly defined (for example, where vegetation is dense and fragile), this length can simply be recorded to the closest foot, meter, or other unit oflength. Where it is more difficult to define the extent of disturbance, categories are more appropriate. Marion's categories ranged from <15 feet of disturbance to >25 feet of disturbance.
Areas disturbed by confined packstock have been included in estimates of the total area of disturbance around campsites and in counts of tree damage in the Bob Marshall Wilderness (Cole 1983b). Schreiner and Moorhead (1979) specifically counted the number of "horse trample areas within 100 feet" of the campsite. The value of and problems with these techniques have already been discussed in the sections on campsite area and damage to overstory trees.
Summary Ratings-Summary ratings and condition class :ratings provide a means of summarizing all of these impact parameters in a single rating. They can be constructed, as Frissell (1978) did, by noting the presence or absence of certain conditions. For example, if vegetation is lost on some of the site, but not most of the site, the site
18
is given a rating of 2. If tree roots are exposed, but trees are not dead or reduced in vigor, the site is given a rating of 4. This is an appropriate procedure and, ifthe most important impact parameters are included, will provide an accurate and precise summary rating of impact levels. Review the discussion of Frissell's condition class in step 1 for problems with the technique and recommendations for how these problems can be alleviated. A condition class summary rating could be assessed, in addition to estimates or measurements of individual parameters, as an indicator of overall condition.
The summary ratings calculated by summing ordinal ratings, with or without determining a mean (Cole 1983a, 1984, 1985; Kitchell and Connor 1984; Marion 1984; Parsons and MacLeod 1980), use mathematically improper procedures. Categorical ratings cannot be combined into a readily interpretable single summary rating (Schuster and Zuuring 1986). Although conclusions about the relative impact level of sites with widely divergent ratings are probably valid, conclusions about sites with ratings close to each other are suspect. Perhaps the practice of grouping these ratings into four or five categories overcomes this problem. Because these systems have not been adequately tested, however, we do not know.
Instead of calculating a mean from categorical ratings, classes of sites could be defined in terms of the presence or absence of certain conditions. For example, a class 5 site could be any site that received a rating of 5 for more than two parameters. A class 1 site could be one that was rated 1 on at least six parameters, regardless of what the other ratings were. Or a class 1 site could be one that received no ratings higher than 2. Obviously there are countless ways to define overall ratings. Refer to the section on calibration in step 3 for description of techniques that will facilitate definitions that provide an adequate differentiation of site variability.
Research Needs Evaluation procedures are clearly deficient in several
respects and could be improved by further research. More work is needed to increase precision of measurement, particularly for the rapid estimation procedures. We must learn to report results in units that reflect the precision of the techniques used. Reporting the area of a campsite to the closest square meter, when it can only be reliably reported to the closest 10 m2 , is inappropriate and misleading. Thus more work must be done on establishing precision levels (see step 3).
Of the types of impact that have been assessed, techniques for measuring impact to the mineral soil are the least sensitive, most time consuming, and most difficult to interpret. Further development of these techniques, with suggestions particularly for rapid estimation techniques, would be useful.
Finally, more work is needed to develop appropriate summary impact ratings that provide a meaningful index of how much impact has occurred. Several options have been suggested, but with further thought better techniques might emerge. In addition, all of these alternatives need to be evaluated.

Sources of Information Bratton, Susan P.; Stromberg, Linda L.; Harmon, Mark E.
1982. Firewood-gathering impacts in backcountry campsites in Great Smoky Mountains National Park. Environmental Management. 6: 63-71. (Describes techniques that can be used to evaluate and monitor woody fuels and firewood-gathering impacts.)
Carothers, Steven W.; Johnson, Robert A.; Dolan, Robert. 1984. Recreational impacts on Colorado River beaches in Glen Canyon, Arizona. Environmental Management. 8: 353-358. (Describes techniques for quantifying sand discoloration by charcoal and ash and trash accumulation.)
Chambers, Jeanne C.; Brown, Ray W. 1983. Methods for vegetation sampling and analysis on revegetateg mined lands. Gen. Tech. Rep. INT-15L0gden, UT: U.S. Department of Agriculture, Forest Service, Intermountain Forest and Range Experiment Station. 57 p. (Provides a good discussion of vegetation sampling techniques, including the calculation of indexes related to change in vegetation composition.)
Cole, David N. 1982. Wilderness campsite impacts: effect of amount of use. Res. Pap. INT-284. Ogden, UT: U.S. Department of Agriculture, Forest Service, Intermountain Forest and Range Experiment Station. 34 p. (Describes a variety of impact parameters that are measured on permanent plots established on forested campsites.)
Cole, David N. 1983. Monitoring the condition of wilderness campsites. Res. Pap. INT-302. Ogden, UT: U.S. Department of Agriculture, Forest Service, Intermountain Forest and Range Experiment Station. 10 p. (Describes some techniques for rapidly estimating impact parameters.)
Cole, David N. 1984. An inventory of campsites in the Flathead National Forest portion of the Bob Marshall Wilderness. Unpublished report on file at: U.S. Department of Agriculture, Forest Service, Intermountain Research Station, Forestry Sciences Laboratory, Missoula, MT. 19 p. (Describes a monitoring system, based on rapid estimates, that was used in the Bob Marshall Wilderness. Includes form, instructions, results of the inventory, and suggestions for further work.)
Cole, David N. 1985. Ecological impacts on backcountry campsites in Grand Canyon National Park. Unpublished report on file at: U.S. Department of the Interior, National Park Service, Western Regional Office, San Francisco, CA. 96 p. (Describes a variety of impact parameters that are measured on permanent plots established on desert campsites.)
Gifford, Gerald F.; Faust, Robert H.; Coltharp, George B. 1977. Measuring soil compaction on rangeland. Journal of Range Management. 30: 457-460. (Describes and evaluates several methods of measuring soil compaction.)
Howard, Richard F.; Singer, Michael J. 1981. Measuring forest soil bulk density using irregular hole, paraffin clod, and air permeability. Forest Science. 27: 316-322. (Describes and evaluates some methods of measuring bulk density.)
19
Kitchell, Katherine P.; Connor, Jeff. 1984. Canyonlands and Arches National Parks and Natural Bridges National Monument draft recreational impact assessment and monitoring program. Unpublished paper on file at: U.S. Department of the Interior, National Park Service, Moab, UT. 80 p. (Describes rapid estimate monitoring systems for river, four-wheel-drive, and backpack campsites.)
LaPage, Wilbur F. 1967. Some observations on campground trampling and ground cover response. Res. Pap. NE-68. Upper Darby, PA: U.S. Department of Agriculture, Forest Service, Northeastern Forest Experiment Station. 11 p. (Describes a technique for monitoring changes in ground cover vegetation, using permanent quadrats.)
Magill, Arthur W. 1970. Five California campgrounds ... conditions improve after 5 years' recreational use. Res. Pap. PSW-62. Berkeley, CA: U.S. Department of Agriculture, Forest Service, Pacific Southwest Forest and Range Experiment Station. 18 p. (Describes some techniques for measuring change in a number of impact parameters on permanent plots.)
Marion, Jeffrey Lawrence. 1984. Ecological changes resulting from recreational use: a study ofbackcountry campsites in the Boundary Waters Canoe Area Wilderness, Minnesota. St. Paul, MN: University of Minnesota. 279 p. Dissertation. (Describes a variety of impact parameters that are carefully measured, but not on permanent plots.)
Merriam, L. C., Jr.; Smith, C. K.; Miller, D. E.; [and others]. 1973. Newly developed campsites in the Boundary Waters Canoe Area: a study of 5 years' use. Stn. Bull. 511, For. Ser. 14. St. Paul, MN: University of Minnesota, Agricultural Experiment Station. 27 p. (Describes techniques for measuring change, most notably using mapping techniques.)
Mueller-Dombois, Dieter; Ellenberg, Heinz. 1974. Aims and methods of vegetation ecology. New York: John Wiley. 547 p. (A thorough treatment of measuring vegetational parameters.)
Parsons, David J.; MacLeod, Susan A. 1980. Measuring impacts of wilderness use. Parks. 5(3): 8-12. (Describes categories used to rapidly estimate a number of impact parameters.)
Parsons, David J~; Stohlgren, Thomas J. 1987. Impacts of visitor use on backcountry campsites in Sequoia and Kings Canyon National Parks, California. Tech. Rep. No. 25. Davis, CA: U.S. Department of the Interior, Cooperative National Park Resources Studies Unit, University of California, Institute of Ecology. 79 p. (Describes and evaluates the monitoring· system at Sequoia and Kings Canyon National Parks.)
Settergren, C. D.; Cole, D. M. 1970. Recreation effects on soil and vegetation in the Missouri Ozarks. Journal of Forestry. 68: 231-233. (Describes a number of techniques for measuring soil impacts that might be used in a monitoring system.)
Stohlgren, Thomas J.; Parsons, David J. 1986. Vegetation and soil recovery in wilderness campsites closed to visitor use. Environmental Management. 10: 375-380. (Describes a variety of impact parameters that are measured on permanent plots.)

Vimmerstedt, John P.; Scoles, Frederick G.; Brown, James H.; Schmittgen, Mark C. 1982. Effects of use pattern, cover, soil drainage class, and overwinter changes on rain infiltration on campsites. Journal of Environmental Quality. 11: 25-28. (Describes techniques for measuring soil impacts, some of which might be appropriate to backcountry monitoring.)
STEP 3. TESTING OF MONITORING TECHNIQUES
At this stage, impact parameters and procedures for evaluating these parameters have been developed. Although it is tempting at this point to rush off into a season of monitoring, it is more efficient to invest some time and energy in testing procedures. This will expose pro):>lems that are likely to arise before they jeopardize consistent and accurate results. It will also identify subtle modifications that will improve the system. Three different types of testing can be appropriate here. With the exception of those systems based entirely on photographs, all systems will profit from refinement of field techniques and from estimation of measurement error. If using a system with categorical ratings, it is also important to calibrate the system (see below for definition of calibration).
Refinement of Techniques This step is difficult to describe because it can be dealt
with in so many different ways. Basically, it involves trying out proposed techniques on a few sites to see how well they work and then coming up with ways to deal with any problems that do arise. A variety of sites differing in environmental conditions and levels of impact should be examined by different people. One common product of this process is a set of quantitative definitions for conditions to be jµdged in the field. For example, when measuring distance from the center of the plot to the first significant amount of vegetation, it is necessary to define what a "significant amount of vegetation" is. Other definitions might include what is or is not a tree mutilation or when a mutilation becomes "highly obtrusive." These definitions should be developed during the refinement stage. After trying them, some procedures may be determined to be too time consuming or not sufficiently useful or precise. They can be dropped or alternative procedures can be developed. As many of these decisions as possible should be made before sending out the field crews.
The end product of this step should be careful descriptions of all techniques to be used when evaluating each impact parameter, as well as precise definitions of any terms that might be ambiguous. All of the decisions regarding techniques and definitions need to be carefully documented (see step 4).
Calibration Procedures Many monitoring systems utilize categorical ratings for
each impact parameter. These can be quantitatively defined classes, such as for campsite area: 1 = <500 ft2
(<46 m 2); 2 = 500-1,000 ft2 (47-186 m2); and 3 = >1,000 ft2
(>186 m2). They can also be nonquantitative. For ex-
20
ample, development classes could be: 1 = no development; 2 = a simple rock firering; and 3 = more than one firering or other developments.
To be most efficient at differentiating between sites on the basis of amount of impact, approximately equal percentages of sites should fall into each category. Marion (1986) describes a method for calibrating categories that are quantitatively defined. First, inventory a sample of sites (perhaps 50) that represent the full range of use-, environmental-, and impact-related conditions present in the area for which the system is being designed. This can also aid in the refinement of techniques (as described above).
Second, display these results as a cumulative frequency distribution and then divide this distribution into classes with an equal number of sites. For example, if three categories were to be defined and 33 percent of the campsites were <600 ft2 in area, the first category should be 0-600 ft2 •
The upper bound of the second category would be the area of the site at the 67th percentile. Although these are the most equitable boundaries, it is worth rounding categories so that they are easier to remember and work with. For example, if the area of the campsite at the 67th percentile was 1,061 ft2 , it would be a good idea to set the boundaries at either 1,000 or 1,100 ft2.
If categories are not quantitatively defined, calibration is more difficult and, in some situations, may not be possible. If the majority of sites have no development, for example, there is no way to have an equal distribution among categories for the development parameter. With such parameters, try several different sets of categories and select the set that provides the most equitable distribution of sites among categories.
Estimation of Measurement Error Error is inherent to all measurement systems. For
monitoring purposes, we need to be able to distinguish, when comparing measures of the same campsite at two different times, between two different measures of the same condition (measures that differ due to the biases and interpretations of two different evaluators) and a real change in conditions. To do this we need to (1) develop techniques with as little inherent measurement error as possible, (2) do everything possible-through training and documentation-to minimize measurement error, and (3) determine the magnitude of measurement error. While we have made considerable progress on the first two needs, estimates of the measurement error inherent to any monitoring system have never been provided. This may be the most critical missing link in our ability to accurately monitor changes in campsite condition. At this stage, we have little ability to evaluate the probability that an observed change is either a real change or simply a result of measurement error.
The details of how to evaluate measurement error have yet to be developed. In a report prepared in conjunction with this project, Steele (1987) suggests some methods for evaluating and displaying measurement error. Because monitoring data consists of only one observation per time period, there is no opportunity to evaluate, statistically, variation and error for actual monitoring data. Therefore,

it will be necessary to conduct separate studies designed specifically to estimate error. If a number of different people independently evaluate conditions on the same site, these evaluations can be statistically manipulated to estimate the error associated with different parameters. The appropriate number of different people and different number of sites has not been determined. At a minimum, there should probably be five to 10 people evaluating 10 to 20 representative campsites.
In order to decide on appropriate statistical techniques, the distribution of each variable must be determined. Many tests are only appropriate if the distribution of a variable either approximates a normal distribution or can be transformed so that it approximates a normal distribution. Many of the count and class variables clearly are not normally distributed. Some may follow a Poisson di'stribution; for others it is not clear exactly what statistical tests to apply.
For those variables that are normally distributed, the relative sensitivity of different parameters can be evaluated by examining their coefficient of variation (the ratio of the sample standard deviation to the sample mean, expressed as a percentage). A large coefficient indicates that the variability of independent estimates is high, the sensitivity of the variable is low, and measurement error is high. For variables with a large coefficient of variation, the difference between two observations must be relatively large before it is safe to conclude that a real change has occurred. For such variables, significant deterioration is likely to occur before one can be confident that a real change has occurred.
Quantitative estimates of measurement error for specific parameters can be approached in several ways. One option is to determine the minimum change that, if observed, will permit one to conclude, confidently, that a change has actually occurred. This requires the specification of a confidence level, the risk one is willing to assume of stating that a change has occurred when it has not. By setting this level (type I error), minimum change can be determined through use of the two-sample t statistic (Steele 1987).
It is also worth evaluating the likelihood of not detecting a change that has actually occurred. This risk is called type II error. Power curves can be constructed (Steele 1987) that permit type II error to be determined for any combination of confidence level (type I error) and magnitude of real change. For example, given that a real change of 10 percent actually occurs, and one is willing to accept a 1-in-10 chance of incorrectly concluding that a change has occurred when it has not, the likelihood of correctly detecting that 10 percent change is the power ([1 - type II error] * 100 percent), as read from power curves.
The utility of the coefficient of variation, the two-sample t statistic, and power curves can be illustrated with examples from a small sample of campsites taken near Missoula, MT. Five separate sites were independently evaluated by nine graduate students from a University of Montana recreation management class. The parameters used were generally those of Cole's rapid estimation procedure used in the Bob Marshall (see appendix H); a few additional parameters were also added. Values may be somewhat unrepresentative because the observers
21
received less training than normal, not all variables met the assumptions of a normal distribution, and the number of sites examined was probably insufficient. Nevertheless, these examples illustrate some of the ways in which measurement error could be examined; they also suggest which variables are most sensitive and the magnitude of measurement problems.
Coefficients of variation (table 2) indicate that all of the rating variables, except for trash, are more sensitive than those that require a numerical estimate. Two of the three least sensitive variables were ones not used in the Bob Marshall-the trash rating used at Canyonlands (Kitchell and Connor 1984; appendix I) and the measure of bare mineral soil area used at the Delaware Water Gap (appendix J). Impact index proved to be quite sensitive; the standard deviation was typically only 7 percent of the mean index. It should be possible to confidently conclude, then, even for relatively small increases in this index, that an increase represents a true increase-rather than simply random variation between observers. In contrast, observed increases in the number of trees with exposed roots and the area of bare mineral soil must be large before it is possible to conclude, with much confidence, that the increase is a true increase.
A better idea of how large changes must be before one can conclude, with confidence, that a change has occurred can be derived from table 3. This table shows the minimum magnitude of change that can be detected, given type I error rates of 0.05 and 0.25; these correspond to 1-in-20 and 1-in-4 chances of incorrectly stating that a change has occurred when there has been no change. Expressing this "minimum detectable change" as a percentage of mean observations (the values in parentheses in table 3) provides another measure of relative sensitivity; the order of parameters in table 3 is roughly comparable to that in table 2. A value of 50 percent suggests that a future observation must be at least 50 percent
Table 2-Coefficient of variation for monitoring parameters, using data collected on five sites by nine recreation management graduate students
Coefficient of variation Parameter Median Range
Camp area (rating) 0 0 - 21 Vegetation loss (rating) 0 0 - 36 Root exposure (rating) 0 0 - 55 Impact index 7 4 - 8 Development (rating) 12 0 - 20 Barren area (rating) 12 0 - 41
Tree damage (rating) 19 0 - 21 Mineral soil increase (rating) 20 12 - 38 Cleanliness (rating) 22 0 - 36 Social trails (rating) 27 0 - 38 Camp area (ft2 ) 31 26 - 34 Social trails (number) 31 16 - 47 Fire scars (number) 31 0 - 110 Barren area (ft2 ) 31 27 - 106 Tree damage (number) 37 24 - 62 Trash (rating) 38 19 - 42 Root exposure (number) 44 24 - 163 Bare mineral soil area (ft2) 53 31 - 102

Table 3-The minimum amount of change that, if observed, can confidently be considered a "real" change, based on data collected on five sites by nine recreation management graduate students
Parameter
Camp area (rating) Impact index Development (rating) Root exposure (rating) Vegetation loss (rating) Tree damage (rating) Barren area (rating) Cleanliness (rating) Social trails (rating) Mineral soil increase (rating) Social trails (number) Camp area (ft2) Fire scars (number) Root exposure (number) Trash (rating) Barren area (ft2)
Tree damage (number) Bare mineral soil area (ft2)
Minimum change1
0.052 0.252
0.3 3.3 0.5 0.5 0.7 0.9 0.9 0.8 1.2 0.1 3.5
1,556 1.6
4 1.8
520 12
295
(13) (15) (21) (23) (26) (34) (36) (44) (47) (52) (72) (72) (78) (79) (80) (87) (92)
(104)
0.1 (4) 1.3 (6) 0.2 (8) 0.2 (9) 0.3 (11) 0.4 (15) 0.4 (16) 0.3 (17) 0.5 . (19) 0.4 (20) 1.4 (29)
628 (29) 0.6 (30)
2 (30) 0.7 (31) 210 (35)
5 (38) 119 (42)
1Minimum change is the minimum difference between observations, taken at two different times, that would allow the null hypothesis, of no difference, to be rejected. The two-sample tstatistic, with a pooled estimate of the standard deviation and 40 degrees of freedom, was used. Values in parentheses express this minimum change as a percentage of mean values and provide a measure of sensitivity.
Z'fype I error rates of 0.05 and 0.25 are reported, providing confidence levels of 95 percent and 75 percent, respectively.
Table 4-The likelihood of correctly detecting a real change of an increase in rating of 1 for the rating parameters, based on data collected on five sites by nine recreation management graduate students
Parameter
Camp area Development Root exposure Vegetation loss Cleanliness Tree damage Barren area Mineral soil increase Social trails Traf:h
Chance of detectlon1
0.052 0.252
100 90 90 75 65 60 55 50 40 20
100 100 100 95 90 85 85 80 75 60
1Chance of detection is 1 minus the type II error rate, expressed as a percentage, as derived from power curves in which both type I error rate and a given magnitude of change are set. For example, a 90 percent chance implies (given that a shift in rating of one has actually occurred) that there is a 90 percent chance of correctly rejecting the null hypothesis, that no change has occurred.
Z'fype I error rates of 0.05 and 0.25 are reported, providing confidence levels of 95 percent and 75 percent, respectively. Using tree damage as an example, if you are willing to accept a one-in-four chance of saying there has been a change when none has occurred (type I error of 0.25), you have a greater than four-in-five chance of correctly identifying a shift of one; if you are only willing to accept a 1-in-20 chance of saying that there has been a change when none has occurred, the odds of correctly identifying a shift of one drop to a greater than 6-in-10 chance.
22
larger than the estimate of current condition before it is safe to conclude that a change has occurred. Again it is clear that all of the parameter ratings, except for trash, are quite precise. If an increase in rating of 1 is observed, there is very little chance of concluding incorrectly that an increase has occurred when it has not. Only for social trails and mineral soil increase is there a 1-in-20 chance of making this mistake. Impact index is also relatively precise; it is highly unlikely that an observed change of more than two or three units (on the scale of9 to 27) does not reflect a real change. In contrast, one out of every four times that a change in bare mineral soil area as large as 119 ft2 (11 m2) is reported, there is likely to have been no real increase.
The minimum detectable change in vegetation cover (for a type I error of 0.05) was 25 percent on campsites and 17 percent on controls. The corresponding minimum changes in mineral soil were 26 percent and 5 percent on campsites and controls. This suggests that the 25 percent cover classes used in the Bob Marshall (appendix H) are about right, although it might be desirable to divide the 76-100 percent class into 76-95 percent and 96-100 percent classes to accommodate the greater sensitivity of mineral soil estimates on controls.
Although knowledge about the minimum detectable change is critical, it is also enlightening to examine the likelihood of not detecting a real change in conditions. Tables 4 and 5 show the likelihood of correctly identifying a real increase in rating of 1 (for the rating parameters) and a real 25 percent increase in deterioration (for the other parameters), respectively. A rating shift of 1 should usually be detected without having to accept too much risk of making a type I error. In contrast, for none of the parameters that require a count or estimate is there more than a 50 percent chance of detecting a 25 percent increase in deterioration, even accepting a 1-in-4 risk of saying there has been a change when none has occurred.
In conclusion, we have only begun to investigate the difficult and complex issue of measurement error. The results reported here should be treated as merely
Table 5-The likelihood of correctly detecting a real 25 percent increase in deterioration, based on data collected on five sites by nine recreation management graduate students
Parameter
Impact index Camp area (ft2 )
Tree damage (number) Fire scars (number) Barren area (ft2) Social trails (number) Root exposure (number) Bare mineral soil area (ft2
)
Chance of detection1
0.052 0.252
85 20 20 20 15 15 15 15
100 50 50 50 45 45 45 45
1Chance of detection is 1 minus the type II error rate, expressed as a percentage, as derived from power curves in which both type I error rate and a given magnitude of change are set.
Z'fype I error rates of 0.05 and 0.25 are reported, providing confidence levels of 95 percent and 75 percent, respectively.

suggestive of the precision levels of the various estimation techniques used. They demonstrate that most of the interval scale measures are highly imprecise; they are much less sensitive than they appear. For a variable such as camp area (which is typical of these parameters), area must virtually double before it is safe to conclude that a real change has occurred. Consequently, there is a high probability of either stating a change has occurred when it has not or failing to detect even sizable changes. Ratings, while they provide less information, are less misleading. When a shift in rating occurs, it is likely to be detected; conversely, when a shift in rating is observed, it is likely to reflect a real change. Finally, the impact index (used to summarize overall impact) appears to also be sensitive and relatively precise. One can be quite confident of detecting changes as small as 10 to 15 percent and confident that changes of 10 to 15 percent reflect actual changes.
Research Needs
More research is needed on measurement error. More studies with larger sample sizes need to be conducted following the-format of the study reported here. From these it should be possible to determine appropriate sample sizes for such studies, as well as the approximate distributions for different parameters. For those parameters with distributions that are not normally distributed, particularly class variables, it will be necessary to find tests comparable to those available for parameters that are normally distributed.
Once appropriate distributions are determined, it should be possible to more accurately determine the magnitude of measurement error for different parameters. Through research it should be possible to identify those parameters that are most sensitive. It might also be possible to suggest ways to increase the sensitivity of parameters with large errors. Ultimately, managers of individual areas will have to utilize baseline studies and statistical procedures to determine appropriate error terms for the procedures they adopt. These errors can be used to decide how large a change must be before it will be considered a real change.
Sources of Information
Marion, Jeffrey L. 1986. Campsite assessment systems: application, evaluation, and development. In: Popadic, Joseph S.; [and others], eds. Proceedings, 1984 river recreation symposium; 1984 October 31-November 3; Baton Rouge, LA. Baton Rouge, LA: Louisiana State University, School of Landscape Architecture: 561-573. (Describes a procedure for calibrating categorical impact rating systems.)
Steele, Brian. 1987. Statistical procedures for the analysis of a campsite monitoring program. Unpublished report on file at: Systems for Environmental Management, Missoula, MT. 56 p. (Suggests statistical procedures for evaluating measurement error. Provides examples from a sample of five campsites that were evaluated independently by nine people.)
23
STEP 4. DOCUMENTATION AND TRAINING
Although it is possible at this stage to p1unge into the inventory and monitoring fieldwork, it is important to invest time in training and documentation of methods. If this is not done, consistency and precision will be low; this will reduce the value of the data collected.
The purpose of this step is to minimize the errors associated with different people taking measurements and making judgments. Two sources of error are common to these techniques. The first results from problems of definition. For example, when measuring campsite area or counting tree damage, estimates will be highly divergent if evaluators have very different opinions about how to define the campsite boundary or what constitutes a "damaged tree." Problems of definition can be just as serious when using precise measurements in permanent plots as they are when making rapid estimates. Precise definitions must be worked out in the field, documented in some manner, and then communicated to evaluators through training. Separate evaluators should be periodically brought together to be recalibrated-to make certain that definitions and judgments remain consistent.
The second source of error is in measurement technique. This error is likely to be more substantial when using rapid estimation techniques. In measuring campsite area, for example, it is difficult to measure the area of an irregular figure. If one evaluator estimates area on the basis of radial measures of the distance between center point and boundary, while another pieces together the areas of several simple geometric figures, results are likely to be very different. Even when counting damaged trees, estimates will vary depending on whether or not only onsite trees are counted. Measurement/estimation techniques need to be agreed on and used in a consistent manner. The magnitude of the measurement error will vary with the measurement technique used. This provides another reason for using consistent techniques.
Documentation
Once precise evaluation procedures and definitions have been established, the consistency of their application must be maintained. This can be particularly difficult when field crews and even supervisors change from year to year. An important tool for dealing with the problem of turnover is the preparation of an impact monitoring system manual that documents techniques and definitions. This tool will also increase year-to-year consistency in places that do not experience turnover. Without such a manual it is doubtful that anyone monitoring sites, say, 20 years from now, will be able to use the data being collected today.
Several types of information should be included in such a manual. Much of the manual will consist of step-by-step descriptions of how each impact parameter should be evaluated. These should be described in as much detail as possible, in simple language. If measurement instruments are needed, these should be listed, described, and perhaps even photographed. The more detail, the better.

. ' ~
Definitions of ambiguous terms, such as what constitutes a "damaged" tree or "highly obtrusive" damage, are a critical part of the manual. Definitions should be quantitative where possible. Particularly where quantification is not possible, photographs of the conditions being described will contribute to consistent judgments in the field. For example, photographs of a variety of trees with "highly obtrusive" damage, damage that is not "highly obtrusive," and no damage at all would help greatly where these terms must be used. Other examples might include the difference between "some" and "much" litter, or the difference between a "discernible" and a "well-worn" access or social trail.
Often it is important to document things that will or will not be i;ncluded in an estimate. In some places, measures of "barren area" have been confined to the devegetated area around the central core of the site; in other places, several devegetated areas on the site have been measured and summed. When counting access trails for campsites located at a lake, for example, decisions must be made about whether or not to count a fisherman's trail around the lake that happens to run through the site. Logically such trails might be excluded if they would have been there regardless of the campsite's existence. It is always helpful to explain the rationale behind such decisions.
Helpful "pointers" and "rules of thumb" are also useful. Examples include how to decide whether or not a site should be considered a campsite and how to "split up" an area of intermingled sites into separate sites for inventory purposes. Shortcuts and recommendations for how to speed up estimates are also useful.
The manual should be updated when new suggestions and improvements are developed. Field workers should carefully document situations that are not clearly addressed in the manual and suggest means of dealing with these new situations .. These can then be discussed with a supervisor who can evaluate the situation and suggest changes, as well as the need for revision of the manual. Keeping a copy of the manual on a word processor should make the process of manual revision simpler.
Whenever changes in procedure or definition are made, it is important to evaluate how such changes will affect comparability with data already collected. If comparability will be lost, a decision on whether or not to make a change must be dependent on a weighing of the advantages of the improved method and the disadvantages of lost information. While one should not be afraid to lose the information contained in previous measurements, this loss should not be accepted unless improvements are substantial. If comparability is lost, this should be stated in the manual, along with any suggestions for how previous measurements might be interpreted in relation to new methods.
Training There are many useful ways to conduct training, but
several guidelines can be suggested. Evaluators can study the documentation manual independently, but they should be trained as a group. Definitions and procedures should be discussed and demonstrated in the field. Examples of
24
the various situations that require different judgments should be viewed and discussed as a group. Then evaluators should each work independently on a series of sites. Results should be compared and discussed. This process must be repeated until an acceptable level of consistency is reached. If one or several evaluators consistently overestimate or underestimate a parameter, they should be instructed to compensate their judgments in such a way that they are calibrated with the group as a whole. Repetition must continue until this compensation leads to consistent results-within an acceptable measurement error.
Periodic reevaluation of the consistency of judgments throughout the field season will also increase precision. If evaluators can be reconvened for a few hours every month or so, internal consistency can be examined and any problems or suggestions for improvement can be discussed.
Where possible, the same supervisors should do the training each year. Where this is not possible, the new supervisor should be trained, in detail, by the previous one. This is critical if consistent calibration of field workers from year to year is to be maintained. The manual will help in this regard, as would the sharing of training responsibilities-so it is less likely that all supervisors will leave in any one year.
STEP 5. FIELD DATA COLLECTION PROCEDURES
To increase efficiency in the field and accuracy in the reporting of data, it is important to develop efficient data collection procedures.
Data Forms Carefully constructed data forms can make data collec
tion much simpler. Spaces for recording information should be arranged in the order in which data will be collected. Otherwise evaluators may have to flip back and forth between pages. Sometimes it is helpful to have one page on which data is recorded and a separate page with details on methods, judgments that must be made, and category descriptions. Forms and shorthand codes should always be standardized so that problems in interpreting data are minimized. If precipitation occurs frequently during the data collection season, it may be necessary to print forms on waterproof paper and use pens that can write on wet paper.
The Code-A-Site system (Hendee and others 1976) used edge-punched cards in the field. This permitted the use of needle-sorting methods for sorting and retrieving data; computers were not needed. Needle-sorting proved to be cumbersome and the raw data, once retrieved, often had to be tabulated and summarized manually. Recent increases in the accessibility of electronic data processing capabilities have rendered this approach virtually obsolete.
The process of taking data off a form and entering it into a computer is time consuming and subject to error. Problems resulting from this translation can be reduced by using standard precoded forms with data recorded spatially on the form in such a way that they correspond to the

columns and data fields established in computer files. It is important, however, for the form to be easily interpretable in the field. If actions taken to reduce errors in data entry result in more errors in data collection, nothing is gained. Where possible, data manipulation and transformation prior to data entry should be avoided. Most of this manipulation can be accomplished through computer programming.
Electronic Field Data Recorders Recent technology makes it feasible to carry program
mable, battery-operated, hand-held microcomputers into the field. Data can be entered directly, eliminating the need for forms entirely. Prompts, such as "how many damaged trees are there?" and "are any of them higply obtrusive?" can be programmed into these devices. Illogical answers can be flagged as probable errors. Although these devices possess data processing capabilities, their primary function is field data entry and temporary storage. After leaving the field, collected data are downloaded into nonportable computers.
Currently (1988), such devices cost between $500 and $1,000. Depending on one's budget and the number of workers -that need one, this cost may or may not be prohibitive. Cost is likely to decline some in the future. Important criteria for a system include durability, weight and compactness, battery life between charges, screen size and legibility, data storage capacity, and the type of operating system. This latter criterion is important because certain operating systems provide greater flexibility in interfacing with nonportable computers and are more user friendly.
Research Needs Further work in the development of portable data re
corders and software to facilitate data collection would be worthwhile.
Sources of Information Krumpe, Edwin E. [Personal communication.] Department
ofWildland Recreation Management, University of Idaho, Moscow ID. (Has developed a portable data recorder for field collection of monitoring data.)
Sydoriak, Charisse A. [In press]. Yosemite's wilderness trail and campsite impacts monitoring system. Paper presented at the National Park Service Science Conference; 1986 July 13-18; Fort Collins, CO. (Mentions the portable data recorders used in the field in Yosemite. More information is available in appendix Kor by directly contacting the Resources Management Division at Yosemite National Park.)
25
STEP 6. DATA ANALYSIS AND DISPLAY
Once monitoring data has been collected, it must be analyzed and displayed. The detail and sophistication used at this step can be highly variable. Data forms can be examined in a cursory manner; they can be needlesorted (if Code-A-Site forms are used); or data can be entered into a computer. In most cases data should be summarized in statistics, graphs, and maps. Although the level of analysis is likely to vary with management objectives and analytical capabilities, both current campsite conditions and trends in condition should be examined. Some suggested analysis procedures, organized under these two headings, follow. Any of these analyses that appear unnecessary can simply be ignored. A discussion of the use of computers and software to facilitate analysis is included in a concluding section.
Analysis of the Current Situation A variety of analyses can be conducted to evaluate the
current condition of campsites. Several of the more important types are as follows:
1. It is useful to be able to retrieve data for any individual site of interest, or for all sites in a destination area or management area. For example, table 6 lists the size of all campsites on Minisink Island on the Delaware River. The ability to retrieve data for individual sites easily facilitates planning for management of both individual sites and larger areas, such as Minisink Island. Where there are a large number of sites, however, analysis at this level of detail is cumbersome.
2. A simple type of analysis, at a more general level, is to calculate summary descriptive statistics for all campsites in the entire wilderness, in individual management units, or in destination areas within the wilderness.
Table 6-Camp area (m 2) for each of the 10 campsites on Minisink Island at Delaware Water Gap National Recreation Area
Campsite number Campsite location Camp area
m2
20 Minisink 79 23 Minisink 84 24 Minisink 221 26 Minisink 18 28 Minisink 507 29 Minisink 241 30 Minisink 72 31 Minisink 392 32 Minisink 72 33 Minisink 108

·.·,."
Separate summary statistics can be calculated for each individual impact parameter and a summary rating, if one was used. An example would be the median and range for the number of damaged trees on campsites in the entire area or around a certain lake of concern. Medians are often more appropriate measures of central tendency than means because they are not skewed by extreme values.
Summary statistics can be used to assess impact levels, both in the entire area and in portions of the area. As an example, refer to some output from data collected on campsites in the Delaware Water Gap National Recreation Area. Summary statistics for two river segments are compared in table 7. Both an idea of impact levels and differences in impact between segments are revealed. The only pronounced difference between segments is that campsites along the stretch from Bushkill to Smithfield tend to be larger. Campsites on this segment have lost more vegetation, but the extent of shoreline damage is less.
The number of campsites in the wilderness provides an important indication of impact. The number and percentage of all sites for each management area or destination area can be displayed. See, for example, table 8. The river segment with the most campsites is Bushkill to Smithfield. Illegal sites, however, are much more common on the Milford to Dingmans and Dingmans to Bushkill segments. This suggests that more legally designated sites might be needed between Milford and Bushkill.
Further insights into impact levels can be gained by dividing the range of impact into categories and displaying the number and percentage of sites in various categories. In the example in table 9, almost half of the campsites between Milford and Dingmans are in the smallest size class- <1,076 ft2 ( <100 m2 ). Successively smaller proportions are found in the larger size classes. Campsites between Bushkill and Smithfield were also skewed toward the smaller size classes, but not as dramatically. Only 40 percent of sites were in the smallest class and more than 10 percent were in the largest class.
Table 10 shows the number of campsites in each of five condition classes for different destination areas in Sequoia and Kings Canyon National Parks. Differences in numbers of campsites are readily apparent. Converting the data into percentages and displaying them in histograms makes differences in the relative frequency of condition classes more apparent (fig. 1). The Dusy Basin area has a very large number of campsites, but few of the sites are severely impacted. At Bubbs Creek, there are fewer sites but a large proportion of the sites are severely impacted. This type of analysis is most useful for comparing levels of impact in different areas.
At Sequoia and Kings Canyon National Parks, overall impact ratings have been calculated for entire destination areas (Parsons and Stohlgren 1987). Although individual sites are given ratings between 1 and 5, it is clear that impacts on class 5 sites are more than five fold those on class 1 sites. The ratings 1 through 5 were replaced by weights based on campsite area. For example, a site with
Table 7-Campsite conditions on the Milford to Dingmans (M-D) and Bushkill to Smithfield (8-S) river segments at Delaware Water Gap Recreation Area
River segment
M-0 B·S Median Range Median Range
Camp area (m2) 202 18 - 775 286 10 - 3,071 Bare mineral soil (m2) 88 0 - 483 95 0 - 1,042 Damaged trees (number) 3 0 - 17 4 0 - 16 Tree stumps (number) 1 0 - 5 2 0 - 35 Shoreline disturbance (m) 12 0 - 57 7 0 - 36 Trees with exposed roots (number) 0 - 6 0 - 8 Firerings (number) 0 - 6 0 - 4 Vegetation loss (percent) 35 -25 - 75 40 -25 - 75
Table 8-The number of legal and illegal campsites on different river segments at Delaware Water Gap National Recreation Area
Legal sites Illegal sites Total sites
River segment Number Percent Number Percent Number Percent
Above Milford 5 2.8 9 5.0 14 7.8 Milford to Dingmans 20 11.2 16 8.9 36 20.1 Dingmans to Bushkill 29 16.2 20 11.2 49 27.4 Bushkill to Smithfield 58 32.4 7 3.9 65 36.3 Below Smithfield 4 2.2 11 6.1 15 8.4
Totals 116 64.8 63 35.2 179 100.0
26

',•'
Table 9-Frequency distribution, by campsite area category, for campsites on the Milford to Dingmans (M-D) and Bushkill to Smithfield (8-S) river segments at Delaware Water Gap National Recreation Area
River segment
Campsite M-0 8-S area (m 2) Number Percent Number Percent
0- 100 17 47 26 40 101 - 300 10 28 22 34 301 - 600 5 14 7 11 601 - 900 4 11 3 5
>900 0 0 7 11
Total 36 100 65 100
Table 10-Number of campsites, by condition class, in destination areas in Sequoia and Kings Canyon National Parks (Parsons and Stohlgren 1987)
Destination area
Goddard Canyon McClure Meadow Ionian Basin Cartridge Creek Rae Lakes Hamilton Lakes Hockett Meadows Dusy Basin Bubbs Creek
Condition class 1 2 3 4 5
- - - - - - Number of sites - - - - -37 33 33 19 15 85 87 51 23 19 35 22 13 0 4 59 35 4 0 0
116 108 63 31 5 3 3 3 14 2
102 87 58 20 23 168 94 28 2 0 30 24 31 20 13
Total sites
137 265 74 98
323 25
290 292 118
an area rating of 5 is, on average, 150 times larger than a site with an area rating of 1. Assuming, then, that total area is the most appropriate indicator of total impact, and that the total area rating will probably be the same as the entire campsite class rating, weights for class 1 through 5 sites are 1, 6, 30, 75, and 150. To determine the total impact of each destination area, the number of campsites in each class is multiplied by these weights; then these products are summed to get the total weighted value. Figure 2 shows the campsites at Lake Reflection, their campsite classes, and the calculation of the total weighted value for the lake.
The total weighted value and the weighted value/site allow comparisons between different destination areas. The total value provides a perspective on aggregate impacts in an area. Destination areas vary greatly in size, however, so areas with a larger total may not necessarily have more impact per unit area. The total value/site provides a perspective on how impacted the average site is.
The problem with this procedure is in the selection of weights. Although basing weights on total camp area is probably as defensible as any other single criterion, assigning interval values, after the fact, to ordinal rankings is inevitably suspect. Is an area with one class 5 site really
27
60 {a) {b)
CJ) w I-c;; ..J
40 ~ I-0 I-LL 0 I-z 20 w (.) a: w fl.
0 1 2 3 4 5 1 2 3 4 5
CONDITION CLASS
Figure 1-Percentage of total sites in each condition class, for the (a) Dusy Basin and (b) Bubbs Creek destination areas in Kings Canyon National Park.
0 2
Campsite No. Weighting Weighted Class Sites Factor
1 6 x 1 2 6 x 6 3 3 '1 30 4 5 x 75 5 3 x 150
Total Weighted Value =
Figure 2-Distribution of campsites and condition classes at Lake Reflection in Kings Canyon National Park. Calculation of a weighted value for the destination area is illustrated.
Value
6
36 90
375 450
957
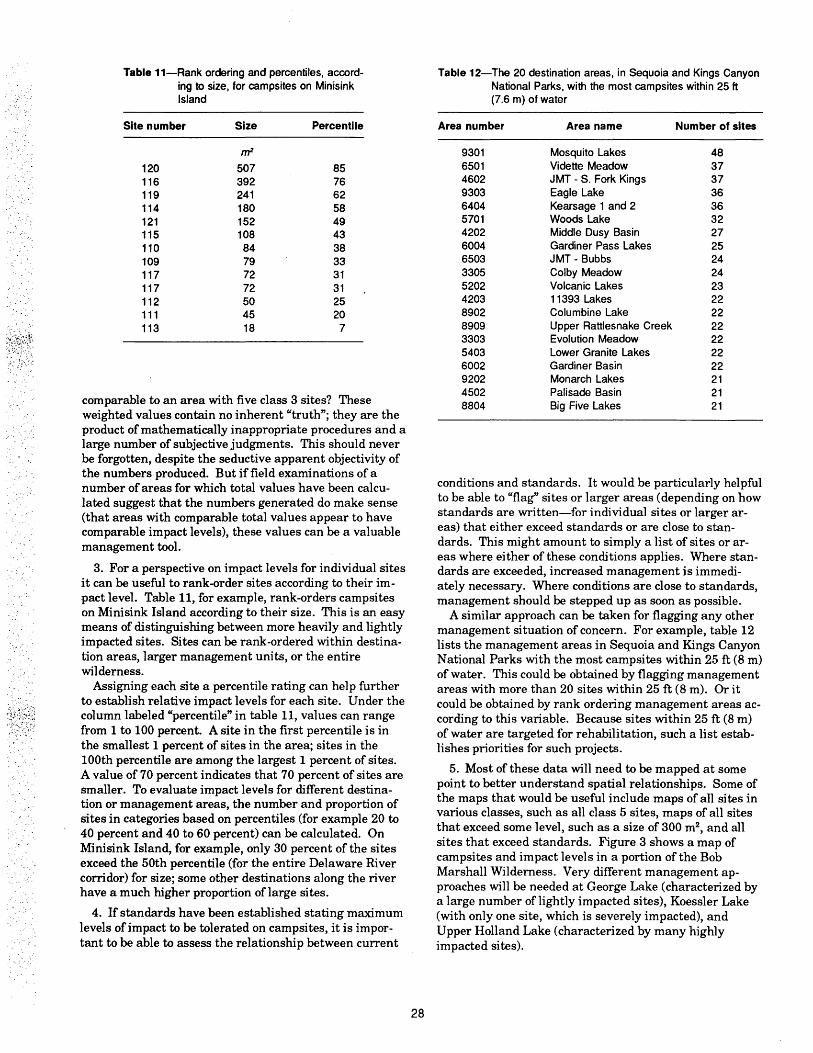
·.· ..
Table 11-Rank ordering and percentiles, accord-ing to size, for campsites on Minisink Island
Site number Size Percentile
m2
120 507 85 116 392 76 119 241 62 114 180 58 121 152 49 115 108 43 110 84 38 109 79 33 117 72 31 117 72 31 112 50 25 111 45 20 113 18 7
comparable to an area with five class 3 sites? These weighted values contain no inherent "truth"; they are the product of mathematically inappropriate procedures and a large number of subjective judgments. This should never be forgotten, despite the seductive apparent objectivity of the numbers produced. But if field examinations of a number of areas for which total values have been calculated suggest that the numbers generated do make sense (that areas with comparable total values appear to have comparable impact levels), these values can be a valuable management tool.
3. For a perspective on impact levels for individual sites it can be useful to rank-order sites according to their impact level. Table 11, for example, rank-orders campsites on Minisink Island according to their size. This is an easy means of distinguishing between more heavily and lightly impacted sites. Sites can be rank-ordered within destination areas, larger management units, or the entire wilderness.
Assigning each site a percentile rating can help further to establish relative impact levels for each site. Under the column labeled "percentile" in table 11, values can range from 1 to 100 percent. A site in the first percentile is in the smallest 1 percent of sites in the area; sites in the lOOth percentile are among the largest 1 percent of sites. A value of 70 percent indicates that 70 percent of sites are smaller. To evaluate impact levels for different destination or management areas, the number and proportion of sites in categories based on percentiles (for example 20 to 40 percent and 40 to 60 percent) can be calculated. On Minisink Island, for example, only 30 percent of the sites exceed the 50th percentile (for the entire Delaware River corridor) for size; some other destinations along the river have a much higher proportion oflarge sites.
4. If standards have been established stating maximum levels of impact to be tolerated on campsites, it is important to be able to assess the relationship between current
28
Table 12-The 20 destination areas, in Sequoia and Kings Canyon National Parks, with the most campsites within 25 ft (7.6 m) of water
Area number Area name Number of sites
9301 Mosquito Lakes 48 6501 Vidette Meadow 37 4602 JMT - S. Fork Kings 37 9303 Eagle Lake 36 6404 Kearsage 1 and 2 36 5701 Woods Lake 32 4202 Middle Dusy Basin 27 6004 Gardiner Pass Lakes 25 6503 JMT - Bubbs 24 3305 Colby Meadow 24 5202 Volcanic Lakes 23 4203 11393 Lakes 22 8902 Columbine Lake 22 8909 Upper Rattlesnake Creek 22 3303 Evolution Meadow 22 5403 Lower Granite Lakes 22 6002 Gardiner Basin 22 9202 Monarch Lakes 21 4502 Palisade Basin 21 8804 Big Five Lakes 21
conditions and standards. It would be particularly helpful to be able to "flag" sites or larger areas (depending on how standards are written-for individual sites or larger areas) that either exceed standards or are close to standards. This might amount to simply a list of sites or areas where either of these conditions applies. Where standards are exceeded, increased management is immediately necessary. Where conditions are close to standards, management should be stepped up as soon as possible.
A similar approach can be taken for flagging any other management situation of concern. For example, table 12 lists the management areas in Sequoia and Kings Canyon National Parks with the most campsites within 25 ft (8 m) of water. This could be obtained by flagging management areas with more than 20 sites within 25 ft (8 m). Or it could be obtained by rank ordering management areas according to this variable. Because sites within 25 ft (8 m) of water are targeted for rehabilitation, such a list establishes priorities for such projects.
5. Most of these data will need to be mapped at some point to better understand spatial relationships. Some of the maps that would be useful include maps of all sites in various classes, such as all class 5 sites, maps of all sites that exceed some level, such as a size of 300 m2, and all sites that exceed standards. Figure 3 shows a map of campsites and impact levels in a portion of the Bob Marshall Wilderness. Very different management approaches will be needed at George Lake (characterized by a large number oflightly impacted sites), Koessler Lake (with only one site, which is severely impacted), and Upper Holland Lake (characterized by many highly impacted sites).

--- --
0 1/2 Ml
----
;
I I
I I I
I
I
I
" I
IMPACT INDEX
• LIGHT(20-29)
• MODERATE(30-40)
• HEAVY(41-50)
• SEVERE(S 1-60)
I I
I_ ----/ /
0 1000 ft
Figure 3-Campsite location of amount and impact in a portion of the Bob Marshall Wilderness. Refer to appendix H for a discussion of the impact index.
29

The ability to do mapping automatically, using a computer, makes this process much simpler than if data need to be mapped by hand. The data from the inventory of campsites in the Bob Marshall, for example, are being integrated into a Geographic Information System being developed for the area. This will greatly facilitate display and analysis of the data base.
Analysis of Trends
Experience with analyzing data on trends in campsite conditions is more limited. As with analysis of the current situation, it can be useful to be able to recover data on individual sites, to provide summary statistics, to rank-order sites, to flag certain situations, and to have mapping capabilities. The major difference is that tlie analysis involves comparison of observations taken at more than one time.
1. The ability to easily recover all data for any site, at each observation period, is a useful way to evaluate change on each site. Amount of change can be expressed as the difference between two observations. It can also be expressed as this difference as a percentage of the earlier observation. For example, if the area of the site increased from 400 to 500 m 2, it increased 100 m2 , which is 25 percent. As the number of sites increases, analyzing changes on individual sites becomes increasingly impractical.
2. Summary statistics provide a perspective on amounts of change for the entire area or portions of areas, such as management or destination areas. Medians and ranges are useful statistics for displaying typical changes and variability in response. Table 13 shows changes over 5 years on 16 campsites in the Eagle Cap Wilderness (Cole 1986b). Medians at the two observation periods are provided, as are med\ans for the difference between these observations and this difference expressed as percent change. Finally, the number of sites that increased or decreased is displayed in order to evaluate how consistent changes were, and the statistical significance of the change is assessed.
Such statistics, in addition to indicating what changes have occurred, can be used to assess differences in amount of change between management areas within a wilderness. Areas with more pronounced changes or a greater proportion of sites experiencing change should be assigned a high priority for management attention.
3. Sites can be rank-ordered according to how much change has occurred since the last observation period. As with the analysis of the current situation, each site's percentile can be determined to gain a perspective on how change compares to what has occurred on other sites. Those sites in the higher percentiles and those areas with a large number of sites in the higher percentiles are the sites and areas with the greatest need for more intensive management.
4. There are a number of situations that might usefully be flagged. Those sites that have deteriorated or improved most might be identified, as might the management areas that have deteriorated or improved most. Other situations that might be flagged include those that still exceed standards, those that have violated standards over the observation period, those that are approaching standards, and those that have improved in relation to standards.
5. Any of these sets of flagged sites could be mapped. New sites that have developed and sites that are no longer there could also be mapped. Finally, it can be useful to classify sites according to level of deterioration or improvement and then map sites in each of these classes.
Automatic Data Processing Access to computer hardware and software makes it a
relatively simple matter to perform a myriad of useful analyses. Manfredo and Hester (1983) have developed a software package, written for Apple computers, that analyzes and graphically presents impact moni~oring information. The analyses mentioned above, for campsites at
Table 13-Median change in size and tree damage, over a 5-year period, on 16 campsites in the Eagle Cap Wilderness 1
Camp Devegetated Damaged Trees with Felled Statistic area core area trees exposed roots trees
-------m2-------- - - - - - - - - - - - - - Number - - - - - - - - - - - - -
Median 1979 198 86 9.0 3.5 4.0 1984 233 104 7.5 3.5 5.0
Difference 22 5 0 0 1.0 Change(%) 11 10 0 0 35 Number of sites
Increase 14 10 3 4 8 Decrease 1 5 6 3 4
Significance <0.001 0.03 0.17 0.26 0.08
1oifference is the median difference between 1979 and 1984. Change is difference as a percentage of 1979 values. Positive values indicate an increase between 1979 and 1984. Significance was test9d with the Wilcoxon matched-pairs, signed-ranks test.
30

:- . .'1
the Delaware Water Gap, were produced using software developed by Chuck Robbins and Jeff Marion. They used the dBASE III data manager, along with some additional programming, to do most of the analyses just mentioned.
Data base managers make data entry simple, and many of them have built-in capabilities to derive basic summary statistics. With some additional programming it should be a simple matter to develop user-friendly, menu-driven software that can easily perform all needed analyses and then generate maps and graphs to display results.
Research Needs Because efforts to monitor campsites are still in their
infancy, we have little experience with analysis of monitoring data. Experience with trend data is particularly limited. The preceding discussion presented some ideas and, where possible, some examples. We need to evaluate means of analyzing and displaying these data. Once these methods are fairly well established, it should be possible to develop software packages that will simplify the analysis procedures.
Sources of Information Cole, David N. 1986. Ecological changes on campsites in
the Eagle Cap Wilderness, 1979 to 1984. Res. Pap. INT-368. Ogden, UT: U.S. Department of Agriculture, Forest Service, Intermountain Research Station. 15 p. (Displays results of changes over a 5-year period.)
Manfredo, Michael J.; Hester, Arlene. 1983. A microcomputer based campsite data system. In: Bell, J. F.; Atterbury, T., eds. Proceedings, renewable resource inventories for monitoring changes in trends, an international conference. Soc. Amer. For. No. 83-14. Corvallis, OR: Oregon State University, College of Forestry: 731-734. (Discusses the use of data management systems and presents a software program, for Apple computers, that analyzes and displays campsite monitoring data.)
Marion, Jeffrey L. [Personal communication.] Research Scientist, U.S. Department of the Interior, National Park Service, Mid-Atlantic Region, Star Route 38, Milford, PA 18337. (Has developed dBASE III based software for analyzing campsite monitoring data.)
Parsons, David J.; Stohlgren, Thomas J. 1987. Impacts of visitor use on backcountry campsites in Sequoia and Kings Canyon National Parks, California. Tech. Rep. No. 25. Davis, CA: U.S. Department of the Interior, Cooperative National Park Resources Studies Unit, University of California, Institute of Ecology. 79 p. (Describes results of an inventory of campsites, including an evaluation of procedures. Includes a method for assessing the overall impact for entire destination areas.)
31
STEP7.MANAGEMENT APPLICATIONS OF MONITORING DATA
Many of the early attempts to monitor campsites were not very successful because plans for using the data generated were unclear. This is the reason for all the emphasis in step 1 on deciding on your needs and which types of impact are most critical. It is also important, from the start, to have a plan for using the data. Otherwise time may be spent collecting information that is never used and items of importance may be overlooked. Four important uses for monitoring data can be described.
Establishing Management and Budget Priorities
Perhaps the most immediate use of the data is to establish priorities for management projects. The analysis of the current situation will identify places where campsite impacts are particularly severe and followup measures will identify places where conditions are deteriorating greatly. These places should receive a high priority for management attention.
Exactly what situation is most undesirable and deserving of management attention will vary from area to area. At Sequoia and Kings Canyon National Parks, where the policy is to obliterate campsites located within 25 ft (7.6 m) of water, those places with the most sites close to water receive a high priority for management attention. Where severely impacted sites are not tolerated, places with many class 5 sites (or some other measure of severe impact) would be a high priority. Managers who are particularly concerned with the proliferation of impacts might assign highest priority to places with the greatest increase in number of sites. Regardless of management objectives, if the appropriate types of measures are taken, it should be a simple matter to identify places that are in particular need of management attention and, therefore, should receive a high priority in the budgeting process.
Monitoring can also facilitate the budgeting process by more objectively describing the nature and extent of impact problems. Specific problems in specific.places can be identified, making it a simpler matter to determine the level of funding necessary to deal with these problems.
Management of Specific Sites This type of analysis can also be extended to the man
agement of individual sites. It is possible to identify those sites that are currently most heavily impacted, as well as those sites that are deteriorating most. Moreover, as long as data on individual impact parameters have been recorded separately, it will be clear which types of impact are most severe or are deteriorating most. This is important because very different management actions are needed for different types of impact. Damage to trees, for example, is best dealt with through education of campers; total area of the campsite might be dealt with through limits on party size or through site management intended

··. · ..
to make site expansion more difficult; loss or disturbance of organic horizons is inevitable with use, although it might be less severe if campsites were used less frequently. Management responses must be tailored to the particular types of impact that are occurring.
Relationship to Standards Recently there has been an attempt to make manage
ment more objective, explicit, and consistent by using specific statements of objectives to drive management. This approach, described most completely in a process termed "limits of acceptable change" (LAC) (Stankey and others 1985), involves the definition of standards. Standards are precise, usually quantitative, statements of maximum levels of impact that will be tolerated (for.example, campsites will be no larger than 1,000 ft2).
Standards are statements of conditions that, at a minimum, will be provided. Existing conditions can be compared with standards to determine where problems exist. A problem, by definition, is a situation where standards are violated. Where problems exist, increased management is required. Conversely, where problems do not exist, management actions that constrain legitimate recreational uses should not be required. Once standards are agreed on, situations where management actions are and are not needed can be agreed on. Often the specific management actions needed are also obvious because the nature and location of problems are quite specific.
Inventory and monitoring are a critical part of this process and most areas will have standards related to campsite impacts. Through a process such as LAC, campsite monitoring is formally integrated into the planning process. This was successfully done in the Bob Marshall Wilderness complex, which will provide the examples in the following discussion.
During early meetings in the planning process, campsite impacts were identified as one of the foremost concerns in the area. Consequently, development of a campsite inventory and monitoring procedure was a high priority. Because the area to be inventoried was 1.5 million acres (0.6 million ha) and there was only a handful of people available to work part time on the inventory, a procedure involving rapid estimates of a number of site characteristics and impact parameters was developed (Cole 1984).
The first issue was to select the types of impact (indicators in the LAC terminology) to write standards for. These were decided on after field trips to identify problem situations, evaluation of public concerns, and analysis of detailed measurements on a sample of 35 campsites (Cole 1983b). Frequent problems in need of management were places with excessive numbers of sites, places with large numbers of highly impacted sites, and individual sites with excessive amounts of barren soil. The specific indicators selected to address these problems were (1) the number of campsites per 640-acre (259-ha) section, (2) the number of moderately and highly impacted campsites per 640-acre (259-ha) section, and (3) the area of barren core on any campsite.
32
Moderately and highly impacted sites were sites with a summary rating of 30-50 and more than 50, respectively. These summary ratings were derived by rating nine parameters, multiplying these ratings by weights (reflecting the relative importance of each parameter), and summing these products. Refer to appendix H for more detail.
The Bob Marshall Wilderness complex was subdivided into four opportunity classes. Different standards were written for each of these opportunity classes. For example, the standards for maximum number of campsites per 640-acre (259-ha) section are one in opportunity class 1, and 2, 3, and six in classes 2, 3, and 4, respectively. Other standards for opportunity class 1 are no moderately or highly impacted campsites per section and no more than 100 ft2 (9 m2 ) of barren core on any campsite. Analogous standards for opportunity class 4 are no more than three moderately impacted sites and no more than one highly impacted site in any section, and no more than 2,000 ft2 (186 m2 ) of barren core on any campsite.
Whether current conditions violate standards or not can easily be determined from the inventory data. Barren core can simply be read off the form or flagged on a computer data base. The number of sites per section requires mapping and then counting of numbers of sites. The number of moderately and highly impacted sites can be assessed in a similar manner, although it is necessary to first calculate summary impact ratings.
Defining standards provides a specific focus for campsite monitoring, as well as for the entire planning and management process. As increasing numbers of areas adopt this framework, the use of monitoring data in relation to standards is likely to become increasingly important.
Use in Developing Visitor-Use Capacities
Data from campsite inventories have been used to establish visitor use limits at Sequoia and Kings Canyon National Parks. The procedure is discussed in detail by Parsons (1986) and Parsons and Stohlgren (1987). The following discussion is excerpted from those papers.
Sequoia and Kings Canyon National Parks have been divided into 52 backcountry travel zones. Each zone has a daily use capacity, determined largely on the basis of campsite inventory data. Zone capacities are controlled by daily trailhead quotas, established through the QUOTA computer model developed at Yosemite National Park (van Wagtendonk and Coho 1986).
The decision to base zone capacities on campsites reflected a major management objective of maintaining historical use patterns in the Parks. This assures that traditional low-use (and generally low-impact) areas will remain, while recognizing the futility of trying to reduce use levels in traditional heavy use areas, particularly given the long periods required for recovery from impact.
The first step in the process of setting capacities was to count the number of class 3, 4, and 5 campsites in each destination area (termed management area). The number of these sites that were unacceptable (either because they were within 25 ft [7.6 m] of water, within 100 ft [30 m] of
another class 3, 4, or 5 site, or unacceptable for some other reason) was determined and subtracted from the original total. This final number was the maximum number of sites that could be used at one time. Class 1 and 2 sites were not included, although it was recognized that they would continue to be used occasionally.
This estimate of the number of acceptable sites was evaluated by a team of scientists and managers familiar with the area. In many cases it was agreed that more acceptable sites were available than could ever be occupied at one time without exceeding either the peak recorded use or the group's opinion of what use level was appropriate. In these cases, the maximum number of sites was reduced to a level that seemed appropriate, without causing unacceptable crowding or increases in use.
The maximum number of sites was summed for each destination area in each zone to obtain a zone total. These numbers were compared with available information on the number of parties using specific zones during peak use periods. If these numbers exceeded the reported peak use, they were reduced accordingly. The final number of acceptable sites that could be occupied at one time was multiplied by the average party size to obtain the maximum daily number of persons allowed in each zone.
Parsons and Stohlgren (1987) stress that the rationale behind this approach stems from a goal of maintaining existing use and impact patterns. Should objectives stress either more stringent preservation or provision of more recreational opportunities, underlying assumptions would have to be shifted and the procedure would have to be modified. Nevertheless, capacities could still be derived largely from campsite inventory data.
Research Needs Research could suggest additional ways that monitoring
data might be applied to management. Further work on which types of impacts (indicators) are most useful for writing standards would be helpful, as would evaluation of the success of programs that do utilize monitoring data in their management programs.
Sources of Information Parsons, David J. 1986. Campsite impact data as a basis
for determining wilderness use capacities. In: Lucas, Robert C., compiler. Proceedings-national wilderness research conference: current research; 1985 July 23-26; Fort Collins, CO. Gen. Tech. Rep. INT-212. Ogden, UT: U.S. Department of Agriculture, Forest Service, Intermountain Research Station: 449-455. (Describes how campsite inventory data were used to derive use limits for Sequoia and Kings Canyon National Parks.)
Parsons, David J.; Stohlgren, Thomas J. 1987. Impacts of visitor use on backcountry campsites in Sequoia and Kings Canyon National Parks, California. Tech. Rep. 25. Davis, CA: U.S. Department of the Interior, Cooperative National Park Resources Studies Unit, University of California, Institute of Ecology. 79 p. (Includes a section on the calculation of use capacities for zones, on the basis of campsite inventory data.)
33
Stankey, George H.; Cole, David N.; Lucas, Robert C.; Petersen, Margaret E.; Frissell, Sidney S. 1985. The limits of acceptable change (LAC) system for wilderness planning. Gen. Tech. Rep. INT-176. Ogden, UT: U.S. Department of Agriculture, Forest Service, Intermountain Forest and Range Experiment Station. 37 p. (Discusses standards, their purpose, and how they can be developed.)
REFERENCES Bratton, Susan P.; Stromberg, Linda L.; Harmon, Mark E.
1982. Firewood-gathering impacts in backcountry campsites in Great Smoky Mountains National Park. Environmental Management. 6: 63-71.
Bratton, Susan Power; Hickler, Matthew G.; Graves, James H. 1978. Visitor impact on backcountry campsites in the Great Smoky Mountains. Environmental Management. 2: 431-442.
Brewer, Les; Berrier, Debbie. 1984. Photographic techniques for monitoring resource change at backcountry sites. Gen. Tech. Rep. NE-86. Broomall, PA: U.S. Department of Agriculture, Forest Service, Northeastern Forest Experiment Station. 13 p.
Carothers, Steven W.; Johnson, Robert A.; Dolan, Robert. 1984. Recreational impacts on Colorado River beaches in Glen Canyon, Arizona. Environmental Management. 8: 353-358.
Chambers, Jeanne C.; Brown, Ray W. 1983. Methods for vegetation sampling and analysis on revegetated mined lands. Gen. Tech. Rep. INT-151. Ogden, UT: U.S. Department of Agriculture, Forest Service, Intermountain Forest and Range Experiment Station. 57 p.
Cole, David N. 1982. Wilderness campsite impacts: effect of amount of use. Res. Pap. INT-284. Ogden, UT: U.S. Department of Agriculture, Forest Service, Intermountain Forest and Range Experiment Station. 34 p.
Cole, David N. 1983a. Monitoring the condition of wilderness campsites. Res. Pap. INT-302. Ogden, UT: U.S. Department of Agriculture, Forest Service, Intermountain Forest and Range Experiment Station. 10 p.
Cole, David N. 1983b. Campsite conditions in the Bob Marshall Wilderness, Montana. Res. Pap. INT-312. Ogden, UT: U.S. Department of Agriculture, Forest Service, Intermountain Forest and Range Experiment Station. 18 p.
Cole, David N. 1984. An inventory of campsites in the Flathead National Forest portion of the Bob Marshall Wilderness. Unpublished report on file at: U.S. Department of Agriculture, Forest Service, Intermountain Research Station, Forestry Sciences Laboratory, Missoula, MT. 19 p.
Cole, David N. 1985. Ecological impacts on backcountry campsites in Grand Canyon National Park. Unpublished report on file at: U.S. Department of the Interior, National Park Service, Western Regional Office, San Francisco, CA. 96 p.
Cole, David N. 1986a. Ecological changes on campsites in the Eagle Cap Wilderness, 1979 to 1984. Res. Pap. INT-368. Ogden, UT: U.S. Department of Agriculture, Forest Service, Intermountain Research Station. 15 p.

Cole, David N. 1986b. Recreational impacts on backcountry campsites in Grand Canyon National Park, Arizona, USA. Environmental Management. 10: 651-659.
Cole, David N.; Marion, Jeffrey L. 1988. Recreation impacts in some riparian forests of the eastern United States. Environmental Management. 12: 99-107.
Echelberger, Herbert E. 1971. Vegetative changes at Adirondack campgrounds: 1964 to 1969. Res. Note NE-142. Upper Darby, PA: U.S. Department of Agriculture, Forest Service, Northeastern Forest Experiment Station. 8 p.
Frissell, Sidney S. 1978. Judging recreation impacts on wilderness campsites. Journal of Forestry. 76: 481-483.
Gifford, Gerald F.; Faust, Robert H.; Coltharp, George B. 1977. Measuring soil compaction on rangeland. Journal of Range Management. 30: 457-460.
Hendee, John C.; Clark, Roger N .; Hogans, Mack L.; Wood, Dan; Koch, Russell W. 1976. Code-A-Site: a system for inventory of dispersed recreational sites in roaded areas, backcountry, and wilderness. Res. Pap. PNW-209. Portland, OR: U.S. Department of Agriculture, Forest Service, Pacific Northwest Forest and Range Experiment Station. 33 p.
Howard, Richard F.; Singer, Michael J. 1981. Measuring forest soil bulk density using irregular hole, paraffin clod, and air permeability. Forest Science. 27: 316-322.
Kitchell, Katherine P.; Connor, Jeff. 1984. Canyonlands and Arches National Parks and Natural Bridges National Monument draft recreational impact assessment and monitoring program. Unpublished paper on file at: U.S. Department of the Interior, National Park Service, Moab, UT. 80 p.
LaPage, Wilbur F. 1967. Some observations on campground trampling and ground cover response. Res. Pap. NE-68. Upper Darby, PA: U.S. Department of Agriculture, Forest Service, Northeastern Forest Experiment Station. 11 p.
Lee, Robert G.1975. The management of human components in the Yosemite National Park ecosystem. Yosemite, CA: Yosemite Institute. 134 p.
Legg, Michael H.; Schneider, Gary. 1977. Soil deterioration on campsites: northern forest types. Soil Science of America Journal. 41: 437-441.
Leonard, R. E.; McBride, J.M.; Conkling, P. W.; McMahon, J. L. 1983. Ground cover changes resulting from camping stress on a remote site. Res. Pap. NE-530. Broomall, PA: U.S. Department of Agriculture, Forest Service, Northeastern Forest Experiment Station. 4 p.
Magill, Arthur W. 1970. Five California campgrounds ... conditions improve after 5 years' recreational use. Res. Pap. PSW-62. Berkeley, CA: U.S. Department of Agriculture, Forest Service, Pacific Southwest Forest and Range Experiment Station. 18 p.
Magill, Arthur W.; Twiss, R. H. 1965. A guide for recording esthetic and biologic changes with photographs. Res. Note PSW-77. Berkeley, CA: U.S. Department of Agriculture, Forest Service, Pacific Southwest Forest and Range Experiment Station. 8 p.
34
Manfredo, Michael J.; Hester, Arlene. 1983. A microcomputer based campsite data system. In: Bell, J. F.; Atterbury, T., eds. Proceedings, renewable resource inventories for monitoring changes in trends, an international conference. Soc. Amer. For. No. 83-14. Corvallis, OR: Oregon State University, College of Forestry: 731-734.
Marion, Jeffrey L. 1986. Campsite assessment systems: application, evaluation, and development. In: Popadic, Joseph S.; [and others], eds. Proceedings, 1984 river recreation symposium; 1984 October 31-November 3; Baton Rouge, LA. Baton Rouge, LA: Louisiana State University, School of Landscape Architecture: 561-573.
Marion, Jeffrey L.; Merriam, L. C. 1985. Recreational impacts on well-established campsites in the Boundary Waters Canoe Area Wilderness. Stn. Bull. AD-SB-2502. St. Paul, MN: University of Minnesota, Agricultural Experiment Station. 16 p.
Marion, Jeffrey Lawrence. 1984. Ecological changes resulting from recreational use: a study ofbackcountry campsites in the Boundary Waters Canoe Area Wilderness, Minnesota. St. Paul, MN: University of Minnesota. 279 p. Dissertation.
Merriam, L. C., Jr.; Smith, C. K.; Miller, D. E.; [and others]. 1973. Newly developed campsites in the Boundary Waters Canoe Area: a study of 5 years' use. Stn. Bull. 511, For. Ser. 14. St. Paul, MN: University of Minnesota, Agricultural Experiment Station. 27 p.
Mueller-Dombois, Dieter; Ellenberg, Heinz. 1974. Aims and methods of vegetation ecology. New York: John Wiley. 547 p.
Parsons, David J. 1986. Campsite impact data as a basis for determining wilderness use capacities. In: Lucas, Robert C., compiler. Proceedings-national wilderness research conference: current research; 1985 July 23-26; Fort Collins, CO. Gen. Tech. Rep. INT-212. Ogden, UT: U.S. Department of Agriculture, Forest Service, Intermountain Research Station: 449-455.
Parsons, David J.; MacLeod, Susan A. 1980. Measuring impacts of wilderness use. Parks. 5(3): 8-12.
Parsons, David J.; Stohlgren, Thomas J. 1987. Impacts of visitor use on backcountry campsites in Sequoia and Kings Canyon National Parks, California. Tech. Rep. 25. Davis, CA: U.S. Department of the Interior, Cooperative National Park Resources Studies Unit, University of California, Institute of Ecology. 79 p.
Schreiner, Edward S.; Moorhead, Bruce B. 1979. Human impact inventory and management in the Olympic National Park backcountry. In: Ittner, Ruth; Potter, Dale R.; Agee, James K.; Anschell, Susie, eds. Proceedings, recreational impact on wildlands; 1978 October 27-29; Seattle, WA. R-6-001-1979. Portland, OR: U.S. Department of Agriculture, Forest Service, Pacific Northwest Region: 203-212.
Schuster, Ervin G.; Zuuring, Hans R. 1986. Quantifying the unquantifiable: or, have you stopped abusing measurement scales? Journal of Forestry. 84: 25-30.

Stankey, George H.; Cole, David N.; Lucas, Robert C.; Petersen, Margaret E.; Frissell, Sidney S. 1985. The limits of acceptable change (LAC) system for wilderness planning. Gen. Tech. Rep. INT-176. Ogden, UT: U.S. Department of Agriculture, Forest Service, Intermountain Forest and Range Experiment Station. 37 p.
Steele, Brian. 1987. Statistical procedures for the analysis of a campsite monitoring program. Unpublished report on file at: Systems for Environmental Management, Missoula, MT. 56 p.
35
Stohlgren, Thomas J.; Parsons, David J. 1986. Vegetation and soil recovery in wilderness campsites closed to visitor use. Environmental Management. 10: 375-380.
Sydoriak, Charisse A. [In press]. Yosemite's wilderness trail and campsite impacts monitoring system. Paper presented at the National Park Service Science Conference; 1986 July 13-18; Fort Collins, CO.
van Wagtendonk, Jan W.; Coho, Paul R. 1986. Tr~lhead quotas: rationing use to keep wilderness wild. Journal of Forestry. 84: 22-24.

APPENDIXES A-K: SELECTED PROCEDURES USED TO MONITOR WILDERNESS CAMPSITES
Appendix A: Photopoint Photography (Adapted From Brewer and Berrier 1984)
The technique requires a referenced and easily relocated camera position from which photographs can be taken periodically for comparison. The first step is to analyze the subject area carefully. Select a camera position that provides the most advantageous perspective (with the available equipment) of the expected change. Photographers on successive photo missions may fe,el compelled to move the camera slightly to achieve what they feel is a better coverage of the subject. This might result in a loss of information, which could be avoided by properly anticipating what coverage will be necessary as changes occur .over time. Documenting the reason for the camera placement when it is not immediately evident may avoid costly changes.
Once a location for the photopoint has been determined, a physical marker should be established. Permanent landmarks such as boulders or other large objects should be utilized when possible. Where landmarks such as these are not available, some kind of stake can be driven flush with the ground surface. Size, weight, and durability are limiting factors. Wood is light, but may deteriorate faster than desired. Objects as small as nails can be used to permit relocation with a metal detector. (This is more appropriate in wilderness.) Any marker should be as inconspicuous as possible to avoid vandalism.
t3££Uf
FILM: Kodak Tri-x, 400 ASA
Lens center 41 above ground.
Canon FTB, 28mm Canon FD lens.
F-stop, speed f-5.6@ 1/30.
DECLINATION: 15!0 w
Referencing the photopoint is the next step. Two nearby permanent qbjects can be used as references, but three are better. Trees are good references and may be marked with numbered aluminum tags. (Note: Tags are not appropriate in designated wilderness.) Identification tag numbers should be recorded along with the bearing and distance from each tree to the photopoint. Sketch maps should be made showing the azimuth from the reference point to the photopoint, the d.b.h. and species of the witness trees, and the general object area in relation to trailheads, shelters, access roads, and so forth (fig. 4). An altimeter reading and slope aspect indication can sometimes help locate the photopoint on topographic maps. A photograph of the area and camera setup is also useful for relocation.
t-1gure 4-~Ketcn map referencing a photopoint.
If different cameras are used for successive photos from the same point, film format and lens focal length should be the same. Film of the same type, speed, and spectral sensitivity should be used when possible. A change from black and white to color film can be made with less loss of information if a set of prints is also made from the color negatives or slides for the first year of comparison. The time of day ahould be duplicated as closely as possible to avoid shadows in different positions. The photos should also be taken during the same time of year (the size of the "window" of duplication days will vary according to the needs of the study). Carrying copies of the original photos into the field can facilitate accurate reproduction.
36

.-::·:::-
.·.;
Appendix B: The Frissell Condition Class System (Modified From Frissell 1978)
After locating campsites on a map of the area, assign each campsite a rating between 1 and 5, using the following definitions:
Class 1--Ground vegetation flattened but not permanently injured. Minimal physical change except for possibly a simple rock fireplace.
Class 2--Ground vegetation worn away around fireplace or center of activity.
Class 3--Ground vegetation lost on most of the site, but humus and litter still present in all but a few areas .
Class 4-Bare mineral soil widespread. Tree roots exposed on the surface.
Class 5--Soil erosion obvious. Trees reduced in vigor or dead.
Appendix C: The Sequoia-Kings Canyon Campsite Class System (Adapted From Parsons and MacLeod 1980; Parsons and Stohlgren 1987)
Campsites are located on an area sketch map (fig. 5). Then each campsite is rated on the basis of eight criteria (fig. 6). A rating between 1 and 5 is assigned to each factor that applies. These ratings are summed and divided by the number of factors used. For example, if there are no trees on the site, this criterion is ignored and the sum of rankings is divided by 7, instead of 8. This mean, rounded to the nearest integer, is the campsite class. Figure 7 shows the field inventory form used for eight of the campsites around Lake Reflection.
Additional instructions that might not be selfexplanatory from the criteria and rating factors in figure 6 include:
1. Density of vegetation is evaluated by comparing the extent of vegetative ground cover on the campsite with that on environmentally similar but unimpacted areas off the site.
2. Composition of vegetation also involves a comparison with an undisturbed area.
3. Total area of the campsite is an estimate of the area affected by trampling on the site.
4. Barren core area is an estimate of the area on which trampling has removed all vegetation; organic horizons may or may not still be present.
5. Social trails are the informal trails that develop between the campsite and the trail, water, and other campsites. It will be necessary to define what constitutes a well-developed, as opposed to a discernible, trail.
6. Mutilations refer to trees; this factor will not apply in nonforested areas. Mutilations include carvings, ax marks, and nails. More than one mutilation can occur on one tree. A definition should be developed for what constitutes a highly obtrusive mutilation and a decision must be made about how far offsite to count trees.
In addition to the campsite impact class, descriptive information on the local environment is recorded on the inventory form (fig. 7). The distance to water and the number of class 3, 4, and 5 sites within 100 ft (30 m)-a measure of campsite crowding-are also recorded. If the
37
site is not acceptable, a potential large group site, or in need of obliteration, this is noted, as are any recommended management actions.
La. ~frltfled. ion
j(,.(t.l
j \op(.
j Figure 5-Example of a field map showing the campsites around Lake Reflection. N

... ,·
Density of Vegetation (With respect to surrounding vegetation):
1 - same as surroundings 3 - moderately less dense than surroundings 5 - considerably less dense than surroundings
Composition of Vegetation (With respect to surrounding vegetation):
1 - same as surroundings 3 - moderately dissimilar 5 - significantly dissimilar
Total Area of Campsite
1 - less than or equal to 20 ft2 (2 m2)
2 - 21to100 ft2 {2 to 9.3 m2)
3 - 101 to 500 ft2 {9.4 to 46 m2)
4 - 501 to 1,000 ft2 {46.1 to 93 m2)
5 - greater than 1,001 ft2 {93 m2)
Barren Core Area
1 - absent 2 - 5 to 50 ft2 {0.5 to 4.6 m2)
3 - 51 to 200 ft2 (4.7 to 18.6 m2)
4 - 201 to 500 ft2 {18.7 to 46 m2 )
5 - greater than 501 ft2 {46 m2)
Campsite Development
1 - windbreaks and paraphernalia absent; trash and seats minimal; firerings absent or scarce
2 - trash, windbreaks, seats, and firerings minimal; paraphernalia absent
3 - trash, windbreaks, seats mostly moderate; firerings mostly minimal; paraphernalia minimal
4 - trash, windbreaks, seats, firerings, and paraphernalia mostly moderate; some heavy
5 - trash, windbreaks, seats, firerings, paraphernalia mostly heavily developed
Litter and Duff
1 - trampling barely discernible; some needles broken; scattered cones
2 - moderately trampled; needles broken, compacted; few cones
3 - heavily trampled, clumped, pulverized; cones absent
4 - litter± absent, pulverized, ground into soil 5 - litter, cones, and duff completely absent
Social Trails
1 - none 2 - 1 trail discernible 3 - 2 trails discernible 4 - 1 to 2 trails well developed, or 3 or more trails ±
discernible 5 - 3+ trails well developed
Mutilations
1 - none 2 - 1 to 2 3 - 3 to 5 4 - 6 to 1Oor1 to 2 highly obtrusive 5 - 11 + or 3 ± highly obtrusive
Figure 6-The criteria and rating factors used to inventory campsites in Sequioa and Kings Canyon National Parks.
38

CAMPSITE FIELD IRVEKTORY FORK
Da t e ___ 9_/_~_/_7_1 ___ _ Management Areal-AKE REFl...EC.1101\) Zone l:,? Elevation JO,oO.(
Landform hAJ/..E BAS.IN
Cacpability: Potential lO&/o Currently Used __ 'l.._o_&/_b _____ _
Overstory/Cover t..P-Fr ( <;o&/o
Meadows i>oi: S. I G~IF'IC.ANT Fuels Rating_--'S"--~-A~l!_c..f; __ ~'--------Comments No f:l\)t) t...P-Fi'" Fo.R..Etr !' 0 o/ 0 (, "" £" ~ J
Campsite Number (on map)
Campsite Class
• Ecologfcal Type Site Overstory 'Understory Pot.
Dist. Crowding Comments to a2o 3,4,5's
Aoolication Q.f Rating Factors .f.2.!. Campsite ·class Determination:
Camp Site
Density
Composition
Total Area
Barren Core
Camp Development
Litter & Duff
Social Trails
Mutilations
Mean Rating or Campsite Class
1_/_
"3.
I 3
~
~
3
#_y_
I
I 4
' _,_
#~ # b 5 ~
~
1-. ~
~ _s:__ _3_ ~
<;
:?. t./
Figure 7-Example of the data collection form used to inventory campsites around Lake Reflection.
39

Appendix D: The Eagle Cap Method of Measurements on Permanent Sampling Units (Modified From Cole 1982)
Campsite Measurements-Locate a center point in a position that will permit easy measurement of the site. Mark it, for later relocation, with a large buried nail. Reference the location of the center point, noting azimuth and distance from two (or preferably three) landmarks. (See discussion ofreferencing in appendix A.)
Measure the distance for 16 azimuths (N, NNE, NE, ENE, E, ESE, SE, SSE, S, SSW, SW, WSW, W, WNW, NW, and NNW) from the center point to the first significant amount of vegetation (defined, for the Eagle Cap study, as at least 15 percent cover in a 1.09-by 3.28-ft [0.33- by 1-m] quadrat oriented perpendicular to and bisected by the measuring tape). Be sure to note whether true or magnetic north was used. These intercepts define the boundary of the devegetated central core of the campsite (the bare area in fig. 8). Also measure the distance to the edge of the campsite (where trampling is no longer evident) and record these 16 transect intercepts. If an untrampled "island" is encountered in any direction, note the distance to the "island" and the reentry onto the campsite, as well as the campsite boundary. These intercepts define the campsite boundary, as well as the area of the "island" which is to be subtracted from the area of the campsite (fig. 8).
-- Edge of actual camp area ----Edge of bare area
-·-Edge of camp area, defined by transect end points
In the case of both camp and bare area, boundaries are approximated by drawing straight lines between adjacent intercepts. Note in figure 8 that while this boundary differs from the actual campsite boundary, the total camp area is about the same. To calculate area, intercepts and connecting lines are plotted on a radial map. Figure 9 shows the campsite and "island" boundaries on such a map. Use a planimeter to calculate the area of total campsite, "islands," and. bare area. Subtract the "island" area from the total campsite area to obtain the camp area. A simpler method is to simply calculate the area of each of the 16 triangles defined by adjacent transects (fig. 8) and sum these. The area of each triangle is the length of each of the two transects times 0.383 (the sine of the 22.5 degree angle) divided by 2. In this case, ignore the "island" in calculating these areas of triangles, estimate the area of the "island" in the field, and subtract this value from the sum of the triangles. Refer to appendix J for further discussion of this technique.
Place flagging temporarily at each of the 16 points along the edge of the campsite. Straight lines drawn between these points define the campsite on which replicable measurements will be taken. Count all tree reproduction, defined for the Eagle Cap study as trees more
Figure 8-lllustration of the radial transect technique for estimating the area of the campsite and the devegetated central portion of the campsite (bare area).
40

Figure 9-Example of a radial map used to ca1cu1ate tne area of the campsite in figure 8. Concentric circles are 1 m apart (0.5 m apart within 5 m of the center point). Each square is 1 m2
.
than 6 inches (15 cm) and less than 4.5 ft (140 cm) tall, within this area. Exclude reproduction in untrampled "islands."
Within this same area, count all trees and then note how many are damaged. The types of damage noted in the Eagle Cap study were felled trees, exposed roots, trunk scars, cut branches, nails, and other minor injuries. Another approach would be to use damage categories, as Marion and Merriam (1985) did (see section on tree damage in step 2).
Take additional measurements in quadrats established along four transects that originate at the center point and extend to the edge of the site. Randomly select the azimuth of the first transect (from random numbers between 1 and 90). The azimuth of each successive transect is 90 degrees greater than the azimuth of the previous transect. Bury nails at the end (campsite boundary) of each transect.
Locate about 15 quadrats along these transects. The number on each transect should be roughly proportional to the relative length of each transect. The distance between quadrats on any transect should decrease with
41
distance from the center point (fig. 10). This avoids sampling more heavily toward the center of the site. Measure only quadrats that fall entirely within the campsite.
Within each quadrat estimate the percentage cover of understory vegetation, exposed mineral soil, exposed rock and tree roots, and trunks. Estimate the cover of organic litter, whether it is under vegetation or not (this is an improvement over the technique used in the Eagle Cap). Finally, estimate the cover of all plant species. In the Eagle Cap study, all mosses and all lichens were estimated as a group. Coverage was estimated in 10 percent coverage classes between 10 and 100 percent or to the nearest percentage if cover was 10 percent or less.
Within each quadrat, measure the depth of the organic horizons and take a reading of penetration resistance, with a pocket soil penetrometer. In the Eagle Cap study, four sets of soil samples, bulk density, and infiltration rate measurements were taken. Given the variability of results, this number of samples was probably too small. Read the section in step 2 on impacts to the mineral soil for a discussion of these techniques.

Figure 10-Location of quadrats for sampling ground cover parameters on the campsite in figure 8.
Control Sites-Take a set of comparable measurements on control sites; amount of impact can then be estimated as the difference between conditions on the campsite and on an undisturbed control. Locate controls as close to the campsite as possible, in places that are undisturbed but where the topography, rockiness, tree canopy cover, and understory species are similar to the campsite. Often the understory composition has to be compared to what is surviving in protected places on the campsite.
Bury a nail at the center point of the control and reference it to landmarks, as well as to the campsite. In the Eagle Cap study, controls were generally circular, with an area of 1,000 to 2,000 ft2 (100 to 200 m 2
). Estimate the percent cover of understory vegetation, exposed mineral soil, exposed rock and tree roots and trunks, organic litter, whether it is under vegetation or not, and of all plant
42
species. In the Eagle Cap study, a single cover estimate for the entire control was made, rather than estimating cover in quadrats, as was done on the campsite. This was more rapid and seemed justified because precision was less of a concern on controls. As on campsites, cover was estimated in 10 percent coverage classes between 10 and 100 percent or to the nearest percent if cover was 10 percent or less.
Take measures of penetration resistance, organic horizon thickness, bulk density, and infiltration rates in regularly distributed locations on the control. The number of samples should be the same as the number on campsites.
Finally, count tree reproduction in a circle, centered at the center point, with an area of 538 ft2 (50 m2). Appropriate areas for control plots will vary between regions and impact parameters.

Appendix E: The Sequoia Method of Measurements on Permanent Plots (Modified From Stohlgren and Parsons 1986)
Establish a 32.8- by 32.8-ft (10- by 10-m) sampling unit, aligned along compass directions and located such that most of the campsite is included. Place permanent markers (such as buried nails) at each corner and reference at least one corner. (Refer to the appendix section on photopoints for a discussion of referencing.) Place temporary stakes at 3.28-ft (1-m) intervals along each side. Connect stakes with string to form a 100-cell grid of 10. 76-ft2 (1-m2)
sections. Subdivide each section mentally into four 2.69-ft2
(0.25-m2) plots. Stratify each of these plots subjectively into core, intermediate, and periphery (essentially control) plots. Core plots are generally in the center of the site and show nearly complete loss of vegetation and organic matter and continuous disturbance of the mineral soil. Intermediate plots show notable but less substantial damage (more vegetation cover, less litter and duff pulverization, and pockets of intact sod). Periphery plots appear to be unimpacted and border the site. Map each zone (see fig. 11) and take a subsample of five to 10 plots randomly from each zone.
In each plot, estimate the foliar cover of each plant species to the nearest 5 percent (to the nearest 1 percent if cover is less than 5 percent). Collect five to 10 soil samples from each zone to analyze bulk density, soil moisture, soil texture, organic matter content, pH, and chemistry.
43
1 c CORE
I INTERMEDIATE
p PERIPHERY
R ROCK
A ACCESS TRAIL
TREE SCALE
N NON· HOMOGENEOUS
0 2 3 4m AREA
Figure 11-Map of zones within the 1,076-ft2
(100-m2) sampling area on campsites.

Appendix F: The Olympic Bare Ground Technique (Adapted From Schreiner and Moorhead 1979)
The first step is to map all individual campsites within groups of campsites. For each site, fill out a human impact inventory form (fig. 12). The impact data on the form are found in items 31, 32, and 35 through 38, estimated as follows:
Item 31: Note whether or not horse feces are present.
Item 32: Note the number of horse trample areas (trampled depressions around trees where horses have been tethered) within 100 ft (30 m) of the site.
Item 35: Count the number of social (informal access) trails that enter the site. ·
Item 36: Note whether or not erosion is obvious on the site.
44
Item 37: Measure the distance from a temporary center point to the first vegetation (this must be defined in an agreed-upon manner) in eight directions (N, NE, E, SE, S, SW, W, NW). Note the mean of these eight radii in the seven classes provided-no bare ground; 1-2 ft (0.3-0.6 m); 2.1-4 ft (0.7-1.2 m); 4.1-6 ft (1.3-1.8 m); 6.1-8 ft (1.9-2.4 m); 8.1-10 ft (2.5-3.0 m); and 10.1 ft (3.1 m) and longer.
Item 38: Record each tree on the site, by species, noting diameter and the extent of damage.
Finally, draw a sketch map of the site, to scale. The map is drawn on either a 1- by 1-m grid or a 2- by 2-m grid. This map serves as a baseline for the size of the bare area, the location of social trails, downed logs, and the approximate location of the center point used to determine mean bare radius.

Ol~TANCf
TO MAIN ---+----+-----;!RAIL/ MOAD
"-' \.... 1-ltlO' 101-100'
..... ..... 201-)()0' JOl-400'
MAIN
TRAIL I ROAD
WAY !RAIL/ ROAD
'-' CROSS CCJUNIRY - - -· --------!
OlHt:.N
0
SllE
ACCESS
D (SPECIFY --+-)
~ .................. ....,,.. ...... .,.,..~~--+~~--~[ ~ '-' (1 ~
TRAIL
Dlf f ICULTY R
.-
HUMAN IMPACT INVENTORY PRIORITY NATIONAL PARK SERVICE ITEMS
• ~ : : • • ARE ....... 6-76 ll9703X ~,~;+~.t.' M~:~~[~~r-'!:s SHADED
K:Y 8 USE THIS AREA WHEN SPECIFICS ARE REQUIRED OR TO RECORD ADDITIONAL DATA
SPECIES l~~AL T~~AL --~IAtwH" Jl N·JCN f] ON 111
[1 Cl A SS f 5 "~u~f .. ~u.°: 1---._,'"}{,.,,,_,G"'.'_""'"wo"'L"':"'-~----..-/-0--~AILO: lRHS DHH NO OBH NO DBH NO ~ru•io·~ TRH:. ;~% so% 75% 100'16
'-'.; .._, 9 10 p )."·1 F 1 R
--,,_,-----[.~] ~Yl-5----,·~-N-0----1-P-R-IV_t __ O~T Jl
----,----....,..----1----11 ~ .._, 1-200' 201-400' DISIANCl
--- ---t----t------1'° NI ARl SI V
ELEVATION
501· 1 ~00
l>OlJ'JOO
4>01· ssoo
t.~Ol· 7SOO
H501-9SOO
UNOlR >oo 1'lUl· ilJOO
9>01 <> UP
111-------11----1----.i.-----
NE NORIH - w
A SPEC! NW
Sf
-N ll-JO'.i{, 11.z.o"X ..,,,, .J
41%+
BEACH AREA
RIVER VALLEY
LANDF ORM 1--S-L-OP_E _____ ._IX-. .i.--_,-
@ SLOPE-SIDE STREAM
BASlfol OR CIRQUE
RIDGE !OP
OIHER
CROWN 1-20% NONE
c<tr (;;·&0%~ 21·40% .._, _ I
~ I_- 401-bOO' bOl-oOO' PRIVY ® E l--------l---+---+---+--+---+---i---l--4--+--+--.i.----1-----1----1 Sc; 3 a-;:-;ao%
'- '-(o~00~oRf; -~rr r--.. .. --
'- I_, 0- ~~ y.. }') PRIVY
----+----+-------< CONDITION
'-' '- Y,-Y. Y.-FULL G)
~tH..LT£R
RESTING ?LACE
(POOP our) HOHSl CAMP/ f OMAGf
THAil CRl W
ft~HING
SClNERY
CLIMBING
Cit FILIAL
OTHER (SPlCIFY+)
'- I..., VO-IOO' ,I 101-200'
'-' I..., 201-300' ~il'MORf
LAKl , PONO
SPRING SNOW
SIMlAM
NONE.
PANORAMIC
DOMINANT --+-fl A !URE (SPlCIFv)
ENCLO~lD
CO~CAVIH
SITE
ORIGIN
DISTANCE TO WAHR
'··[<0 _l._-_rr
WATER
FORM
TYPE
Of
Ill RAllO Of
ALL DECIDUOUS
DECIDUOUS TO
1-------ir----+---+--+--+---+---l---l--4--+--+--.i.----1-----11-----1 V C~~~~E ~ R
1 DEC: 1 CONIFER
I DEC : 1 CONlf ER
@ SITE GRID MAP
fACH SQUARl
J' x J'
USl HOX TO MAKE:. A ROUGH SKL TCH OF Sill
INCLUDE SOCIAL !HAIL>. f IRE. fUNG LOCATION ANO WATER OR OlHEH IMPORlANl fEATURlS (!RlES. ROCKS. lTC.)
INDICATE NORTH
r< .. -. I ""---------------/ '\
i. )
'~ L::.k.e.. \ \
- ·--
f V HUMAN IMPACT
E
G @ 1 DEC: 2 CONtflR
E ALL CONIFER >< ___, ri-------11----~--_,..._....s..~-
101-125' 75-100' -...,,,I -...-/
0
N ~FT 151' +
IV
s
NO. LAYE'RS r , NONE OVERSTORY ( 1 , ~ __,
COVER@ ....... __..._·'--+----+---
-'-- ]+
@ PLOT SAMPLED
SOIL
TEXTURE
SANDY
LOAMY
Noll( us+
CLAYEY
i--------;i----,....,.,_........,,.......~--
0 GRAVEL 21-40% Yi-20%) __, '-' I CONTENT I ' L @) &1% + St--G_R_A_VE-L---1i--RO_U_N_D_ED.._ __ ._,_~~-
TYPE --'
@) ANGULAR
Figure 12-Front side of a completed campsite inventory edge-punched card used to monitor campsites at Olympic National Park.
45

Appendix G: The Great Smoky Mountains Areal Measurement Technique (Adapted From Bratton and Others 1978)
Little of the information on the campsite monitoring form (fig. 13) concerns impacts. Most of it provides information on environmental characteristics, attractions, developments, and the water source. The primary impact information is contained in the section on site dimensions. For each type of disturbance, measure two dimensions and then multiply these to obtain an area measurement. The disturbances measured are bare rock, mud, slope erosion, bare soil, leaflitter (vegetation removed by tram-
pling), trampled vegetation, firewood clearing, tree damage, and trash dispersal. Quantify trash dispersal, tree damage, and firewood clearing in terms of maximum distances from the center of the site. Quantify other disturbances by summing the areas of disturbed patches. Total disturbance is the maximum areal extent of human impact at the site. In addition, trash level, sanitation, and vegetation damage are rated in classes from good or no damage to bad or high damage.
It Name ----------~ Quad _____ Coordinates
en Forest type -------------------------~canopy? __ _
Understory
Site dimensions 1
Attractions: Fruit plants __ Wild flowers Big trees Balds Views Waterfalls Fishing Poaching Horse camp Tower Shelter Near cmpgrd Near viscen Major acce6s ==:::== Near road AT near Remote Private Dry Other:
Last rain ___ _ Leaf fall __ _ Observer !:>ate
2 Area
Developements: Shelter Bear fence Shelter frame Tent space Privy Fireplace Picnic tables Bear barrels Firepits Hitchracks Camp circle Sign camp Sign water Sign trail Other:
General conunents:
Slope site Aspect, site Slope above Slope below Aspect envir D below top Convexity si Convexity en Moisture
Elevation Spring stream Seep
Rating: Frequency use Carry capacity -Trash level -Firewood level Mud and dirt Sanitation Vegetation dam Placement Drainage Maintenance
Water
Lake
Erosion above Silt Mud(area) dis camp ~OS Camp is erosion
dis privy
dis animal
Suggested improvements and hazard reduction:
Site future, why? ---------------
Figure 13-Form used to monitor campsites at Great Smoky Mountains National Park.
46

Appendix H: The Bob Marshall Rapid Estimation Procedure (Adapted From Cole 1983a, 1984)
The information on one side of the form consists oflocational and environmental information (fig. 14a). The impact data are included on the other side of the form (fig. 14b). Instructions for filling out this side are as follows:
Item 19: Using the five coverage classes on the form, estimate the percent coverage of the live understory vegetation. Do not include dead vegetation, duff, trees, tree seedlings, or shrubs taller than a person. Estimate cover for the entire campsite.
With a large campsite, it may help to divide the site into equal quarters; estimate the percentage cover of each quarter and take the average. It may also help to visually cluster all vegetation into one part of the site and estimate what percentage of the site would be covered. Try to select one coverage class decisively. If you cannot, circle your best estimate and note the other coverage class it might be.
Make the same estimate of vegetation cover on a nearly unused site simiiar-except for the impact-to the campsite. The idea here is to select a site that is similar to what the campsite probably looked like before it was used. Choose a site that is similar to the campsite in terms of rockiness, slope, aspect, overstory composition and cover,
' and understory species composition. Protected plants around the base of trees or rocks can provide hints about species composition.
Item 20: Using the same five coverage classes, estimate the percentage of the campsite without either live vegetation or duff-the percentage on which mineral soil is exposed. In many cases, a thin layer of disturbed needles, leaves, or wood chips is scattered about with mineral soil showing through. Consider these areas to be exposed soil.
Make the same estimate on the comparative area. In practice it will be easiest to estimate both vegetation cover and mineral soil exposure on the campsite, select the comparative area, and make the same estimates there.
Item 21: Using the information in item 19, record the difference in vegetation cover class between campsite and comparative area. If there is no difference (for example, if both campsite and comparative area are class 4, 51-75 percent), circle rating 1. If coverage on the campsite is one class less than on the comparative area (for example, if the campsite is class 3, 26-50 percent, and the comparative area is class 4, 51-75 percent), circle 2. If the difference is greater, circle 3.
Item 22: Using the information in item 20, record the difference in mineral soil coverage class between the campsite and comparative area. In this case, ratings of 2 and 3 are given when mineral soil is one, or more than one class higher on the campsite, respectively.
Item 23: Count the total number of damaged trees on the campsite, the area visible from the campsite, and any stock holding areas. Never count the same tree on more than one site. Damaged trees include stumps that show
47
cut marks, scarred trees, and trees with nails in them. Trees with lower branches cut off for firewood are not included. (Ignore the estimate of percentage of trees; this information is not necessary.) If no trees were damaged, rate the site 1. If one to eight trees were damaged or if one to three trees were felled or had bad scars (scars larger than 1 ft2 [929 cm2]), rate the site 2. If more trees are damaged, badly scarred, or felled, rate the site 3.
Item 24: Count the number of trees with exposed roots on the same area as for tree damage. Exposure should be pronounced, extending at least 1 ft (0.3 m) from the tree trunk. It should also be the result of trampling-not the result of a root running over a rock, for example. Assign a rating of 1 (no trees with exposed roots), 2 (one to six trees), or 3 (more than six trees).
Item 25: Assign the site a rating of 1 if there are no facilities-not even a firering. A fire site is considered a ring only if the ring of stones is there; if they have been scattered, it is a fire scar (see item 26) but not a firering. If there is only one firering, primitive log seats (without sawed off ends) or both, assign the site a 2. If there is more than one flrering, or if there are any more elaborate facilities, such as constructed seats, shelves, hitchrails, corrals, toilets, and so forth, assign the site a 3. If the facilities are to be removed, rate the site as it was found and then ~ote in item 31 what actions were taken.
Item 26: Count the number of fire scars on the site, including any firerings as fire scars. Assign the site a 1 if there is only one fire scar and essentially no evident litter, stock manure, or human waste on the campsite. Assign the site a 2 if there is more than one fire scar or if litter or stock manure is evident. If litter or stock manure is "all over the place," or if there is any evident human waste, assign the site a 3.
Item 27: Social trails are the informal trails that lead from the site to water, the main trail, other campsites, or satellite sites. Discernible trails are trails that you can see but that are still mostly vegetated. Well-worn trails are mostly devegetated. Count the total number of trails, regardless of whether they are discernible or well worn. Assign the site a 1 if there is only one discernible trail and no well-worn trails. Assign a 2 if there are two or three discernible trails or one well-worn trail. Assign a 3 if there are more than three discernible trails or more than one well-worn trail.
Item 28: Estimate the square footage of the disturbed campsite and any satellite or stock holding areas. The disturbed area can usually be identified by either shorter or no vegetation in comparison to the periphery of the site. Where there is no vegetation naturally and no other evidence of disturbance to identify the edge of the site, place an N/A in the estimated area space and assign a rating of 1. This may also be necessary on lightly used sites where little vegetation loss is evident.

BOB
~t.1.RSHALL
-G
KEA
T B
EAR
-
SCA
PEG
OA
T \JILDER~ESS
CO
tfPL
EX
-
CA
}1PS
ITE
I~'ENTORY
GEN
ERA
L S
ITE
D
ES
CR
IPT
ION
(1)
SIT
E
NU
MB
ER:
(2)
UTI
1 C
OO
RD
INA
TE
S:
12
f:: .!_
2 ~
E {
__j~
!_.:
:::
N
(3)
USGSQUADRA.~GLE:
t.\f;y
,,·,
[>}/1
7
(4)
DA
TE
CO
DE
D:
( 1
(Mo
nth
) j_
j ·(
Day
) j_
'j_ E
tl (Y
ear)
(5)
(6)
CO
DED
B
Y:
EL
EV
AT
ION
: (T
o n
eare
st
10
0 ft
) _.
_')_
··_/
_~_(
__
(7)
VE
GE
TA
TIO
N:
(Cir
cle
o
ne)
1 -
Clo
sed
fo
rest
3 -
No
nfo
rest
ed
, d
en
sely
v
eg
eta
ted
~ -[:
: o;;;
-for;;
c '
...... -···--·····-·
.•-·p
...
-
4 -
No
nfo
rest
ed
, sp
ars
ely
veg
eta
ted
Do
min
ant
sp
ecie
s .
,---
-j)-
· __.-
·,,:--· _!
_,·_. ·
~...,1 .-' ,_
. -~-
Hab
itat
typ
e,
if
know
n __
.l .... ~;'.-
.'",_,_.n_
._/_,l_,· _
,._/_l
.._·...
_.£._·
_.~·"""';.
.~' 1 __
(8)
LAN
DFO
R..'1
1:
(Cir
cle
o
ne)
(10
)
(11
)
1 -
Flo
od
pla
in
( ~
_:-:
_~th
er
vall
ey
b
ott
om
3
-C
irq
ue
basi
n
4 -
Sid
eslo
pe
5 -
Rid
geto
p
(Do
in o
ffic
e)
DIS
TA
NC
E
TO
CL
OSE
ST
TR
AIL
HE
AD
:
DIS
TA
NC
E
TO
CO
NST
RU
CTE
D
TR
AIL
:
Scre
en
ing
: 1
-C
om
ple
te
(cir
cle
o
ne}
;;-
·-·-
·--
··-..
l3___::-_P_a~~ial
3 -
Non
e
6 -O
th
er-------
(mil
es)
__
__
1_c_
( __
__
(fe
et)
...,.
,.... ..
. __ ··--..
Main
tain
ed
: (1
-
Yes
1
(cir
cle
o
ne)
2 -
No
DIS
TA
NC
E
TO
WA
TER
: _
__
__
_
.)._
{_l_
· __
__
__
(fed
)
--.
Ty
pe:/
l
-R
iver/
cre
ek
.,.
\.. ..•
___
··-·
----
-3
-S
pri
ng
2 -
Lak
e 4
-O
thl.
·r
(12
) D
IST
AN
CE
TO
C
LO
SEST
C
A!i
PS
ITE
:
Scre
en
ing
: 1
-C
om
ple
te
(cir
cle
o
ne) ~~~~~~~~i ~.
3
-N
one
(Do
in o
ffic
e)
(13
) ~UMBER
OF
OTH
ER
CA
HP
SIT
ES
W
ITH
IN
1/4
M
ILE
:
(14
) M
AX
IMU
M
PAR
TY
SIZ
E
AC
CO
x.'-I
OD
ATE
D:
(Cir
cle
o
ne)
1 1
-2
(f=~~!~--io.1
s -
mo
re
than
15
2 3
-6
4 -
11
-15
(15
) T
YPE
O
F U
SE
: (C
ircle
as
man
y as
ap
ply
)
.--
•c•
~ -
~--~-~
~---
3 -
Riv
er
(~_:
_s-~
~,~
4 -
Ou
tfit
ter
(16
) C
LO
SEST
FI
REW
OO
D
SOU
RC
E:
(Cir
cle
o
ne)
-O
ne-s
ite
3 -
10
0-3
00
fe
et
5 ->
1/4
m
ile
2 -
< 10
0 fe
et
~-2~~ _
f~--
--~!
.~~~
~~ /
(17
) C
LO
SEST
FO
RA
GE
SU
PP
LY
: (C
ircle
o
ne)
-O
n-s
ite
'-~ --=--~~~}~~ .
.!~.:_
t_ 5
->1
/4
mil
e
2 -
< 10
0
feet
4 -
300
ft-1
/4
mil
e
(HI)
F
AC
ILIT
IES
: P
rese
nt
)(
Ah
sen
t (1
f p
resen
t,
wri
te
nu
mb
er
of
each
ty
pe
in
bla
nk
.)
l -
Fir
e ri
ng
;;_
6
-Ii
i tch
rail
i
2 -
Pri
mit
ive -
seat'
_±
__
7
-C
orr
al
--
3 -
Co
nst
ructe
d
seat
8 -
To
ilet--
4 -Table/shelf/coun~
9 O
ther
5 -
Mea
t ra
ck
Figu
re 1
4-T
he
fron
t (a
) an
d re
ar (
b) s
ides
of
a co
mpl
eted
for
m u
sed
to i
nven
tory
cam
psite
s in
the
Bob
M
arsh
all
Wild
erne
ss c
ompl
ex.
a

IMPA
CT
EVA
LUA
TIO
N
ON
CA
MPS
ITE
ON
UN
USE
D
COM
PARA
TIV
E A
REA
(19
) V
EGET
ATI
ON
C
OV
ER:
,,.-
---·
·'---
.. -,_
(B
e su
re
to
com
par
e si
mil
ar
are
as,
sa
me
specie
s,
slo
pe,
rock
iness
, an
d ca
no
py
co
ver
)
3 -
26-5
0%
4 -
51-7
5%
5 -
76-1
00%
1
-0-
5%
3 -
26-5
0%
( 5
-76
-100
%
2 -
6-25
%
4 -
51-7
5%
'"---...
----
·--·
.. ....__
(20
) M
INER
AL
SOIL
EX
POSU
RE:
(P
erce
nt
of
are
a
that
is
bar
e m
iner
al
so
il)
1 -
0-5%
3
-26
-50%
5
-76
-100
%
C}.
-
0-5%
3
-26
-50%
5
-76
-100
%
(21
)
(22
)
(23
)
(24
)
(25
)
(26
)
(27
)
(28
)
(29
)
'-r...
-6-.
:25f
) 4
-s1
-75%
--
----
----
VEG
ETA
TIO
N
LO
SS:
MIN
ERA
L SO
IL
INC
REA
SE:
TREE
D
AM
AG
E:
No.
o
f tr
ees
sca
rred
o
r fe
lled
1
i'
l (n
o d
iffe
ren
ce
in
cov
erag
e)
. (N
o d
iffe
ren
ce
i in
co
ver
age)
(No
mor
e th
an
bro
ken
lo
wer
b
ran
ches
) %
of
trees
scarr
ed
o
r fe
lled
-;-
0 (
est
.)'
ROOT
EX
POSU
RE:
N
o.
of
trees
wit
h
roo
ts
exp
ose
d -~
%
of
trees
wit
h
roo
ts
exp
ose
d
2.;;;.
(est.
)
DEV
ELO
PMEX
T:
CLE
AN
LIN
ESS:
N
o.
of
fire
sc
ars
:2
SOC
IAL
TR
AIL
S: 4
No.
o
f tr
ail
s _
_ _
CAM
P A
REA
E
stim
ated
are
a
I (
£.'C
(f
t 2
)
BARR
EN
CORE
CA.~P
ARE
A:
2 E
stim
ated
area~(ft
)
l (N
one)
! .-
--·--
('CN
one)
'~ /
....__ __
__ -
(No
mor
e th
an
scatt
ere
d
ch
arc
oal
from
1
fire
ri
ng
)
(No
mor
e th
an
1 d
iscern
ible
tr
ail
)
( <
500
ft
2
( (
50 ft
2
(30
) PH
OTO
RE
CORD
_._,
_· _
-_1
'-_
··-------
2 -
6-25
%
4 -
51-7
5%
Rat
ing
(C
ircle
o
ne
cate
go
ry)
2 {
Dif
fere
nce
on
e co
ver
age
cla
ss
/-<D
if fe~
~nce
-two
or
mor~',
l__
__~~.~
~:.:~e
-~=a~
s-~-~~
__ ,.
(Dif
fere
nce
two
or
mor
e co
ver
age
cla
sses)
(1-8
sc
arr
ed
tr
ees,
or/
( >
8
scarr
ed
tr
ees,
o
r >3
i~tl
~:~l
y sc
arr
ed
o
r ~~~---~~~~~~~-~= -~
e-~:_e
d)
(1
fire
ri
ng
w
ith
or
wit
ho
ut
pri
mit
ive
log
se
at)
--(R
emna
nts
of
>"1..
.._,,
fire
ri
ng
, so
me
litt
er o
r m
anu
re)
(2-3
d
iscern
ible
, m
ax.
1 w
ell-
wo
rn
, /CsO·~=~~OOf;z·), .
'----
-··-
-·--
----
--·-
( 50
-50
0 ft
2 )
( >
6 tr
ees
wit
h ro
ots
ex
po
sed
)
() 1
fi
re
rin
g
or
oth
er
maj
or
dev
elo
pm
ent)
(Hum
an
was
te,
muc
h li
tter o
r m
anur
e)
l () 3
d
iscern
ible
or
mor
e'',
"-~ ha
~~-w
_: 11_-_:''?~L---~/
(>
2000
ft
2 )
/. -~----·--z--
(__<
) 50
0 ft
)
(31
) CO
MM
ENTS
: (D
eta
ils
abo
ut
locati
on
o
f sit
e,
imra
cts
, m
anag
emen
t su
gg
est
ion
s,
etc
.)
''I
/1ct{
v
/'{
J 7L
: I (
32
) IM
PAC
T IN
DEX
Fig
ure
14
(C
on
.)
Calc
ula
tio
n o
f im
pac
t in
dex
(d
o in
o
ffic
e)
;,.~.
.\
-:~
c
_ -/
) ;<
] _
(_
·'· 3
('.
_7
>; 2.
(.:
.
, .. ~ -:
'" 2
}
2-,1
• .A.
L.
t
+ _'.(
2
--<;:
.- .....
-,
0 .,
i..
x )
b
Visualize the site as a circle, a rectangle, or some combination of these geometric figures. Pace off the appropriate dimensions. Calculate area and assign a rating of 1 ( <500 ft2 [ <46 m2]), 2 (500-2,000 ft2 [ 46-186 m2]), or 3 (>2,000 ft2 [>186 m2]).
Item 29: Using geometric areas and pacing, estimate the area without any vegetation. Bare area may or may not be covered with duff. Areas with scattered vegetation are not counted as bare area. Lump together in one measure all bare areas on the campsite, including the area around the fire, as well as any bare tent areas, if applicable. If the bare area extends off the campsite into neighboring undisturbed areas-in other words, if the area is devoid of vegetation naturally-write NIA in the estimated area space and assign a rating of 1. If ~he bare area is less than 50 ft2 (5 m2), 50-500 ft2 (5-46 m2), or more than 500 ft2 (>46 m2), assign ratings of 1, 2, or 3, respectively.
50
Item 32: The impact index is either the sum of the ratings of each of these parameters or the sum of weighted ratings. The weights assigned in the Bob Marshall were as follows: vegetation loss (2), mineral soil increase (3), tree damage (2), root exposure (3), development (1), cleanliness (1), social trails (2), camp area (4), and barren core camp area (2). Individual ratings are multiplied by these weights and then these products are summed to obtain the impact index. In the Bob Marshall this index could vary from 20 (least impact) to 60 (most impact). In figure 14b, the first column of values, under "calculation of impact index" is the weights; the second column consists of the ratings. Other weighting values have been used to reflect different opinions about the most critical types of impact. If you do not use weights, you are implicitly stating that each of these types of impact is equal in importance.

Appendix I: The Canyonlands Rapid Estimation Procedure (Adapted From Kitchell and Connor 1984)
This procedure is similar in many ways to the procedure used in the Bob Marshall; however, more information is collected and impact parameters have been adapted to desert environments. They also use slightly different forms to monitor sites used primarily by three different types of use: backpackers, river floaters, and people on four-wheel drive. Information on site characteristics is collected; the site is quickly mapped; photopoints are established; and an impact rating form is filled out.
The form (fig. 15) provides ratings for 24 parameters. The ratings include weights; some vary from 1.5 to 6,
51
while others vary from 0.5 to 2. These ratings are summed. Then the condition of each site is considered to be excellent if this sum is between 25 and 37. It is considered good, fair, or poor if the sum is 38 to 62, 63 to 87, or 88 to 100, respectively.
Many of the ratings involve comparisons between the campsite and an adjacent undisturbed area, as described for the Bob Marshall procedure (appendix H). Most others should be self-explanatory from the form (fig. 15), . although many definitions need to be agreed on by different field workers. For example, for tree and shrub damage, how much damage must occur for it to be counted?

1. VEGETATION COVER
a. %cover <10% reduction when 1.5 10-30% reduction. 3 30-60% reduction. compared with adjacent undisturbed area.
b. Composition No exotic or disturbance 1 10-20% of vegetation 2 20-50% exotics and/or species present. composed of exotics/ disturbance species.
disturbance species. c. Distribution Vegetation evenly dis- 0.5 Faint appearance of 1 Up to 30% of vegetation
tributed throughout isolated "islands" of built up around shrubs site. vegetation. and "islands" of
vegetation.
2. SOIL DISTURBANCE
a. Cryptogamic No disturbance; still 1 <30% reduction of crust 2 30-60% reduction of crust intact in appropriate when compared to adja- crust.
habitat. cent/undisturbed area. b. Compaction/ None-apparent. 1 <30% of soil in site 2 30-60% of soil shows
loosening/ shpws compaction (fine compaction or loosening; erosion soils) or loosening signs of erosion or
(coarse soils). gullying in 2 locations.
c. Excavations None apparent. 1 1 or 2 small trenches .2 2-4 excavations or and trenches or excavations. trenches; a few may
show slight erosion.
3. LITTER
a.% cover <10% disturbed. 1 10-35% reduction in con- 2 35-70% reduction com-trast to adjacent/undis- pared to adjacent/ turbed areas undisturbed areas
b. Distribution Evenly distributed. 1 50% of liner around 2 50-80% around edge and edge of site and stable stable objects. objects
c. Condition No obvious signs of 1 Slight appearance of 2 <60% appears crushed or broken and crushed crushed and broken broken liner. liner.
4. SIDE TRAILS
a. Number Only 1 present: not very 1 2 distinct trails from 2 3 distinct trails from obvious from main trail main trail to site or main trail to site or to or through site; no between attraction site between attraction site; spur trails, and only a (arch site or spring); 3 side trails or spurs few isolated footprints no spurs; few isolated developing; footprints present. footprints. apparent.
b. Width Average width <12". 1 Average width of 1 trail 2 2 trails wider than 12". >12".
c. Depth Trail at same level as 1 1 trail-wearing below 2 At least 2 trails deeper adjacent area. level of adjacent area. than adjacent ground
level.
5. SHRUB DAMAGE
a. %damaged None show any damage. 1.5 <10% of shrubs show 3 10-30% of shrubs show reduced vigor damage (such as broken damage; 1 or 2 show
limbs, crushed reduced vigor as a appearance). result of damage.
b. Root exposure No roots exposed. 1.5 Exposed roots on 1 3 Exposed roots on 2 shrub. shrubs.
6. TREE DAMAGE
a. Broken limbs, No damage; or no trees 1 <10% of trees have 2 10-35% of trees have gashes, present. broken limbs, gashes, broken limbs, gashes, damage or other damage. or other damage.
b. Root exposure No roots exposed; or 1 1 root exposed in site. 2 2 roots exposed in site. no trees present.
Figure 15-The impact rating form used on backpacker campsites at Canyonlands National Park. For each parameter, circle the number to the right of the appropriate category and then sum all of these ratings.
52
4.5 >60% reduction. 6
3 >50% exotics and 4 disturbance species.
1.5 >30% of vegetation built 2 up around shrubs and "islands" of vegetation.
3 >60% reduction of crust. 4
3 >60% of soil shows com- 4 paction or loosening; signs of erosion in 2 locations.
3 >4 excavations or 4 trenches; some show erosion and gullying.
3 >70% reduction com- 4 pared to adjacent undisturbed areas.
3 >80% of liner around 4 edges and stable objects.
3 >60% appears crushed 4 or broken.
3 3 distinct trails from 4 trail to site; 3 side or spur trails develop-ing; trails have begun to merge; numerous foot-prints in and around trail and site.
3 >2 trails wider than 12"; 4 trails merging.
3 All trails deeper than 4 adjacent ground level.
4.5 >30% of shrubs show 6 damage; 2 show reduced vigor; dead or dying shrubs present.
4.5 Exposed roots on 3 6 shrubs.
3 >35% of trees have 4 broken limbs, gashes, or other damage.
3 3 or more roots exposed 4 in site.
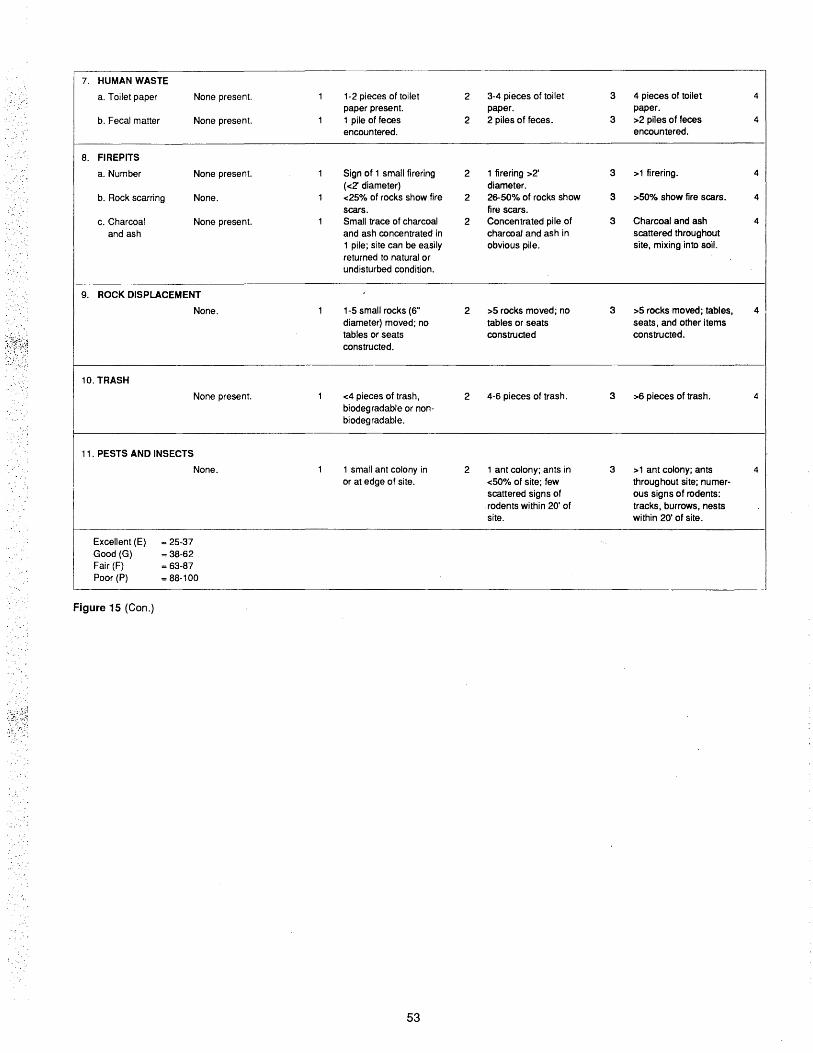
7. HUMAN WASTE
a. Toilet paper None present. 1 1-2 pieces of toilet 2 3-4 pieces of toilet 3 4 pieces of toilet 4 paper present. paper. paper.
b. Fecal matter None present. 1 1 pile of feces 2 2 piles of feces. 3 >2 piles of feces 4 encountered. encountered.
8. FIREPITS
a. Number None present. 1 Sign of 1 small firering 2 1 firering >2' 3 >1 firering. 4 ( <2' diameter) diameter.
b. Rock scarring None. 1 <25% of rocks show fire 2 26-50% of rocks show 3 >50% show fire scars. 4 scars. fire scars.
c. Charcoal None present. 1 Small trace of charcoal 2 Concentrated pile of 3 Charcoal and ash 4 and ash and ash concentrated in charcoal and ash in scattered throughout
1 pile; site can be easily obvious pile. site, mixing into soil. returned to natural or undisturbed condition.
9. ROCK DISPLACEMENT
None. 1 1-5 small rocks (6" 2 >5 rocks moved; no 3 >5 rocks moved; tables, 4 diameter) moved; no tables or seats seats, and other items tables or seats constructed constructed. constructed.
10. TRASH
None present. 1 <4 pieces of trash, 2 4-6 pieces of trash. 3 >6 pieces of trash. 4 biodegradable or non-biodegradable.
11 . PESTS AND INSECTS
None. 1 1 small ant colony in 2 1 ant colony; ants in 3 > 1 ant colony; ants 4 or at edge of site. <50% of site; few throughout site; numer-
scattered signs of ous signs of rodents: rodents within 20' of tracks, burrows, nests site. within 20' of site.
Excellent (E) = 25-37 Good (G) = 38-62 Fair (F) = 63-87 Poor (P) = 88-100
Figure 15 (Con.)
53

Appendix J: The Delaware Water Gap Rapid Estimation Procedure
This procedure was initially quite similar to the Bob Marshall procedure. With practice, it evo1ved into a procedure that collects only interval leve1 data and is now most similar to the Eagle Cap method of measurements
on permanent samp1ing units. Figure 16 shows the two pages of a completed fie1d form. Impact parameters requiring exp1anation are as follows:
CAMPSITE INVENTORY AND TMPACT ASSES2MENT FIELn FnPM
1) Site Number:
2) Site Name: l=Calestini 2=Minisink 3=Namanock :;;.__ 4=Sandyston 5=Hornbeck 6=Shapnack 7=Buck Bar S=Tom's Creek 9=Valley View lO=Peter's ll=Quinn 12=Decker's 13=Sambo 14=Freeman 15=Hamilton 16=Depew 17=Poxono 18=Hialeah 19=Schellenberger 20=Unnamed Site
3) Site Designation: l=designated 2=undesignated
4) River Segment: l=N-Milford 2=Milford-Dingmans 3=Ding.-Bushkill 4=Bush.-Smithfield 5=Smith.-S
5) Site Location: l=island 2=PA shore 3=NJ shore
6) Substrate of Landing Area: l=bedrock 2=cobble 3=sand 4=soil
7) Length of Shoreline Disturbance (m):
8) Distance to River (m):
9) No. of Other Sites Visible from Campsite:
I
I
I
,;;l..
I
3 -J_ __ 3
0
*********** Do Campsite Map Before Proceeding ***********
10) No. of SxlO ft. Tent Pads:
11) Vegetative Ground Cover Onsite: 1=0-25% 2=26-50% 3=51-75% 4=76-95% 5=96-100%
12) Vegetative Ground Cover Offsite: l=0-25% 2=26-50% 3=51-75% 4=76-95% 5=96-100%
13) Type of Ground Cover Onsite: l=grass 2=herbaceous 3=ferns 4=moss
14) Type of Ground Cover Offsite: l=grass 2=herbaceous 3=ferns 4=moss
15) Tree Canopy Cover Over Site: l=0-25% 2=26-50% 3=51-75% 4=76-95% ~=96-100%
16) No. of Trees Within and On Site Boundaries:
17) No. of Trees With Moderate-Severe Damage:
18) No. of Tree Stumps Within and On Site Boundaries:
19) Total No. of Trails:
20) Type of Fire Site: l=stone 2=cement 3=steel 4=fire scar
21) No. of Fire Sites:
s
I
s
I
4
I 4 4 I
6
I
22) Toilet: l=clivus 2=pit toilet 3=no toilet present '3
Figure 16-The front (a) and rear (b) sides of a completed form used to inventory campsites at Delaware Water Gap National Recreation Area.
54
a

~4) No. of Human Waste Sites:
25) Date (Day/Mo/Yr):
Camosite Ma.p J (< Mi\fJe. (101 CM
f S111tlUe. I I
1 "f.1 .< 3.1 ~ I
llf-.(.
l'fl.
:Z:?O
I S~-f~llife..' \ 1
M JI.. z.~= 1
, 13. I ,,
lY]
\ ll7
rd IV\tlple.1
3 '!>t~~
(3c.-0 '"' dbl-.1 b• 2 "'I 2oZ .2:).2"
Compass Bearings:
Jb\,1
IG:..5" ""; 325") 0
110
.;z
- ..!..; _!_ _J_/ _!!__ 8
ri re3 nde u.s t J -h:ir c~n+er po~nt
111
0 22 45 67 90 112 135 157 180 202 225 247 270 292 315 337 x: 61 2: 6. 0: 6. o : t,. 1 : 6,5: Lf.B : 3. 1 : f. o : 1/-, o : 4. 2 : f. 5': 6 .o : 7 3 : e. 5: 8 .t : 7, o
o: 11.0: 10.1: 1-1.s-: 1'/.o: 1~.;: 1;<.o: tfJ./): '!.'/: g ~ : e.'J: 10. 7: 1J.5": 1t.o: n.o :11s: 16.S-
26) Devegetated (X) Area: (sq.m.) / 27) Campsite (0) Area (computed in DBASE) + Satellite Area 2.2.2__
- Island Area 101 = (sq.m.)
28) Coded By (Names): I
29) ";;1qi11' h'uw-t Comments: I I I
roof e.vposure_
Figure 16 (Con.)
55
b

7. Length of Shoreline Disturbance: Distance (to the nearest meter) of shoreline where vegetation is absent or obviously disturbed by trampling. This judgment must be made by comparing the site to undisturbed shoreline. If the landing area is naturally barren (bedrock, for example), simply enter 1 m for the path width.
17. Number of Trees With Moderate-Severe Damage: A count of the number of trees (> 1 inch [2.5 cm] d.b.h.) within or on campsite boundaries with large branches cut or broken off and/or large or extensive knife or ax scars. Include trees within undisturbed "islands" and disturbed "satellite" areas. Multiple tree stems that are joined at the base at or above ground level should be counted as one tree when assessing damage on any of its stems. If a multiple-stemmed tree has one of its stems cut, this would be assessed as tree damage, not as a stump. Do not count tree stumps as tree damage.
18. Number of Tree Stumps: A count of the total number of tree stumps (>1 inch [2.5 cm] diameter) within or on campsite boundaries. Due to the difficulty of differentiating stumps cut by humans from those created naturally, count all stumps regardless of origin.
23. Number of Garbage Bags of Litter Present: An estimate of amount oflitter within the campsite and 100 ft (30 m) from the campsite boundaries, expressed as the number of 40-gallon garbage bags that could be filled with litter and tied at top. Use decimals to indicate fractions of a bag. Use zero ifthe site has only a handful of small items.
24. Number of Human Waste Sites: A count of the number of places with evident human waste and/or toilet paper, within 100 ft (30 m) of campsite boundaries.
26. DevegetatedArea: Area (in square meters) of the devegetated central core of the campsite. Calculate in office, usipg procedures described in section on campsite map.
56
27. Campsite Area: Area (in square meters) of any ground showing clear evidence of human disturbance. For procedures, refer to the following section.
Campsite Map: Draw a map of the campsite by connecting points on campsite boundaries along 16 transects radiating from a center point. Begin by locating a center point and referencing it to three permanent features, usually trees. Standing at the center point, consecutively establish 16 transects, radiating from the center point, along the following bearings (not corrected for declination): 0, 22, 45, 67, 90, 112, 135, 157, 180, 202, 225, 247, 270, 292, 315, and 337 degrees. Measure the distance along each transect to the first significant amount of vegetation, defined as the first location where a 0.3- by 0.3-ft (1- by 1-m) quadrat centered on the transect line would have more than 25 percent vegetative cover. Measure from the center point to the closest edge of this imaginary quadrat and record this distance for the appropriate bearing in the row labeled "X." Also place an "X" on the map at the measured distance (map intervals are equal to 1 m each). These will define the devegetated area, which will be calculated in the office, using basic trigonometry. At the same time, measure the distance along each transect to the campsite boundary, indicated by a pronounced change in vegetation cover, height or composition, or in surface litter. Note this distance in the row labeled "O" and place an "O" on the map. These will define the main campsite area, which will be calculated in the office using basic trigonometry. Finally, estimate the area of untrampled "islands" of vegetation within campsite boundaries (to be subtracted from the total campsite area) and the area of any disturbed "satellite" areas outside campsite boundaries (to be added to the total campsite area). The size of these areas can be estimated by superimposing an appropriate geometric figure over the area and taking the requisite linear measurements.

Appendix K: The Hardware and Software Used to Collect Data at Yosemite (Source: Sydoriak in press)
Hardware-The HP71B microcomputer weighs only 12 oz (340 g) and runs on four AAA batteries. With addition of an HP82162A thermal printer for hard copies, and the HP82401A HP-IL interface, which facilitates communication between the two, the package weighs less than 3 lb (1.4 kg). The computer is small-1 inch (2.5 cm) by 4 inches (10 cm) by 8 inches (20 cm)-making it very easy to transport.
The HP71B comes with only 16K RAM (random access memory). The risk of memory loss is significant in the unadorned HP71B. Therefore, two 64K RAM memory modules from Firmware, Inc., complete with their own battery backup, were added. These retain their memory even when removed from the computer. When one becomes full, the second can be installed in seconds. Programs and data are stored in the module in case of memory loss.
An HP82161A digital cassette drive is used to download data from the memory module to tape at the end of each collection period. It protects data and program files from accidental memory loss.
The cassettes are unloaded to an IBM-compatible personal computer via an HP821643A RS-232-C interface. Programs on the personal computer check the data for errors not detectable in the field and prepare the data for analyses.
Although watertight cases are available, the cost and weight are excessive. Heavy-duty Ziploc bags, though not waterproof due to the need to run cables to the printer, keep dust and rain out, and permit keypunching. The computer and printer are worn around the waist in a customized carrying pouch. This arrangement leaves the hands free for keypunching.
Software-The HP71B computer has a powerful set of BASIC functions. Customized data collection programs were developed to be as automatic as possible so that untrained individuals could learn to work with them easily. As an added protection, a data entry and troubleshooting guide is carried with the HP71B.
57
On power-up, a menu appears for the three main procedures: trails data input, campsite data input, or storage to cassette. After the operator indicates the desired program, it is automatically loaded. The most recent data are displayed to aid in determining where the operator left off.
As each data field is entered, the program advances to the next required field. Cursor keys allow access to any field in the current campsite or trail segment data group. Unfortunately, due to the absence of an editor (takes up too much memory), previous data groups are not accessible, and corrections must be recorded on paper and reentered on the office personal computer.
Each data item is checked for errors upon entry. Battery power is checked after each entry. When a low battery is detected, the anunciator signal is activated and the machine locks up until new batteries are installed. According to Hewlett-Packard, a low-battery signal still allows up to 15 minutes of program time. The use of a low-power state command, as in the programs, extends battery time.
When a new campsite is encountered, the previous data are stored as text in a sequential file and variables are cleared for the new data set. Other options suspend program operation indefinitely to permit battery replacement or to interrupt the carrip program to run the trails program. Total program, lex file, and associated file bytes needed for the inventory program are about 15K. Data are stored in the 64K memory module. Only 32K at a time are accessible to a file, so checks have to be made frequently to determine when a 32K file partition is becoming filled. Firmware, Inc., states that this limitation may soon be overcome.


Cole, David N. 1989. Wilderness campsite monitoring methods: a sourcebook. Gen. Tech. Rep. INT-259. Ogden, UT: U.S. Department of Agriculture, Forest Service, lntermountain Research Station. 57 p.
Summarizes information on techniques available for monitoring the condition of campsites, particularly those in wilderness. A variety of techniques are described and evaluated; sources of information are also listed. Problems with existing monitoring systems and places where refinement of technique is required are highlighted.
KEYWORDS: wilderness management, campsite management, camping impacts, campsite condition, wildland ecology

l INTERMOUNTAIN RESEARCH STATION
The lntermountain Research Station provides scientific knowledge and technology to improve management, protection, and use of the forests and rangelands of the lntermountain West. Research is designed to meet the needs of National Forest managers, Federal and State agencies, industry, academic institutions, public and private organizations, and individuals. Results of research are made available through publications, symposia, workshops, training sessions, and personal contacts.
The lntermountain Research Station territory includes Montana, Idaho, Utah, Nevada, and western Wyoming. Eighty-five percent of the lands in the Station area, about 231 million acres, are classified as forest or rangeland. They include grasslands, deserts, shrublands, alpine areas, and forests. They provide fiber for forest industries, minerals and fossil fuels for energy and industrial development, water for domestic and industrial consumption, forage for livestock and wildlife, and recreation opportunities for millions of visitors.
Several Station units conduct research in additional western States, or have missions that are national or international in scope.
Station laboratories are located in:
Boise, Idaho
Bozeman, Montana (in cooperation with Montana State University)
Logan, Utah (in cooperation with Utah State University)
Missoula, Montana (in cooperation with the University of Montana)
Moscow, Idaho (in cooperation with the University of Idaho)
Ogden, Utah
Provo, Utah (in cooperation with Brigham Young University)
Reno, Nevada (in cooperation with the University of Nevada)
USDA policy prohibits discrimination because of race, color, national origin, sex, age, religion, or handicapping condition. Any person who believes he or she has been discriminated against in any USDA-related activity should immediately contact the Secretary of Agriculture, Washington, DC 20250.