

Robert McFarlane EVP & Chief Financial Officer Toronto September 11, 2003.
55
Robert McFarlane EVP & Chief Financial Officer Toronto September 11, 2003
-
Upload
dustin-owen -
Category
Documents
-
view
216 -
download
0
Transcript of Robert McFarlane EVP & Chief Financial Officer Toronto September 11, 2003.

Robert McFarlaneEVP & Chief Financial Officer
TorontoSeptember 11, 2003
2
This presentation and answers to questions contain forward-looking statements about expected future events and financial and operating results that are subject to risks and uncertainties. TELUS’ actual results, performance, or achievement could differ materially from those expressed or implied by such statements. For additional information on potential risk factors, see TELUS’ Annual Information Form, and other filings with securities commissions in Canada and the United States.
TELUS disclaims any intention or obligation to update or revise any forward-looking statements, whether as a result of new information, future events or otherwise.
All dollars in C$ unless otherwise specified.
forward-looking statement
3
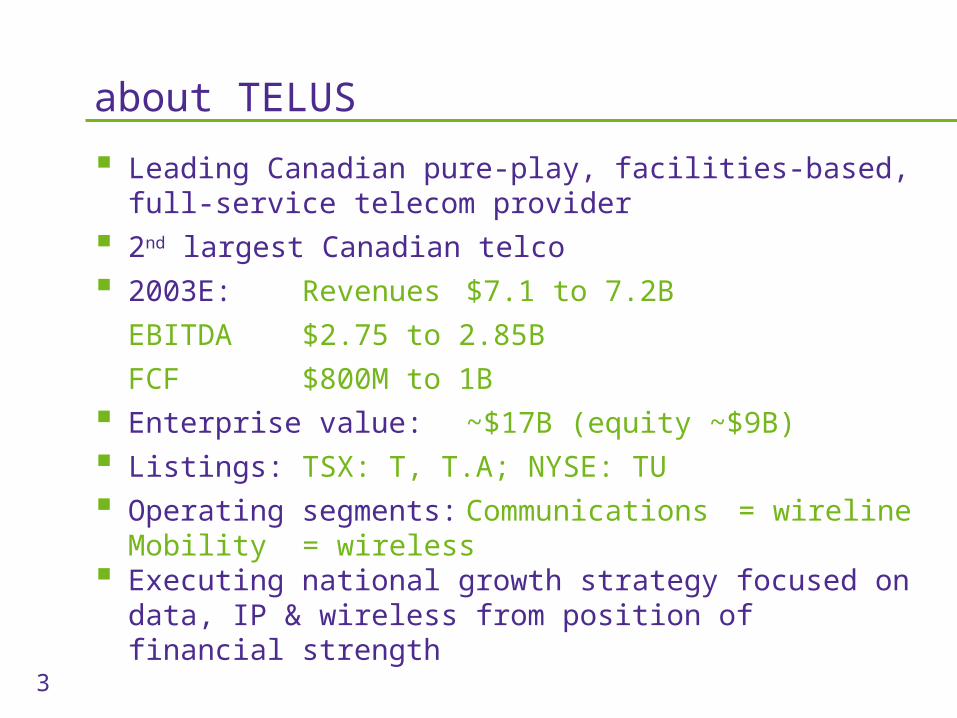
about TELUS
Leading Canadian pure-play, facilities-based, full-service telecom provider
2nd largest Canadian telco
2003E: Revenues $7.1 to 7.2B
EBITDA $2.75 to 2.85B
FCF $800M to 1B
Enterprise value: ~$17B (equity ~$9B)
Listings: TSX: T, T.A; NYSE: TU
Operating segments: Communications = wirelineMobility = wireless
Executing national growth strategy focused on data, IP & wireless from position of financial strength
4
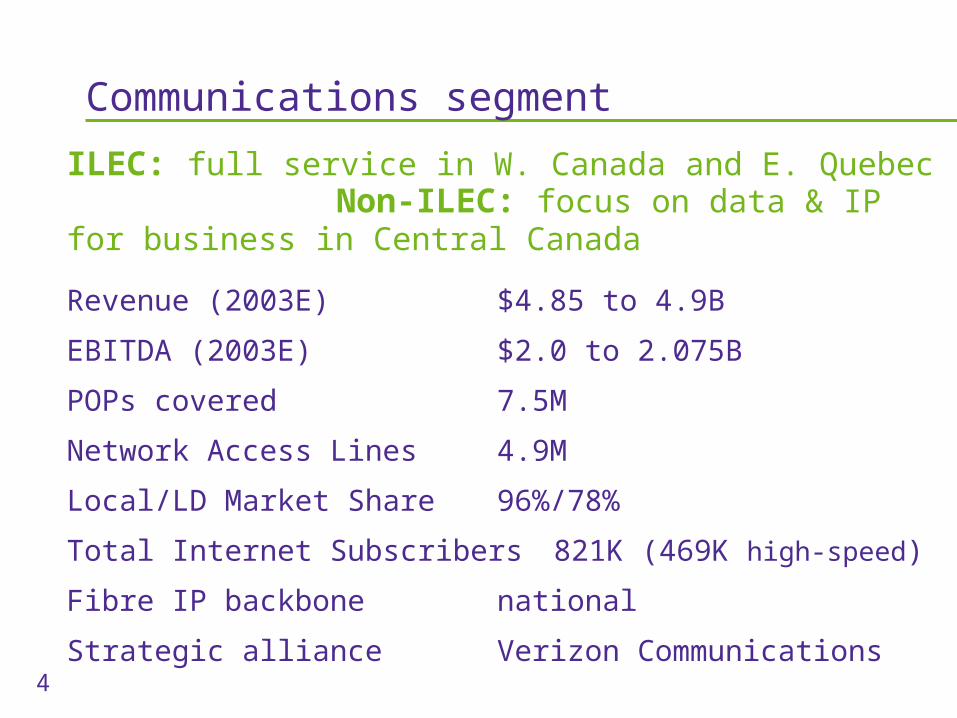
Communications segment
ILEC: full service in W. Canada and E. Quebec Non-ILEC: focus on data & IP for business in Central Canada
Revenue (2003E) $4.85 to 4.9B
EBITDA (2003E) $2.0 to 2.075B
POPs covered 7.5M
Network Access Lines 4.9M
Local/LD Market Share 96%/78%
Total Internet Subscribers 821K (469K high-speed)
Fibre IP backbone national
Strategic alliance Verizon Communications
5
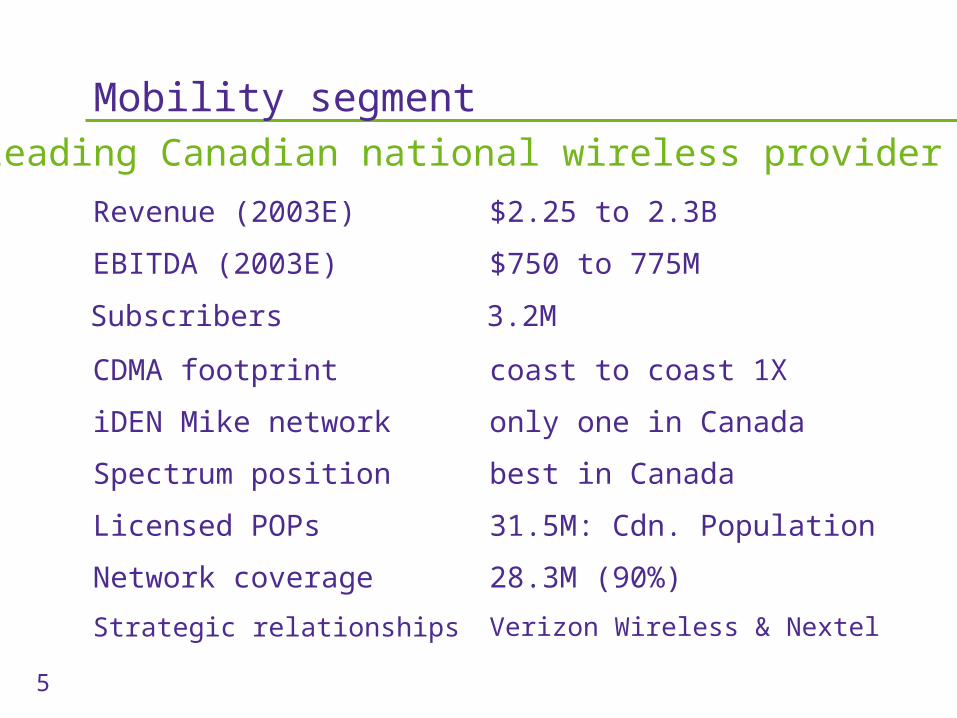
Mobility segment
31.5M: Cdn. PopulationLicensed POPs
28.3M (90%)Network coverage
Verizon Wireless & NextelStrategic relationships
best in CanadaSpectrum position
only one in CanadaiDEN Mike network
coast to coast 1XCDMA footprint
$750 to 775MEBITDA (2003E)
$2.25 to 2.3BRevenue (2003E)
3.2MSubscribers
Leading Canadian national wireless provider
6
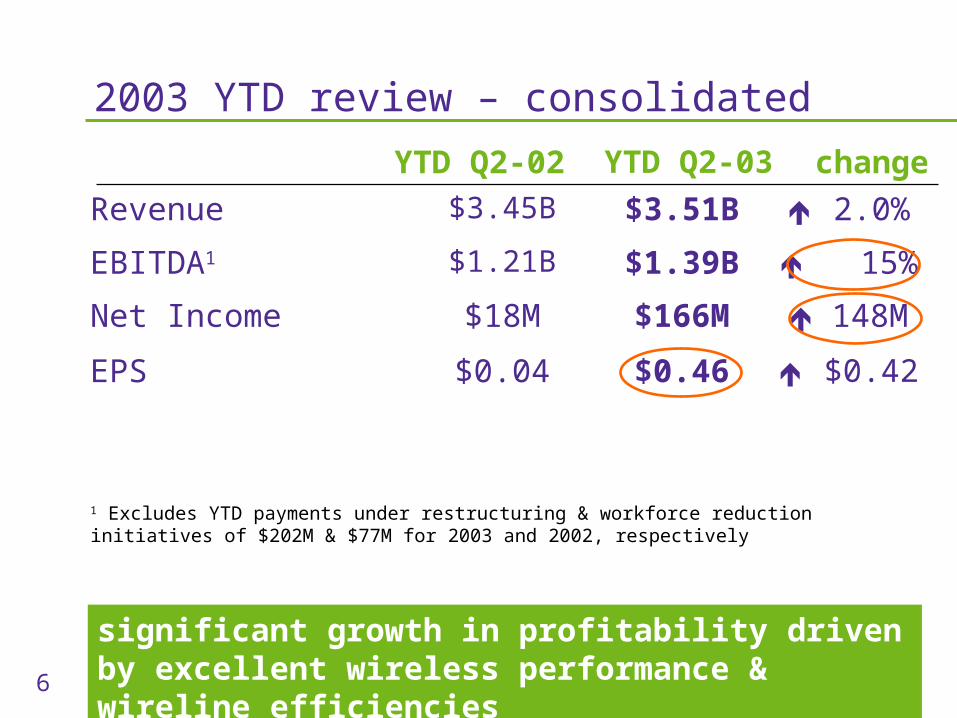
2003 YTD review – consolidated
significant growth in profitability driven by excellent wireless performance & wireline efficiencies
1 Excludes YTD payments under restructuring & workforce reduction initiatives of $202M & $77M for 2003 and 2002, respectively
148M$166M$18MNet Income
$0.42
$0.46$0.04EPS
2.0%$3.51B$3.45BRevenue
15%$1.39B$1.21BEBITDA1
YTD Q2-03 changeYTD Q2-02
7
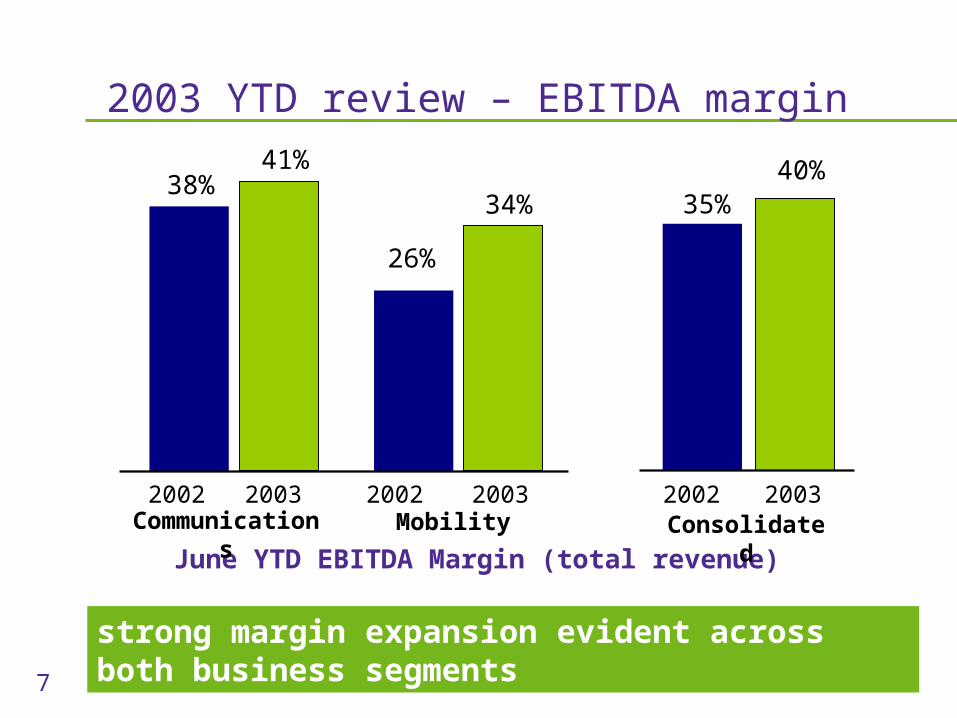
strong margin expansion evident across both business segments
2003 YTD review – EBITDA margin
38%
26%
34%
41% 40%35%
June YTD EBITDA Margin (total revenue)
Communications ConsolidatedMobility2002 2003 2002 2003 2002 2003
8
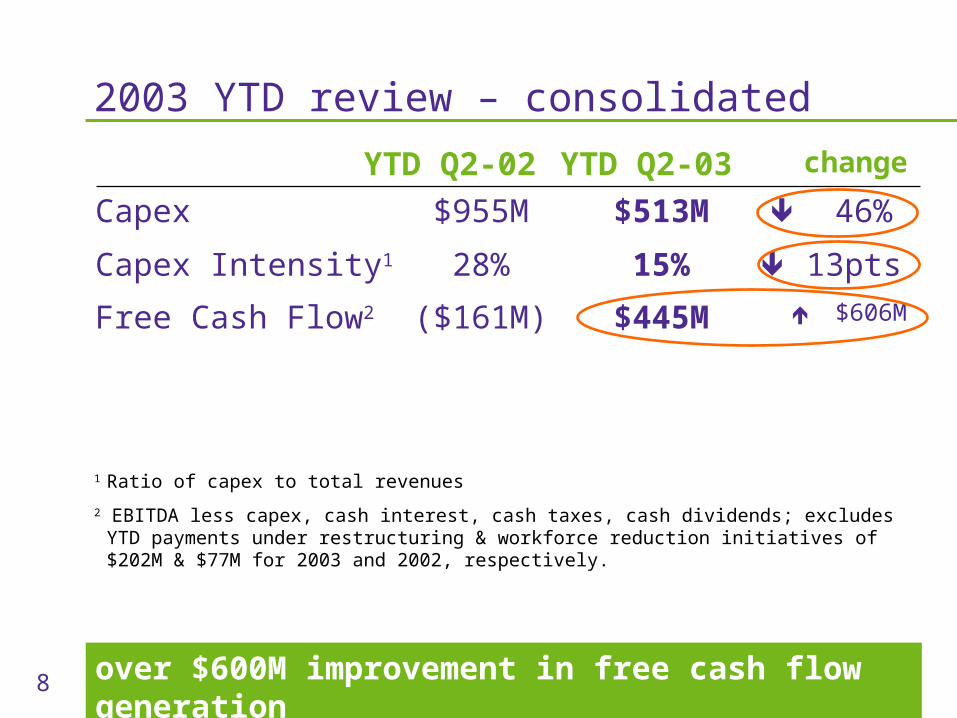
2003 YTD review – consolidated
1 Ratio of capex to total revenues
2 EBITDA less capex, cash interest, cash taxes, cash dividends; excludes YTD payments under restructuring & workforce reduction initiatives of $202M & $77M for 2003 and 2002, respectively.
over $600M improvement in free cash flow generation
$606M$445M($161M)Free Cash Flow2
13pts15%28%Capex Intensity1
46%$513M$955MCapex
YTD Q2-03 changeYTD Q2-02
9
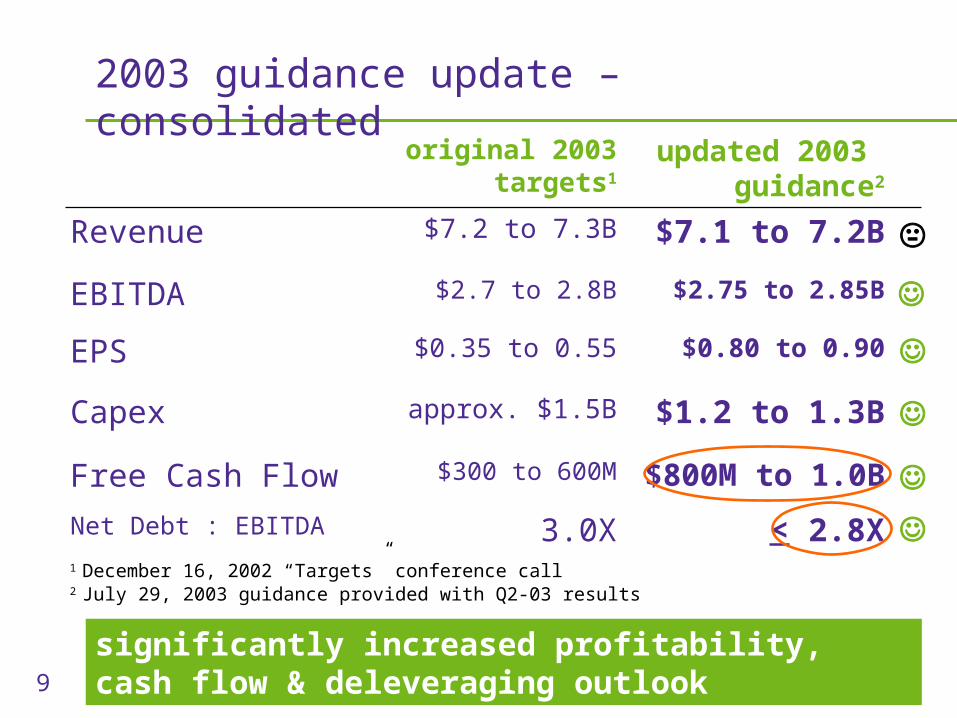
2003 guidance update – consolidated
significantly increased profitability, cash flow & deleveraging outlook
$1.2 to 1.3Bapprox. $1.5BCapex
$800M to 1.0B
$0.80 to 0.90
$2.75 to 2.85B
$7.1 to 7.2B
updated 2003 guidance2
$300 to 600M
$0.35 to 0.55
$2.7 to 2.8B
$7.2 to 7.3B
original 2003 targets1
EPS
Free Cash Flow
EBITDA
Revenue
< 2.8X3.0XNet Debt : EBITDA1 December 16, 2002 “Targets” conference call2 July 29, 2003 guidance provided with Q2-03 results
10
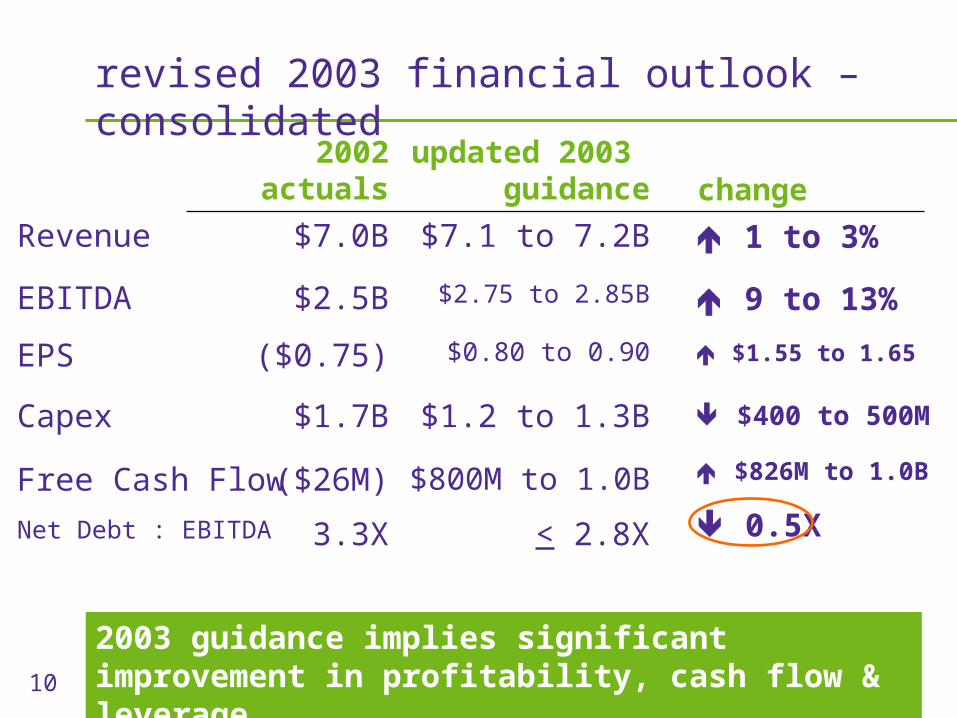
revised 2003 financial outlook – consolidated
2003 guidance implies significant improvement in profitability, cash flow & leverage
$1.2 to 1.3B$1.7BCapex
$800M to 1.0B
$0.80 to 0.90
$2.75 to 2.85B
$7.1 to 7.2B
updated 2003 guidance
($26M)
($0.75)
$2.5B
$7.0B
2002 actuals
EPS
Free Cash Flow
EBITDA
Revenue
< 2.8X3.3XNet Debt : EBITDA
change
0.5X
$400 to 500M
$826M to 1.0B
$1.55 to 1.65
9 to 13%
1 to 3%
11
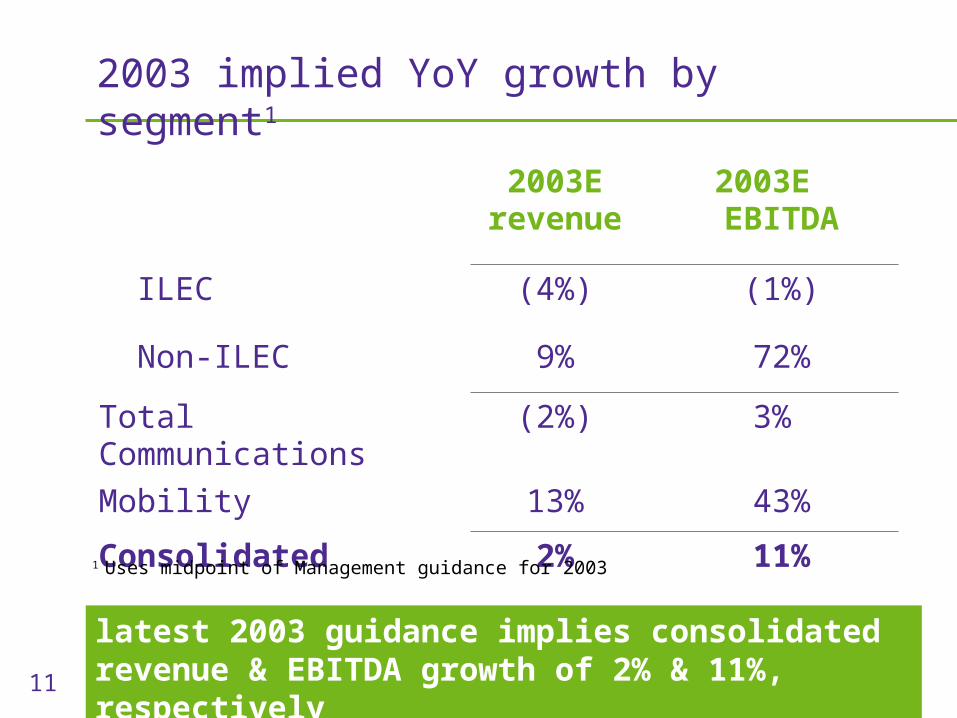
2003E revenue
2003E EBITDA
ILEC (4%) (1%)
Non-ILEC 9% 72%
Total Communications (2%) 3%
Mobility 13% 43%
Consolidated 2% 11%
2003 implied YoY growth by segment1
latest 2003 guidance implies consolidated revenue & EBITDA growth of 2% & 11%, respectively
1 Uses midpoint of Management guidance for 2003
12
strategic imperatives 2000-2003
Provide integrated solutions
Partner, acquire & divest as necessary
Invest in internal capabilities
Build national capabilities
Focus on growth markets
Going to market as one team
13
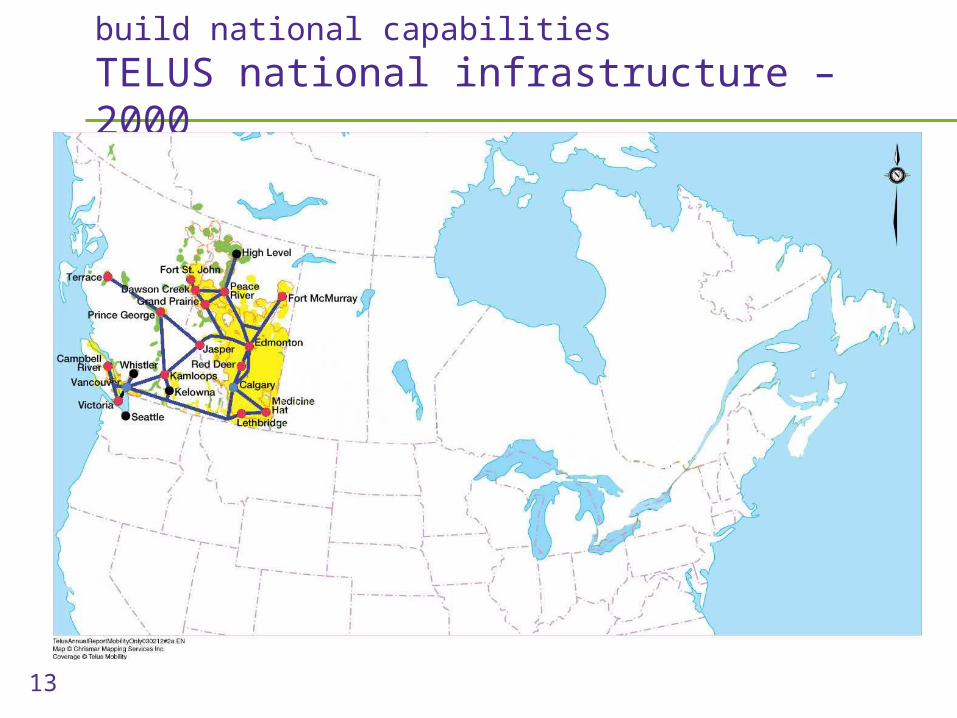
build national capabilities
TELUS national infrastructure – 2000
14
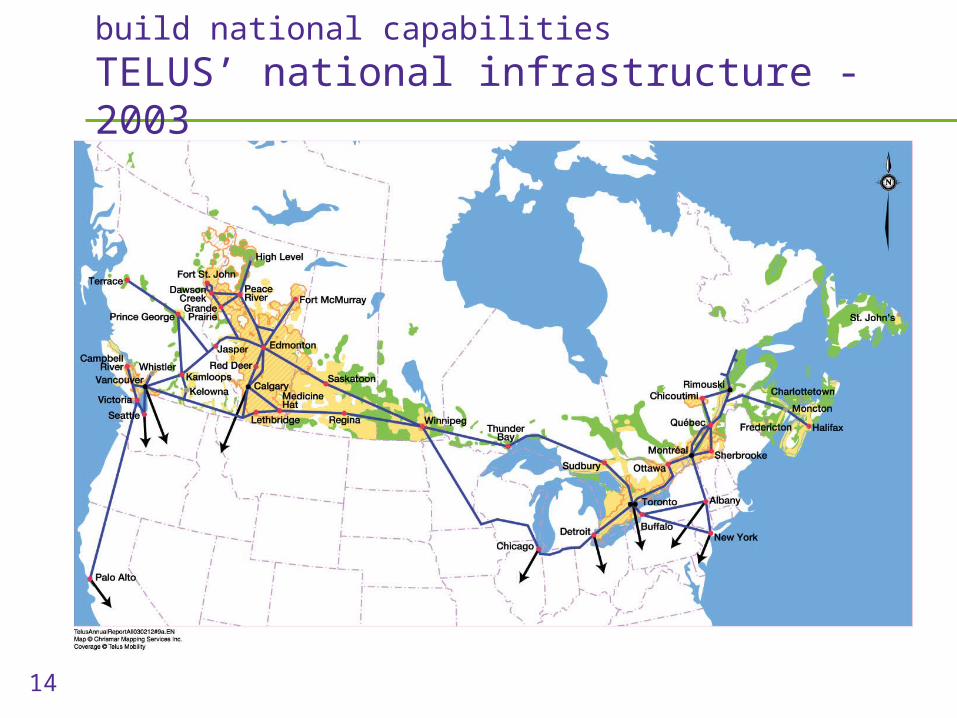
build national capabilities
TELUS’ national infrastructure - 2003
15
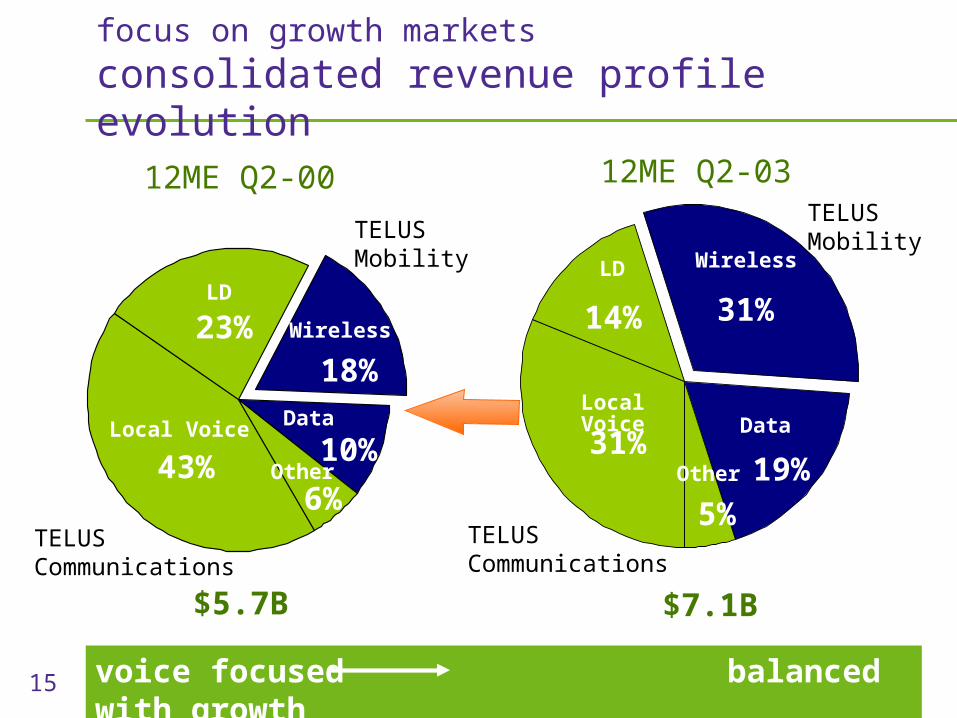
$5.7B
43%
18%
10%
6%Other
12ME Q2-03
$7.1B
Local Voice
Wireless
Data31%
31%
19%
5%Other
LD
Wireless
12ME Q2-00
Local Voice
23%
Data
14%
LD
TELUSCommunications
TELUSCommunications
TELUSMobility
TELUSMobility
voice focused balanced with growth
focus on growth markets
consolidated revenue profile evolution
16
going to market as one team
strong brand identity established
consistent branding across TELUS

17

18

19
20
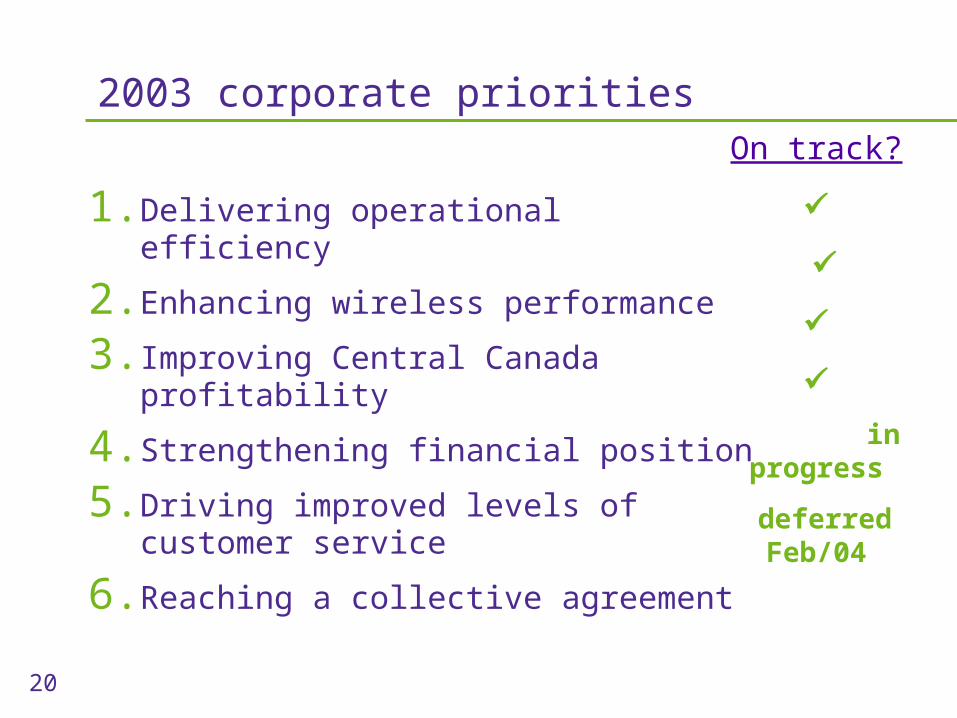
2003 corporate priorities
1. Delivering operational efficiency
2. Enhancing wireless performance
3. Improving Central Canada profitability
4. Strengthening financial position
5. Driving improved levels of customer service
6. Reaching a collective agreement
On track?
in progress
deferred Feb/04
21
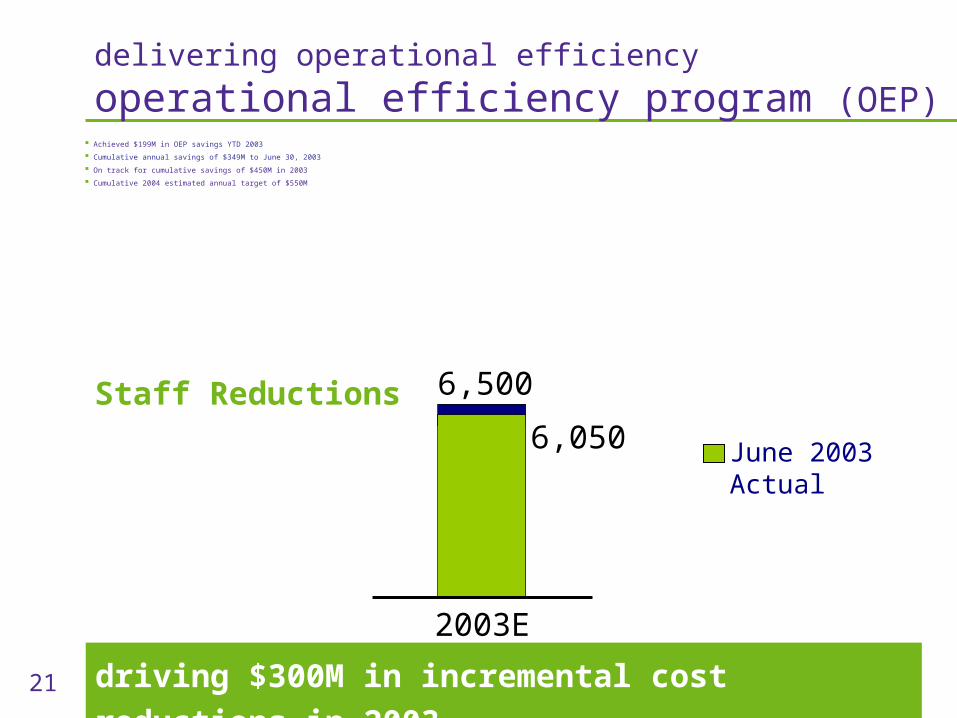
Achieved $199M in OEP savings YTD 2003
Cumulative annual savings of $349M to June 30, 2003
On track for cumulative savings of $450M in 2003
Cumulative 2004 estimated annual target of $550M
June 2003Actual
2003E
6,500
6,050Staff Reductions
driving $300M in incremental cost reductions in 2003
delivering operational efficiency
operational efficiency program (OEP)
22
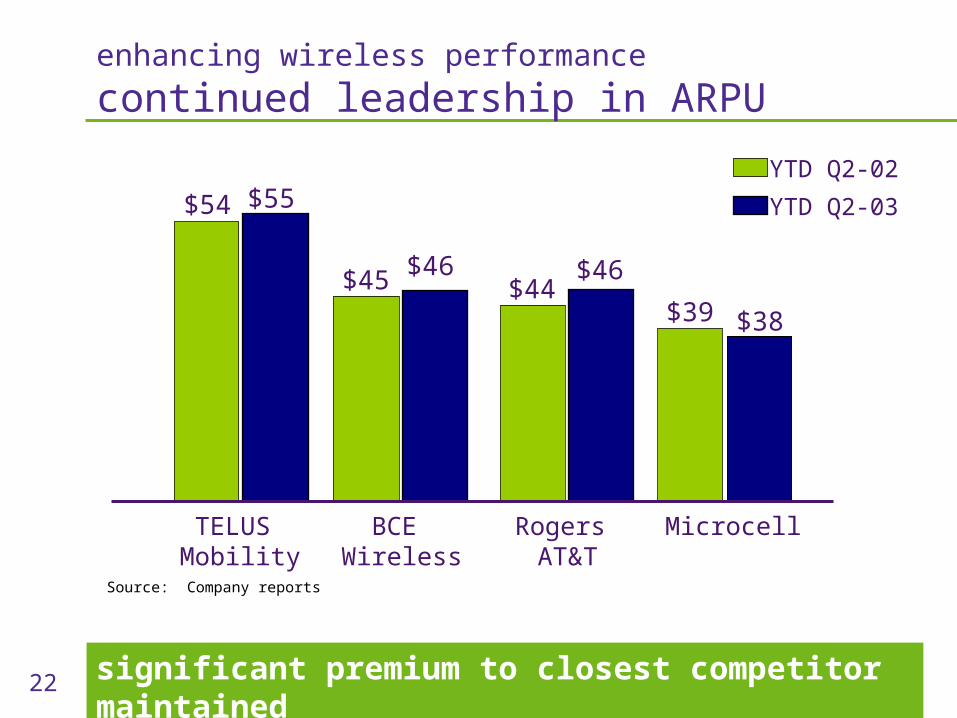
TELUS Mobility
Rogers AT&T
BCE Wireless
Microcell
$54
$39$44$45
enhancing wireless performance
continued leadership in ARPU
Source: Company reports
YTD Q2-02
YTD Q2-03 $55
$46$46
$38
significant premium to closest competitor maintained
23
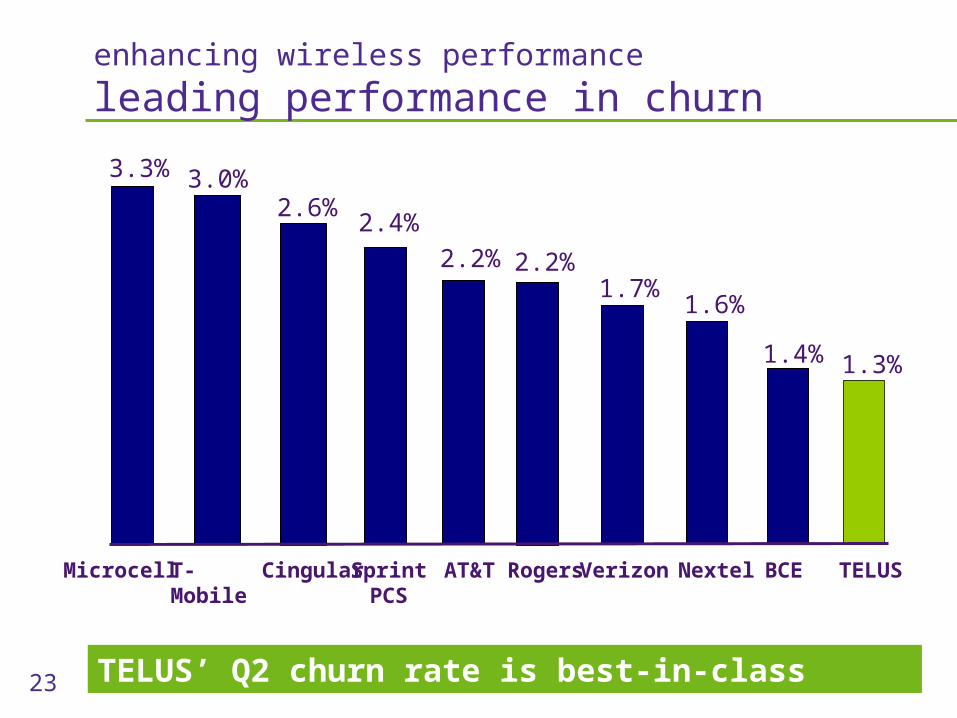
enhancing wireless performance
leading performance in churn
BCE Cingular
2.4%
2.2%
1.6%
2.2%1.7%
1.4% 1.3%
TELUSVerizonAT&T Rogers Nextel
3.3%
SprintPCS
Microcell
3.0%2.6%
T-Mobile
TELUS’ Q2 churn rate is best-in-class
24
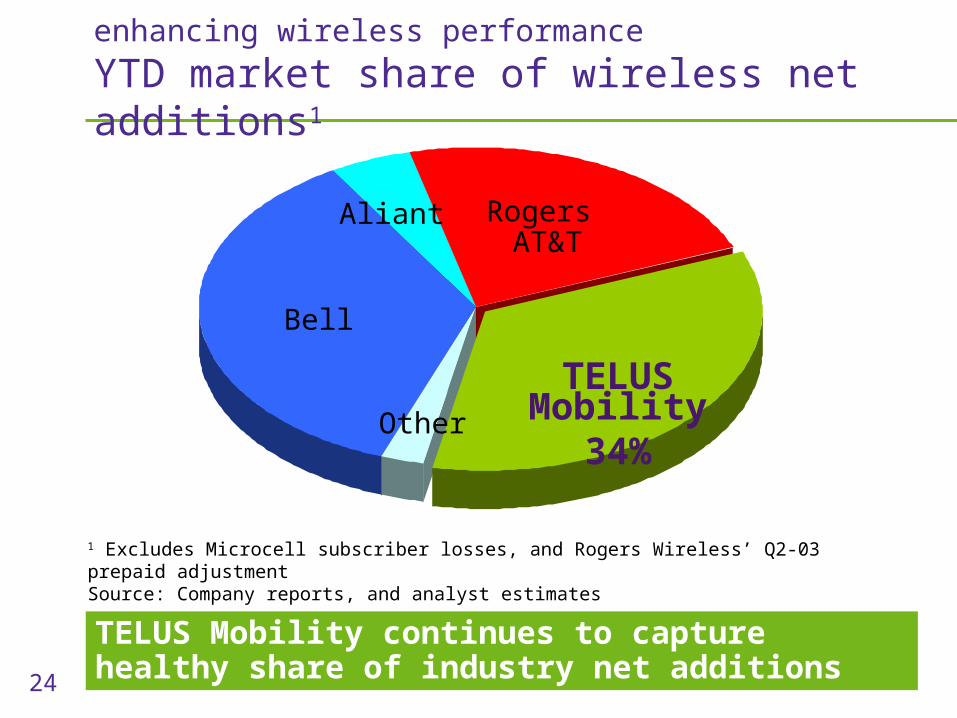
enhancing wireless performance
YTD market share of wireless net additions1
Bell
Rogers AT&T
TELUS Mobility34%Other
TELUS Mobility continues to capture healthy share of industry net additions
Aliant
1 Excludes Microcell subscriber losses, and Rogers Wireless’ Q2-03 prepaid adjustmentSource: Company reports, and analyst estimates
25
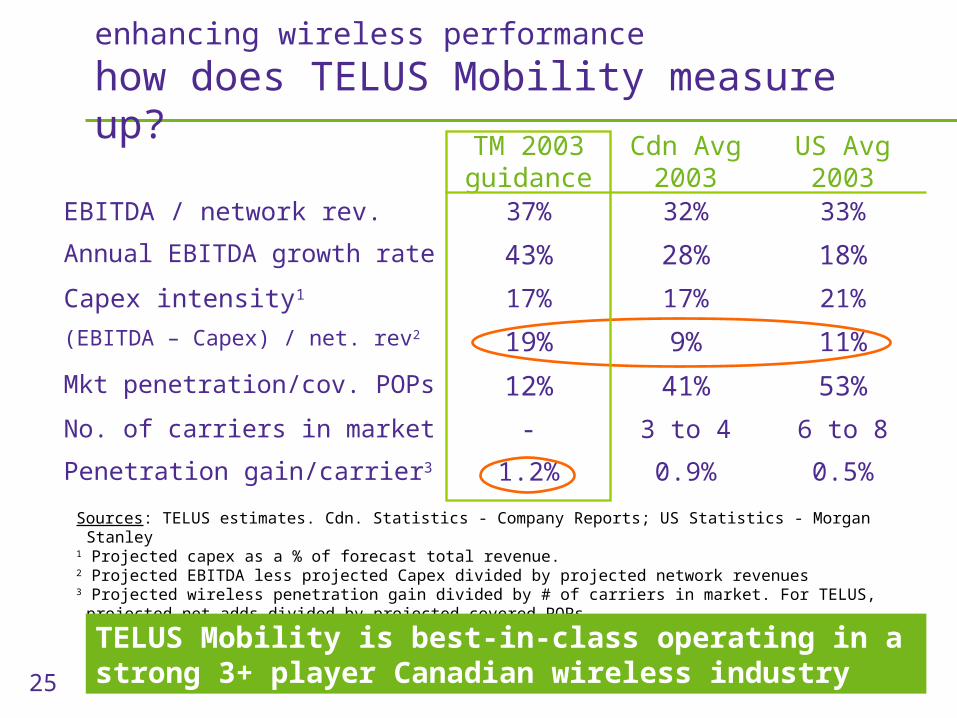
enhancing wireless performance
how does TELUS Mobility measure up?
Sources: TELUS estimates. Cdn. Statistics - Company Reports; US Statistics - Morgan Stanley1 Projected capex as a % of forecast total revenue. 2 Projected EBITDA less projected Capex divided by projected network revenues
3 Projected wireless penetration gain divided by # of carriers in market. For TELUS, projected net adds divided by projected covered POPs
0.5%0.9%1.2%Penetration gain/carrier3
6 to 83 to 4-No. of carriers in market
53%41%12%Mkt penetration/cov. POPs
11%9%19%(EBITDA – Capex) / net. rev2
21%17%17%Capex intensity1
18%28%43%Annual EBITDA growth rate
33%32%37%EBITDA / network rev.
US Avg 2003
Cdn Avg 2003
TM 2003 guidance
TELUS Mobility is best-in-class operating in a strong 3+ player Canadian wireless industry
26
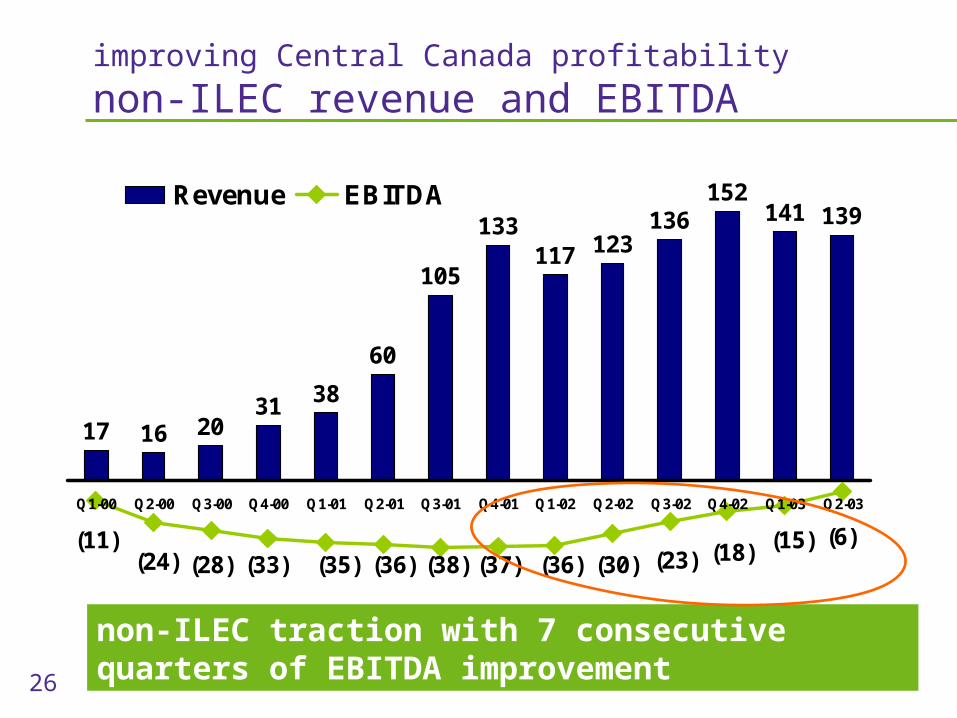
non-ILEC traction with 7 consecutive quarters of EBITDA improvement
improving Central Canada profitability
non-ILEC revenue and EBITDA
17 16 2031 38
60
105
133117 123
136152
141 139
(6)(23)(30)(36)(37)
(11)(24) (28) (33) (35) (36) (38) (18) (15)
Q1-00 Q2-00 Q3-00 Q4-00 Q1-01 Q2-01 Q3-01 Q4-01 Q1-02 Q2-02 Q3-02 Q4-02 Q1-03 Q2-03
Revenue EBITDA
27
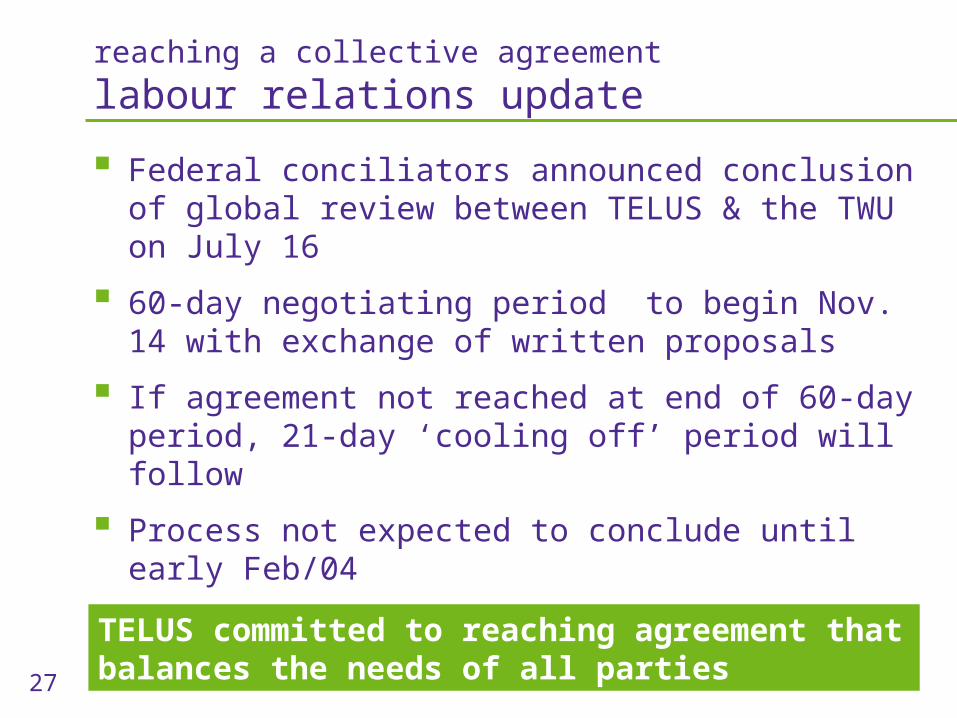
reaching a collective agreement
labour relations update
Federal conciliators announced conclusion of global review between TELUS & the TWU on July 16
60-day negotiating period to begin Nov. 14 with exchange of written proposals
If agreement not reached at end of 60-day period, 21-day ‘cooling off’ period will follow
Process not expected to conclude until early Feb/04
TELUS committed to reaching agreement that balances the needs of all parties

strengthening financial position credit profile
29
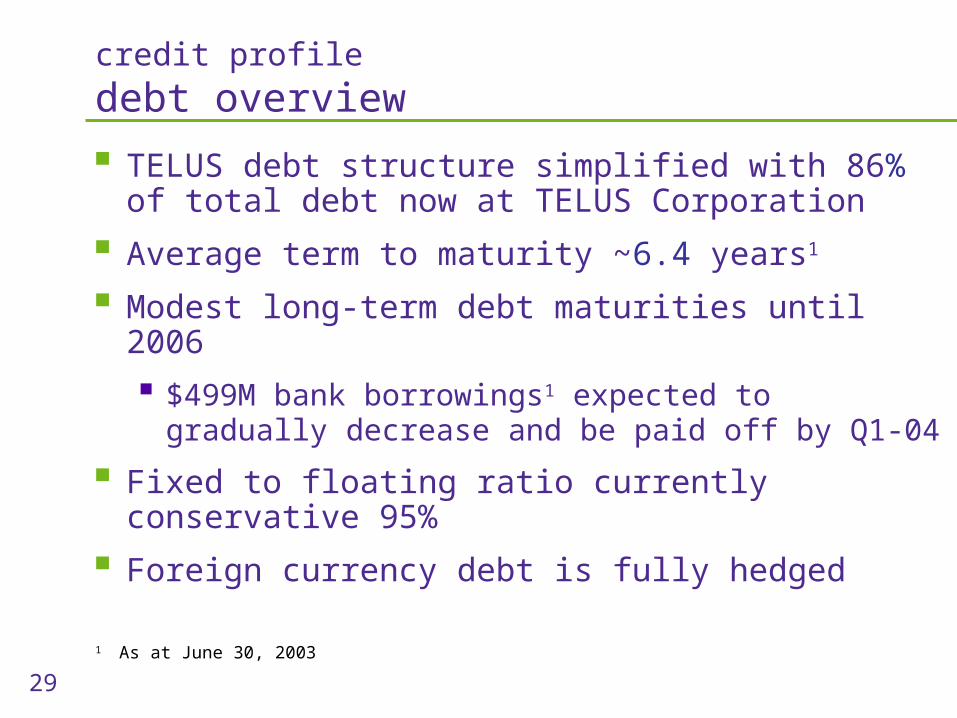
TELUS debt structure simplified with 86% of total debt now at TELUS Corporation
Average term to maturity ~6.4 years1
Modest long-term debt maturities until 2006
$499M bank borrowings1 expected to gradually decrease and be paid off by Q1-04
Fixed to floating ratio currently conservative 95%
Foreign currency debt is fully hedged
credit profile
debt overview
1 As at June 30, 2003
30
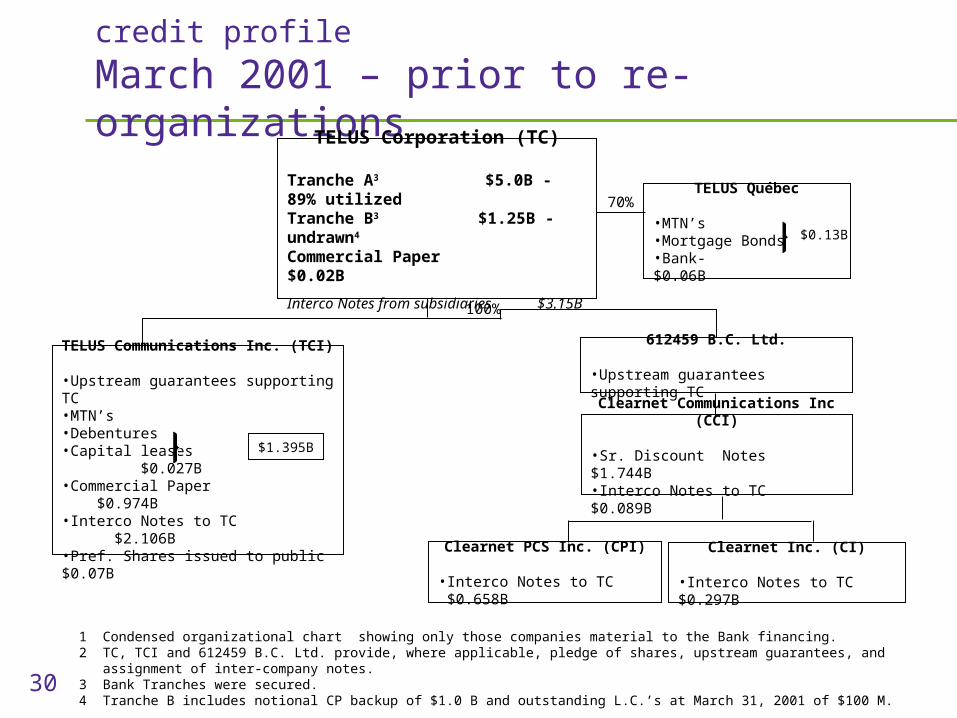
credit profile
March 2001 – prior to re-organizations
TELUS Corporation (TC)
Tranche A3 $5.0B - 89% utilizedTranche B3 $1.25B - undrawn4
Commercial Paper $0.02B
Interco Notes from subsidiaries $3.15B
612459 B.C. Ltd.
•Upstream guarantees supporting TC
Clearnet Communications Inc (CCI)
•Sr. Discount Notes $1.744B•Interco Notes to TC $0.089B
1 Condensed organizational chart showing only those companies material to the Bank financing. 2 TC, TCI and 612459 B.C. Ltd. provide, where applicable, pledge of shares, upstream guarantees, and assignment of inter-company notes.3 Bank Tranches were secured.4 Tranche B includes notional CP backup of $1.0 B and outstanding L.C.’s at March 31, 2001 of $100 M.
Clearnet PCS Inc. (CPI)
•Interco Notes to TC $0.658B
Clearnet Inc. (CI)
•Interco Notes to TC $0.297B
TELUS Communications Inc. (TCI)
•Upstream guarantees supporting TC•MTN’s•Debentures•Capital leases $0.027B•Commercial Paper $0.974B•Interco Notes to TC $2.106B•Pref. Shares issued to public $0.07B
$1.395B
100%
TELUS Québec
•MTN’s•Mortgage Bonds•Bank- $0.06B
70%
$0.13B
31
Re-organized legal structure to align with business operations and access Clearnet tax losses
Mobility business consolidated into TELE-MOBILE Company partnership in 2001
2002 wind-up of Clearnet Inc. into TELUS Communications Inc. (TCI)
made additional losses available - no cash income taxes payable until 2007
tax-effected loss carryforwards recognized for accounting ~$766M at year-end 2002
credit profile
corporate reorganization activity
32
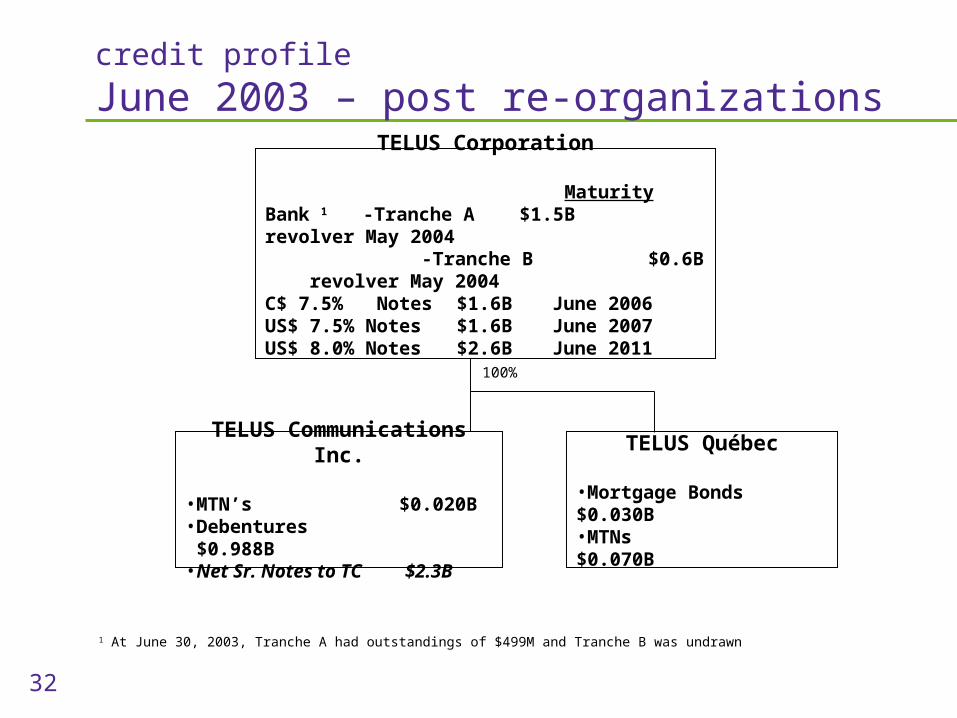
TELUS Corporation
MaturityBank 1 -Tranche A $1.5B revolver May 2004 -Tranche B $0.6B revolver May 2004C$ 7.5% Notes $1.6B June 2006US$ 7.5% Notes $1.6B June 2007US$ 8.0% Notes $2.6B June 2011
1 At June 30, 2003, Tranche A had outstandings of $499M and Tranche B was undrawn
TELUS Communications Inc.
•MTN’s $0.020B•Debentures $0.988B•Net Sr. Notes to TC $2.3B
TELUS Québec
•Mortgage Bonds $0.030B•MTNs $0.070B
100%
credit profile
June 2003 – post re-organizations
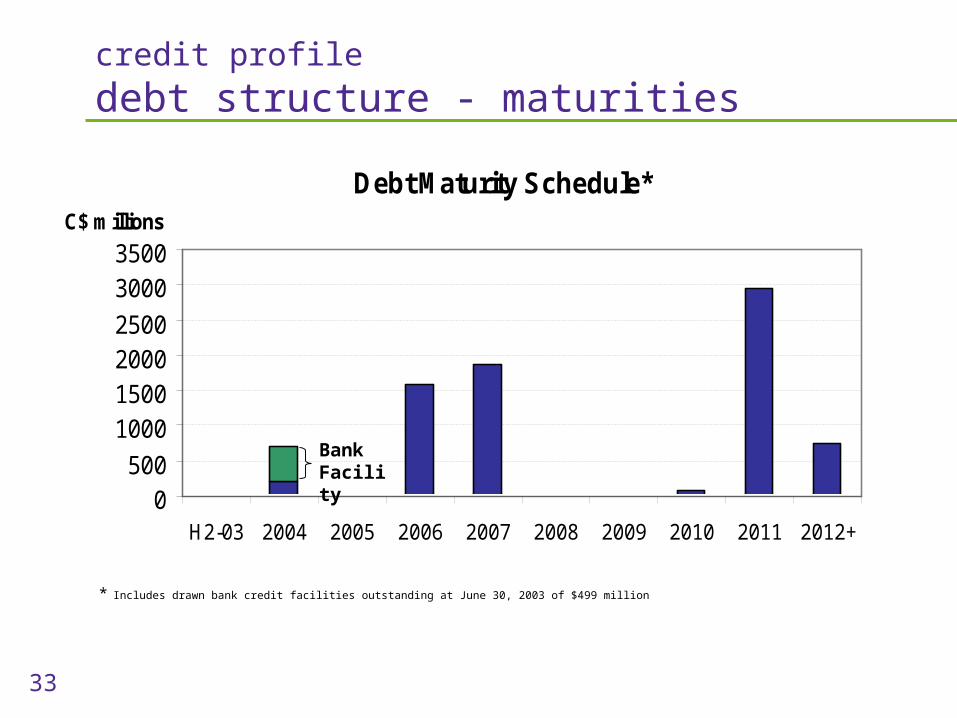
33
Debt Maturity Schedule*
0500
1000150020002500
30003500
H2-03 2004 2005 2006 2007 2008 2009 2010 2011 2012+
C$ millions
* Includes drawn bank credit facilities outstanding at June 30, 2003 of $499 million
credit profile
debt structure - maturities
Bank Facility
34
credit profile
364-day renewal
Renewed $600M 364-day credit facility portion in May 2003
back-up facility
not projected to draw upon
Combined bank facilities now $2.1B
No material changes to terms
New maturity date May 2004 with TELUS option to term-out to May 2005
TELUS’ liquidity position expected to remain >$1B
35
credit profile
credit rating environment
Rating agencies have ‘raised the bar’ post-Enron
proactive orientation with negative bias generally
criticism of agencies (AT&T Canada, WorldCom, Microcell)
telco industry risk premium increased
rating methodology changed/not transparent
time horizon shortened
FCF focus
credit rating committee process & benchmarks became less transparent
36
credit profile TELUS yield spread analysis (1 of 2)
0%
5%
10%
15%
20%
25%
30%
24-M
ay-
01
24-J
un-0
1
24-J
ul-01
24-A
ug-0
1
24-S
ep-0
1
24-O
ct-0
1
24-N
ov-
01
24-D
ec-
01
24-J
an-0
2
24-F
eb-0
2
24-M
ar-
02
24-A
pr-
02
24-M
ay-
02
24-J
un-0
2
24-J
ul-02
24-A
ug-0
2
24-S
ep-0
2
24-O
ct-0
2
24-N
ov-
02
24-D
ec-
02
24-J
an-0
3
24-F
eb-0
3
24-M
ar-
03
24-A
pr-
03
24-M
ay-
03
24-J
un-0
3
24-J
ul-03
24-A
ug-0
3
C$ 7.5% 2006 US$ 7.5% 2007 US$ 8.0% 2011
May 31Credit rating under review
Sep 12Equity offering & debt buyback
Jul 25Moody's downgrade
Jul 29Q2 results & increased disclosure
Jul 8DBRS downgrade
Jul 11S&P downgrade
May 2001 July 2002 Current
rating downgrades caused unprecedented dislocation remedied by results
TELUS C$ & US$ Note Yield Spread Analysis(May 24, 2001 to September 5, 2003)
37
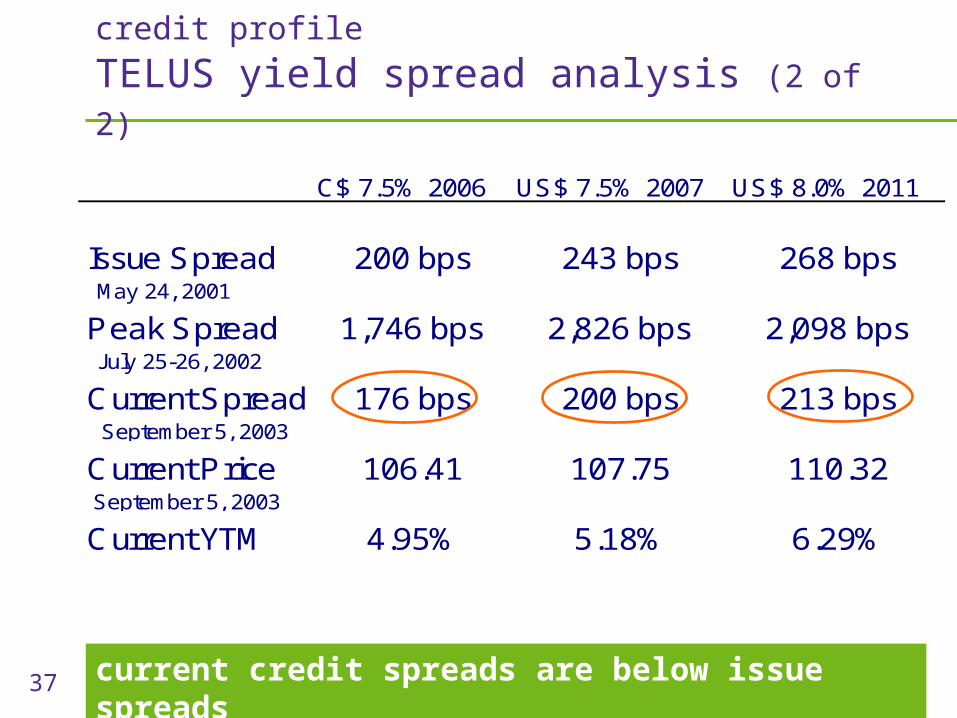
credit profile TELUS yield spread analysis (2 of 2)
C$ 7.5% 2006 US$ 7.5% 2007 US$ 8.0% 2011
Issue Spread 200 bps 243 bps 268 bps May 24, 2001
Peak Spread 1,746 bps 2,826 bps 2,098 bps July 25-26, 2002
Current Spread 176 bps 200 bps 213 bps September 5, 2003
Current Price 106.41 107.75 110.32 September 5, 2003
Current YTM 4.95% 5.18% 6.29%
current credit spreads are below issue spreads
38
$337M equity-funded debt buyback
364-day credit facility renewed
OEP tracking to plan
3rd consecutive year heading to exceed annual profitability guidance
Significant cash tax recoveries
Significant capex reduction
Significant free cash flow generation
credit profile
what’s happened since July 2002?
deleveraging ahead of plan
39
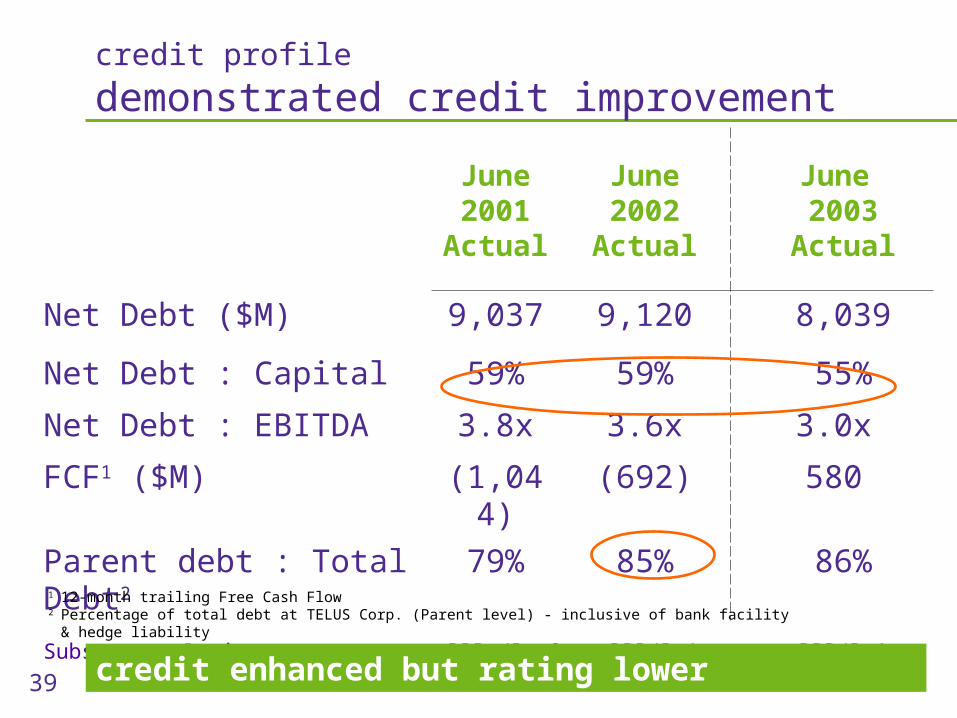
June 2001
Actual
June 2002 Actual
June 2003 Actual
Net Debt ($M) 9,037 9,120 8,039
Net Debt : Capital 59% 59% 55%
Net Debt : EBITDA 3.8x 3.6x 3.0x
FCF1 ($M) (1,044) (692) 580
Parent debt : Total Debt2 79% 85% 86%
Subsequent Rating BBB+/Baa2 BBB/Ba1 BBB/Ba1
credit profile
demonstrated credit improvement
1 12-month trailing Free Cash Flow2 Percentage of total debt at TELUS Corp. (Parent level) - inclusive of bank facility & hedge liability
credit enhanced but rating lower
40
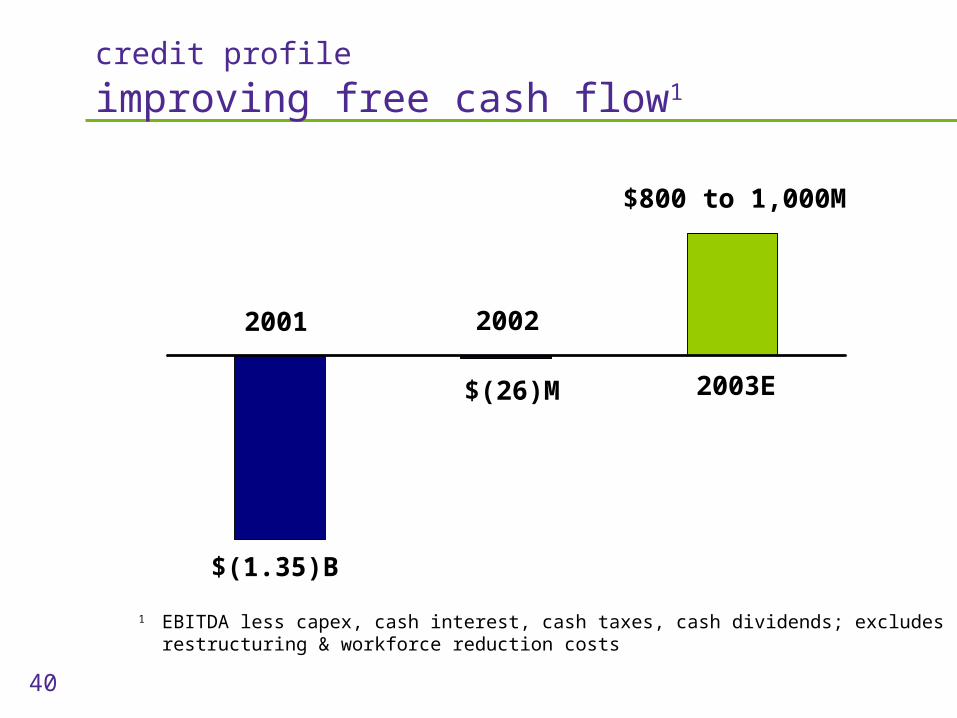
2001 2002
2003E
1 EBITDA less capex, cash interest, cash taxes, cash dividends; excludes restructuring & workforce reduction costs
$(1.35)B
$(26)M
$800 to 1,000M
credit profile improving free cash flow1
41
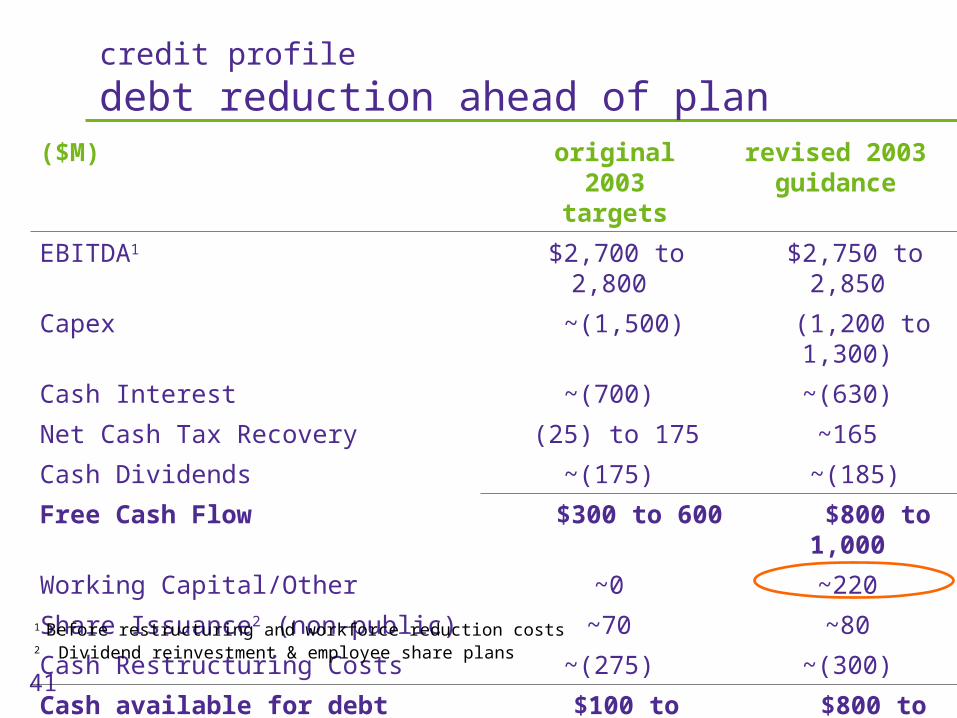
credit profile
debt reduction ahead of plan($M) original 2003
targetsrevised 2003
guidance
EBITDA1 $2,700 to 2,800 $2,750 to 2,850
Capex ~(1,500) (1,200 to 1,300)
Cash Interest ~(700) ~(630)
Net Cash Tax Recovery (25) to 175 ~165
Cash Dividends ~(175) ~(185)
Free Cash Flow $300 to 600 $800 to 1,000
Working Capital/Other ~0 ~220
Share Issuance2 (non-public) ~70 ~80
Cash Restructuring Costs ~(275) ~(300)
Cash available for debt reduction $100 to 400 $800 to 1,000
1 Before restructuring and workforce reduction costs2 Dividend reinvestment & employee share plans
42
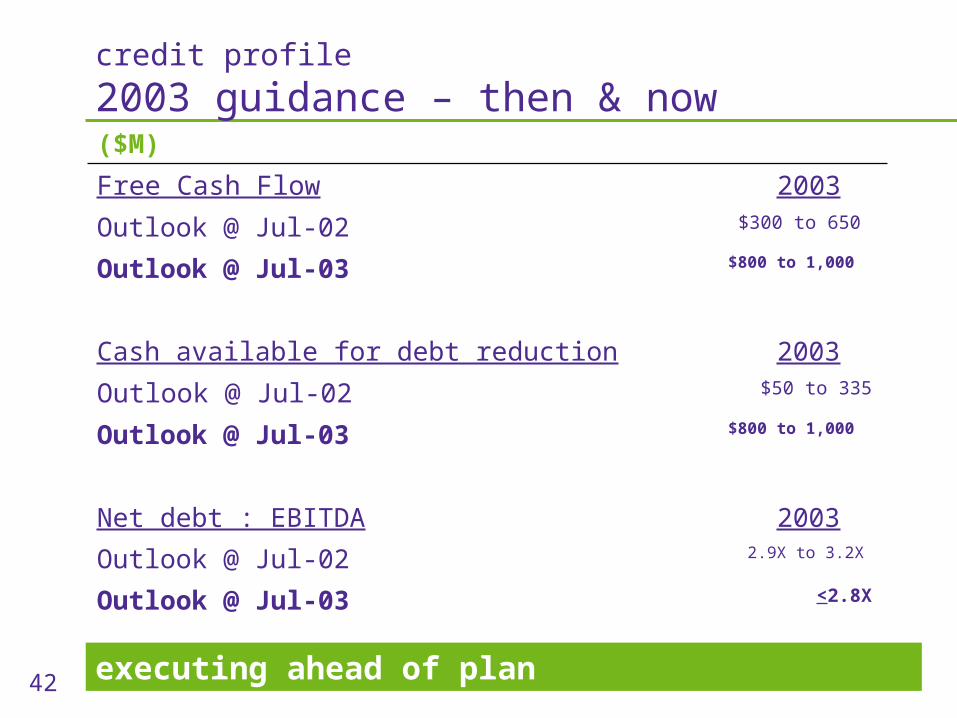
credit profile
2003 guidance – then & now
2.9X to 3.2XOutlook @ Jul-02
$50 to 335Outlook @ Jul-02
$300 to 650Outlook @ Jul-02
2003Net debt : EBITDA
<2.8XOutlook @ Jul-03
$800 to 1,000Outlook @ Jul-03
2003Cash available for debt reduction
$800 to 1,000Outlook @ Jul-03
2003Free Cash Flow
($M)
executing ahead of plan
43
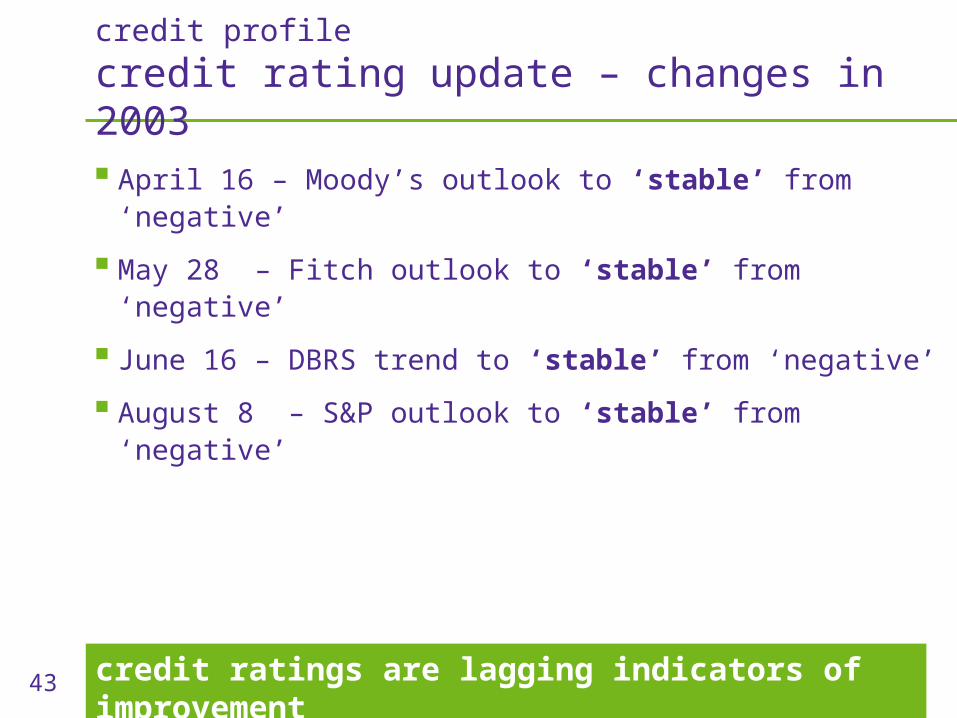
credit profile
credit rating update – changes in 2003
April 16 – Moody’s outlook to ‘stable’ from ‘negative’
May 28 – Fitch outlook to ‘stable’ from ‘negative’
June 16 – DBRS trend to ‘stable’ from ‘negative’
August 8 – S&P outlook to ‘stable’ from ‘negative’
credit ratings are lagging indicators of improvement
44
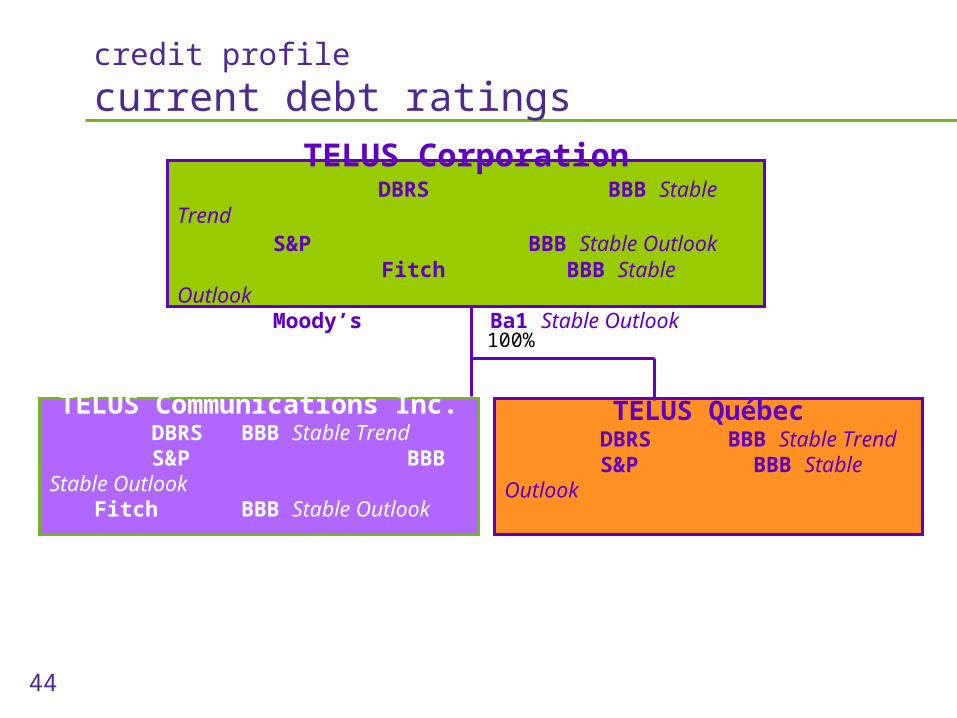
credit profile
current debt ratings
TELUS Corporation DBRS BBB Stable Trend S&P BBB Stable Outlook Fitch BBB Stable Outlook Moody’s Ba1 Stable Outlook
TELUS Communications Inc. DBRS BBB Stable Trend S&P BBB Stable Outlook Fitch BBB Stable Outlook
TELUS QuébecDBRS BBB Stable Trend S&P BBB Stable Outlook
100%
45
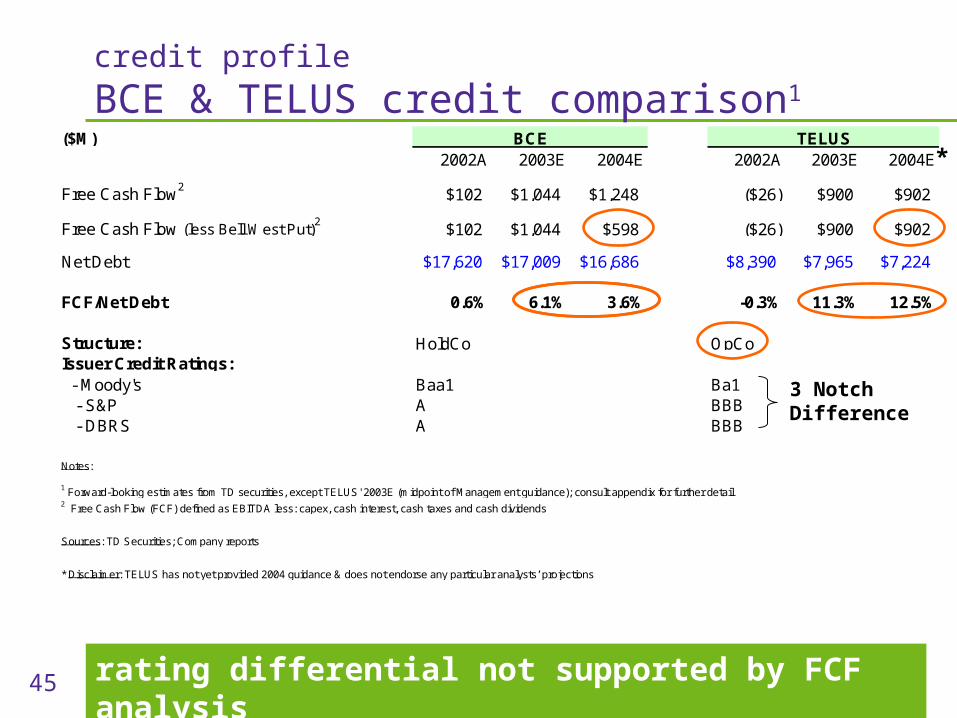
credit profile
BCE & TELUS credit comparison1
rating differential not supported by FCF analysis
*($M) BCE TELUS
2002A 2003E 2004E 2002A 2003E 2004E
Free Cash Flow2 $102 $1,044 $1,248 ($26) $900 $902
Free Cash Flow (less Bell West Put)2 $102 $1,044 $598 ($26) $900 $902
Net Debt $17,620 $17,009 $16,686 $8,390 $7,965 $7,224
FCF/Net Debt 0.6% 6.1% 3.6% -0.3% 11.3% 12.5%
Structure: HoldCo OpCoIssuer Credit Ratings: - Moody's Baa1 Ba1 - S&P A BBB - DBRS A BBB
3 Notch Difference
Notes:
1 Forward-looking estimates from TD securities, except TELUS' 2003E (midpoint of Management guidance); consult appendix for further detail2 Free Cash Flow (FCF) defined as EBITDA less: capex, cash interest, cash taxes and cash dividends
Sources: TD Securities; Company reports
* Disclaimer: TELUS has not yet provided 2004 guidance & does not endorse any particular analysts’ projections
46
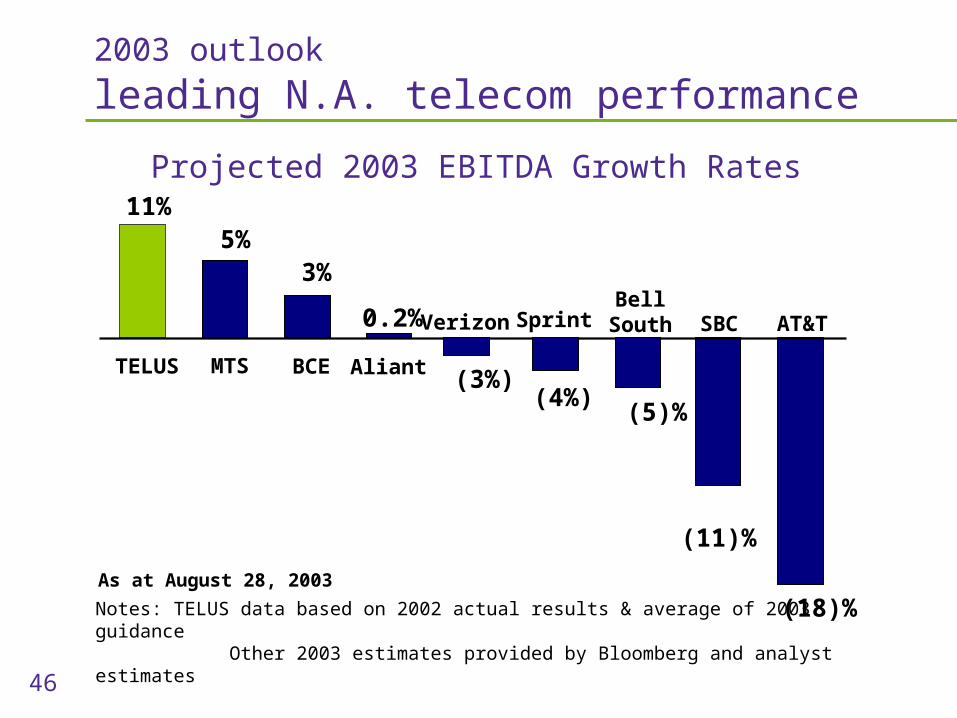
2003 outlook leading N.A. telecom performance
11% 5%
3%
0.2%
(18)%
(11)%
TELUS BCE
Sprint
MTS
SBC AT&T
Aliant (3%) (5)%
VerizonBell
South
Projected 2003 EBITDA Growth Rates
Notes: TELUS data based on 2002 actual results & average of 2003 guidance Other 2003 estimates provided by Bloomberg and analyst estimates
(4%)
As at August 28, 2003
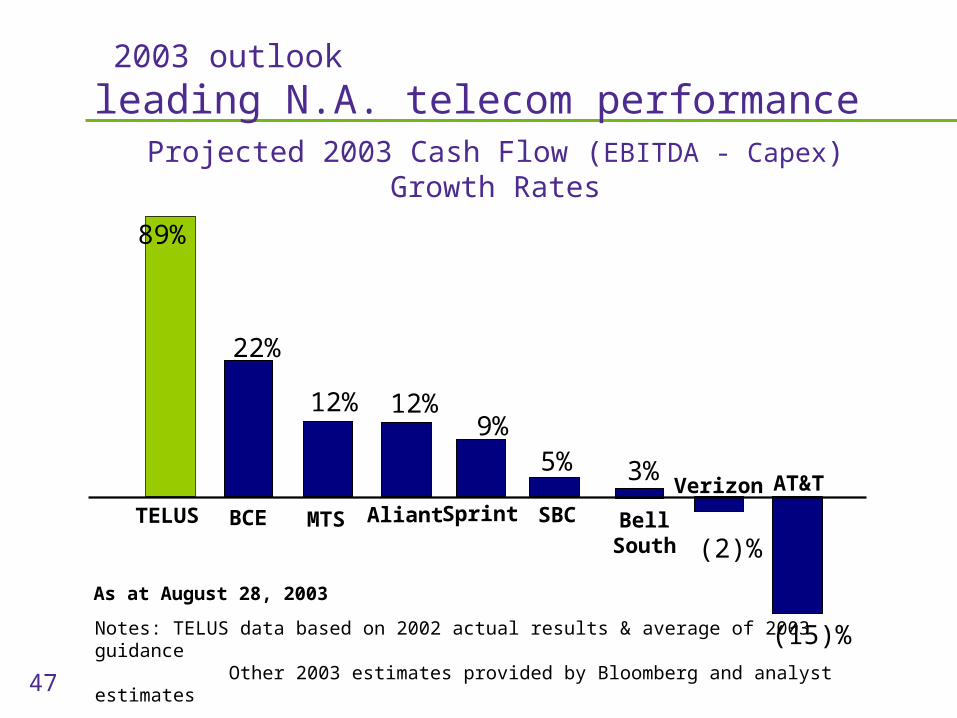
47
5%
SBC
Projected 2003 Cash Flow (EBITDA - Capex) Growth Rates
12% 12% 9%
22%
(15)%
(2)%
3%
89%
TELUS BCE SprintMTS BellSouth
Verizon AT&T
Aliant
Notes: TELUS data based on 2002 actual results & average of 2003 guidance Other 2003 estimates provided by Bloomberg and analyst estimates
2003 outlook
leading N.A. telecom performance
As at August 28, 2003
48
summary
Delivering on our strategy:
TELUS Communications – improving efficiencies
– non-ILEC on-track
TELUS Mobility – executing materially ahead of plan
Improved 2003 cash flow & earnings outlook
Generating significant cash flow of $800M to $1B
Continued material debt & leverage reduction
strong & improving investment-grade credit profile

questions?

appendix
52
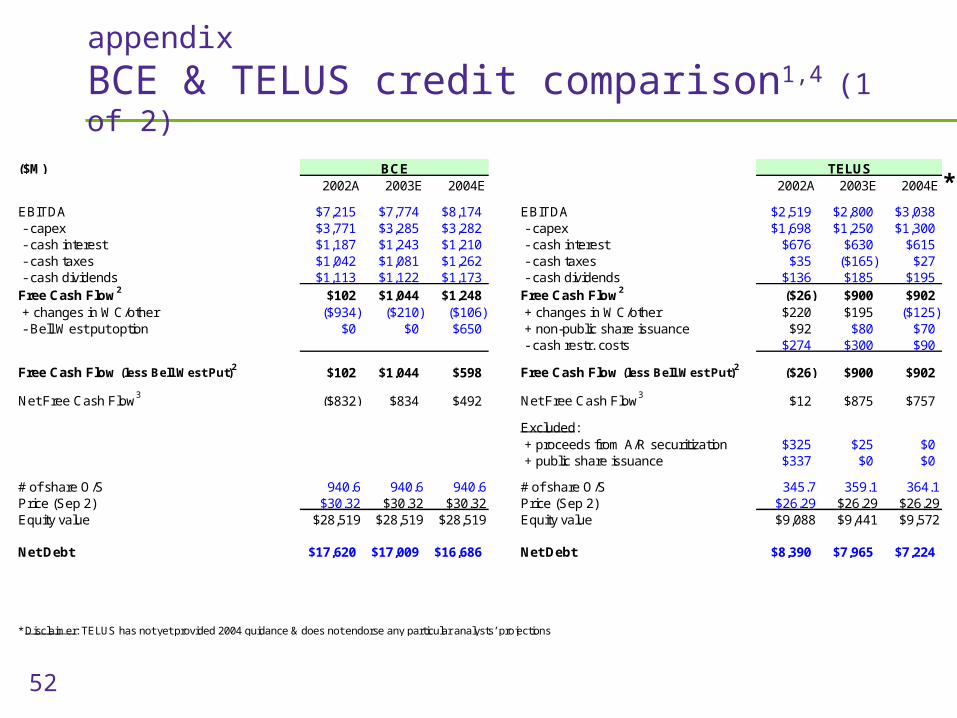
appendix
BCE & TELUS credit comparison1,4 (1 of 2)
*
* Disclaimer: TELUS has not yet provided 2004 guidance & does not endorse any particular analysts’ projections
($M) BCE TELUS2002A 2003E 2004E 2002A 2003E 2004E
EBITDA $7,215 $7,774 $8,174 EBITDA $2,519 $2,800 $3,038 - capex $3,771 $3,285 $3,282 - capex $1,698 $1,250 $1,300 - cash interest $1,187 $1,243 $1,210 - cash interest $676 $630 $615 - cash taxes $1,042 $1,081 $1,262 - cash taxes $35 ($165) $27 - cash dividends $1,113 $1,122 $1,173 - cash dividends $136 $185 $195Free Cash Flow2 $102 $1,044 $1,248 Free Cash Flow2 ($26) $900 $902 + changes in WC/other ($934) ($210) ($106) + changes in WC/other $220 $195 ($125) - Bell West put option $0 $0 $650 + non-public share issuance $92 $80 $70
- cash restr. costs $274 $300 $90
Free Cash Flow (less Bell West Put)2 $102 $1,044 $598 Free Cash Flow (less Bell West Put)2 ($26) $900 $902
Net Free Cash Flow3 ($832) $834 $492 Net Free Cash Flow3 $12 $875 $757
Excluded: + proceeds from A/R securitization $325 $25 $0 + public share issuance $337 $0 $0
# of share O/S 940.6 940.6 940.6 # of share O/S 345.7 359.1 364.1Price (Sep 2) $30.32 $30.32 $30.32 Price (Sep 2) $26.29 $26.29 $26.29Equity value $28,519 $28,519 $28,519 Equity value $9,088 $9,441 $9,572
Net Debt $17,620 $17,009 $16,686 Net Debt $8,390 $7,965 $7,224
53
appendix
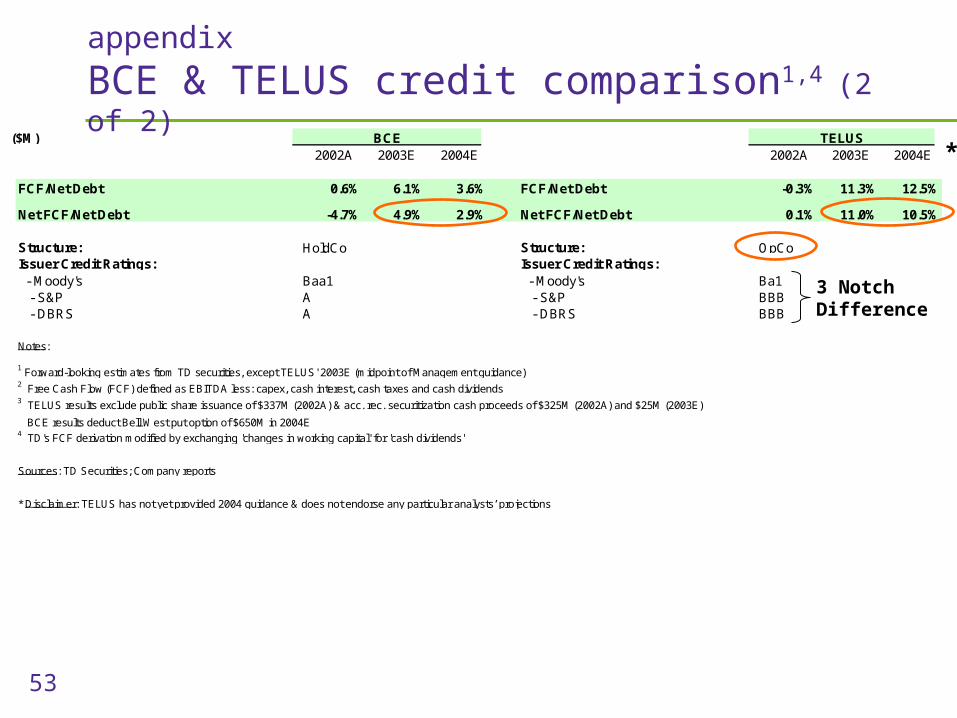
BCE & TELUS credit comparison1,4 (2 of 2)
*($M) BCE TELUS
2002A 2003E 2004E 2002A 2003E 2004E
FCF/Net Debt 0.6% 6.1% 3.6% FCF/Net Debt -0.3% 11.3% 12.5%
Net FCF/Net Debt -4.7% 4.9% 2.9% Net FCF/Net Debt 0.1% 11.0% 10.5%
Structure: HoldCo Structure: OpCoIssuer Credit Ratings: Issuer Credit Ratings: - Moody's Baa1 - Moody's Ba1 - S&P A - S&P BBB - DBRS A - DBRS BBB
Notes:
1 Forward-looking estimates from TD securities, except TELUS' 2003E (midpoint of Management guidance)2 Free Cash Flow (FCF) defined as EBITDA less: capex, cash interest, cash taxes and cash dividends3 TELUS results exclude public share issuance of $337M (2002A) & acc. rec. securitization cash proceeds of $325M (2002A) and $25M (2003E)
BCE results deduct Bell West put option of $650M in 2004E4 TD's FCF derivation modified by exchanging 'changes in working capital' for 'cash dividends'
Sources: TD Securities; Company reports
* Disclaimer: TELUS has not yet provided 2004 guidance & does not endorse any particular analysts’ projections
3 Notch Difference
54
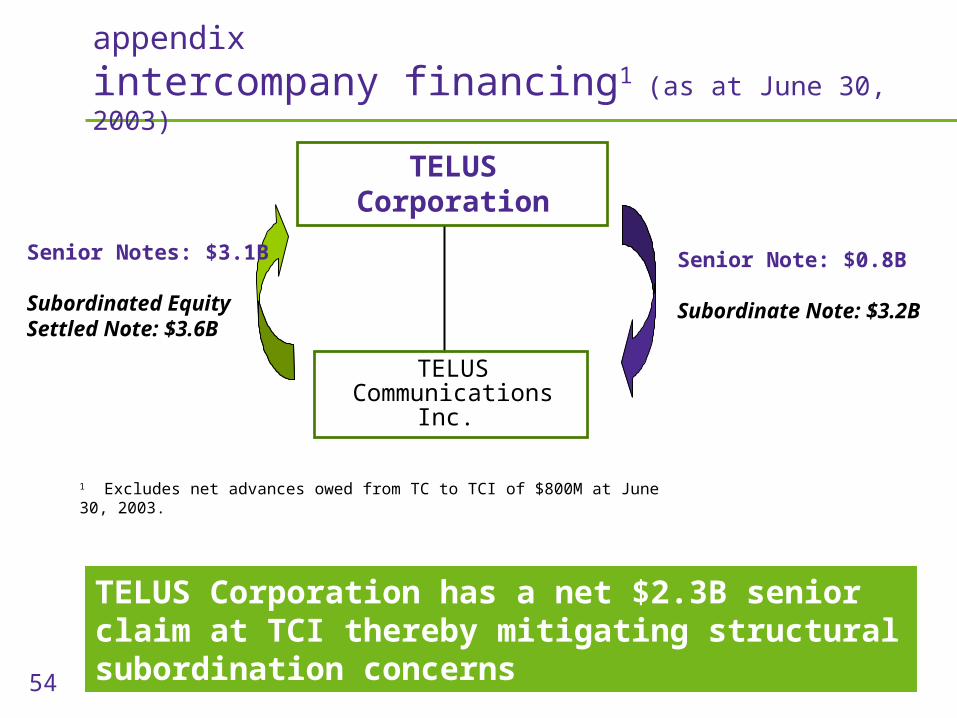
TELUSCorporation
TELUS Communications Inc.
Senior Notes: $3.1B
Subordinated Equity Settled Note: $3.6B
appendix
intercompany financing1 (as at June 30, 2003)
Senior Note: $0.8B
Subordinate Note: $3.2B
1 Excludes net advances owed from TC to TCI of $800M at June 30, 2003.
TELUS Corporation has a net $2.3B senior claim at TCI thereby mitigating structural subordination concerns
55
appendix
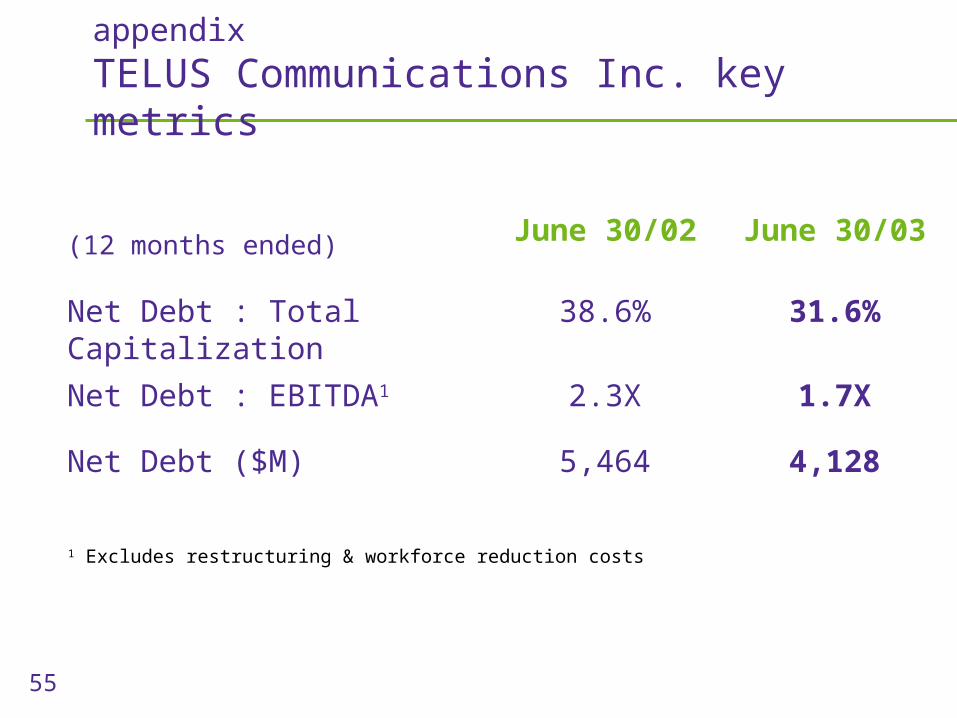
TELUS Communications Inc. key metrics
June 30/02 June 30/03(12 months ended)
Net Debt : Total Capitalization 38.6% 31.6%
Net Debt : EBITDA1 2.3X 1.7X
Net Debt ($M) 5,464 4,128
1 Excludes restructuring & workforce reduction costs