
Robert Balfanz Everyone Graduates Center Johns Hopkins University March 2011 What New Hampshire Can...
43
Robert Balfanz Everyone Graduates Center Johns Hopkins University March 2011 What New Hampshire Can Do to Achieve Zero Dropouts
-
Upload
jarrod-spier -
Category
Documents
-
view
216 -
download
1
Transcript of Robert Balfanz Everyone Graduates Center Johns Hopkins University March 2011 What New Hampshire Can...
Robert BalfanzEveryone Graduates CenterJohns Hopkins University
March 2011
What New Hampshire Can Do to Achieve Zero Dropouts
EVERYONEGRADUATES C
ENTE
R
We are at the start of what promises and needs to be a transformational decade in American Public Education
Common college and career ready standards
Next generation assessmentsIndividual level longitudinal data Push for greater teacher effectivenessSmart integration of technologyHolds promise of revolutionary
improvements

EVERYONEGRADUATES C
ENTE
R
But too many students are still attending low achieving high-
poverty schools where
Achievement gaps become achievement chasms
High school graduation is not the norm
Few high school graduates complete college

EVERYONEGRADUATES C
ENTE
R
In New Hampshire and the Nation
A small percent of schools drive the dropout crisis and achievement gap
Nationally, 1650 high schools produce 50% of the dropouts
In New Hampshire 15 high schools produce close to 57% of non-completers. Ten of these schools may be losing 100 plus students per high school class (really good data should be available soon)
The Good News is graduation rates are rising-national graduation rate up from 72 to 75% between 2002 and 2008, New Hampshire rate up from 78 to 83% (using federal average freshmen graduation rate measure)
If learning is inherently joyful and exciting and students want to succeed, why do some schools fail?
Because By and Large they are not Designed or Organized to Succeed

EVERYONEGRADUATES C
ENTE
R
Three Hypotheses on WhyUnderestimate the degree or nature of
a school’s educational challenge
Fail to meet students’ needs
Fail to integrate efforts to make attending school worthwhile with efforts to make schools places where students and teachers want to be and want to work hard

EVERYONEGRADUATES C
ENTE
R
1) Understanding Educational Challenge
Schools do not succeed when their educational challenge exceeds the available human resources that are wisely and diligently applied
EVERYONEGRADUATES C
ENTE
R
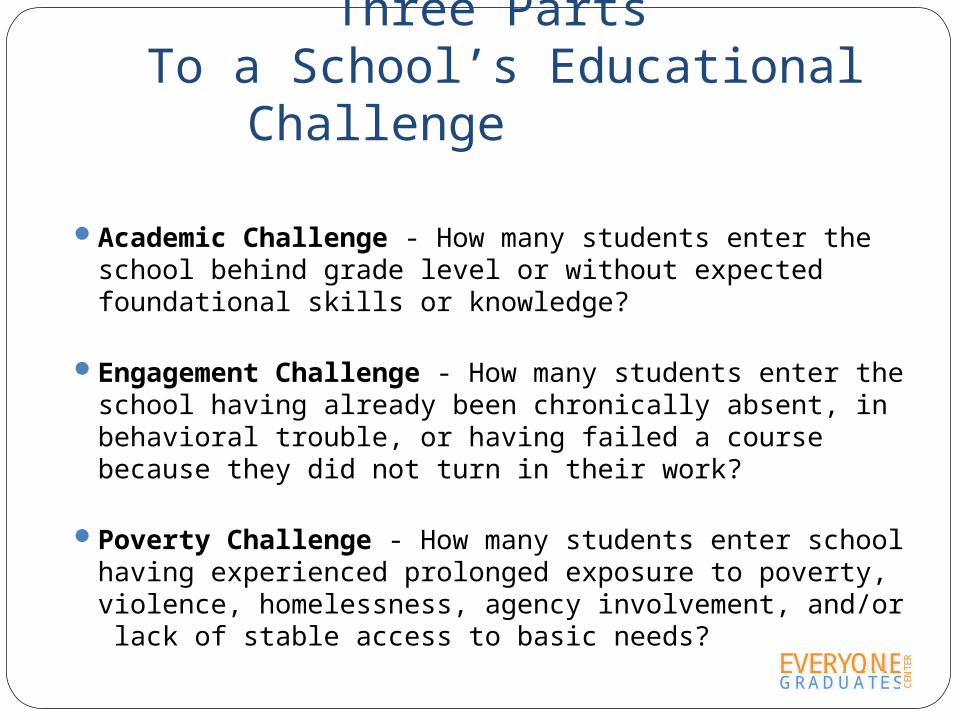
Three Parts To a School’s Educational
Challenge
Academic Challenge - How many students enter the school behind grade level or without expected foundational skills or knowledge?
Engagement Challenge - How many students enter the school having already been chronically absent, in behavioral trouble, or having failed a course because they did not turn in their work?
Poverty Challenge - How many students enter school having experienced prolonged exposure to poverty, violence, homelessness, agency involvement, and/or lack of stable access to basic needs?
Philadelphia Case Study:
The Educational Challenge of the Ninth-Grade/High-Poverty Neighborhood High Schools vs. Selective Admission Magnets

Percentage of 9th Graders who are On-Age, First Time Freshmen with 80%+ Attendance in 8th Grade and Math and Reading Skills at the 7th Grade Level
or Higher by High School
0%
20%
40%
60%
80%
100%
Per
cent
Magnet Schools

EVERYONEGRADUATES C
ENTE
R
We Will Know We Are Making Progress When . .
.
Schools commonly know in detail the scale and scope of the educational challenge they face
They are organized structurally and programmatically with evidence-based practices to meet it
Educational challenge influences resource allocation

Students who succeed at four transition points
-- Grades 1-6-9-12 –
Succeed
2) Meeting the Needs of Students

EVERYONEGRADUATES C
ENTE
R
At Each Transition Students Have Different Academic and
Social Needs
Pre-K and Elementary Grades - Core academic competencies and need to be socialized into the norms of school in a joyful manner
Middle Grades - Intermediate academic skills (reading comprehension and fluency, transition from arithmetic to mathematics) and a need for adventure and camaraderie
High School - Transition to adult behaviors and mind set and a path to college and career readiness, as well as the right extra help for students with skills below grade level

EVERYONEGRADUATES C
ENTE
R
Challenges to Post-Secondary Success
What worked in high school does not work in college
Student effort is the final frontier -- I will apply myself when I need to
Lack of college-going culture or expectations
Pull of family responsibility
Move from high-support to low-support environment

EVERYONEGRADUATES C
ENTE
R
Major FindingStudents in high-poverty schools who
successfully navigate grades 6 to 10 on time and on track, by and large, graduate from high school (75% or higher grad rates)
Students in high-poverty schools who struggle and become disengaged in the early secondary grades and in particular have an unsuccessful 6th- and/or 9th- grade transition do not graduate (25% or less grad rates)
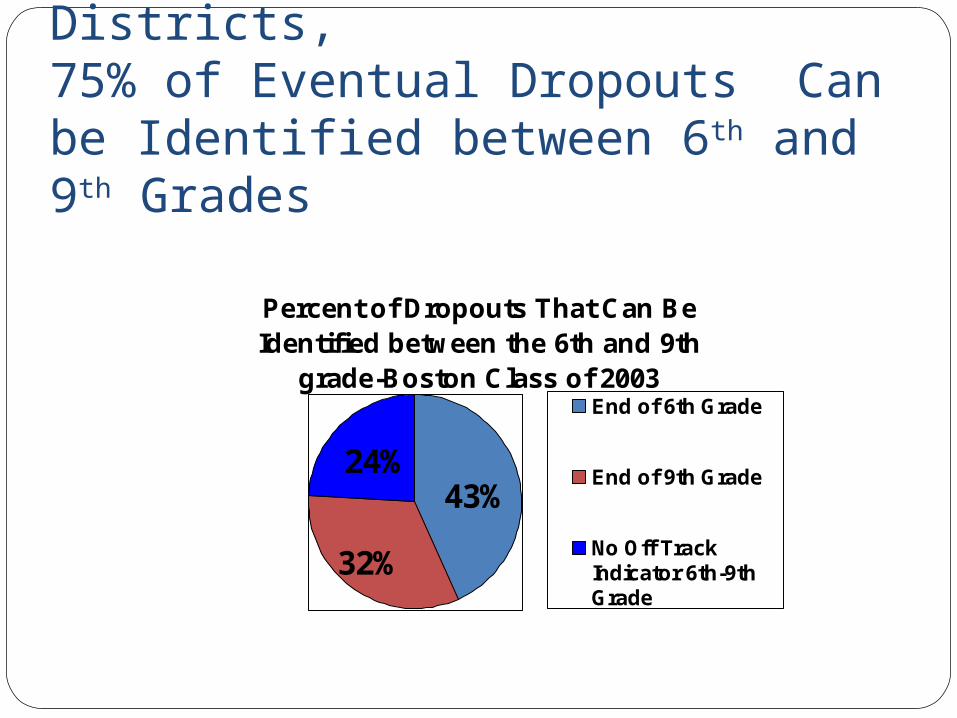
In High-Poverty School Districts, 75% of Eventual Dropouts Can be Identified between 6th and 9th Grades
Percent of Dropouts That Can Be Identified between the 6th and 9th
grade-Boston Class of 2003
32%
43%24%
End of 6th Grade
End of 9th Grade
No Off TrackIndicator 6th-9thGrade

EVERYONEGRADUATES C
ENTE
R
Students Must Be Motivated To Attend, Behave and Try
Robert Balfanz and Liza Herzog, Johns Hopkins University; Philadelphia Education Fund
The Primary Off-Track Indicators for Potential
Dropouts:• Attendance - < 85-90%
school attendance
• Behavior - “unsatisfactory” behavior mark in at least one class
• Course Performance - A final grade of “F” in math and/or English or credit-bearing high school course
Sixth Graders (1996-97) with an Early Warning Indicator
0%
20%
40%
60%
80%
100%
6th
7th
8th
9th
10th
11th
12th
Gradu
ation
+ 1
year
Grade in School
% of students
who are on-track to
graduation
Attendance
Behavior
Math
Literacy
Sixth-grade students with one or more of the indicators may have only a 15% to 25% chance of graduating from high school on time or within
one year of expected graduationNote: Early Warning Indicator graph from Philadelphia research which has been replicated in 10 cities.
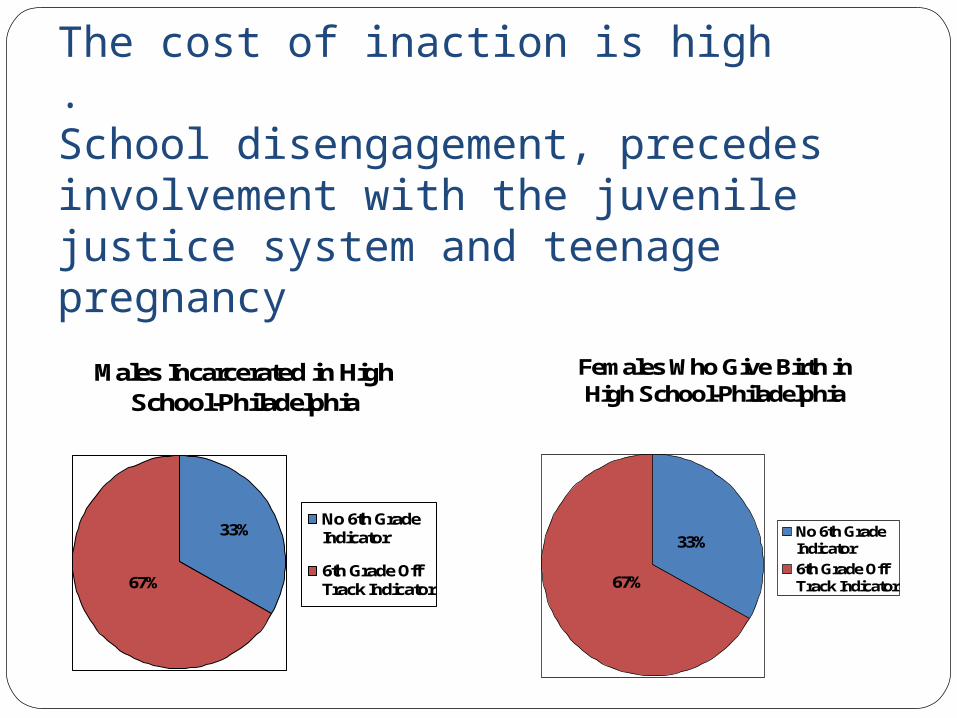
The cost of inaction is high. School disengagement, precedes involvement with the juvenile justice system and teenage pregnancy
Males Incarcerated in High School-Philadelphia
33%
67%
No 6th GradeIndicator
6th Grade OffTrack Indicator
Females Who Give Birth in High School-Philadelphia
33%
67%
No 6th GradeIndicator
6th Grade OffTrack Indicator
The Good News:
Attendance, behavior and effort drive achievement and enable students to stay on track to graduation
This means we can have integrated solutions

Achievement Gain
GPA
Attendance
Behavior
Parental Involvement
Academic Press
Teacher Support
Utility
1
Intrinsic Interest
Figure 3Structural Equation Model
Environmental Context of Student Learnging and Achievement
EVERYONEGRADUATES C
ENTE
R
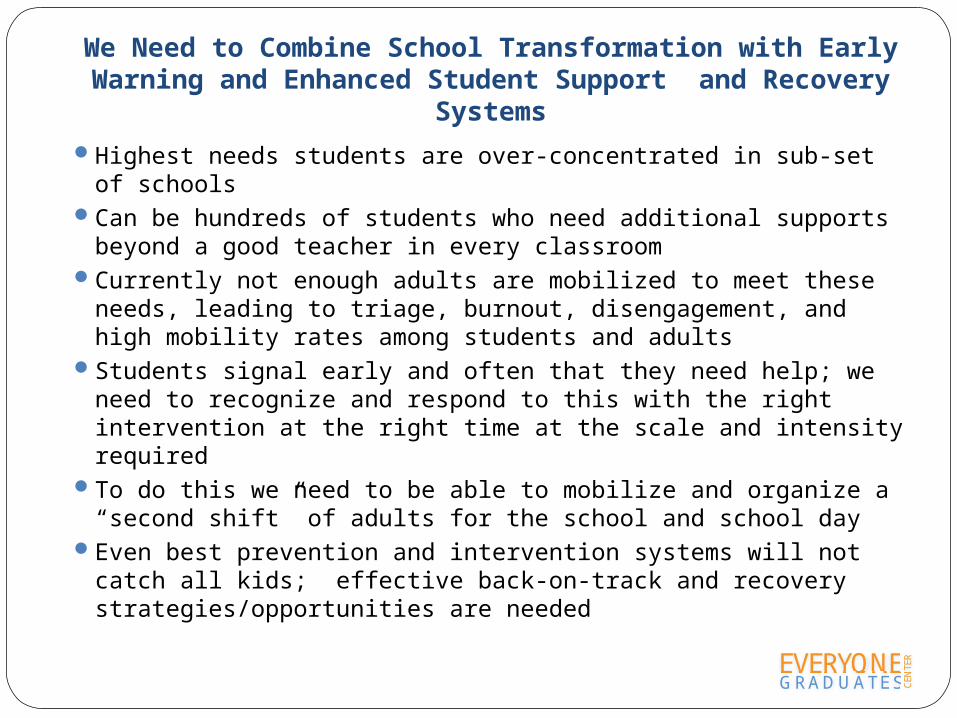
We Need to Combine School Transformation with Early Warning and Enhanced Student Support and Recovery
Systems
Highest needs students are over-concentrated in sub-set of schools
Can be hundreds of students who need additional supports beyond a good teacher in every classroom
Currently not enough adults are mobilized to meet these needs, leading to triage, burnout, disengagement, and high mobility rates among students and adults
Students signal early and often that they need help; we need to recognize and respond to this with the right intervention at the right time at the scale and intensity required
To do this we need to be able to mobilize and organize a “second shift” of adults for the school and school day
Even best prevention and intervention systems will not catch all kids; effective back-on-track and recovery strategies/opportunities are needed

Early Warning Indicator Data ToolStu
den
t
07-08: Days
Absent
08-09: Days
Absent07-08: Att.%
08-09: Att.% Dec Mar Dec Mar Dec Mar
Reading Grade Level
Math PSSA 2008
Literacy PSSA 2008
A 9 19 95% 84% 5 6 C D D C 8 Proficient Basic
B 12 13 93% 89% 7 8 D C F D 6.5Below Basic
Basic
C 48 69 73% 43% 10 10 F F F D 5.5Below Basic
Below Basic
AssessmentsMath
GradesAttendanceBehavior
CommentsLiteracy Grades
• Without additional support to provide interventions at the scale and intensity required to meet each student’s needs, teachers can easy feel overwhelmed.
• Research has shown that when teachers feel overwhelmed by the level of challenge in high-needs schools, they will often lower expectations for students.

EVERYONEGRADUATES C
ENTE
R
Link Early Warning Systems to Tiered Interventions
Focus on effective intervention, not just identification Need to be able to respond to the first signs that a student is
falling off track-No Triage Have diagnostic tools to deduce if student behavior is driven
by academic, socio-emotional needs or both Systematically apply school-wide preventative, targeted and
intensive interventions until students are on-track Recognize and build on student strengths Provide time, training, and support to teachers Match resources to student needs but practice intervention
discipline Evaluate the effectiveness of interventions Remember you can get started with the data in your school
EVERYONEGRADUATES C
ENTE
R
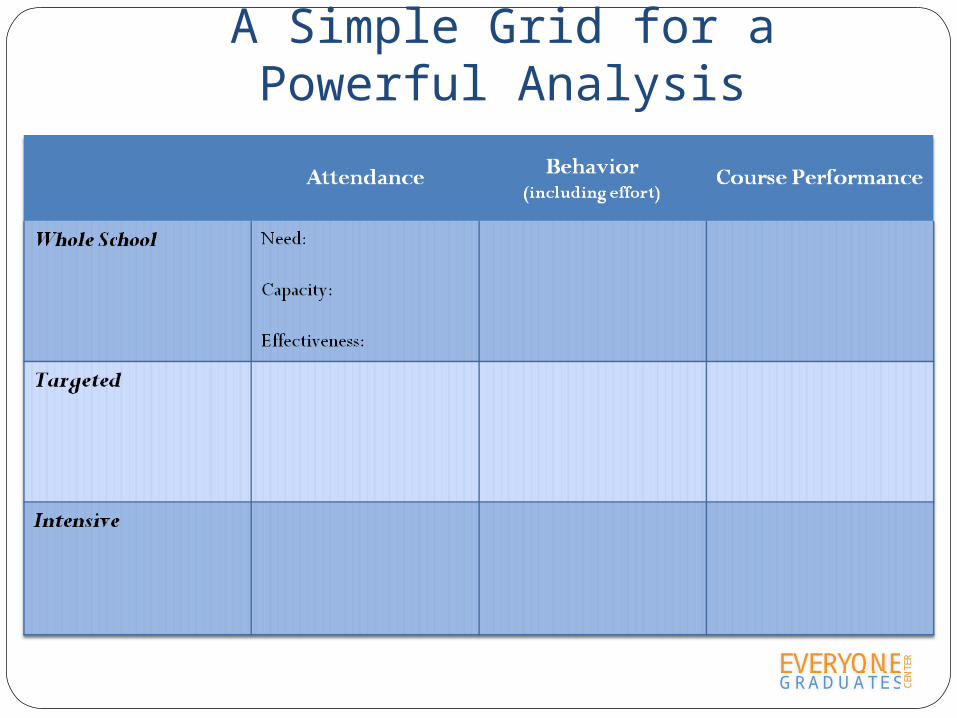
A Simple Grid for a Powerful Analysis
EVERYONEGRADUATES C
ENTE
R
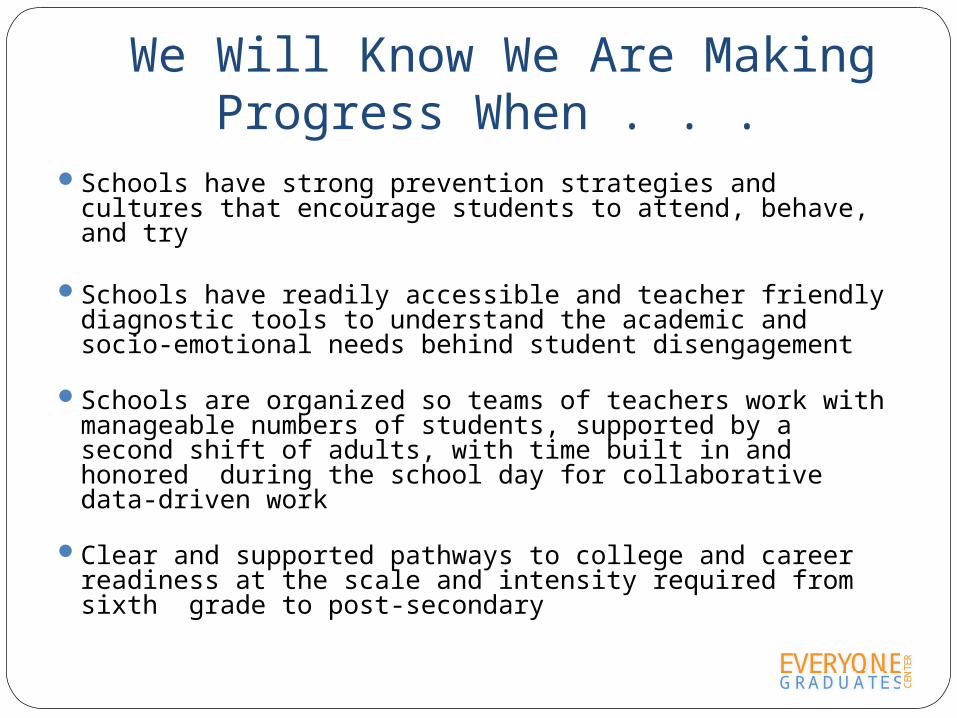
We Will Know We Are Making Progress When . . .
Schools have strong prevention strategies and cultures that encourage students to attend, behave, and try
Schools have readily accessible and teacher friendly diagnostic tools to understand the academic and socio-emotional needs behind student disengagement
Schools are organized so teams of teachers work with manageable numbers of students, supported by a second shift of adults, with time built in and honored during the school day for collaborative data-driven work
Clear and supported pathways to college and career readiness at the scale and intensity required from sixth grade to post-secondary
EVERYONEGRADUATES C
ENTE
R
Big Challenge AheadIntegrating teacher review of
benchmark data linked to assessments of new common standards and early warning indicator data linked to student behaviors
Lack of time in the school schedule for two meetings
Each piece of data informs the other

3) The Effort Gap
The outcome of school needs to be worthwhile and schools need to be places where students and teachers want to be and work hard
Because time and attention are limited we tend to focus on one or the other of these essential aspects
EVERYONEGRADUATES C
ENTE
R
Needed Capacity building-for students ,educators, parents, districts, states
Build Teacher and Student buy in for the effort required to reach college and career readiness for all
Re-Think School Day/Week/Year- to do this but avoid money traps along the way
EVERYONEGRADUATES C
ENTE
R
Capacity BuildingStudents-resiliency, goal setting, self
management and organization skills Teachers-collaborative diagnostic and
intervention skills (not a GP but House)Districts and States-managing a portfolio of
schools with different structures and partners that provide capacities
Districts and States- Being able to integrate a spatial analysis of the variation of educational challenges faced by schools with a longitudinal cohort analysis of who is succeeding and why, and how new cohorts may differ from prior ones

EVERYONEGRADUATES C
ENTE
R
We Know We Have Made Progress When
Schools and districts routinely put in the focus and energy preparing for the next cohort of students that professional football teams put into preparing for their next game
Collaborative efforts between teachers, schools, districts and states establish the mutually supportive functions equal to those needed to put on a Broadway play
We train with the intensity and the smarts of the Military
We need to be honest that there is a gap between teacher’s having high expectations and student’s having high aspirations and a strong belief that that they will be realized. This leads to diminished effort.
EVERYONEGRADUATES C
ENTE
R
Re-Thinking the School Day, Week, Year to Enable Greater Teacher and Student Effort
Time is underutilized asset but if we get extend time wrong it’s a money trap
Area rip for disciplined inquiry and evaluation-States to the lead?
How can we structure the school day/week to enable collaborative work among teachers and success supports and intellectual enrichment for students?
EVERYONEGRADUATES C
ENTE
R
We Need Different Strategies for Different Types of Low
Performing Schools
Locked Capacity-Low Expectations
Overwhelmed by Educational Challenge
Habituated Dysfunction

EVERYONEGRADUATES C
ENTE
R
Need to analyze and improve the odds of success before we start. Ask is
there evidence of-
Know-How- selecting effective reforms which match nature of the need
Capacity- the ability to collectively implement the interventions and reforms at the scale and intensity required
Will- the desire and belief needed to do the work required and to overcome obstacles and set backs
Absence of Excessive Turbulence- change requires stability and focus

Need to Strategically Partner Low Performing Schools with Community Supports, a Second Shift of Adults and Technical Assistance to Meet the Scale and Scope of Student Need
EVERYONEGRADUATES C
ENTE
R
An Example of Strategic Partnerships to Meet
Educational Need and Increase Student and Teacher
Effort

The Diplomas Now partners harness and combine their unique assets to keep students on track, college and career ready
Core Function
Means and Methods Additional Roles
Whole School
• Research based instructional, organizational and teacher support
• On-track indicator data system • On-site implementation and mission
building support • Scheduling, Staffing, and Budget
supports
• Extra Academic Supports
• Extra Behavior Supports
• National Training and Tech Assistance Partner (Phil. Ed. Fund)
Targeted Supports
• Whole-School, Whole-Child program• 8-15 full-time, full-day corps
members serving as near-peer role models to mentor, tutor, provide behavior and attendance coaching and extended day learning
• Positive School Climate
• Service Learning• After School
Intensive Supports
• School-based professional Site Coordinator
• Highly specialized and intensive interventions via case managed student supports and referral to outside agencies
• Brokered services through CIS partners
• Episodic Whole School Prevention Supports
On-Track Indicator and Intervention System:
• Research-based and validated interventions of increasing intensity are employed until student is back on track to graduation. Interventions are constantly evaluated for their effectiveness.
EVERYONEGRADUATES C
ENTE
R
What States Can DoHelp Districts Map Educational Challenge in their
Low Achieving Schools Develop Means to Assess if Proposed School
Reform Designs will Meet a School’s Educational Challenge and if the School/District has the Capacity to Implement them
Develop Interim Indicators for School Improvement Progress which at least for the Secondary Grades (6-12) include the A,B.C’s (Attendance Behavior, and Course Performance).
Measure and Report on Chronic Absenteeism (missing a month or more of school-20 days).
EVERYONEGRADUATES C
ENTE
R
What States Can Do cont.Help Support the Development, Spread, and Use of
Early Warning and Intervention Systems-with a focus on intervention
Develop and spread models for integrating review of benchmark achievement data and student early warning indicator data at the teacher (team) level.
Help Develop Capacity among districts and schools through facilitated networks so we can learn from success, by creating a common repository of effective tools for different situations and types of low achieving schools, and strategic partnering
EVERYONEGRADUATES C
ENTE
R
What States Can Do cont.Work together to figure out most powerful and
cost-effective way to extend learning time
Invest in building state capacity to help districts and schools with resource allocation-how people, time, and money can be better organized to meet a school’s educational challenge, meet the needs of students (in particular at key transition points) and to increase internal motivation and belief that hard work will pay off
Join the Civic Marshall Plan to Build A Grad Nation
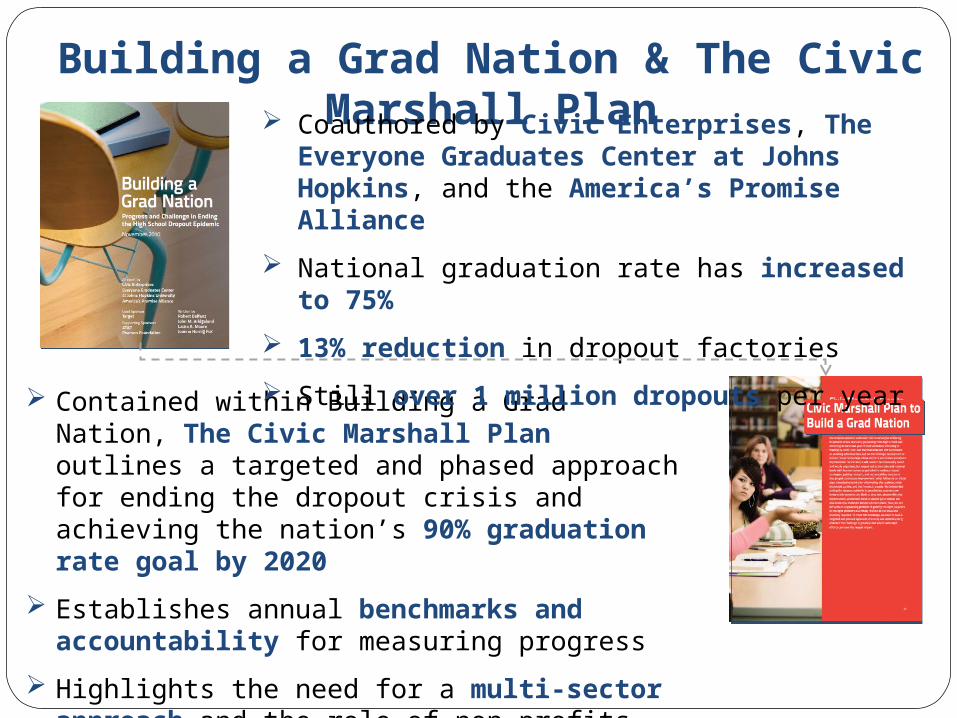
Building a Grad Nation & The Civic Marshall Plan
Contained within Building a Grad Nation, The Civic Marshall Plan outlines a targeted and phased approach for ending the dropout crisis and achieving the nation’s 90% graduation rate goal by 2020
Establishes annual benchmarks and accountability for measuring progress
Highlights the need for a multi-sector approach and the role of non-profits and National Service in ending the dropout crisis
Coauthored by Civic Enterprises, The Everyone Graduates Center at Johns Hopkins, and the America’s Promise Alliance
National graduation rate has increased to 75%
13% reduction in dropout factories
Still over 1 million dropouts per year

EVERYONEGRADUATES C
ENTE
R
For More InformationVisit the Everyone Graduates Center at
www.every1graduates.orgContact Robert Balfanz at