Roads Australia Capacity Chapter Workshoproads.omnisoftware.com.au/Portals/3/Policy/Network...Page 1...
13
Page 1 of 13 MINUTES Roads Australia Network Reliability Chapter Thursday 16 October 2014 Location: TransLink Centre for Service Excellence, 88 Musk Avenue, BRISBANE Welcome Roads Australia Policy Manager, Mandi Mees, welcomed Network Reliability Chapter members to the workshop. Mandi discussed RA’s annual policy alignment session with state road authorities and provided an update on the Chapter’s work program to date in 2014. This included progress on road safety, intelligent transport systems for network reliability, value for money and standardising technical specifications. ASSET PERFORMANCE AND MAINTENANCE INVESTMENT DECISIONS Chris Nagel, Program Manager, State Program Office, Infrastructure Management and Delivery Division, Department of Transport and Main Roads After a brief reminder of the Queensland Government Priorities and the 30 year plan, Chris introduced the Department of Transport and Main Roads’ (TMR) Asset Performance Investment Cycle and its approach to strategic asset management, investment prioritisation, delivery strategies and asset performance assessment. Chris discussed how TMR’s approach to total asset management is divided into two investment groups which are managed through an Element Management Framework, and incorporate 26 elements (grouped into business programs). The investment groups are: Maintenance, Preservation and Environment (incl. maintenance rehab, grids, corridors); and Road Operations (incl. traffic/incident management, route lighting, traveller information). 4| 4| Asset Performance and Investment Cycle Strategic Asset Management Element Management Planning Element data collection and deficiency analysis Deficiency prioritisation, funding allocation and performance targets Program development Delivery Reporting and program management Data collection and ARMIS update Analysis and reporting Strategic Planning Annual Planning and Prioritisation Program Delivery Network Performance Assessment 5| 5| Strategic Asset Management Legal Requirements and Stakeholder Expectations Organisational Strategic Plan Strategic Planning Tactical Planning Operational Planning Asset Management Policy Asset Management Strategy Asset Management Plan Operational Plans Service delivery in accordance with asset management plans Knowledge Management Asset data and information systems Asset Management Philosophy and Framework Service Delivery Knowledge Asset Management Planning • Governance processes roles and responsibilities • Current assets, their condition, value and remaining useful life • Current and future funding needs/allocations • Managing the gap Element Management Plans • Targets and level of service • Service delivery through funding to regions Specific Asset Management Plans • For example structure management plans
Transcript of Roads Australia Capacity Chapter Workshoproads.omnisoftware.com.au/Portals/3/Policy/Network...Page 1...

Page 1 of 13
MINUTES
Roads Australia Network Reliability Chapter
Thursday 16 October 2014
Location: TransLink Centre for Service Excellence, 88 Musk Avenue, BRISBANE
Welcome
Roads Australia Policy Manager, Mandi Mees, welcomed Network Reliability Chapter members to the
workshop. Mandi discussed RA’s annual policy alignment session with state road authorities and
provided an update on the Chapter’s work program to date in 2014. This included progress on road
safety, intelligent transport systems for network reliability, value for money and standardising technical
specifications.
ASSET PERFORMANCE AND MAINTENANCE INVESTMENT DECISIONS
Chris Nagel, Program Manager, State Program Office, Infrastructure Management and Delivery
Division, Department of Transport and Main Roads
After a brief reminder of the Queensland Government Priorities and the 30 year plan, Chris introduced
the Department of Transport and Main Roads’ (TMR) Asset Performance Investment Cycle and its
approach to strategic asset management, investment prioritisation, delivery strategies and asset
performance assessment.
Chris discussed how TMR’s approach to total asset management is divided into two investment groups
which are managed through an Element Management Framework, and incorporate 26 elements
(grouped into business programs). The investment groups are:
Maintenance, Preservation and Environment (incl. maintenance rehab, grids, corridors); and
Road Operations (incl. traffic/incident management, route lighting, traveller information).
4 |4 |
Asset Performance and Investment Cycle
Strategic Asset Management
Element Management Planning
Element data collection and
deficiency analysis
Deficiency prioritisation,
funding allocation and
performance targets
Program development
Delivery
Reporting and program management
Data collection
and ARMIS
update
Analysis and
reporting
Strategic
Planning
Annual
Planning and
Prioritisation
Program
Delivery
Network
Performance
Assessment
5 |5 |
Strategic Asset ManagementLegal Requirements and Stakeholder Expectations
Organisational Strategic Plan
Str
ate
gic
Pla
nnin
gTactical
Pla
nnin
g
Opera
tional
Pla
nnin
g
Asset Management Policy
Asset Management Strategy
Asset Management Plan
Operational Plans Service delivery in accordance
with asset management plans
Knowledge Management
Asset data and information
systems
Asset
Management
Philosophy and
Framework
Service
Delivery
Knowledge
Asset M
anagem
ent P
lannin
g
• Governance processes
roles and responsibilities
• Current assets, their
condition, value and
remaining useful life
• Current and future
funding needs/allocations
• Managing the gap
Element Management
Plans
• Targets and level of
service
• Service delivery through
funding to regions
Specific Asset Management
Plans
• For example structure
management plans

Page 2 of 13
Chris described an element as a work activity or work item related to the road system which requires
resources and/or funding to ensure an appropriate level of service is achieved.
To attract funding, Chris explained how each element has an agreed set of performance targets and
fit-for-purpose technical standards attached to them - linked directly with the network investment
requirements/priorities set out in the Asset Management Plan. The aim is provide best practice and
consistency across the state. A road hierarchy is also applied across road funding models.
Chis outlined the key objectives and benefits of an Element Management Framework.
Chris highlighted that Element Management Plans outline data requirements to enable investment
decisions. This data is analysed for deficiencies every year against 20 year performance targets. The
element strategy is published annually.
Chris commented that a lot of funding has been directed towards repairing the network after 3 years of
floods, so the level of funding in the maintenance area is low at the moment. Performance targets have
been set to be appropriate to the funding profile.
TMR use a standard set of data to assess the needs of the network. Chris described the element
investment process that currently involves data collection (working with ARRB), deterioration model,
treatment cost models, treatments, treatment selection framework, economic model (road user costs),
prioritised program of works and performance prediction.
9 |
Element Management Objectives
• Network investment requirements are identified against agreed performance targets and fit-for-purpose technical standards
• Investments are planned consistently across the state-wide road network hierarchy in accordance with prioritised needs
• TMR achieves best technical and delivery practice for each element through research, benchmarking, innovation, quality and efficiency
• TMR achieves effective performance from each element through good governance.
10 |10 |
Element Management Benefits
• Ties allocation to performance
• Provides districts with a rationale for investment
decisions
• Sets network performance targets
• Provides evidence of network need.
13 |13 |
Element Investment Strategies
Summary of the element scope.
For further information, consult the
Element Management Plan, the
Who Pays for What document or
contact the Element Leader
20 year “aspirational” element
performance targets. This level of
performance is generally
unattainable within the current level
of funding, noting TMR’s definition
of “aspirational” is to achieve a
reasonable condition and is actually
modest, as compared to some other
state road authorities
Performance trends against
the 20 year performance
targets
Performance
expectations in
current funding
period
“Aspirational”
target
14 |14 |
Element Investment Strategies
Description of the
rationale for allocating
funds across regions
The achievable
performance
milestones expected
during the QRSPP
period
The expected output
reporting required by
the Element Leader
A summary of the
priority sites as
assessed by the
Element Leader
Page 3 of 13
Trends are assessed against the 20 year performance target and required intervention recognised,
which include optimising the timing of some of the treatments on the network. Output reporting records
what is actually been delivered.
Chris talked about the program delivery space where for most of Queensland’s asset management/
maintenance activity, TMR use road maintenance performance contracts (RMPC). RMPC’s are
specification-driven contracts that have been in place for 12 months. They are predominantly used with
Roadtek and local authorities, and in some cases with private sector maintenance contracts.
TMR use three sectors in program delivery. Local government, private sector and internal provider
(Roadtek) – who work on the delivery of maintenance across Queensland. With the pool of providers,
TMR are seeking to maintain their capability in this sector our ability to respond and that value for
money is being achieved.
Chris explained the journey that began in 2012 with TMR’s road asset management contracts in the
South East Queensland (RAMCs). RAMCs are 5 year contracts that integrate routine maintenance,
programmed maintenance and rehabilitation. They have an asset management focus (include a
stewardship role). They are a combination of scheduled rates and lump sums built on relational
collaborative principles, price competition and assimilated asset performance framework.
Chris explained the starting point and the journey that began in 2012 to move from road maintenance
performance contracts, where client takes all the risk for performance, towards a performance-specified
contract where the sharing of risk is a continuum. At one end the client is taking the risk, except
productivity, and at the other end, the risk is made on performance. Through this process, TMR
considered several nation and international models to integrate asset management strategies into a
single package informed by network data.
The value from this process is to get the feedback from what has been spent on maintenance and take
that information into the asset management space and vice versa, to develop asset management
strategies. The goal is to help minimise maintenance costs and to make sure the right treatment is
applied in the right place. Part of the process was to assess the market appetite for risk.
Chris described some of the learnings from the RAMCs (in place for about 12 months now). Quality
and completeness of network data is essential, and to get information about past performance of the
network.
Transferring the stewardship of the network to the contractor has been a cultural change.
Chris spoke about the right balance of risk sharing and the performance framework that has been built
into the RAMCs with financial implications that kick in from June 2015.
Chris highlighted that collaboration is key, because there are lots of trade-offs in the asset management
and maintenance space. The pot of money doesn’t get bigger, so stewards have to make the right
decisions for the network.

Page 4 of 13
BEST PRACTICE MAINTENANCE: Delivering value and innovation
Brennan Daly, Technical Services Manager, Leighton Contractors
Brennan Daly began by discussing innovation and the
evolving trends within asset management. Brennan
highlighted the need for simplicity when developing asset
management frameworks and showcased the Leighton
Contractors Group Asset Management Model.
Brennan showcased Leighton’s stable of enabling
technology. The aim is to improve the delivery of
maintenance in the field.
Brennan referenced the recent Transmission Gully project
where the 24x7 control system is the operational hub of
activity. The live system effectively integrates the data from many sources, in one place, and includes
a remote interface with a log in for the client.
Timesheets, work orders, forward work planning, dynamic scheduling, event management, safety and
asset data are all managed by the system. The technology is mobile for crews across the network.
The approach has saved 22,600 pieces of paper. Brennan described how the workforce was able to
improve computer literacy to make the change effective, with 92% of hours paid have been logged and
attributed to jobs, representing a great uptake of a new and innovative work process.
Brennan continued by discussing the application of geographic information systems (GIS), not a new
technology, but an effective one to strategise the response to the network.
GIS is often used by Leighton teams in a tender process, for output of the modelling, inspections, high
definition video data capture (archived for later use) and to work out where to place depots in and
around the network for the best response times.
LCPL Group AM Model
Enabling Technology
▪Driven by real time data via our mobile technology solution our OCC is the
24/7 hub of our activities:
• Provide a daily interface with TMC
• Forward planning and safe systems of work
• Allocating and coordinating planned works
• Dispatching incident response resources
• Event management
• Collection of asset data
• Management of defects
• All driven by mobile technology
Operational Control Centre
Enabling Technology
▪ Mobile Technology Solution
• Intuitive portal to access all
processes, procedures and
systems (SOPs, TCPs, SDS)
• Live access to key service data to
enable smart decision making,
planning and prioritisation
• Real-time access to performance
data
• Live reporting for client

Page 5 of 13
Brennan worked quite closely on the Transmission Gully PPP project in Wellington, New Zealand.
Brennan described the terrain and aim of the project. The project resulted because of a study done by
the New Zealand Government to see how major natural events would affect its major cities. It was found
that an earthquake the size of the recent Christchurch earthquake would cause a significant number of
landslides that would take a number of months to re-build. It also found that the airport would be flooded
and the port would be destroyed.
Brennan detailed the four main outcomes that the New Zealand Government wanted to buy – a high
level of safety, continuous improvement, reduced travel time, sustained travel time and high customer
satisfaction. Leighton Contractors went through a process of deciphering the outcomes. Once this
became clear, the solutions began to flow.
Brennan discussed the charge events on the project (safety, unavailability and travel time) and the link
to key performance indicators. The regime provided the principles for bidding for the project
successfully. It also provided the basis for shaping live data on expected trends on the project that can
be shown to teams at depots to proactively improve project outcomes.
Brennan showcased the geotechnical design outcomes, including a proactive rockfall ditch to improve
safety on the project.
Brennan closed the presentation by discussing the services phase where for the next 25 years
application of the ASO55001 operations and maintenance approach uses innovation to integrate
Understanding the network after the client data release
- Client Asset Data Validate & Verification.
- Majority of asset information was missing. What we did receive.
- Receive pavement data (including HDM4 Modelling Data)
- Safety Barriers,
- Signs.
- Bridge data contain in a spreadsheet
- Two Methods we used to Validate and Verify Client data and Capture Missing
Data.
HD Video Data Capture Field GIS Data Capture
What other information we could capture in the GIS
Depot Location Analysis
▪ Design and construct 28km 4 lane motorway (mostly greenfield rural areas):
Project Overview
Works Phase
22
– 5.75 year program
– 30 bridges
– 7 million m3 earthworks & ground
improvement
– 3 grade separated interchanges
– 5.9km of stream diversions
– Intelligent Transport Systems
– Integration into existing transport
management centre
STEEPER SLOPE
HIGHER LIKELIHOOD
OF LOCAL FAILURE
REDUCED TOTAL CUT HEIGHT
-REDUCED SEISMIC AMPLIFICATION
- MINIMISE SLOPE INTERFERENCE
PROACTIVE
ROCKFALL
CAPTURE
1.5 to 2
Geotechnical Design Outcomes
Holistic Road Approach
25
Te Puka Stream Strategy
SECTION A-A
Page 6 of 13
operations, maintenance, construction, design and needs analysis information to deliver effective asset
management services.
A radar traffic monitoring system also provided traffic count, classification, travel time measurement,
incident detection and 24 hour detection to monitor travel time and customer satisfaction.
QUEENSLAND’S ROAD SAFETY PRIORITIES
Mike Stapleton, Acting Deputy Director-General, Infrastructure Management & Delivery
Division, Department of Transport and Main Roads (TMR)
Mike Stapleton reminded members about the Queensland Government’s priorities, the 30-year
Queensland Plan, that the Road Safety Action Plan for the next two years is in development and the
road safety social change agenda.
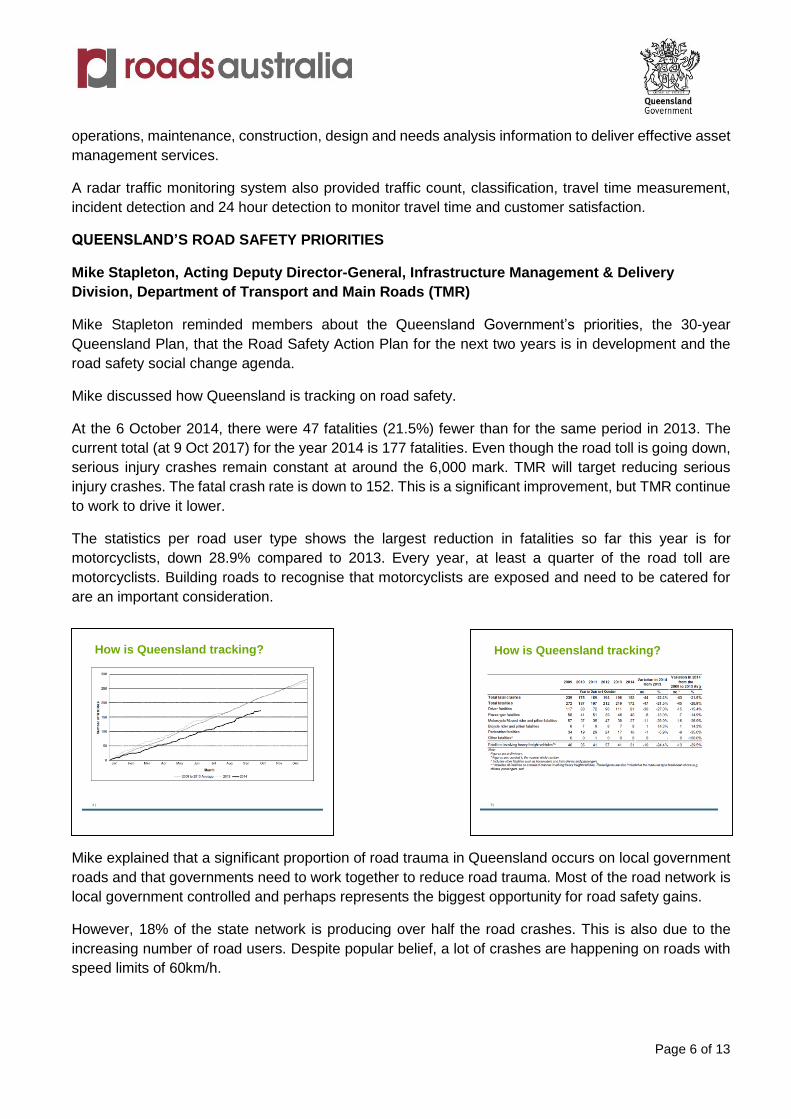
Mike discussed how Queensland is tracking on road safety.
At the 6 October 2014, there were 47 fatalities (21.5%) fewer than for the same period in 2013. The
current total (at 9 Oct 2017) for the year 2014 is 177 fatalities. Even though the road toll is going down,
serious injury crashes remain constant at around the 6,000 mark. TMR will target reducing serious
injury crashes. The fatal crash rate is down to 152. This is a significant improvement, but TMR continue
to work to drive it lower.
The statistics per road user type shows the largest reduction in fatalities so far this year is for
motorcyclists, down 28.9% compared to 2013. Every year, at least a quarter of the road toll are
motorcyclists. Building roads to recognise that motorcyclists are exposed and need to be catered for
are an important consideration.
Mike explained that a significant proportion of road trauma in Queensland occurs on local government
roads and that governments need to work together to reduce road trauma. Most of the road network is
local government controlled and perhaps represents the biggest opportunity for road safety gains.
However, 18% of the state network is producing over half the road crashes. This is also due to the
increasing number of road users. Despite popular belief, a lot of crashes are happening on roads with
speed limits of 60km/h.
4 |4 |
How is Queensland tracking?
5 |5 |
How is Queensland tracking?

Page 7 of 13
Mike described the five essential safety pillars of the Queensland Road Safety Action Plan (launched
in 2013 using safe system principles) as safer roads, safer speeds, safer vehicles, safer road users and
community partnerships – to engage the community more.
Mike detailed the key actions in Queensland on road safety. The Queensland Government will
investment a record $350 million into 82 new and ongoing actions, to reduce the number of crashes in
the short term, and build the foundations for long term improvements in safety on our roads.
The community grant road safety fund has been interesting as the community are well-informed on the
road safety aspects of their local network.
Mike encouraged the room to revisit the road crash data as TMR have improved access to the data.
Mike described incredible achievements to date, half way through the implementation of the
Queensland Road Safety Action Plan.
There has been a significant lift in anti-hooning which is very popular in the community and having a
positive effect. Feedback that is being received is that this is working. Vehicle confiscations have
increased.
Mobile speed camera hours have increased substantially. It is a relatively small program in comparison
to other states, but it is targeted to speed crash locations. Police are more visible on the roads, even to
do simple paperwork tasks. This is also having a positive impact on behaviours on the road.
The work on the Bruce Highway has been outstanding. In any year, 50 people die on the Bruce Highway
and 400 people are hospitalised. This has halved in the last 12 months due to the work going on as
part of the reconstruction, and due to the treatments being used on the Bruce Highway. Mike described
his satisfaction at being able to look at a road corridor and see what TMR is doing on the road corridor
is making a real difference.
The safer roads sooner program is making high priority road safety infrastructure improvements by
identifying areas where serious injuries are occurring and introducing treatments to reduce these
statistics.
The flashing light program has been introduced in over 300 school zones. Drivers appreciate a reminder
that kids are out there as a reminder of the time in which they are travelling through school zones.
8 |8 |
Key actions
By working together we can make a difference
1. $31.2 million per year to local government transport
infrastructure
2. $20 million towards expansion of the SEQ cycle
network
3. $2 million per year to establish a community grants
road safety fund
4. Undertake a state-wide speed limit review.
5. Flashing school zones signs
6. Assist local governments to develop local road safety
strategies and action plans
7. Improved access to road crash data
9 |9 |
Achievements
Half way into the Queensland Road Safety Action Plan and …
We have:
• Introduced strict anti-hooning penalties for individuals who commit two serious offences within five years (penalties include having car confiscated indefinitely, sold or crushed)
• Increased mobile speed camera enforcement to 95,000 hours per year
We are:
• Implementing the highest priority road safety infrastructure improvements identified in Bruce Highway Action Plan
• Delivering the Safer Roads Sooner Program to fast-track improvements at high risk sites
• Installing flashing lights at over 300 school zones (312 installed as of 3 October 2014)
• Implementing the ‘Join The Drive To Save Lives’ social change strategy
• Encouraging local grassroots road safety projects via the Community Road Safety Grants scheme.

Page 8 of 13
Mike described the share the road campaign launched recently. It came about as a result of community
feedback where communities are tired of aggression on the road.
Drivers save lives social change strategy has been an interesting change to watching the conversation
communities are having on social media to respond to road user behaviour. Data is being collected via
the process to understand the truth behind a safety issue on the road.
Recent driver surveys have revealed that people in Queensland that drive 8 or 9 kms over the limit,
don’t think they are speeding. In New Zealand, people drive 13 kms over the limit and don’t think they
are speeding! Each state has a different view on speeding. Government needed to have this
conversation about what is speeding.
Mike discussed where TMR are encouraging a grass roots road safety campaign, by getting groups of
people to target issues. It could be as simple as improving the line marking outside of a school. TMR
make funds available to fix safety problems.
Mike described the ideal world and the reality of the road network. Many roads have evolved from
bullock tracks with limited funding. Targeted spending to improve safety is what TMR are trying to do.
Mike detailed the key crash types on Queensland roads. 36,000 crashes per year happen on the
Queensland road network. About 18,000 serious injury crashes happen per year.
Head on, run off road and intersection are the most high impact groups and are the focus of road
treatment improvement strategy.
To reduce head-on crashes, TMR have applied number of road treatments, such as:
Audio tactile centreline
Wide centreline with overtaking allowed (gives truck drivers more confidence)
Wide centreline with overtaking prohibited (road feels tighter so drivers sow down)
Wide centreline with wire rope barriers (Mike would love to do this more often if it can be
afforded)
Wide median with w-beam or concrete barriers
10 |10 |
Roads – Ideal versus reality
• Ideal world Grade separated intersections
Median divided roads
Median and edge barriers
Segregated facilities for vulnerable road users: pedestrians, cyclists and motorcyclists.
• Reality Most roads have evolved from the
original tracks, not designed from scratch
Funding availability to improve roads is a big issue
Widening roads to provide medians/barriers or duplicate is very costly
Retrofitting safety incrementally using relatively low-cost countermeasures is optimum short/medium term option.
11 |11 |
Queensland’s key crash issues
7%
30%
27%
36%
Key crash types
Head-on crashes Run-off road crashes Intersection crashes Other

Page 9 of 13
TMR did a follow up measure to review the effectiveness of the 1 metre wide centre line treatment. The
arrangement, which was used on the Bruce Highway between Cooroy and Curra, is showing very
positive early results with reductions in serious crashes of 59% (all crashes) to 75% (head on).
30-45% of rural fatalities are due to run off road crashes impacting with an object.
To reduce run off road crashes, TMR have applied a number of road treatments as part of the $10
million per year roadside hazards Mass Action Program, such as:
• Removing hazards (e.g. cleared roadside out 7-8 metres on the Bruce Highway)
• Relocating hazards
• Audio tactile (ATLM) edgelines (particularly for fatigue drivers)
• Safety barriers
• Curve alignment markers on curves
• Motorcycle friendly treatments
To reduce the intersection road crash risk, TMR have applied a number of road treatments, such as:
• Improving intersection layout
• Signalizing intersections
• Removing right turn filters
• Installing channelised right turns
• Vehicle activated signs
• High friction surfacing
Mike detailed the social change agenda as getting away from lecturing and putting the emphasis on
community engagement, where a state wide coalition with the community is developed by equipping
local communities with information.
29 |29 |
Social change strategy
1. Create a connection
2. Equip the community
3. Support actions
• Overarching approach to road safety
• Aims to inform, educate and
influence attitudes and behaviours
• Emphasis on engagement,
participation and involvement of
communities, business and industry
• State-wide coalition.
31 |31 |
Cyclist safety
• Parliamentary enquiry
• 68 recommendations
Data collection
Cycling infrastructure
Education and awareness programs
Review of a number of road rules, penalties and sanctions.

Page 10 of 13
In closing, Mike discussed the minimum passing distance for cyclists trial that require Queensland
motorists to stay wider of the rider by giving a minimum of one metre when passing cyclists in a 60km/h
or less speed zone and 1.5 metres where the speed limit is over 60km/h.
The trial will run for a further eighteen months so an assessment can be made about the rule in terms
of its practical implementation, road user attitudes and perceptions, and impact on road safety.
IMPROVING SAFETY AT ROAD WORK SITES
Brendan Gough, General Manager, Operations and Maintenance, Clem-7 Tunnel
Brisbane Motorway Services
Brendan introduced the parentage of Brisbane Motorway Services and discussed the Lend Lease and
Leighton Contractors joint venture.
Brednan described features of the Clem 7 tunnel, the tunnel environment, the standard work area in
the tunnel for the operations and maintenance team. The Clem 7 tunnel safety systems include:
• 410 cameras
• 2 Ventilation Outlets & 119 Jet Fans
• 18 air quality & visibility monitors –14 internal, 4 external
• Variable speed signs and lane signals
• 93 tunnel message signs at 120m spacings
• Radio re-broadcast & PA
• Emergency phones every 60m
• Strobe lit cross-passages for safe emergency exit every 120m
• Fibre optic heat detection
. There are 2,000 light globes in the tunnel.
14 On and Off Ramps points:
• Woolloongabba: Pacific Motorway and Ipswich Rd
• Kangaroo Point: Shafston Ave
• Bowen Hills: Lutwyche & Bowen Bridge Road, ICB, Airport LinkM7
Standard Work Area
• Nearest
emergency exit
can be up to 120m
away
Two 3.5m lanes
80km/h zone (variable
speed control)

Page 11 of 13
Brendan described incident management in the tunnel. Over 10,000 incidents on the motorway had
been responded to on average within 10 seconds – the KPI requirement 1 minute. The response crew
has also attended over 3,000 incidents on average within 5 minutes – the KPI requirement is 13
minutes.
Maintenance crews have performed over 112,000 maintenance activities, 4,500 of them in live traffic.
Over 1,600 days, safety performance of operations and maintenance activities between BMS staff and
sub-contractors equals zero lost time injury frequency rate.
Brendan discussed the traffic management options for maintenance in the tunnel, and showed a serious
of videos demonstrating road user behaviour leading to incidents in and around the tunnel.
Brendan described the importance of a traffic management plan in tunnels using speed limits. Briefings
on traffic control instructions are given each day in tool box meetings. It is an operational requirement
to be able to communicate by radio and that staff use their location prefixed with “Traffic Control” as
their call sign.
Brendan also discussed safety during shut downs, such as the screening of staff and the importance
of the tunnel control room to have an overview on all site movement and physical controls, such as
boom gates and a gate keeper as a last line of defence and is used to increase safety for operations
and maintenance staff in and around the Clem 7 Tunnel.
Traffic Management Options
Lane Closures
Full Closures
Two way traffic (shared lane)
All vehicles are to enter & exit via Lanham St only during the closure. Unless special permission is granted by BMS management
External ramp speed to be restricted to 10km/hr
30Notes for Vehicle Movement Plan use:
•Barriers will be placed in the no traffic lane at 800meter intervals
•All traffic to remain in slow lane (away from XP’s) unless passing
•Smaller Vehicles to give way to heavy plant & machinery
•Passing speed and travelling in the lane closest to the cross passage is 5km/hr
•Stationary EWP & other plant are to be delineated with traffic cones if stationary for more that 5min.
•Shafston Ave restricted to traffic flow. Exercise extreme caution when entering and reversing on ramp
•Only light vehicles should transit up Shafston Ave due to limited turning circle.
•Drivers of plant and machinery must have a two-way radio
Traffic Controllers in place at all entry points
5
No entry/exit at; Ipswich Rd, Pacific Motorway,
Shaftson Ave Lutwyche Rd, Bowen Bridge Rd ICB East & WestHeavy vehicles may exit via Ipswich Rd. Notify Gatekeeper upon exit.
Vehicle Movement Plan (Southbound)
No traffic movements (except for sweeper and wall washing)
1010
3030
10
5
Traffic Control• WARNING - The northbound tunnel is still carrying live traffic do not
exit any doors marked N01-N41 in the cross passages.
• Sneyd & Campbell St will be closed off nightly between 20:00 and pick up after 22:30 - Anyone exiting the tunnel after 22:30 please use extreme caution as there is live traffic on Sneyd and Campbell st
• Traffic controllers positioned at all southbound tunnel entry points anyone requiring to conduct maintenance beyond the Traffic controllers staging point must have a mechanical device to protect them.(Traffic control Ute or TMA)
• Barriers will be placed on the median strips in the northern portal area. No one is permitted to remove barriers & or access through to the NB lane from this area.
• Traffic cones will be placed at all southbound exits at Shafston Ave, Pac Mwy and Ipswich Rd - If anyone requires to move them please replace them.

Page 12 of 13
Staff training is an important component of safety for operations and maintenance in the Clem 7 Tunnel.
Brendan detailed the staff training program for operators and the response crew. Including practical
training such as field exercises and virtual emergency simulation training.
In closing, Brendan highlighted the key aspect for site safety at Brisbane Motorway Services is sub-
contractor selection, briefing and monitoring, and ongoing staff training.
Conclusion
Roads Australia Policy Manager, Mandi Mees, closed the meeting by inviting AAPA to promote the upcoming national workshop series on safety at road works, remarking on the growing sophistication of asset management strategy and highlighting evidence of where strong client requirements are generating innovation in industry. Please refer to the following page for a list of participants at the workshop.
Staff Training
Operators•3 month Initial Training Programme
•Monthly skill competency assessment
•Annual task book
•Virtual Emergency Simulator Training
•6 monthly desk top exercises
•Bi-annual field exercises
•Cert IV Traffic Operations - Road Tunnels
•First Aid
•Licensed Traffic Controller
•Traffic Mgt Lev 1 – Work on Roads
•Traffic Mgt Lev 2 – Implement Traffic Control
•General Construction Induction
• C Class Drivers License
•General and First Response Fire Fighting
Response Crew•3 month Initial Training Programme
•Monthly skill competency assessment
•Operator Mentoring Programme
•Spill Management
•Virtual Emergency Simulator Training
•6 monthly desk top exercises
•Bi-annual field exercises
•Cert III – Driving Operations
•First Aid
•Licensed Traffic Controller
•Traffic Mgt Lev 1 – Work on Roads
•Traffic Mgt Lev 2 – Implement Traffic
•General Construction Induction
•MR Class Drivers License
•General and First Response Fire Fighting
Practical Training
• Field Exercises
September 2010 Field
Exercise – vehicle accident
involving fire and
entrapment with associated
tunnel evacuation.
March 2010 Field
Exercise – vehicle
accident involving
dangerous goods.
September
November 2012
Field Exercise –
vehicle accident
involving
entrapment, bus
fire and tunnel
evacuation
August 2013 – Joint
exercise 2nd
Commando/
Queensland Police
Service/Brisbane Motorway Services

Page 13 of 13
Participants
First Name Surname Organisation Title
Shalendra Ram AECOM Business Development Manager - Transportation
Ross Armitage AECOM Principal Civil Engineer
Rick Lewis Altus Traffic Regional Manager | QLD & NSW
Darryl Coalter APP Corporation Qld Manager - Infrastructure
Mark Robison Aurecon Technical Director Transport Services
Gavin Chadbourn Aurecon AM Coordinator
Troy Dunne Aurecon Contract Manager
Peter Lossberg Aurecon Engineer
Rob Vos Australian Asphalt Pavement Association State Executive Office - Queensland
Brendan Gough Brisbane Motorway Services General Manager – Operations and Maintenance – Clem7
Joseph Lin BrisConnections Operations & Maintenance Engineer
Brett McClurg Cardno Manager Traffic & Transport Group (Qld)
John Peace Cardno Senior Traffic Engineer
Ashim Debnath CARRS-Q Research Fellow - Faculty of Health, School - Psychology and Counselling
Kevin Mills CMC Business Development Manager
Andrew Golding Department of Transport and Main Roads Director (Transport System Asset Management)
Christine Brindley Department of Transport and Main Roads Principal Engineer (Maintenance) | North Coast District | Maroochydore Office
Alistair Culley Department of Transport and Main Roads
Senior Engineer | North Coast District Maroochydore Office Program Delivery And Operations
Karen Peut Department of Transport and Main Roads Executive Director (Strategic Investment & Asset Management)
Maria Tegan Department of Transport and Main Roads Manager (Environment)
Chris Nagel Department of Transport and Main Roads Program Manager (Statewide Programs)
Mike Stapleton Department of Transport and Main Roads Acting Deputy Director General Infrastructure Management and Delivery
Donna Brand Fulton Hogan Safety Superintendent
Russell Hood Hill and Smith Asia Pacific General Manager
David Moule Hill and Smith Business Manager
Brett Wells Ingal Civil Products QLD State Sales Manager
Bob Smith Leighton Contractors NSW Operations Manager Investment & Facility Management
Brennan Daly Leighton Contractors Manager Strategic Projects Services Division
Kevin Catling Leighton Contractors Area Manager | Construction
Paul Musgrave Lend Lease Services Operations Manager Roads
Travis Gilbertson Opus International Consultants Transportation Asset Management Sector Leader Australia
Susan Furze RACQ Senior Transport Economist
Mandi Mees Roads Australia National Policy Manager
Michael Watts Transmax Business Development Director
Jan Soer-Reime Transmax Account Manager
Mark Johnson Transmax Principal Consultant
Richard Dunstan URS Associate
Atiyeh Vaezipour Queensland University of Technology Researcher