RIVER RESTORATION DECISION ANALYSIS - 2D HYDRODYNAMIC ... · PDF fileRIVER RESTORATION...
12
RIVER RESTORATION DECISION ANALYSIS - 2D HYDRODYNAMIC APPROACH TO PROJECT PRIORITIZATION David J. Bandrowski, Trinity River Restoration Program, U.S. Bureau of Reclamation, Weaverville, CA, USA, [email protected]; Yong G. Lai, Technical Service Center, U.S. Bureau of Reclamation, Denver, CO, USA, [email protected]; D. Nathan Bradley; Technical Service Center, U.S. Bureau of Reclamation, Denver, CO, USA, [email protected]; Josh Murauskas, Anchor QEA LLC, Wenatchee, WA, USA; [email protected] Abstract: In the field of river restoration sciences there is a growing need for analytical modeling tools and quantitative processes to help identify and prioritize project sites. Two- dimensional (2D) hydraulic models have become more common in recent years and with the availability of robust data sets and computing technology, it is now possible to evaluate large river systems at the reach scale. The Trinity River Restoration Program (TRRP) – Bureau of Reclamation in Northern California is now analyzing a 40 mile segment of the Trinity River to determine priority and implementation sequencing for its Phase II channel rehabilitation projects. A comprehensive approach and quantitative tool has recently been developed to analyze this complex river system. The 2D-Hydrodynamic-Based Logic Modeling (2D- HBLM) tool utilizes various hydraulic output parameters combined with biological, ecological, and physical metrics at user-defined spatial scales and flow discharges to evaluate geomorphic characteristics, riverine processes, and habitat complexity. The habitat metrics are integrated into a comprehensive Logic Model framework to perform statistical analyses to assess project prioritization. The Logic Model will analyze various potential project sites within the 40 mile restoration reach by evaluating connectivity and key response variable drivers. The 2D-HBLM tool will help inform management and decision makers by using a quantitative process to optimize desired response variables with in determining the highest priority locations within the river corridor to implement restoration projects. Keywords: 2D Hydraulic Modeling, Quantitative Prioritization, Evaluation Metrics, Logic Modeling, Statistical Analysis, and River Restoration INTRODUCTION Effective river restoration prioritization starts with well-crafted goals that identify the biological objectives, address underlying causes of habitat change, and recognize that social, economic, and land use issues may constrain restoration options (Beechie et. al. 2008). In addition, effective management actions need to be tied to a Structured Decision Making (SDM) process that connects decisions to objectives (Hammond et al. 1999, Clemen and Reilly 2001). Applying natural resources management actions to the SDM process, like restoration prioritization, is essential for successful project implementation (Conroy and Peterson, 2013; Evers, 2008). This paper describes a river restoration prioritization approach that integrates two-dimensional (2D) hydraulic modeling with desired response and limiting factor metrics into a statistical model framework. This river restoration tool, referred to as two-dimensional hydrodynamic-based logic modeling (2D-HBLM), will analyze and evaluate key biological, physical, and ecological desired responses in relation to various physical and social constraints that may limit restoration options. In this paper, we will demonstrate how this approach can be effectively applied to a large river restoration program to help prioritize projects systematically and objectively.
Transcript of RIVER RESTORATION DECISION ANALYSIS - 2D HYDRODYNAMIC ... · PDF fileRIVER RESTORATION...
RIVER RESTORATION DECISION ANALYSIS - 2D HYDRODYNAMIC
APPROACH TO PROJECT PRIORITIZATION
David J. Bandrowski, Trinity River Restoration Program, U.S. Bureau of Reclamation,
Weaverville, CA, USA, [email protected]; Yong G. Lai, Technical Service Center,
U.S. Bureau of Reclamation, Denver, CO, USA, [email protected]; D. Nathan Bradley;
Technical Service Center, U.S. Bureau of Reclamation, Denver, CO, USA,
[email protected]; Josh Murauskas, Anchor QEA LLC, Wenatchee, WA, USA;
Abstract: In the field of river restoration sciences there is a growing need for analytical
modeling tools and quantitative processes to help identify and prioritize project sites. Two-
dimensional (2D) hydraulic models have become more common in recent years and with the
availability of robust data sets and computing technology, it is now possible to evaluate large
river systems at the reach scale. The Trinity River Restoration Program (TRRP) – Bureau of
Reclamation in Northern California is now analyzing a 40 mile segment of the Trinity River
to determine priority and implementation sequencing for its Phase II channel rehabilitation
projects. A comprehensive approach and quantitative tool has recently been developed to
analyze this complex river system. The 2D-Hydrodynamic-Based Logic Modeling (2D-
HBLM) tool utilizes various hydraulic output parameters combined with biological,
ecological, and physical metrics at user-defined spatial scales and flow discharges to evaluate
geomorphic characteristics, riverine processes, and habitat complexity. The habitat metrics
are integrated into a comprehensive Logic Model framework to perform statistical analyses to
assess project prioritization. The Logic Model will analyze various potential project sites
within the 40 mile restoration reach by evaluating connectivity and key response variable
drivers. The 2D-HBLM tool will help inform management and decision makers by using a
quantitative process to optimize desired response variables with in determining the highest
priority locations within the river corridor to implement restoration projects.
Keywords: 2D Hydraulic Modeling, Quantitative Prioritization, Evaluation Metrics, Logic
Modeling, Statistical Analysis, and River Restoration
INTRODUCTION
Effective river restoration prioritization starts with well-crafted goals that identify the
biological objectives, address underlying causes of habitat change, and recognize that social,
economic, and land use issues may constrain restoration options (Beechie et. al. 2008). In
addition, effective management actions need to be tied to a Structured Decision Making
(SDM) process that connects decisions to objectives (Hammond et al. 1999, Clemen and
Reilly 2001). Applying natural resources management actions to the SDM process, like
restoration prioritization, is essential for successful project implementation (Conroy and
Peterson, 2013; Evers, 2008). This paper describes a river restoration prioritization approach
that integrates two-dimensional (2D) hydraulic modeling with desired response and limiting
factor metrics into a statistical model framework. This river restoration tool, referred to as
two-dimensional hydrodynamic-based logic modeling (2D-HBLM), will analyze and
evaluate key biological, physical, and ecological desired responses in relation to various
physical and social constraints that may limit restoration options. In this paper, we will
demonstrate how this approach can be effectively applied to a large river restoration program
to help prioritize projects systematically and objectively.

All too often restoration actions are site specific without considering and evaluating
ecosystem scale processes, protection of existing high quality habitats, or an understanding of
the effectiveness of specific restoration techniques (Roni et. all. 2002). With over two
decades of scientific literature and applied practice, the restoration community has a thorough
understanding of the role of channel morphology in the formation of physical habitats
(Montgomery and Buffington 1998) and the relationship between flow depth and velocity and
habitat quantity and quality (Singh 1989, Lamouroux 1998, Stewart et. al. 2005, Saraeva and
Hardy 2009, Goodman et. al. 2014). The understanding of geomorphic processes and
physical habitats have been integrated into models to assess hydraulic relationships
quantitatively (Schweizer et. al. 2007, Dunbar et. al. 2012) and eco-hydraulic questions
through prediction-based simulations (Bovee 1982, Gore et. al. 1998, Milhous et. al. 1989).
Model utilization requires restoration science not only to embrace uncertainty (Darby and
Sear 2008, Hillman et. al. 2008, Wheaton et. al. 2008), but to integrate bio-physical diversity,
variability, and complexity into river management (Brierley and Fryirs 2008). Evaluating
tradeoffs and examining alternatives to improve fish habitat through optimization modeling
(Null and Lund, 2012) is not just a trend but rather the scientific strategy that management
needs to embrace and apply in its decision framework.
The overall approach of this reach-based prioritization is to evaluate the river system through
integration of 2D hydraulic modeling, quantitative metric evaluation, and statistical logic
modeling within a broader adaptive management and SDM framework. The topics described
below include: an overview of 2D hydraulic modeling, the application of the 2D model to the
Trinity River, the development of the habitat module quantitative metrics, and the approach
to the logic model framework.
OVERVIEW OF 2D HYDRAULIC MODELING
Stream flow modeling is one of the most widely used tools to understand how hydraulic
conditions change between discharges and how they are related to fish habitat (Bovee, 1982;
Milhous et al., 1989). Building on the early use of one-dimensional (1D) models, 2D
hydrodynamic modeling has been widely used for evaluating hydraulic habitat data (e.g.
water depth, water velocity, and substrate size). 2D models can be operated on a finer scale
than 1D models and they can accurately predict hydraulics in near-shore habitat and across
large-scale roughness features (Waddle et al., 2000). 2D models can more accurately predict
water velocities and depths at local scales due to the ability to calculate both longitudinal and
lateral velocity distributions (Crowder and Diplas, 2000). Sample applications of 2D
hydrodynamic models for habitat evaluation include Tharme 2003), Wheaton et al. (2004),
Stewart et al. (2005), Mingelbier et al. (2008), Yarnell et al. (2010), Waddle (2010), and
Hatten et al. (2013).
In recent years, the trend has been to use a 2D model to represent the roughness elements at
the individual boulder scale (e.g., Waddle, 2010), because riverine salmonid species are
known to use flow obstructions as velocity shelters in order to minimize energy expenditure
while foraging and resting (Bjornn and Reiser, 1991). Boulder placement and the use of large
wood are techniques of river restoration commonly used to provide increased diversity of
velocity patterns in generally uniform river channels. Accurate modeling of such areas can
provide better information about the extent of habitat in rivers and tools for design of
constructed habitats.

In this study, we use the U.S. Bureau of Reclamation’s Sedimentation and River Hydraulics
Two Dimensional depth averaged hydraulic model (SRH-2D). SRH-2D, documented by (Lai
2008; Lai 2010), has been widely used for evaluation of river projects. The robustness and
accuracy of SRH-2D have been proven with a wide range of model verifications, as well as
many project applications, at both Reclamation and external institutions. SRH-2D has a few
unique features which make it ideal for river applications. First, SRH-2D uses a flexible mesh
that adopts the arbitrarily shaped element method of Lai et al. (Lai, 2003) for geometric
representation. In practice, a hybrid mesh normally uses quadrilaterals in the main stream and
near structures and triangles in the floodplain and transition zones. The hybrid mesh achieves
the best compromise between accuracy and computing efficiency and such a mesh is
relatively easy to generate. Second, SRH-2D adopts very robust (stable) numerical schemes
with a seamless wetting-drying algorithm. Reliable solutions may be obtained with the
primary tuning parameter of Manning’s n. Third, SRH-2D solves the 2D depth-averaged St.
Venant dynamic-wave equations using an implicit solution scheme and unstructured meshes
with arbitrary mesh cell shapes. It solves both steady and unsteady flows over all flow
regimes (subcritical, supercritical or transcritical flows).
APPLICATION OF THE 2D MODEL ON THE TRINITY RIVER
The Trinity River is an ideal location for an applied scientific assessment of a reach based
model due to the wealth of robust data sets that span large spatial and temporal scales. The
Trinity has been monitored consistently for decades and has been surveyed at high resolution
as required for two dimensional hydraulic modeling. A seamless Digital Terrain Model
(DTM) that integrates terrestrial and bathymetric topography is the basis of the 40 mile
hydraulic model. The DTM for the Trinity consists of airborne LiDAR topography and boat-
based sonar bathymetry across the entire reach (Woolpert, 2013) that has been validated
within 95% vertical confidence intervals using 0.320-foot RMSEz (Root Mean Square Error)
for LiDAR and +/-0.686-foot RMSEz for sonar. This validated accuracy is based on
extensive quality control field measurements consisting of 40 channel spanning cross-
sections and 849 independent GPS-RTK check shots along the Trinity. The DTM has been
certified by a professional licensed land surveyor and exceeds both National Map Accuracy
and American Society of Photogrammetry and Remote Sensing (ASPRS) Standards.
In addition to topographic data sets, aerial imagery orthophotography has been collected in
multiple years and serves as the foundation data set for geospatial mapping on many projects
including the 2D hydraulic model mesh generation. Two model meshes were developed for
this project: a coarse mesh to use for model calibration (the calibration mesh) and a denser
mesh to use for the actual assessment (the habitat mesh). Both meshes are hybrid meshes that
use rectangular elements in the main and side channels and triangular elements in areas that
are dry at most flows. The calibration mesh contains one quarter the number of elements as
the habitat mesh across the 40 mile reach on the Trinity River.
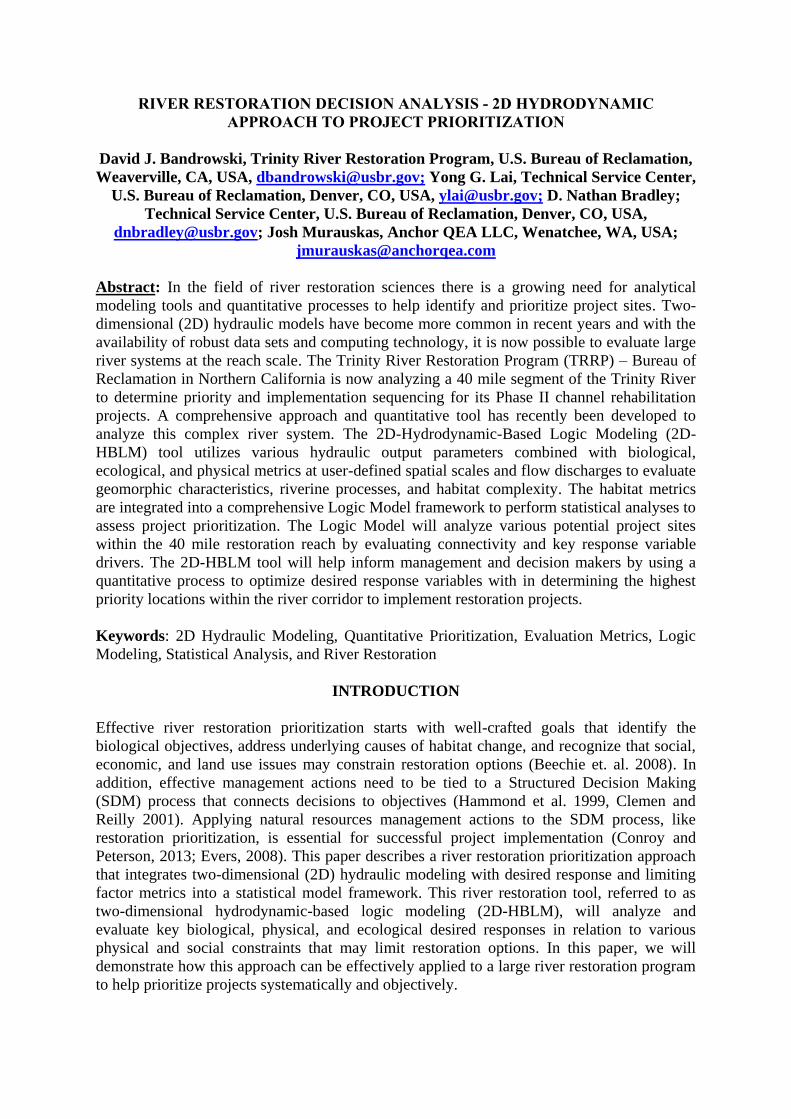
The calibration mesh was developed from channel bank lines digitized from the aerial
imagery data set (Figure 1). The complexity and curvature of the channel dictated the length
of elements in a reach. Long straight reaches contain longer elements, Tight bends and areas
of complex morphology contain shorter elements.
The width of main channel mesh elements is 1/8 of the local channel width. Side channel
mesh elements are 1/3 of the local side channel width. Calibration mesh elements range from
approximately 10 to 50 feet in length and 5 to 25 feet in width. The mean area of calibration
mesh elements is 284 square feet.
Figure 1 Comparison of the calibration mesh (left) and the habitat mesh (right)
The habitat mesh was developed by dividing each calibration mesh element into four
elements. Channel elements in the habitat mesh range in width from approximately 1 foot to
10 feet. The mean area of habitat mesh channel elements is 71 square feet.
The sole calibration parameter available in SRH-2D is the channel roughness, represented by
Manning’s n. Increasing channel roughness by increasing the value of Manning’s n has the
effect of raising the water surface elevation and reducing the flow velocity. Decreasing
channel roughness has the opposite effect. The calibration data we used are water surface
elevations measured during the bathymetric survey at seven different discharges ranging from
500 cfs to 4500 cfs. About 91% of the model error (modelled elevation minus observed
elevation) is within +/- 0.5 feet and the error is symmetrically distributed around zero. This
error is similar to the error in the bathymetric data collection.
HABITAT MODULE QUANTITATIVE METRICS
The 2D hydraulic model was run for approximately 20 different discharge cases, ranging
from 300 cfs to 14,000 cfs. The hydraulic output of the 2D model is used by a tool called the
“Habitat Module to evaluate riverine characteristics using a series of biological, ecological,
and physical criteria. The Habitat Module uses quantitative algorithms to calculate key
hydraulic variables or “metrics” throughout the river. The metrics are grouped into three
spatial output types: 1) Panel-Based “Panel”; 2) Cross-Sectional; and 3) Spatially Distributed
- across the mesh elements. For this study, the Panel output was the primary type used. The
Panels are 200 meter long and are based off a sampling protocol system currently being used
on Trinity for system wide monitoring called Generalized Random Tessellation Stratification
(GRTS). Across the entire 40 mile reach, there are 319 Panels from upstream to downstream.
The Panel system was used to help organize the hydraulic output and metrics into a uniform
system to which further statistical analyses can be applied.
The metrics calculated from the hydraulic model are categorized into three types: Biological,
Ecological, and Physical. The other types of information used were field collected empirical
data from the Trinity. Table 1 below shows all the available metrics calculated and empirical
data that was field measured.

Table 1 Evaluation Metrics from SRH-2D Habitat Module
Metrics calculated from the 2D Hydraulic Model (habitat module) Empirical Data
Physical Biological/Ecological Ecological Field Collected Depth Depth/Velocity (DV) -Fry Habitat Suitable Area for
Riparian
Regeneration
Redd Locations
Velocity Cover (C) -Fry Habitat River Bed
Topography Bed
Elevation Data
(Bathymetry)
Water Surface Depth/Velocity -Pre Smolt Habitat
Wetted Edge Length Cover -Pre Smolt Habitat Elevation (Delta)
Difference between
Water Surface and
Adjacent
Topography
Shear Stress (avg, StD, etc.) Depth/Velocity/Cover (DVC) for both
Fry and Pre Smolt Habiat Stream Power Bedrock Features
Vorticity Adult Holding Habitat Tributaries
Flow Direction/Crossover Weighted Usable Area (WUA) for Fry
and Pre Smolt Habitat – Based on
Above Habitat Suitability Criteria
(HSC)
Land Ownership
Wetted Area/Wetted XS Wetted Edge Infrastructure:
including roads,
bridges, houses, etc Sinousity and Thalwag Wetted Area
Width/Depth Ratio
Physical Metrics: Restoration activities on the Trinity River include flow and sediment
management intended to promote the dynamic fluvial processes that create diverse physical
habitat and rejuvenate the aquatic ecosystem. The physical process metrics used in this study
were developed to help quantify the existing geomorphic complexity within each Panel. The
fluvial processes involved in the maintenance of high-quality habitat are tightly linked to
sediment supply and sediment transport capacity. Scour and fill processes, in which the
elevation of the steam bed or bar surface changes dynamically through time, create
topographic complexity, maintain substrate quality, and rejuvenate riparian vegetation.
Lateral erosion of the banks facilitates planform adjustment and contributes to the formation
of alcoves, sloughs, and complex bar features. Although the habitat module cannot address
questions about sediment supply, its output includes several metrics intended to assess the
spatial variability of sediment transport capacity and geomporhic complexity within each
Panel. Shear stress and stream power metrics within each Panel represents the rate of energy
dissipation against the bed and banks of a river, which can be used as an indicator of local
sediment transport capacity. Using the first derivative of the shear stress can provide an
additional metric, which helps determine if the stress in the Panel is increasing or decreasing,
providing an indication of where local scour or fill might be expected. The Vorticity metric
calculates the angular velocity of a fluid particle and is a kinematic property of the flow field
which as a measure of river complexity.
Additional physical metrics include: Flow Direction Change Hydraulic Cross-Over, Wetted
Edge Length, Sinousity, Thalweg, etc. For example, Edge Length is the total length of wet-
dry boundaries within a panel and reflects complexities of flows around islands, boulders, etc.
Various physical metrics can be combined into one representative metric to compare and
evaluate the system-wide geomorphic potential or its overall physical complexity at
applicable flow discharges. Assessing these metrics in combination can be accomplished
using a statistical approach called Principal Components Analysis (PCA). A PCA is used to
model variation within a set of metrics to produce a smaller number of independent linear
combinations (i.e., principal components; JMP ® 11, SAS Institute, Cary, North Carolina).
The first principal component of variables related to geomorphic potential at 6,000 cfs—
including velocity, average bed shear stress, average first derivative of shear stress, and
stream power—was derived to show the most prominent direction of these metrics using a
single variable.

Biological Metrics: A deficit of juvenile rearing habitat has been identified as the primary
limiting factor of salmonid populations in the Trinity Rivr and many other rivers. Fry and
Pre-smolt critical rearing habitat is computed from the hydraulic model output using Habitat
Suitability Criteria (HSC) of derived Depth (D), Velocity (V), and Cover (C). These HSC
values were developed for the Trinity River specific to the life stage and species (Goodman et
al. 2014). The metric for rearing habitat is fry and Pre Smolt area is based on meeting the
depth and velocity combinations (DV) and cover requirements determined by field validated
HSC values. The cover criteria are based on field-derived values of suitable distance to
vegetation, wood, or other escape cover. The HSC values serve as an index or value range to
determine if the habitat is within suitable desirable criteria range for rearing habitat. (See
Table 2 below)
Table 2 Trinity River binary habitat suitability criteria from Goodman et al. (2014)
Life stage Depth Velocity Cover
Fry (< 50 mm fork length) ≤ 0.6 meter ≤ 0.15 meters/second ≤ 0.6 meters
Presmolt
(50 to 100 mm fork length) ≤ 1.0 meter ≤ 0.24 meters/second ≤ 0.6 meters
The Weighted Useable Area (WUA) metric is a method of combining the scores from the
above HSC data for depth, velocity, and cover to evaluate the quality of habitat at a range of
values rather than using a binary approach of index cut-off values. WUA habitat values were
the primary metric used for the evaluation of biological quality throughout the Trinity system.
APPROACH TO THE LOGIC MODEL FRAMEWORK
The objective of the Logic Model is to assimilate professional judgment, 2D modeling
outputs, and empirical data to objectively prioritize restoration projects. Once the hydraulic
variables and metrics are calculated within the habitat module and synthesized for each of the
319 Panels. The Logic Model is the component within the 2D-HBLM process that analyses
the data statistically and links desired responses with limiting factors to prioritize areas of the
river for restoration. Quantitative approaches have long been recognized as a key to
improving processes (Box and Myer 1986). Modeling, hierarchical ordering of effects, and
identifying key relationships and root causes for deficiency is commonplace in manufacturing
(Harry and Schroeder 2006) and increasingly in biological sciences (Dassau et al. 2006;
Huang et al. 2009). The Logic Model utilizes such approaches to assess key measures and
relationships followed by integration of desired responses and limiting factors to inform
prioritization.
Measures used in the Logic Model include physical, biological, and ecological based metrics,
along with metrics from empirical data selected using professional judgment prior to analysis.
Desired responses include improvements to the quality, connectivity, and complexity of
salmonid habitat (Roni et al. 2002). Conversely, limiting factors constrain the ability to
implement restoration projects (e.g., access or infrastructure). The distinction between desired
responses and limiting factors is important in that the Logic Model is intended to prioritize
restoration projects where the need, relative benefit, and practicality are optimized.
Data used in the Logic Model were examined prior to statistical modeling. Both desired
responses and limiting factors were reduced to a set of uncorrelated variables using Principal
Component Analysis (SAS Institute 2008). This step minimizes the issue of multi-collinearity

in further analyses, particularly with predictor variables (Saab 1999). Desired responses and
limiting factors were further analyzed for spatial autocorrelation since standard statistical
techniques assume independence among observations. For example, preliminary evaluations
show that suitable fry habitat has a partial autocorrelation with at least the two preceding
panels at 4500 cfs. Quantitative approaches used in the Logic Model compensate for the
relationships among neighboring panels to ensure that parameter estimates and significance
tests yield reliable results (Isaak et al. 2010).
Five metrics were ultimately chosen to be used in the Logic Model analysis to represent
biological quality, connectivity, and river complexity, see Table 3 below. Biological quality
was defined as the habitat calculated from the weighted usable area (WUA) at winter base
flow (300cfs) and at a typical spring flow (1500cfs). Connectivity was defined by the total
number of redds observed within each panel and three upstream panels (i.e., a running total of
four panels). Complexity was defined by the standard deviation of bed elevation and the
standard deviation of stream power at 8,500 cfs. Each panel was ranked relative to the
remaining panels (1 to 319) for all five metrics, with ascending ranks for habitat quality and
complexity and descending ranks for connectivity (redds). Thus, panels with low WUA
values, low variation in complexity, and proximity to a large number of redds would receive
lower rankings across the five metrics.
Table 3 Weighting of Metrics Used in the Logic Model in Panel Scoring
Metric Category Weight Relative
influence Rearing Habitat at 300 cfs rank Habitat Quality (Low Flow) 1.50 0.333
Rearing Habitat at 1,500 cfs rank Habitat Quality (Mid Flow) 1.00 0.222
Total spawning redds (upstream 3 Panels) rank Biological Connectivity 1.00 0.222
Standard Deviation of bed elevation (m) rank Topographic Complexity 0.50 0.111
Standard Deviation of unit stream power (8,500
cfs) rank
Hydraulic Complexity 0.50 0.111
Panels were scored by summing the total ranks across the five metrics, with each metric
weighted according to values shown in Table 3. For example, habitat rank at 300 cfs with
median accretion has a weighting of 1.50 (33.3% influence), whereas the standard deviation
of bed elevation has a weighting of 0.50 (11.1% influence). Each increase in habitat rank and
standard deviation of bed elevation rank, therefore, represents a corresponding increase of
1.50 and 0.50 in the total score, respectively. Scores were then scaled relative to the least
desirable candidate for a restoration action (i.e., highest score). Scores for each panel,
therefore, represent existing habitat quality with the influence of connectivity to spawning
habitat and measures of river channel complexity.
Scores across multiple panels were then analyzed to identify segments of the river most
suitable for restoration action. First, a cluster analysis (performed by USFWS) was used to
identify regions of similar scores that were spatially grouped based on statistical principles
from Aldstadt and Getis (2006) and Ord and Getis (1995). The cluster analysis provides a
mechanism to evaluate areas desirable for restoration irrespective of arbitrary ESL
boundaries. A total of 150 spatially-related clusters of similar scores were identified. The top
ten clusters of ascending desirability for restoration action are shown in Table 4 and in Figure
3 below. In addition, these results eliminate any clusters that have less than three adjacent
Panels to remove any locations that contain areas that is not practical for restoration actions.

Note: The deeper the color is red the more desirable that location is for restoration; deeper the color is blue the
less desirable that location is for restoration. Numbers represent cluster ID that is referenced in the tables below
Figure 2 Map of the new cluster analysis results compared with the old ESL boundaries.
Table 4 Trinity River ESL Segments Ranked by Ascending Desirability for Restoration
Geographic Location Evaluation Metric
Mean
Panel
Ranking
Additional Considerations for Ranking
ESL Name Rea
ring H
abit
at
(300cf
s)
Rea
ring H
abit
at
(1500 c
fs)
Tota
l R
edd
s
(Upre
ra 3
pan
els
)
SD
of
Bed
Ele
vat
ion (
m)
SD
of
Unit
Str
eam
Pow
er (
8,5
00
cfs
)
Mea
n S
core
Per
cent
Pu
bli
c
Ow
ner
ship
Ad
jace
nt
Ro
ad
Len
gth
Bed
rock
Are
a
Topogra
phic
Con
stra
int
Geo
morp
hic
Po
tenti
al
Chapman Ranch 85 77 154 69 125 38.3% 71% 2,570 0 4.52 -0.46
Below Lorenz (the canyon) 70 59 121 241 217 43.2% 58% 2,675 1,084 15.74 1.96
Dutch Creek 103 135 97 149 124 44.0% 72% 723 181 7.57 -0.38
Pear Tree Gulch 86 64 173 215 108 44.2% 100% 1,354 166 11.95 0.29
Soldier Creek 115 88 150 171 121 47.0% 87% 1,151 0 12.39 0.05
Indian Creek (Vitzthum
Gulch) 111 115 182 196 103 51.6% 64% 2,201 0 7.87 -1.54
Sky Ranch 134 132 97 168 211 52.2% 55% 4,464 45 6.34 0.83
Tom Lang Gulch 124 104 176 138 188 52.9% 14% 4,426 0 14.59 -0.44
Oregon Gulch 179 177 105 96 114 55.2% 60% 3,182 0 3.80 -0.45

Table 4 above, also shows the mean Panel ranking for the five Logic Model metrics along
with mean feasibility metrics shown for evaluation. Colors are shaded from red (low scores)
to green (high scores) according to ranking scheme described in the approach.
In addition, mean scores were provided across project boundaries (ESLs) to provide context
in how river segments used in past evaluations rank under this approach. Metrics judged to be
important for assessing project feasibility were calculated based on both clusters and ESLs.
These included percent public ownership, road length, bedrock area, topography, and
geomorphic potential (the first principal component of velocity, average bed shear stress,
average first derivative of shear stress, and stream power at 6,000 cfs). An example of mean
feasibility metrics for the identified clusters is shown in Table 5. These metrics are intended
to provide additional detail for management’s consideration when making final decisions for
selecting and prioritizing restoration sites.
Table 5 Top Ten Panel Clusters Ranked by Ascending Desirability for Restoration
Cluster ID
Number of
Panels
Included
Mean Score Associated Upstream Project Area (ESL)
96 3 28.7% Dutch Creek
92 19 35.2% Below Lorenz (the canyon)
104 7 35.6% Chapman Ranch
150 7 38.6% Pear Tree Gulch
60 5 40.2% Indian Creek (Vitzthum Gulch)
102 4 40.5% Soldier Creek
114 3 41.3% Oregon Gulch
94 6 42.7% Dutch Creek
118 7 45.4% Sky Ranch
31 4 46.8% Tom Lang Gulch
Note: See Figure 2 Below for Geographical Representation of the information in this Table
Table 6 Example of Mean Feasibility Metrics Associated with Clusters
Cluster
ID
Associated
upstream ESL
Percent
Public
Ownership
Road
Length
(ft)
Bedrock
Area
(ft3)
Topography
(ft3 × 10
6)
Geomorphic
potential
(PCA)
96 Dutch Creek 52% 3,719 0 4.6 -0.38
92 Below Lorenz
(the canyon) 52% 2,871 1,332 15.8 1.30
104 Chapman Ranch 68% 2,335 0 5.8 -0.52
150 Pear Tree Gulch 100% 2,008 225 12.8 -0.26
60 Indian Creek
(Vitzthum Gulch) 89% 1,746 0 7.9 -1.59
102 Soldier Creek 93% 1,052 0 13.3 0.18
114 Oregon Gulch 54% 2,232 0 3.8 -1.43
94 Dutch Creek 77% - 11 6.3 -0.63
118 Sky Ranch 56% 4,864 153 6.3 0.71
31 Tom Lang Gulch 6% 5,326 0 14.5 -0.70

SUMMARY
The 2D-HBLM process of combining 2D hydraulic modeling output with evaluation metrics
and statistical tools is helping bridge new gaps and provide more ways to inform river
restoration practitioners and managers. Integrating this model with Adaptive Management
Processes and Decision Support Systems can provide the resolution needed for detailed
management decisions. 2D-HBLM helps integrate the latest trends in river science and
Structured Decision Making processes, allowing for a decision framework that is repeatable,
transparent, and quantitative.
Of course, all models have their limitations and therefore the integration between model
output and professional judgment is necessary to help validate and ground truth output
results. On the Trinity, the entire 2D-HBLM process incorporated many partner organizations
and agencies that helped foster a collaborative multi-disciplinary effort. The output results
from the cluster analysis were informally validated by technical experts from various
disciplines including: fishery biology, geomorphology, and hydraulic engineering with expert
knowledge of the Trinity River system. The cluster analysis results matched closely with
professional judgment and gave the technical team confidence in making final
recommendations to management.
The results from the 2D-HBLM framework were applied to the Trinity River Restoration
Program through a collaborative adaptive management process. The results of the model
were integrated through the re-defining the prioritization of channel rehabilitation project
sites designs that were being scheduled for the 2015 calendar year. The final 2D-HBLM
cluster analysis results were refined based on professional judgment from internal team
members through the technical workgroup process. The team members took into account
other factors like constructability, site access logistics, as well as, relationship factors such as
site interdependence and geographic affiliation. Contiguous projects would help increase
design efficiency and create synergy among projects and design teams. Therefore out of the
recommended clusters, the Trinity River Restoration Program – Design Team recommended
to management to select clusters: 104 through 114 (Chapman Ranch through Oregon Gulch)
and the top ranking cluster - 96 (Dutch Creek/Upper Evans Bar). Management agreed to
adopt the technical recommendation and therefore the project sites are currently in the design
process. This new approach to project prioritization was implemented successfully through
the diverse stakeholder partnership of the TRRP and has provided improved technical
transparency and decision making defensibility.
REFERENCES
Aldstadt, J., & Getis, A. (2006). Using AMOEBA to create a spatial weights matrix and identify
spatial clusters. Geographical Analysis, 38(4), 327-343.
Beechie, T., et al. (2008). Setting river restoration priorities: a review of approaches and a general
protocol for identifying and prioritizing actions. North American Journal of Fisheries
Management 28.3: 891-905.
Bjornn, T.C. and Reiser, D.W. (1991). Habitat requirement of salmonids in streams. The American
Fisheries Society Special Publication 19: 38-138. ISBN: 0913235687.
Bovee, K.D. (1982). A Guide to Stream Habitat Analysis using the Instream Flow Incremental
Methodology. Instream Flow Information Paper No.12,Biological Report 86(7). U. S. Fish
and Wildlife Service: Fort Collins, Colorado.
Box, G. E., Meyer, R. D., (1986). An analysis for unreplicated fractional factorials. Technometrics,
28(1), 11-18.

Brierley, Gary J., and Kirstie A. Fryirs (2008). Geomorphology and river management: applications
of the river styles framework. John Wiley & Sons
Clemen, R. T., and T. Reilly. (2001). Making Hard Decisions with Decision Tools (Duxberry).
Conroy, M. J., & Peterson, J. T. (2013). Decision making in natural resource management: a
structured, adaptive approach. John Wiley & Sons.
Crowder DW, Diplas P. (2000). Using two-dimensional hydrodynamic models at scales of ecological
importance. Journal of Hydrology 230(3–4): 172–191.
Darby, Stephen, and David Sear, eds. (2008). River restoration: managing the uncertainty in restoring
physical habitat. John Wiley & Sons, Dassau, E., Zadok, I., Lewin, D. R., (2006). Combining
six-sigma with integrated design and control for yield enhancement in bioprocessing.
Industrial & engineering chemistry research, 45(25), 8299-8309.
Dassau, E., Zadok, I., & Lewin, D. R. (2006). Combining six-sigma with integrated design and
control for yield enhancement in bioprocessing. Industrial & engineering chemistry research,
45(25), 8299-8309.
Dunbar, M. J., Alfredsen, K. and Harby, A. (2012), Hydraulic-habitat modeling for setting
environmental river flow needs for salmonids. Fisheries Management and Ecology, 19: 500–
517. doi: 10.1111/j.1365-2400.2011.00825.
Evers, Mariele. (2008): An analysis of the requirements for DSS on integrated river basin
management. Management of Environmental Quality: An International Journal 19.1 37-53.
Goodman, D. H., Som, N. A., Alvarez, J. and Martin, A. (2014): A mapping technique to evaluate
age-0 salmon habitat response from restoration. Restoration Ecology. doi: 10.1111/rec.12148
Gore, James A., Dina J. Crawford, and David S. Addison. (1998). "An analysis of artificial riffles and
enhancement of benthic community diversity by physical habitat simulation (PHABSIM) and
direct observation." Regulated Rivers: Research & Management 14; 69-77.
Hammond, J. S., R. L. Keeney, and H. Raiffa. (1999). Smart choices: a practical guide to making
better life decisions. Broadway Books, New York.
Harry, M. J., Schroeder, R., (2006). Six Sigma: The breakthrough management strategy
revolutionizing the world's top corporations. Random House Digital, Inc.
Hatten, J.R., Batt, T.R., Scoppettone, G.G., and Dixon, C.J., (2013). An Ecohydraulic Model to
Identify and Monitor Moapa Dace Habitat. PLoS ONE 8(2): e55551.
doi:10.1371/journal.pone.0055551.
Harry, M. J., Schroeder, R., (2006). Six Sigma: The breakthrough management strategy
revolutionizing the world's top corporations. Random House Digital, Inc.
Hermans, Caroline, et al., (2007). Collaborative environmental planning in river management: An
application of multicriteria decision analysis in the White River Watershed in Vermont.
Journal of Environmental Management 84.4 534-546.
Huang, J., Kaul, G., Cai, C., Chatlapalli, R., Hernandez-Abad, P., Ghosh, K., Nagi, A. (2009). Quality
by design case study: an integrated multivariate approach to drug product and process
development. International journal of pharmaceutics, 382(1), 23-32.
Huang, Ivy B., Jeffrey Keisler, and Igor Linkov., (2011) Multi-criteria decision analysis in
environmental sciences: ten years of applications and trends. Science of the total environment
409.19: 3578-3594.
Hillman, Mick, and Gary J. Brierley. (2008). Restoring uncertainty: translating science into
management practice." River futures: an integrative scientific approach to river repair, Island
Press, Washington DC: 257-272.
Isaak, D.J., Luce, C.H., Rieman, B.E., Nagel, D.E., Peterson, E.E., Horan, D.L., Parkes, S., Chandler,
G.L. (2010). Effects of climate change and wildfire on stream temperatures and salmonid
thermal habitat in a mountain river network. Ecological Applications 20, 1350–1371.
doi:10.1890/09-0822.1
Lai, Y.G., Weber, L.J., and Patel, V.C. (2003). “Non-hydrostatic three-dimensional method for
hydraulic flow simulation - Part I: formulation and verification.” J. Hydraulic Engineering,
129(3), 196-205.
Lai, Y.G. (2008). SRH-2D version 2: Theory and User’s Manual, Technical Service Center, Bureau of
Reclamation, Denver, CO 80225.

Lai, Y.G. (2010). Two-Dimensional Depth-Averaged Flow Modeling with an Unstructured Hybrid
Mesh. J. Hydraulic Engineering, ASCE, 136(1), 12-23.
Lamouroux, Nicolas. (1998): Depth probability distributions in stream reaches. Journal of Hydraulic
Engineering 124.2 224-227.
Montgomery, David R., and John M. Buffington. (1998): Channel processes, classification, and
response. River ecology and management 112 1250-1263.
Milhous, R.T., Updike, M.A., and Schneider, D.M. (1989). Physical habitat simulation system
reference manual – Version II. U.S. Fish and Wildlife Service Biological Report 89(16): 403.
Mingelbier, M., Brodur, P., and Morin, J. (2008). Spatially explicit model predicting the spawning
habitat and early stage mortality of Northern pike in a large system: the St. Lawrence River
between 1960 and 2000. Hydrobiologia 601: 55-569. DOI: 10.1007/s10750.007-9266-z
Null, Sarah E., and J. R. Lund. (2012). Fish habitat optimization to prioritize river restoration
decisions." River Research and Applications 28.9 1378-1393.
Ord, J. K., & Getis, A. (1995). Local spatial autocorrelation statistics: distributional issues and an
application. Geographical analysis, 27(4), 286-306.
Raleigh, R., Zuckerman, L.D., and Nelson, P.C. (1986). Habitat suitabilily index models and instream
flow suitability curves: Brown trout. revised. U.S. Fish and Wildlife Service Biological
Report 82(10.124): 65.
Roni, P., Beechie, T. J., Bilby, R. E., Leonetti, F. E., Pollock, M. M., Pess, G. R., (2002). A review of
stream restoration techniques and a hierarchical strategy for prioritizing restoration in Pacific
Northwest watersheds. North American Journal of Fisheries Management, 22(1), 1-20.
Saab, V., (1999). Importance of spatial scale to habitat use by breeding birds in riparian forests: a
hierarchical analysis. Ecological Applications 9, 135–151
Saraeva, Ekaterina, and Thomas B. Hardy. (2009): Prediction of fisheries physical habitat values
based on hydraulic geometry and frequency distributions of depth and velocity. International
Journal of River Basin Management 7.1 31-41.
SAS Institute., (2008). Jmp Release 8 Statistics and Graphics Guide. SAS Institute.
Sear, David, et al. (2009). A method for applying fluvial geomorphology in support of catchment‐scale river restoration planning. Aquatic conservation: Marine and freshwater ecosystems
19.5: 506-519.
Stewart, G., Anderson, R., and Wohl, E. (2005). Two-dimensional modeling of habitat suitability as a
function of discharge in two Colorado Rivers. River Research and Applications 21: 1061-
1074, DOI: 10.1002/RRA.868.
Schweizer, Steffen, et al. (2007). Predicting joint frequency distributions of depth and velocity for
instream habitat assessment. River Research and Applications 23.3: 287-302.
Singh, Krishan P., and Sally McConkey Broeren. (1989). Hydraulic geometry of streams and stream
habitat assessment. Journal of Water Resources Planning and Management 115.5: 583-597.
Tharme, R.E. (2003). A global perspective on environmental flow assessment: emerging trends in the
development and application of environmental flow methodologies for rivers. River Research
and Applications 19: 397-441. DOI: 10.1002/RRA.736.
Waddle T, Steffler P, Ghanem A, Katopodis C, Locke A. (2000). Comparison of one- and two-
dimensional open channel flowmodels for a small habitat stream. Rivers 7: 205–220.
Waddle T. (2010). Field evaluation of a two-dimensional hydrodynamic model near boulders for
habitat calculation. River Research and Applications 26:730-741. DOI: 10.1002/rra.1278
Wheaton, J.M., Pasternack, G.B., and Merz, J.E. (2004). User of habitat heterogeneity in salmonid
spawning habitat rehabilitation design. Proceedings Fifth International Symposium on
Ecohydraulics, Madrid; 792-796.
Wheaton, Joseph M., Stephen E. Darby, and David A. Sear. (2008). The scope of uncertainties in
river restoration. River Restoration: Managing the Uncertainty in Restoring Physical Habitat,
edited by SA Darby, and DA Sear: 21-39.
Woolpert Inc. (2013) Trinity River bathymetry, airborne laser data and photogrammetric DTM site
specific update. Report to U.S. Bureau of Reclamation, TRRP by Woolpert , Englewood, CO.
Yarnell, Y.M., Lind, A.J., and Mount, J.F. (2010). Dynamic flow modeling of riverine amphibian
habitat with application to regulated flow management, River Research and Applications,
DOI: 10.1002/rra.1447.