Risk‐based planning analysis for a single levee planning... · principles and guidelines for...
16
RESEARCH ARTICLE 10.1002/2014WR016478 Risk-based planning analysis for a single levee Rui Hui 1 , Elizabeth Jachens 2 , and Jay Lund 1 1 Center for Watershed Sciences, Department of Civil and Environmental Engineering, University of California-Davis, Davis, California, USA, 2 Biological and Ecological Department, Oregon State University, Corvallis, Oregon, USA Abstract Traditional risk-based analysis for levee planning focuses primarily on overtopping failure. Although many levees fail before overtopping, few planning studies explicitly include intermediate geo- technical failures in flood risk analysis. This study develops a risk-based model for two simplified levee fail- ure modes: overtopping failure and overall intermediate geotechnical failure from through-seepage, determined by the levee cross section represented by levee height and crown width. Overtopping failure is based only on water level and levee height, while through-seepage failure depends on many geotechnical factors as well, mathematically represented here as a function of levee crown width using levee fragility curves developed from professional judgment or analysis. These levee planning decisions are optimized to minimize the annual expected total cost, which sums expected (residual) annual flood damage and annual- ized construction costs. Applicability of this optimization approach to planning new levees or upgrading existing levees is demonstrated preliminarily for a levee on a small river protecting agricultural land, and a major levee on a large river protecting a more valuable urban area. Optimized results show higher likeli- hood of intermediate geotechnical failure than overtopping failure. The effects of uncertainty in levee fragil- ity curves, economic damage potential, construction costs, and hydrology (changing climate) are explored. Optimal levee crown width is more sensitive to these uncertainties than height, while the derived general principles and guidelines for risk-based optimal levee planning remain the same. 1. Introduction Levees partially protect land from flood damage by restraining water from entering the protected area. Glob- ally, levee investment decisions significantly affect public safety and economy. The National Levee Database of the U.S. Army Corps of Engineers (USACE) includes more than 2500 levees, with a total length exceeding 14,500 mi (1 mi/mile 5 1609.34 m). The complementary Federal Emergency Management Agency (FEMA) Mid-Term Levee Inventory database includes 29,800 mi of levee [National Research Council (NRC), 2013]. How- ever, even the best levees cannot guarantee protection, given levee failures under various conditions. Flood risk to economic activity is the likelihood of losing property due to flooding (loss of life is not consid- ered here), and is measured by economic metrics such as direct and indirect costs [Traver et al., 2014]. Flood risk is calculated by multiplying the probability of each failure by its consequences, summed over all events [Van Dantzig, 1956; Arrow and Lind, 1970; Samuels et al., 2008; Eijgenraam et al., 2014]. Levees reduce, but do not eliminate flood risk. Risk-based analysis became common for evaluating flood consequences in the twentieth century. In 1960, the Netherlands Delta Plan first used return period (or exceedance frequency) to establish optimal design water levels to protect against flooding, based on a risk-based cost-benefit analysis to identify optimal return periods for overtopping individual dike rings [Van Dantzig, 1956; Van Der Most and Wehrung, 2005; Eijgenraam et al., 2014; Kind, 2014]. Acceptable average return periods for the design of levees and dikes are stated in Dutch law, including four common safety classes: 1250, 2000, 4000, and 10,000 years [Van Manen and Brinkhuis, 2005] and two rare classes: 250 (for upstream part of Meuse) and 500 (only for one stretch along the river Rhine). Flood risks considering probabilities and consequences have been established as a preferred basis for levee planning and safety. Starting from 1992, the Technical Advisory Committee for Flood Defence initiated the development of a flood risk approach to more comprehensively calculate prob- abilities of flooding of dike ring areas [Van der Kleij, 2000] and has been widely used [Baan and Klijn, 2004; Klijn et al., 2004; Jonkman et al., 2008; Klijn et al., 2008; Zhu and Lund, 2009]. The currently revised Dutch law Key Points: A feasible risk-based optimization model is developed for single levee planning Intermediate levee failure from through-seepage is more frequent than overtopping levee failure Optimal levee crown width is more sensitive to varying parameters than optimal levee height Correspondence to: R. Hui, [email protected] Citation: Hui, R., E. Jachens, and J. Lund (2016), Risk-based planning analysis for a single levee, Water Resour. Res., 52, doi:10.1002/2014WR016478. Received 29 SEP 2014 Accepted 24 FEB 2016 Accepted article online 1 MAR 2016 V C 2016. American Geophysical Union. All Rights Reserved. HUI ET AL. RISK-BASED SINGLE LEVEE PLANNING ANALYSIS 1 Water Resources Research PUBLICATIONS
Transcript of Risk‐based planning analysis for a single levee planning... · principles and guidelines for...
RESEARCH ARTICLE10.1002/2014WR016478
Risk-based planning analysis for a single levee
Rui Hui1, Elizabeth Jachens2, and Jay Lund1
1Center for Watershed Sciences, Department of Civil and Environmental Engineering, University of California-Davis, Davis,California, USA, 2Biological and Ecological Department, Oregon State University, Corvallis, Oregon, USA
Abstract Traditional risk-based analysis for levee planning focuses primarily on overtopping failure.Although many levees fail before overtopping, few planning studies explicitly include intermediate geo-technical failures in flood risk analysis. This study develops a risk-based model for two simplified levee fail-ure modes: overtopping failure and overall intermediate geotechnical failure from through-seepage,determined by the levee cross section represented by levee height and crown width. Overtopping failure isbased only on water level and levee height, while through-seepage failure depends on many geotechnicalfactors as well, mathematically represented here as a function of levee crown width using levee fragilitycurves developed from professional judgment or analysis. These levee planning decisions are optimized tominimize the annual expected total cost, which sums expected (residual) annual flood damage and annual-ized construction costs. Applicability of this optimization approach to planning new levees or upgradingexisting levees is demonstrated preliminarily for a levee on a small river protecting agricultural land, and amajor levee on a large river protecting a more valuable urban area. Optimized results show higher likeli-hood of intermediate geotechnical failure than overtopping failure. The effects of uncertainty in levee fragil-ity curves, economic damage potential, construction costs, and hydrology (changing climate) are explored.Optimal levee crown width is more sensitive to these uncertainties than height, while the derived generalprinciples and guidelines for risk-based optimal levee planning remain the same.
1. Introduction
Levees partially protect land from flood damage by restraining water from entering the protected area. Glob-ally, levee investment decisions significantly affect public safety and economy. The National Levee Databaseof the U.S. Army Corps of Engineers (USACE) includes more than 2500 levees, with a total length exceeding14,500 mi (1 mi/mile 5 1609.34 m). The complementary Federal Emergency Management Agency (FEMA)Mid-Term Levee Inventory database includes 29,800 mi of levee [National Research Council (NRC), 2013]. How-ever, even the best levees cannot guarantee protection, given levee failures under various conditions.
Flood risk to economic activity is the likelihood of losing property due to flooding (loss of life is not consid-ered here), and is measured by economic metrics such as direct and indirect costs [Traver et al., 2014]. Floodrisk is calculated by multiplying the probability of each failure by its consequences, summed over all events[Van Dantzig, 1956; Arrow and Lind, 1970; Samuels et al., 2008; Eijgenraam et al., 2014]. Levees reduce, but donot eliminate flood risk.
Risk-based analysis became common for evaluating flood consequences in the twentieth century. In 1960,the Netherlands Delta Plan first used return period (or exceedance frequency) to establish optimal designwater levels to protect against flooding, based on a risk-based cost-benefit analysis to identify optimalreturn periods for overtopping individual dike rings [Van Dantzig, 1956; Van Der Most and Wehrung, 2005;Eijgenraam et al., 2014; Kind, 2014]. Acceptable average return periods for the design of levees and dikes arestated in Dutch law, including four common safety classes: 1250, 2000, 4000, and 10,000 years [Van Manenand Brinkhuis, 2005] and two rare classes: 250 (for upstream part of Meuse) and 500 (only for one stretchalong the river Rhine). Flood risks considering probabilities and consequences have been established as apreferred basis for levee planning and safety. Starting from 1992, the Technical Advisory Committee forFlood Defence initiated the development of a flood risk approach to more comprehensively calculate prob-abilities of flooding of dike ring areas [Van der Kleij, 2000] and has been widely used [Baan and Klijn, 2004;Klijn et al., 2004; Jonkman et al., 2008; Klijn et al., 2008; Zhu and Lund, 2009]. The currently revised Dutch law
Key Points:� A feasible risk-based optimization
model is developed for single leveeplanning� Intermediate levee failure from
through-seepage is more frequentthan overtopping levee failure� Optimal levee crown width is more
sensitive to varying parameters thanoptimal levee height
Correspondence to:R. Hui,[email protected]
Citation:Hui, R., E. Jachens, and J. Lund (2016),Risk-based planning analysis for asingle levee, Water Resour. Res., 52,doi:10.1002/2014WR016478.
Received 29 SEP 2014
Accepted 24 FEB 2016
Accepted article online 1 MAR 2016
VC 2016. American Geophysical Union.
All Rights Reserved.
HUI ET AL. RISK-BASED SINGLE LEVEE PLANNING ANALYSIS 1
Water Resources Research
PUBLICATIONS
will update the safety standards using flood probability instead of exceedance frequency in the Water Actby 2017 [Eijgenraam et al., 2014]. The USACE [1996] provided procedures with risk and uncertainty analysisto estimate expected benefits of proposed flood damage reduction plans, quantitatively and qualitativelyrepresenting the likelihood and consequences of capacity exceedance, as an extension and expansion oftraditional formulation and regulations in other guidance materials [e.g., USACE, 2000, 2006].
Most traditional risk analysis of levees only accounts for levee failure from overtopping, but levees often failbefore overtopping due to intermediate geotechnical failures [Wolff, 1997; Gui et al., 1998; Cenderelli, 2000;Foster et al., 2000]. Wolff [1997] modeled multiple failure modes and created a combined failure probability,assuming individual modes are independent, finding that underseepage and through-seepage are themost common intermediate failure modes (before overtopping), which also may trigger failure by erosionand slope instability. Although some studies have analyzed the probability of intermediate levee failure as afunction of water level [USACE, 1996; Meehan and Benjasupattananan, 2012; Kind, 2014; Jongejan andMaaskant, 2015], they generally do not identify specific levee geotechnical characteristics. The current studyextends this approach by explicitly including through-seepage as a representative of overall intermediategeotechnical failure modes in levee risk analysis based on synthetic levee performance curves, parameteriz-ing levee fragility with levee height and crown width.
As lower levees are more likely to fail by overtopping and narrower levees are more likely to fail geotechni-cally [Bog�ardi and M�ath�e, 1968; Wood, 1977; Tung and Mays, 1981a; Tung and Mays, 1981b], levee heightand crown width are two major parameters in levee planning. Other significant planning parametersinclude waterside slope angle and landside slope angle for a general levee with a trapezoidal cross section,as well as levee materials and compaction. With a complete planning study, later design considers practicallevee construction (from a geotechnical perspective) to provide protection and benefits consistent withaccepted standards. Levee design in the U.S. usually follows federal and local criteria and guidance, such asthe 100 year urban flood protection developed by National Flood Insurance Program and FEMA [NRC,2013], Bulletin 192-82 by California Department of Water Resources [1982], and Public Law 84-99 by the fed-eral government [USACE, 2009], and the 200 year flood protection required by the Urban Levee Design Cri-teria to meet California’s requirements [Department of Water Resources, 2012].
Section 2 of this paper describes a risk-based optimization model for single levee planning, including modeldescription, intermediate geotechnical levee failure, and risk-based analysis incorporating overtopping andoverall intermediate geotechnical failures. Section 3 presents and discusses illustrative applications of thismodel for a small rural levee with new levee construction and upgrading a large existing urban levee. Sec-tion 4 presents a sensitivity analysis of levee fragility curves that represent the intermediate failure probabil-ities, analyzes impacts from major economic parameters and from varying flood frequency driven byclimate change. Section 5 concludes with key findings.
2. Risk-Based Optimization for a Single Levee
Typical optimization for levee risk analysis is to minimize all flood-related costs, including costs of expected(residual) flood damages and costs of flood protection (here levee construction or upgrade) [Kind, 2014].For this study, a model combining simple representations of hydraulic levee failure and economic cost isused to examine levee planning parameters (height and width) by minimizing annual expected total costs,including expected annual damage and annualized construction costs.
To develop the framework for risk-based optimal levee planning, several assumptions are applied: leveeplanning is based on minimizing total annual expected net cost; levee material is homogeneous and iso-tropic, with constant soil conductivity; through-seepage can develop during a flood event with sufficientlypervious levee material and/or sufficiently long flood duration; defects (e.g., cracks or animal burrows) thatcause through-seepage are not considered; levee slope instability and surface erosion failures areneglected; spatial correlation of levee and foundation material is ignored; a stationary lognormal flood flowfrequency distribution is assumed; Manning’s coefficient is assumed constant and independent of floodlevel, seasonal variation, or other factors; and no impacts exist from climate change, urbanization, or otheruncertainties. Analyses below are all based on these assumptions, which would limit the utility of the opti-mization model and can be addressed in future work.
Water Resources Research 10.1002/2014WR016478
HUI ET AL. RISK-BASED SINGLE LEVEE PLANNING ANALYSIS 2
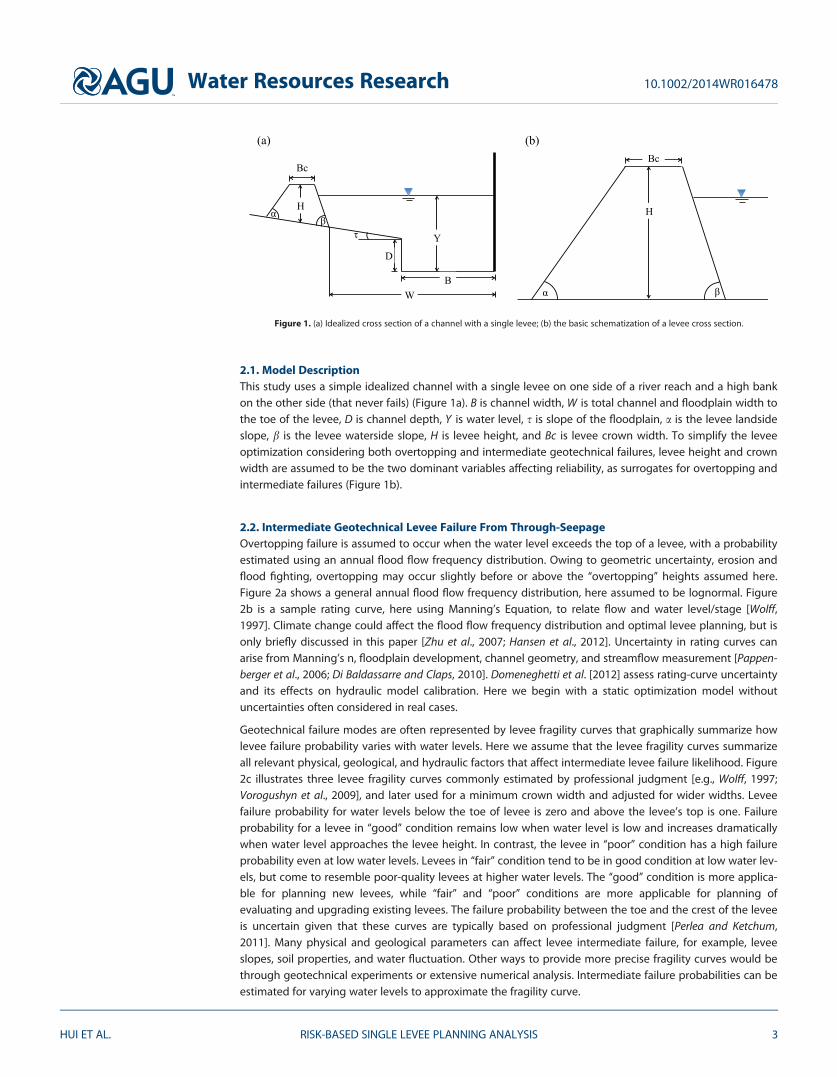
2.1. Model DescriptionThis study uses a simple idealized channel with a single levee on one side of a river reach and a high bankon the other side (that never fails) (Figure 1a). B is channel width, W is total channel and floodplain width tothe toe of the levee, D is channel depth, Y is water level, s is slope of the floodplain, a is the levee landsideslope, b is the levee waterside slope, H is levee height, and Bc is levee crown width. To simplify the leveeoptimization considering both overtopping and intermediate geotechnical failures, levee height and crownwidth are assumed to be the two dominant variables affecting reliability, as surrogates for overtopping andintermediate failures (Figure 1b).
2.2. Intermediate Geotechnical Levee Failure From Through-SeepageOvertopping failure is assumed to occur when the water level exceeds the top of a levee, with a probabilityestimated using an annual flood flow frequency distribution. Owing to geometric uncertainty, erosion andflood fighting, overtopping may occur slightly before or above the ‘‘overtopping’’ heights assumed here.Figure 2a shows a general annual flood flow frequency distribution, here assumed to be lognormal. Figure2b is a sample rating curve, here using Manning’s Equation, to relate flow and water level/stage [Wolff,1997]. Climate change could affect the flood flow frequency distribution and optimal levee planning, but isonly briefly discussed in this paper [Zhu et al., 2007; Hansen et al., 2012]. Uncertainty in rating curves canarise from Manning’s n, floodplain development, channel geometry, and streamflow measurement [Pappen-berger et al., 2006; Di Baldassarre and Claps, 2010]. Domeneghetti et al. [2012] assess rating-curve uncertaintyand its effects on hydraulic model calibration. Here we begin with a static optimization model withoutuncertainties often considered in real cases.
Geotechnical failure modes are often represented by levee fragility curves that graphically summarize howlevee failure probability varies with water levels. Here we assume that the levee fragility curves summarizeall relevant physical, geological, and hydraulic factors that affect intermediate levee failure likelihood. Figure2c illustrates three levee fragility curves commonly estimated by professional judgment [e.g., Wolff, 1997;Vorogushyn et al., 2009], and later used for a minimum crown width and adjusted for wider widths. Leveefailure probability for water levels below the toe of levee is zero and above the levee’s top is one. Failureprobability for a levee in ‘‘good’’ condition remains low when water level is low and increases dramaticallywhen water level approaches the levee height. In contrast, the levee in ‘‘poor’’ condition has a high failureprobability even at low water levels. Levees in ‘‘fair’’ condition tend to be in good condition at low water lev-els, but come to resemble poor-quality levees at higher water levels. The ‘‘good’’ condition is more applica-ble for planning new levees, while ‘‘fair’’ and ‘‘poor’’ conditions are more applicable for planning ofevaluating and upgrading existing levees. The failure probability between the toe and the crest of the leveeis uncertain given that these curves are typically based on professional judgment [Perlea and Ketchum,2011]. Many physical and geological parameters can affect levee intermediate failure, for example, leveeslopes, soil properties, and water fluctuation. Other ways to provide more precise fragility curves would bethrough geotechnical experiments or extensive numerical analysis. Intermediate failure probabilities can beestimated for varying water levels to approximate the fragility curve.
Figure 1. (a) Idealized cross section of a channel with a single levee; (b) the basic schematization of a levee cross section.
Water Resources Research 10.1002/2014WR016478
HUI ET AL. RISK-BASED SINGLE LEVEE PLANNING ANALYSIS 3

Combined with the flow frequency curve where lower flows are more frequent, Figure 2c implies a highlikelihood of levee failure before overtopping.
Levee fragility depends on levee geometry such as levee height, crown width, side slopes, and propertiessuch as soil conductivity and compaction [Kashef, 1965; USACE, 2000]. Here in addition to levee height H,levee crown width Bc is a second decision variable because of its influence on intermediate failure perform-ance curves and the wide range of acceptable values [USACE, 2006]. Through-seepage is chosen to repre-sent general intermediate failure where theory and solution are comparatively well developed and leveecrown width can be a representative plan variable. Underseepage is a common levee intermediate failure[e.g., Mansur and Kaufman, 1956; Turnbull and Mansur, 1961] when a levee is less permeable than its founda-tion. Here overall intermediate risk is calculated from through-seepage, assuming sufficiently pervious leveematerials that through-seepage exceeds underseepage. For a levee with more underseepage, the fragilitycurve can be degraded with higher failure probabilities or the problem and model can be reformulated toexplicitly represent failure from underseepage.
Figure 2. (a) A lognormal annual flood flow frequency distribution; (b) a sample rating curve converting flow to water level or stage usingManning’s Equation; (c) sample levee fragility curves for levees in good, fair, and poor conditions.
Water Resources Research 10.1002/2014WR016478
HUI ET AL. RISK-BASED SINGLE LEVEE PLANNING ANALYSIS 4

Crown width can be used to calculate seepage through a levee using, for example, geotechnical relationshipsgiven in Schaffernak’s solution for through-seepage [Das, 2010]. Alternative solutions for through-seepage alsocould be applied, for example, Casagrande’s solution (1932) and Pavlovsky’s solution (1931). Independent varia-bles in Schaffernak’s solution include water level, levee height, crown width, landside angle, and waterside angle.This model’s main assumptions are: (1) the levee’s base is assumed to be impervious, implying through-seepageas the primary cause of intermediate failure and disregarding underseepage failure; (2) the waterside slope angleis less than 308 (the selected 2:1 horizontal to vertical ratio satisfies); and (3) the hydraulic gradient is constantand equals the free-surface slope as water flows through the levee according to the Dupuit assumption [Das,2010]. Steady-state through-seepage assumed in Schaffernak’s solution would represent longer floods or whereprotected lands are below sea level, but would overpredict seepage for short-duration floods. Here the flood isassumed to have enough duration for through-seepage to fully develop.
Schaffernak’s solution uses Ls, the sloped elevation of the discharging water, and the soil hydraulic conductivityto calculate the rate of seepage per unit length of the levee. The hydraulic conductivity is assumed to be constantfor all levee heights and crown widths. Given this assumption, relative seepage rates can be compared using theratio of the sloped discharge elevations for two crown widths; so the rate of seepage can be calculated as:
q5k � Ls � tan a � sin a (1)
where q is the rate of seepage per unit length of the levee, k is the soil conductivity which is assumed con-stant in this study, a is the angle of levee landside slope, and Ls is the sloped elevation of the dischargingwater defined in equation (2).
Ls5d
cosa2
ffiffiffiffiffiffiffiffiffiffiffiffiffiffiffiffiffiffiffiffiffiffiffiffiffiffiffiffiffiffiffiffiffiffiffiffiffiffiffid
cosa
� �2
2Y
sina
� �2s
(2)
where Y is the water level, and d is the horizontal distance between the landside toe of the levee and theeffective seepage entrance as defined in equation (3).
d5 0:3 � Ytanb
1H2Ytanb
1Bc1H
tana(3)
where b is the angle of levee waterside slope, H is levee height, and Bc is crown width.
The relative seepage rates can be viewed as changes in the likelihood of levee through-seepage failure. Atany given levee height, a wider levee would have a smaller sloped elevation Ls and a smaller seepage rateq, and therefore smaller exit velocities and lower through-seepage failure probability. So widening leveecrown width decreases the likelihood of intermediate levee failure, which provides a basis for estimatingthe levee’s intermediate geotechnical failure.
For numerical computation rather than theoretical analysis, a base probability distribution of levee failurewith the minimum standard crown width is approximated by the following mathematical expressions(equation (4)) to explicitly represent levee fragility curves under good, fair, and poor conditions. Levee inter-mediate failure probabilities for other crown widths are normalized using a coefficient (COPint) of relativesloped elevation of the discharging water that depends mostly on crown width (equation (5)).
PL Qð Þ5
Y2Htoeð ÞH
� �3
; good levees
11sin p � Y2Htoeð ÞH
� �2
p2
� �2
; fair levees
11Y2Htoeð Þ
H21
� �3
; poor levees
8>>>>>>>>>>><>>>>>>>>>>>:
(4)
COPint5Ls Bc; Yð Þ
Ls Bcmin; Yð Þ (5)
where PL Qð Þ5 probability of levee intermediate geotechnical failure from through-seepage andHtoe 5 height of the toe of levee. Mathematical formulas to represent levee fragility curves can take other
Water Resources Research 10.1002/2014WR016478
HUI ET AL. RISK-BASED SINGLE LEVEE PLANNING ANALYSIS 5

forms. For example, a linear function can be implemented for fair levees. This study illustrates one way toexplicitly incorporate intermediate failure into levee risk-based analysis.
A wider crown width with a smaller sloped elevation Ls will have a smaller COPint and corresponding lowerfailure probability. For example, given the base levee failure probability for a minimum standard crownwidth of Bcmin516 ft (1 ft/feet 5 0.3048 m), the decrease in levee failure probability for a crown width of Bcmax556 ft can be calculated at different water levels. In Figure 3, levee failure probability curves have thesame pattern for the same levee condition with either crown width. For the same water level and levee con-dition, failure probability for Bc556 ft is less than that for Bcmin516 ft. The levee failure probability curvesfor a larger crown width shift down and to the right from the original case.
The new levee fragility curves depend on both crown width and levee height, but continue to repre-sent the professional judgment in the original levee fragility curves. Sensitivity analysis on this repre-sentation of levee fragility is presented later. The above method develops a conceptual mathematicaland geometrical representation of the additional effectiveness of larger crown widths on intermediatethrough-seepage levee failure, which is largely limited by the assumptions in Schaffernak’s solutionand ignoring material characteristics (e.g., hydraulic conductivity and soil properties). More detailedmethods for calculating through-seepage and overall intermediate geotechnical failure probabilitycould be substituted.
2.3. Risk-Based Optimization ModelThis model assumes independent overtopping and intermediate geotechnical failures for a given waterlevel. It also assumes no hydraulic uncertainty affecting the relationship between water level and flow.Ignoring hydraulic uncertainty reduces the information available for decision making and can reducethe accuracy of estimated expected damages, which should be avoided when adequate knowledge ofthe channel is available [Tung and Mays, 1981b; Briant, 2001]. Considering hydrologic uncertaintiesonly, equation (6) calculates the expected (residual) annual damage cost of the system for combinedintermediate and overtopping failures, for constructing new levees or upgrading existing levees. Thefirst term represents the expected damage from intermediate failure when flow is below channelcapacity Qc , while the second term is the expected damage from overtopping failure when flowexceeds the channel capacity.
EAD5
ðQc
0D Qð Þ � Pq Qð Þ � PL Qð Þ
dQ1
ð1Qc
D Qð Þ � Pq Qð Þ
dQ (6)
where D Qð Þ5 damage cost as a function of flow; Qc 5 critical overtopping flow of the leveed channel;Pq Qð Þ5 probability density function of river flow; PL Qð Þ5 probability of levee intermediate through-seepage failure as a function of flow.
Figure 3. Levee failure probability curves for different crown widths in various conditions.
Water Resources Research 10.1002/2014WR016478
HUI ET AL. RISK-BASED SINGLE LEVEE PLANNING ANALYSIS 6

Greater flow usually leads to greater flood damage, but for large floods of deeply leveed floodplains, a fixeddamage from levee failure should closely approximate. Since the magnitude of flood flow is accounted inthe failure probability, with a constant damage cost equation (6) simplifies to:
EAD5 D �ðQc
0Pq Qð Þ � PL Qð Þ
dQ1 12FQ QCð Þ½ �� �
(7)
where D 5 constant flood damage cost; FQ QCð Þ5 cumulative density function of flow Qc . The assumed con-stant damage cost would involve large uncertainty from both the estimation of the lost economic welfaredue to flooding, and the evolving damage potential in a long term. More accurate or elaborate damagecost functions could be used, if available. This static study can also be extended to a dynamic process thataccounts for the long-term impacts from floodplain urbanization or climate change [Zhu et al., 2007].
The single levee planning can be optimized by minimizing the annual expected total cost (TC) under staticcondition, which is the sum of the expected (residual) annual damage cost (EAD) and annualized construc-tion cost (ACC).
Min TC5EAD1ACC (8)
Annualized construction cost for building a new levee or upgrading an existing levee (with existing heightH0 and crown width Bc0) is based on levee volume and land area.
ACC5r � 11rð Þn
11rð Þn21
� �� s � c � V1LCð Þ (9)
where r 5 real (inflation adjusted) discount or interest rate; n 5 number of useful years the levee will berepaid over; s 5 a cost multiplier to cover engineering and construction administrative costs; c 5 unit con-
struction cost per volume; V5L� Bc�H1 12 � 1
tana 1 1tanb
� ��H2
h i2L� Bc0�H01 1
2 � 1tana 1 1
tanb
� ��H0
2h i
is the total
volume of building a new levee (the second term disappears with H050; Bc050) or upgrading the existinglevee along the entire length (L) of the reach; LC5UC�A is the cost for purchasing land to build or upgrade
the levee, with a unit land cost, UC, and the additional land area occupied by levee base, A5L�
Bc1 1tana 1 1
tanb
� ��H
h i2L� Bc01 1
tana 1 1tanb
� ��H0
h i(the second term disappears for building a new levee).
Land cost is an additional cost to represent the site-specific expense of purchasing land for levee construc-tion. The long-term operation and maintenance costs of the levees are assumed constant for any planningand not included.
Physical constraints on this optimization include upper and lower limits of crown width and levee height, aswell as nonnegativity of all variables. To meet the ‘‘level of protection’’ requirement, for example protectingfrom a 200 year flood, additional constraints can be added to such levee planning optimization that theoverall failure probability or overflow failure probability is no less than or equal to a required exceedancefrequency.
3. Model Applications
To show the feasibility and applicability of the model and to derive general implications from the modelresults, the developed risk-based optimization model is applied illustratively to a small rural levee with newlevee construction and a large urban levee with existing levee evaluation and upgrade, roughly based onthe Cosumnes River and Natomas in California. Hydraulic parameters and levee dimensions are formulatedfrom previous studies [Tung and Mays, 1981b], following standards developed by DWR and the federal gov-ernment, Bulletin 192-82 and PL 84-99, respectively. All economic values and costs are annualized.
3.1. Model Applications to a Small Rural Levee on Cosumnes RiverThe Cosumnes River has a median peak annual flow of 930 cfs (1 cfs 5 0.0283 m3/s), a mean annual peakflow of 1300 cfs, a land cost of $3000 per acre (1 acre 5 4046.86 m2), and an assumed constant $1:5 milliondamage cost if the area is flooded [Maniery, 1991]. This case examines planning for a new levee.
Water Resources Research 10.1002/2014WR016478
HUI ET AL. RISK-BASED SINGLE LEVEE PLANNING ANALYSIS 7
Adjusted channel geometry and levee-related parameters (Figure 1) include: B5200 ft, W5250 ft,D53 ft, longitudinal slope of the channel and the floodplain section is 0:0005, Manning’s roughness forthe channel and floodplain are 0:05, floodplain slope is tans50:01, levee landside slope and watersideslope are set as tana51=4 and tanb51=2; respectively, and total levee length is L52640 ft 0:5 mið Þ.Construction cost parameters are: csoil5$1:5=ft3, r50:05, s51:3, and useful life of the levee is 100 years.The minimum and maximum crown width standards are Bcmin516 ft and Bcmax556 ft, and the maxi-mum levee height is set as Hmax515 ft.
Because the annual expected total cost of the levee is a function of both levee height and crown width, enu-meration of the annual expected total cost over all heights and widths can find the overall optimal levee plan-ning. Figure 4 shows the annual expected total costs and least-cost levee height and crown width, with costcontours for all height and width combinations for good, fair, and poor levee conditions, respectively, giventhe above site-specific values. A levee is likely to be built to good condition; the fair and poor conditionsexamined here are for comparison. Levee height and levee crown width both vary in 0:1 ft increments. Con-tour intervals are $0.02 million/year. The red dots show the optimal levee height and crown width.
From Figure 4, the annual expected total cost increases when levees become too low since the expectedannual damage cost is relatively high, or when levees become too high since the annualized constructioncost is relatively high. For similar reasons, levees with too narrow or too wide crown widths greatly increasethe annual expected total cost. Minimum annual expected total cost occurs at an optimal combination oflevee height and crown width. The contour plots show that the optimal levee height decreases with increas-ing crown width, for a comparable total cost. As levee crown width increases, intermediate failure probabil-ity decreases and therefore decreases the first term of the expected annual damage equation. As leveeheight increases, the channel capacity increases and decreases the probability of overtopping. Increasinglevee height and crown width also increase construction cost. So the optimization should balance costsfrom flood damage and construction, while balancing the two planning decisions as they have similarimpacts on costs. Fortunately, a fairly wide range of near-optimal solutions seems common around the opti-mal solution. Near the optimum, the height difference for the smallest contour interval (about 2 ft) is muchsmaller than the width difference (about 20 ft), because of the more likely intermediate failure that dependslargely on levee crown width, and affected by the assumed levee geometry and other assumptions.
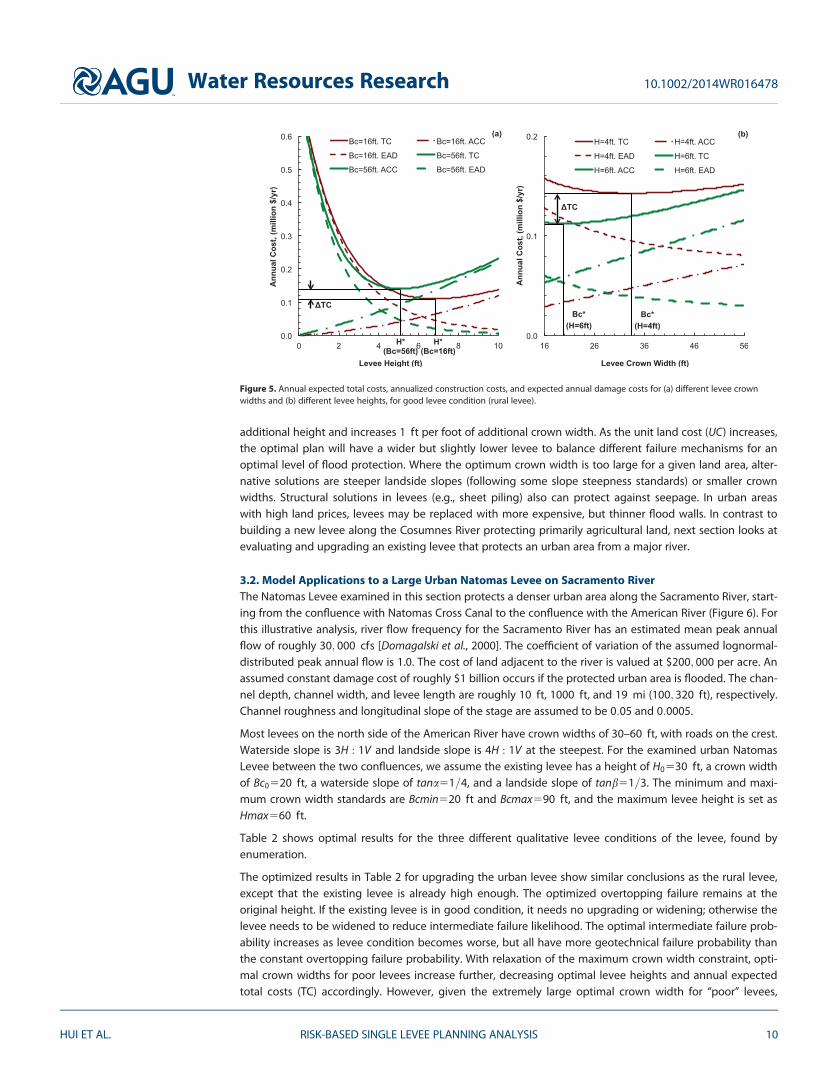
To show clearly how costs change with levee height and crown width, Figure 4a compares the annualizedconstruction cost, expected annual damage cost, and annual expected total cost for a minimum leveecrown width of Bcmin516 ft and a maximum of Bcmax556 ft, for a good Cosumnes levee, for instance.Generally, annual expected total cost is dominated by the expected annual damage cost for lower levees,and by the annualized construction cost for higher levees. The minimum of each total cost curve defines anoptimum levee height for that crown width. The optimal levee height is H�56:8 ft for Bcmin516 ft (alsothe global optimality in this case), while is H�55:1 ft for Bcmax556 ft. The annual expected total cost forthe maximum crown width exceeds that of the minimum crown width, as a result of a big increase inannualized construction cost and a small increase in expected annual damage cost. Similarly, Figure 5bcompares the costs for a levee height of H54 ft and a levee height of H56 ft, for a good Cosumnes levee.General trends of costs curves and conclusions are similar. The optimal levee crown width is Bc�533:4 ftfor H54 ft, while is Bc�519:9 ft for H56 ft. The annual expected total cost for a levee height of H54 ftexceeds that of H56 ft, due to a small decrease in annualized construction cost and a large increase inexpected annual damage cost. Comparing the results in Figures 5a and 5b, changes in levee height lead togreater changes in costs than changes in levee crown width.
Table 1 summarizes the optimal results for the three different levee conditions, as well as for the good leveeplanning including only overtopping failure to show the importance of considering intermediate failure.
Balancing different failure mechanisms that depend on levee height and crown width is significant in plan-ning for reasonable levee dimensions, although constraints can prevent extreme and unrealistic results.From Table 1, the optimal good and poor levees are constrained by the minimum and maximum crownwidths, respectively. The good levee would have a higher optimal height if optimal crown width decreasedbeyond the lower bound to balance damage and construction costs, while the poor levee would have alower optimal height if optimal crown width increased beyond the upper bound. The optimal costs, crownwidth, and intermediate failure probability increase from good to poor levee conditions, differing from the
Water Resources Research 10.1002/2014WR016478
HUI ET AL. RISK-BASED SINGLE LEVEE PLANNING ANALYSIS 8
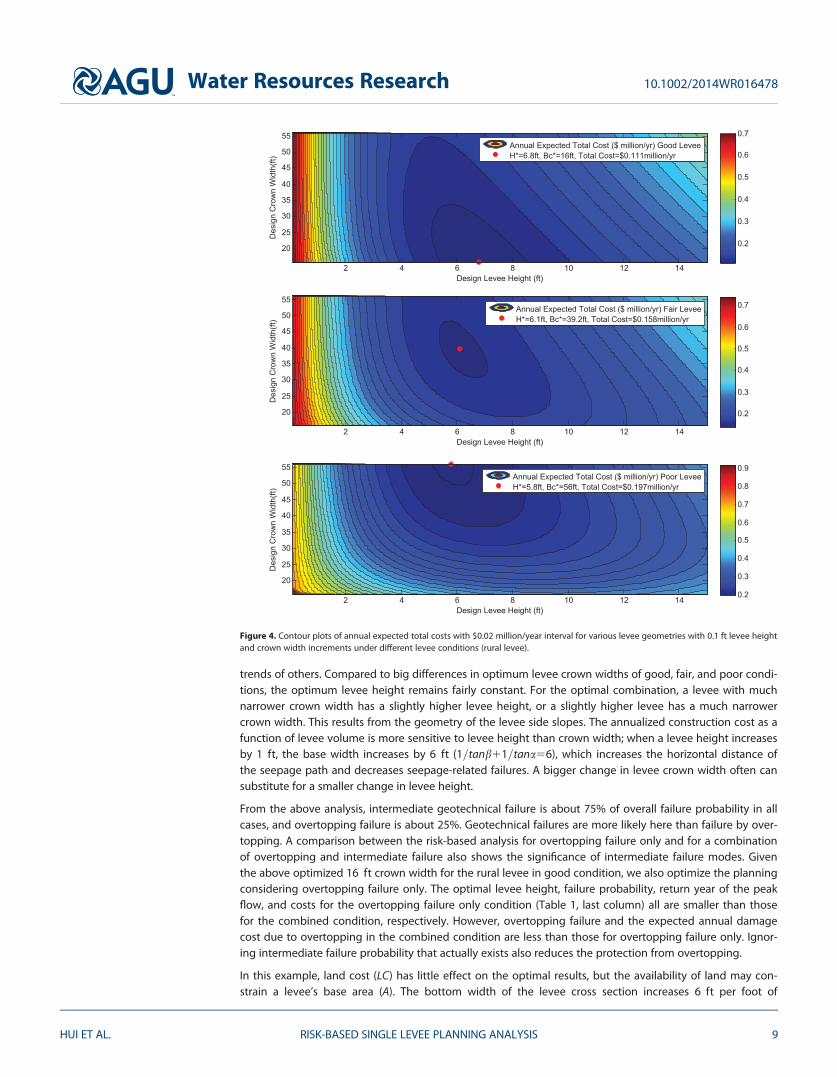
trends of others. Compared to big differences in optimum levee crown widths of good, fair, and poor condi-tions, the optimum levee height remains fairly constant. For the optimal combination, a levee with muchnarrower crown width has a slightly higher levee height, or a slightly higher levee has a much narrowercrown width. This results from the geometry of the levee side slopes. The annualized construction cost as afunction of levee volume is more sensitive to levee height than crown width; when a levee height increasesby 1 ft, the base width increases by 6 ft (1=tanb11=tana56), which increases the horizontal distance ofthe seepage path and decreases seepage-related failures. A bigger change in levee crown width often cansubstitute for a smaller change in levee height.
From the above analysis, intermediate geotechnical failure is about 75% of overall failure probability in allcases, and overtopping failure is about 25%. Geotechnical failures are more likely here than failure by over-topping. A comparison between the risk-based analysis for overtopping failure only and for a combinationof overtopping and intermediate failure also shows the significance of intermediate failure modes. Giventhe above optimized 16 ft crown width for the rural levee in good condition, we also optimize the planningconsidering overtopping failure only. The optimal levee height, failure probability, return year of the peakflow, and costs for the overtopping failure only condition (Table 1, last column) all are smaller than thosefor the combined condition, respectively. However, overtopping failure and the expected annual damagecost due to overtopping in the combined condition are less than those for overtopping failure only. Ignor-ing intermediate failure probability that actually exists also reduces the protection from overtopping.
In this example, land cost (LC) has little effect on the optimal results, but the availability of land may con-strain a levee’s base area (A). The bottom width of the levee cross section increases 6 ft per foot of
Figure 4. Contour plots of annual expected total costs with $0.02 million/year interval for various levee geometries with 0.1 ft levee heightand crown width increments under different levee conditions (rural levee).
Water Resources Research 10.1002/2014WR016478
HUI ET AL. RISK-BASED SINGLE LEVEE PLANNING ANALYSIS 9
additional height and increases 1 ft per foot of additional crown width. As the unit land cost (UC) increases,the optimal plan will have a wider but slightly lower levee to balance different failure mechanisms for anoptimal level of flood protection. Where the optimum crown width is too large for a given land area, alter-native solutions are steeper landside slopes (following some slope steepness standards) or smaller crownwidths. Structural solutions in levees (e.g., sheet piling) also can protect against seepage. In urban areaswith high land prices, levees may be replaced with more expensive, but thinner flood walls. In contrast tobuilding a new levee along the Cosumnes River protecting primarily agricultural land, next section looks atevaluating and upgrading an existing levee that protects an urban area from a major river.
3.2. Model Applications to a Large Urban Natomas Levee on Sacramento RiverThe Natomas Levee examined in this section protects a denser urban area along the Sacramento River, start-ing from the confluence with Natomas Cross Canal to the confluence with the American River (Figure 6). Forthis illustrative analysis, river flow frequency for the Sacramento River has an estimated mean peak annualflow of roughly 30; 000 cfs [Domagalski et al., 2000]. The coefficient of variation of the assumed lognormal-distributed peak annual flow is 1.0. The cost of land adjacent to the river is valued at $200; 000 per acre. Anassumed constant damage cost of roughly $1 billion occurs if the protected urban area is flooded. The chan-nel depth, channel width, and levee length are roughly 10 ft, 1000 ft, and 19 mi (100; 320 ft), respectively.Channel roughness and longitudinal slope of the stage are assumed to be 0:05 and 0:0005.
Most levees on the north side of the American River have crown widths of 30–60 ft, with roads on the crest.Waterside slope is 3H : 1V and landside slope is 4H : 1V at the steepest. For the examined urban NatomasLevee between the two confluences, we assume the existing levee has a height of H0530 ft, a crown widthof Bc0520 ft, a waterside slope of tana51=4, and a landside slope of tanb51=3. The minimum and maxi-mum crown width standards are Bcmin520 ft and Bcmax590 ft, and the maximum levee height is set asHmax560 ft.
Table 2 shows optimal results for the three different qualitative levee conditions of the levee, found byenumeration.
The optimized results in Table 2 for upgrading the urban levee show similar conclusions as the rural levee,except that the existing levee is already high enough. The optimized overtopping failure remains at theoriginal height. If the existing levee is in good condition, it needs no upgrading or widening; otherwise thelevee needs to be widened to reduce intermediate failure likelihood. The optimal intermediate failure prob-ability increases as levee condition becomes worse, but all have more geotechnical failure probability thanthe constant overtopping failure probability. With relaxation of the maximum crown width constraint, opti-mal crown widths for poor levees increase further, decreasing optimal levee heights and annual expectedtotal costs (TC) accordingly. However, given the extremely large optimal crown width for ‘‘poor’’ levees,
Figure 5. Annual expected total costs, annualized construction costs, and expected annual damage costs for (a) different levee crownwidths and (b) different levee heights, for good levee condition (rural levee).
Water Resources Research 10.1002/2014WR016478
HUI ET AL. RISK-BASED SINGLE LEVEE PLANNING ANALYSIS 10

building or reinforcing levees that are already classified as poor (particularly for urban areas) is not feasiblein practice, where other solutions should be implemented.
Similar to the contour plots in Figure 4, the annual expected total costs of the urban levee show the sametrends regarding levee height and crown width. As crown width increases, the intermediate failure probabil-ity decreases; as levee height increases, the capacity of the levee system increases and overtopping failureprobability decreases. The optimum height and crown width balance failure mechanisms and the trade-offbetween expected annual damage costs and annualized construction costs.
Land cost also has little impact in this example, but land for levee construction may not be available or tooexpensive to purchase in densely populated urban areas. The current Natomas Levee is under improvementto increase flood protection and ensure it achieves an updated 200 year protection standards developed byFEMA, USACE, and the State of California. A wide and high levee to protect from a 200 year flood needs alarge footprint. So structures requiring less land (e.g., slurry or flood walls) might be needed to reduce seep-age and related failures. In California, most levees built originally in the early 1900s to protect agriculturalland are more likely to fail. Improvements for risky levees can include slurry walls to mitigate seepage andchannel capacity expansion to decrease loads on levees [USACE, 2000]. Acquiring understanding and accep-tance from the general risk-averse public are also significant in levee planning from social and political per-spectives [Slovic et al., 1977; Harrington et al., 1999; Browne and Hoyt, 2000].
4. Impacts From Relevant Uncertainties
Many factors could affect such optimization results, particularly estimation of the conceptual levee fragilitycurves, various economic parameters, and climate change alterations to hydrologic conditions [Hansenet al., 2012; Abraham et al., 2015].
4.1. Sensitivity Analysis on Levee Fragility CurvesIn this study, levee fragility curves provide a framework to include through-seepage as a representative ofintermediate failure in optimal levee planning. The proposed hybrid method of addressing intermediatefailure probability combines professional judgment in the original levee fragility curves with a more mathe-matical and geometric representation of the effectiveness of greater crown widths. Sensitivity analysis ofthe levee fragility curves and their mathematical expressions is discussed with examples for the rural levee.
Increasing levee failure probability for any given levee height and crown width raises the levee fragilitycurve, while decreasing levee failure probability lowers the levee fragility curve. Figure 7 shows examples ofchanging levee fragility curves upward or downward for levees in good and poor condition with a maxi-mum crown width of Bcmax556 ft. Solid lines are the levee fragility curves used earlier, dashed fragilitycurves have a relative 20% decrease in failure probability, and dash-dot fragility curves have a relative 20%increase in failure probability.
Table 1. Optimal Results and Comparison for Different Levee Conditions (Rural Levee)
Optimal Results Good Faira Poora Good (Overtopping Failure Only)
Annual expected total cost ($million/year) 0.111 0.158 0.197 0.071Expected annual damage cost ($million/year) 0.046 0.066 0.086 0.023Annualized construction cost ($million/year) 0.065 0.092 0.111 0.048Levee height, H (ft) 6.8 6.1 5.8 5.6Levee crown width, Bc (ft) 16 39.2 56 16 (same as GOOD)Prob. of overtopping failure (1/year)
(contribution to overall failure)0.0080(26%)
0.0115(26%)
0.0135(24%)
0.0151
Prob. of intermediate failure (1/year)(contribution to overall failure)
0.0226(74%)
0.0325(74%)
0.0438(76%)
0
Prob. of overall failure (1/year) 0.0306 0.044 0.0573 0.0151Return period (years) 125 87 74 66Return period (years) (2ft freeboardb) 291 224 198 182Return period (years) (3ft freeboardb) 394 321 291 271
aPresented for comparison only.bSome federal and local standards (e.g., Bulletin 192-82 and PL 84-99) require an additional 2–3 ft freeboard on top of a levee, which
increase the ability of a levee to resist flow with smaller failure frequency and larger return period.
Water Resources Research 10.1002/2014WR016478
HUI ET AL. RISK-BASED SINGLE LEVEE PLANNING ANALYSIS 11

We can optimize the planning for therural levee with these changes in leveefragility curves to show their impacts. Hui[2014] presents detailed results for a simi-lar study with a relative 1%, 5%, and 20%increase and decrease in intermediatefailure probability, for levees under goodand poor conditions. Levee fragilitycurves would affect the optimal leveeplan, but changes in optimal levee plansare relatively small if the fragility curvesdeviate within a modest range (e.g.,65%). The optimal levee crown width ismore sensitive to changes in levee fragil-ity curves, indicating the effectiveness ofraising, rather than widening a levee.
4.2. Analytical View of Trade-Offs inPlanning ParametersThe first-order condition for minimizing
the annual expected total cost of flood control requires the first partial derivatives of TC H; Bcð Þ with respectto levee height H and levee crown width Bc equal zero. Assuming negligible land cost,
@TC@H
5D �@Ð Qc
0 Pq Qð Þ � PL Qð Þ
dQ2FQ QCð Þn o
@H1@ r� 11rð Þn
11rð Þn21 � s � c � Vh i
@H50 (10)
@TC@Bc
5D �@Ð Qc
0 Pq Qð Þ � PL Qð Þ
dQn o
@Bc1@ r� 11rð Þn
11rð Þn21 � s � c � Vh i
@Bc50 (11)
Assuming uniform flow in the river channel, the overtopping capacity Qc is determined solely by river cross-section geometry, which is levee height H in this case. Energy slope and channel roughness should not begreatly affected by levee modification. Therefore, from equations (10) and (11),
@Ð Qc
0 Pq Qð Þ � PL Qð Þ
dQ2FQ QCð Þn o
@H
@Ð Qc
0 Pq Qð Þ � PL Qð Þ
dQn o
@Bc5@V@H
@V@Bc
(12)
The above equation holds for the optimal levee height and optimal levee crown width. Other than the enu-meration method discussed previously for solving this optimization model, the optimal levee height andcrown width also can be found by numerically solving the two first-order conditions simultaneously andverifying that a global minimum is attained.
Figure 6. Nineteen miles of levee on the Sacramento River protecting theNatomas Basin to the east.
Table 2. Optimal Results and Comparison for Different Levee Conditions (Urban Levee)
Optimal Results Good Faira Poora
Annual expected total cost ($billion/year) 0.028 0.047 0.068Expected annual damage cost ($billion/year) 0.007 0.018 0.025Annualized construction cost ($billion/year) 0.021 0.030 0.043Levee height, H (ft) 30 30 30Levee crown width, Bc (ft) 20 47.5 90Prob. of overtopping failure (1/year)
(contribution to overall failure)0.0012(16%)
0.0012(7%)
0.0012(5%)
Prob. of intermediate failure (1/year)(contribution to overall failure)
0.0062(84%)
0.0164(93%)
0.0242(95%)
Prob. of overall failure (1/year) 0.0074 0.0176 0.0254Return period (years) 842 842 842Return period (years) (2 ft freeboardb) 1024 1024 1024Return period (years) (3 ft freeboardb) 1115 1115 1115
aPresented for comparison only.bSome federal and local standards (e.g., Bulletin 192-82 and PL 84-99) require an additional 2–3 ft freeboard.
Water Resources Research 10.1002/2014WR016478
HUI ET AL. RISK-BASED SINGLE LEVEE PLANNING ANALYSIS 12

In the above equation, values of flood damage cost D, unit construction cost c, and economic discount rater do not affect the optimal trade-off between levee height and crown width for this static optimization.Changes in these economic values do not affect the optimal substitution between levee height and crownwidth, though this may affect the optimal plan values. The trade-off between height and width primarilydepends on flood flow frequency, levee failure probability, channel geometry, and levee side slopes. Theseresults are similar to analytical results for levee height versus setback [Zhu and Lund, 2009].
4.3. Climate Change on Flood Risk AnalysisClimate change has received considerable attention in recent decades, and may worsen flooding problems[Schreider et al., 2000; Milly et al., 2002], particularly the frequency of floods, represented here by the meanannual peak flood flow and its variance [Gleick, 1989; Zhu et al., 2007; Hansen et al., 2012]. Urbanizationcould have similar effects as climate change where increased runoff coefficients will increase peak flows,but is not considered here.
To explore how hydrologic variation in a changed climate would affect the risk-based optimal levee plan,we can perform the optimization with varying hydrologic parameter values. For illustration, we calculatethe optimal results for the rural Cosumnes levee with increasing mean annual peak flood flow, for a levee ingood condition (Table 3).
From Table 3, increases in mean annual peak flood flow from climate change would increase the optimalannual expected total costs (to roughly the same percentages). Optimal crown width remains constant atthe minimum value due to minimum standard, without which it should have greater changes than the fairlyconstant optimal levee height. Failure probabilities, return periods, contributions to overall failure fromovertopping, and intermediate failures also change slightly. So a moderate increase in mean annual peakflood flow does not significantly affect the optimal levee plans. For this case, the small damage potentiallimits additional levee investments with much larger annual floods. Planning for urban levees would bemore sensitive.
We also performed the optimization with increasing peak flow variation and increasing combined meanand variance, for various levee quality conditions. The optimal results are similar. Overall, the resulting minorchanges in optimal levee plans suggest that a moderate change in hydrologic condition due to climatechange would not affect the basic principles and guidelines for levee plans. Dynamic programming can fur-ther examine levee sizing over time with climate change [Zhu et al., 2007].
5. Conclusion
This study presents a quantitative risk-based analysis for optimal single levee plans considering overtoppingfailure and intermediate geotechnical failure through parameterizing levee fragility with levee height andcrown width. Through-seepage is chosen to represent general intermediate failure since it is more likelywhen a levee is more permeable than its foundation, and through-seepage theory and solutions are welldeveloped. By using geotechnical relationships given in Schaffernak’s solution for through-seepage, leveecrown width is added as an independent decision variable to mathematically and geometrically estimateintermediate geotechnical failure probability. In this way, conceptual levee fragility curves, which largelyrepresent professional judgment, are quantitatively adjusted to include both levee height and crown widthand represent both overtopping and intermediate failure modes.
In the developed risk-based optimal levee plan, levee height determines overtopping failure probability,while levee height and crown width together affect the likelihood of intermediate geotechnical failure. Theoptimal levee height and crown width are found by minimizing the annual expected total cost, which is thesum of expected (residual) annual damage and annualized construction costs. This approach could helpoptimize plans for new levees, and evaluate the current condition and improved plans to upgrade existinglevees.
This risk-based optimization model is demonstrated for a rural levee on a small river and an urban levee ona major river in California, for building a new levee and upgrading an existing levee respectively. Increasinglevee height primarily reduces overtopping failure, while increasing crown width decreases intermediategeotechnical failure in both large and more frequent smaller floods. As the probability of intermediate
Water Resources Research 10.1002/2014WR016478
HUI ET AL. RISK-BASED SINGLE LEVEE PLANNING ANALYSIS 13

failure can be much larger than overtopping failure, intermediate failure should be included in such analy-ses. The optimal crown width of levees in poorer condition can be significantly larger than that in bettercondition, while the optimal levee height remains fairly constant across levee conditions. Balancing differ-ent levee failure mechanisms through changing levee height and crown width should prevent extremesizes. More profound levee upgrades may be needed for poorer-quality levees. Optimal levees are higherand wider for the urban floodplain with greater damage potential than for the rural floodplain. The contri-bution of overtopping to overall failure is less for the urban levee, primarily because the increase in interme-diate failure from the space-limited crown width.
In practice, levee height for overtopping protection will be the first consideration, and intermediate failurerisk from other factors would then be considered. Building a lower levee to provide additional width wouldnot normally be considered. Other methods are also likely to be considered where crown width needs to beincreased, such as blanketing the water side with a more impervious material and providing a pervious toedrain on the land side. But the general guidance and implications derived here should be useful.
Many factors could affect the developed optimization model. The optimal levee crown width is more sensi-tive than the optimal levee height in response to relevant changes. These indicate the effectiveness of leveeheight in determining the optimal levee plans and in dampening changes in other parameters. Changes toother levee plan parameters have less impact on optimal plans and costs than changing the overall leveefragility curves representing intermediate failure mechanisms. Economic values do not affect the optimaltrade-off between levee height and crown width in this static optimization, though they may affect changesin the optimal flow capacity over time. And the derived basic principles and guidelines for levee planningare not affected by moderate changes in hydrology due to climate change.
Figure 7. Levee fragility curves with different curvatures.
Table 3. Impacts From Climate Change by Varying Mean Annual Peak Flood Flow
Optimal Results
Increases in Mean Annual Peak Flood Flow
0 0.5% 1% 2% 5% 10%
Annual expected total cost ($million/year) 0.111 0.112 0.112 0.113 0.116 0.121Expected annual damage cost ($million/year) 0.046 0.047 0.046 0.047 0.048 0.051Annualized construction cost ($million/year) 0.065 0.065 0.066 0.066 0.068 0.071Levee height, H (ft) 6.8 6.8 6.9 6.9 7 7.2Levee crown width, Bc (ft) 16 16 16 16 16 16Prob. of overtopping failure (1/year) 0.0080 0.0081 0.0078 0.0080 0.0083 0.0086Prob. of intermediate failure (1/year) 0.0226 0.0229 0.0225 0.0230 0.0239 0.0252Prob. of overall failure (1/year) 0.0306 0.0310 0.0303 0.0310 0.0322 0.0338Return period (years) 125 123 128 124 120 116Return period (years) (2 ft freeboard) 291 287 294 288 278 267Return period (years) (3 ft freeboard) 394 390 397 390 379 366
Water Resources Research 10.1002/2014WR016478
HUI ET AL. RISK-BASED SINGLE LEVEE PLANNING ANALYSIS 14
With the assumptions and simplifications used in this risk-based analysis, further study should address limi-tations, such as by including more detailed descriptions of channel geometry, damage cost function, leveefragility curves, and failure modes, particularly with more physical, hydraulic, and geological factors (e.g.,soil properties). The effect of levee length also should be analyzed, as longer levees should be more likelyto fail. Soil and geometric properties are highly correlated over some distance, and levee sections can beconsidered probabilistically independent at greater distances [Vanmarcke, 2011]. A 2-D analysis can be con-sidered representative of some ‘‘correlation length’’ of levee. A further extended dynamic optimization ispromising to better represent time-dependent variations, for example, the nonstationarity in a changing cli-mate [Cheng and AghaKouchak, 2014]. Particularly for infrastructure with a long lifetime, a dynamic risk tol-erance by starting at a higher safety standard but allowing higher failure risk toward the end might bebetter than fixed risk levels.
ReferencesAbraham, J., J. R. Stark, and W. J. Minkowycz (2015), Briefing: Extreme weather: Observed precipitation changes in the USA, Proceedings of
the Institution of Civil Engineers-Forensic Engineering, 168(2), 68–70.Arrow, K. J., and R. C. Lind (1970), Uncertainty and the evaluation of public investment decisions, Am. Econ. Rev., 60(3), 364–78.Baan, P. J., and F. Klijn (2004), Flood risk perception and implications for flood risk management in the Netherlands, Int. J. River Basin
Manage., 2(2), 113–122.Bog�ardi, I., and Z. M�ath�e (1968), Determination of the Degree of Protection Offered by Flood Levees and the Economic Improvement Thereof,
Natl. Water Auth., Dep. for Flood Control and River Training, Budapest.Briant, M. J. (2001), Hec-fda sensitivity and uncertainty analysis, Rep. HEC-RD-46, Hydrol. Eng. Cent., Davis, Calif.Browne, M. J., and R. E. Hoyt (2000), The demand for flood insurance: Empirical evidence, J. Risk Uncertainty, 20(3), 291–306.Cenderelli, D. A. (2000), Floods from natural and artificial dam failures, in Inland Flood Hazards: Human, Riparian and Aquatic Communities,
pp. 73–103, Cambridge Univ. Press, Cambridge, U. K.Cheng, L., and A. AghaKouchak (2014), Nonstationary precipitation intensity-duration-frequency curves for infrastructure design in a
changing climate, Sci. Rep., 4, 7093, doi:10.1038/srep07093.Das, B. M. (2010), Seepage, in Principles of Geotechnical Engineering, 7th ed., pp. 198–225, Cengage Learning, Stamford, Conn.Department of Water Resources (1982), Bulletin 192-82, Delta Levees Investigation, Sacramento, Calif.Department of Water Resources (2012), Urban Levee Design Criteria, Sacramento, Calif.Di Baldassarre, G., and P. Claps (2010), A hydraulic study on the applicability of flood rating curves, Hydrol. Res., 42(1), 10–19.Domagalski, J. L., D. L. Knifong, P. D. Dileanis, L. R. Brown, J. T. May, V. Connor, and C. N. Alpers (2000), Water Quality in the Sacramento
River Basin, California,1994–98, U.S. Geological Survey Circular 1215, 36 pp. [Available at http://pubs.water.usgs.gov/circ1215/.]Domeneghetti, A., A. Castellarin, and A. Brath (2012), Assessing rating-curve uncertainty and its effects on hydraulic model calibration,
Hydrol. Earth Syst. Sci., 16(4), 1191–1202.Eijgenraam, C., J. Kind, C. Bak, R. Brekelmans, D. den Hertog, M. Duits, K. Roos, P. Vermeer, and W. Kuijken (2014), Economically efficient
standards to protect the Netherlands against flooding, Interfaces, 44(1), 7–21.Foster, M., R. Fell, and M. Spannagle (2000), The statistics of embankment dam failures and accidents, Can. Geotech. J., 37(5), 1000–1024.Gleick, P. H. (1989), Climate change, hydrology, and water resources, Rev. Geophys., 27(3), 329–344.Gui, S., R. Zhang, and X. Xue (1998), Overtopping reliability models for river levee, J. Hydraul. Eng., 124(12), 1227–1234.Hansen, J., M. Sato, and R. Ruedy (2012), Perception of climate change, Proc. Natl. Acad. Sci. U. S. A., 109(37), E2415–E2423.Harrington, S. E., G. R. Niehaus, and N. Harrington (1999), Risk Management and Insurance, McGraw-Hill, N. Y.Hui, R. (2014), Optimal design of levee and flood control systems, Doctoral dissertation, Univ. of Calif., Davis.Jongejan, R. B., and B. Maaskant (2015), Quantifying flood risks in the Netherlands, Risk Anal., 35(2), 252–264, doi:10.1111/risa.12285.Jonkman, S. N., M. Kok, and J. K. Vrijling (2008), Flood risk assessment in the Netherlands: A case study for dike ring South Holland, Risk
Anal., 28(5), 1357–1374.Kashef, A. A. I. (1965), Seepage through earth dams, J. Geophys. Res., 70(24), 6121–6128.Kind, J. M. (2014), Economically efficient flood protection standards for the Netherlands, J. Flood Risk Manage., 7(2), 103–117.Klijn, F., M. van Buuren, and S. A. van Rooij (2004), Flood-risk management strategies for an uncertain future: Living with Rhine river floods
in the Netherlands?, Ambio, 33(3), 141–147.Klijn, F., P. Samuels, and A. Van Os (2008), Towards flood risk management in the EU: State of affairs with examples from various European
countries, Int. J. River Basin Manage., 6(4), 307–321.Maniery, M. L. (1991), Mokelumne River and tributaries, California: Cultural resources summary, Prepared by PAR Environmental Services,
Inc. for U.S. Army Corps of Engineers, Sacramento District Planning Division, Sacramento, Calif.Mansur, C. I., and R. I. Kaufman (1956), Control of underseepage Mississippi River levees, St. Louis District, J. Soil Mech. Found. Div. Am. Soc.
Civ. Eng., 82(1), 1–31.Meehan, C. L., and S. Benjasupattananan (2012), An analytical approach for levee underseepage analysis, J. Hydrol., 470, 201–211.Milly, P. C. D., R. Wetherald, K. A. Dunne, and T. L. Delworth (2002), Increasing risk of great floods in a changing climate, Nature, 415(6871),
514–517.National Research Council (NRC) (2013), Levees and the National Flood Insurance Program: Improving Policies and Practices, Natl. Acad. Press,
Washington, D. C.Pappenberger, F., P. Matgen, K. J. Beven, J. B. Henry, and L. Pfister (2006), Influence of uncertain boundary conditions and model structure
on flood inundation predictions, Adv. Water Resour., 29(10), 1430–1449.Perlea, M., and E. Ketchum (2011), Impact of Non-Analytical Factors in Geotechnical Risk Assessment of Levees, in Geo-Risk 2011, pp.
1073–1081, American Society of Civil Engineers, Atlanta, Georgia, doi:10.1061/41183(418)117.Samuels, P., S. Huntington, W. Allsop, and J. Harrop (Eds.) (2008), Flood Risk Management: Research and Practice, extended abstracts volume,
CRC Press, London, U. K.Schreider, S. Y., D. I. Smith, and A. J. Jakeman (2000), Climate change impacts on urban flooding, Clim. Change, 47(1-2), 91–115.
AcknowledgmentsThe authors are very thankful for theconstructive comments andsuggestions from Nathan R. Burley,David Ford, the anonymous reviewers,and Editors that have improved thepaper. The data used to produce theresults of this paper can be obtainedfrom the listed references and fromcontacting the authors.
Water Resources Research 10.1002/2014WR016478
HUI ET AL. RISK-BASED SINGLE LEVEE PLANNING ANALYSIS 15

Slovic, P., B. Fischhoff, S. Lichtenstein, B. Corrigan, and B. Combs (1977), Preference for insuring against probable small losses: Insuranceimplications, J. Risk Insurance, 44, 237–258.
Traver, R., et al. (2014), Flood risk management: The need for sound policies and practices, Civ. Eng. Mag. Arch., 84(4), 48–57.Tung, Y. K., and L. W. Mays (1981a), Risk models for flood levee design, Water Resour. Res., 17(4), 833–841.Tung, Y. K., and L. W. Mays (1981b), Optimal risk-based design of flood levee systems, Water Resour. Res., 17(4), 843–852.Turnbull, W. J., and C. I. Mansur (1961), Underseepage and its control: A symposium: Investigation of underseepage-Mississippi River levees,
Trans. Am. Soc. Civ. Eng., 126(1), 1429–1481.USACE (1996), Engineering and design: Risk-based analysis for flood damage reduction studies, Rep. EM 1110-2-1619, Washington, D. C.USACE (2000), Planning: Planning guidance notebook, Rep. ER 1105-2-100, Washington, D. C.USACE (2006), Planning: Risk analysis for flood damage reduction studies, Rep. ER 1105-2-101, Washington, D. C.USACE (2009), Public Law 84–99, Rehabilitation assistance for non-federal flood control projects, Department of the Army Corps of Engi-
neers, Albuquerque District Readiness and Contingency Operations Branch, NE Albuquerque, N. M.Van Dantzig, D. (1956), Economic decision problems for flood prevention, Econometrica, 24, 276–287.Van Manen, S. E., and M. Brinkhuis (2005), Quantitative flood risk assessment for Polders, Reliab. Eng. Syst. Safety, 90(2), 229–237.Van der Kleij, W. (2000), From Probability of Exceedance to Probability of Flooding, Tech. Advis. Comm. for Flood Def. in The Neth., Hague,
Netherlands.Van Der Most, H., and M. Wehrung (2005), Dealing with uncertainty in flood risk assessment of dike rings in the Netherlands, Nat. Hazards,
36(1-2), 191–206.Vanmarcke, E. (2011), Risk of limit-equilibrium failure of long earth slopes: How it depends on length, in Geo-Risk 2011, pp. 1–24, American
Society of Civil Engineers, Atlanta, Georgia, doi:10.1061/41183(418)1.Vorogushyn, S., B. Merz, and H. Apel (2009), Development of dike fragility curves for piping and micro-instability breach mechanisms, Nat.
Hazards Earth Syst. Sci., 9(4), 1383–1401.Wolff, T. F. (1997), Geotechnical reliability of levees, paper SP-28 presented at a Hydrology and Hydraulics Workshop on Risk-Based Analysis
for Flood Damage Reduction Studies, U.S. Army Corps of Eng. Hydrol. Eng. Cent., Davis, Calif.Wood, E. (1977), An analysis of flood levee reliability, Water Resour. Res., 13(3), 665–671.Zhu, T., and J. R. Lund (2009), Up or out?-Economic-engineering theory of flood levee height and setback, J. Water Resour. Plann. Manage.,
135(2), 90–95.Zhu, T., J. R. Lund, M. W. Jenkins, G. F. Marques, and R. S. Ritzema (2007), Climate change, urbanization, and optimal long-term floodplain
protection, Water Resour. Res., 43, W06421, doi:10.1029/2004WR003516.
Water Resources Research 10.1002/2014WR016478
HUI ET AL. RISK-BASED SINGLE LEVEE PLANNING ANALYSIS 16