Risk Management and Disaster Relief Operations
86
Risk Management and Disaster Relief Operations by Nathalie Assens Submitted to the Department of Civil and Environmental Engineering in partial fulfillment of the requirements for the degree of Master of Science in Civil and Environmental Engineering at the MASSACHUSETTS INSTITUTE OF TECHNOLOGY June 2003 @2003 Massachusetts Institute of Technology. All rights reserved. A uth or ................................... Department of Civil and Environm" ehtal Engineering May 9, 2003 Certified by... Fre4Moavenzadeh James Mason Crafts Professor of Systems Engineering and Civil and Environmental Engineering Thesis Supervisor Accepted by ..... Oral Buyukozturk Chairman, Departmental Committee on Graduate Studies MASSACHUSETTS INSTITUTE OF TECHNOLOGY JUN 0 2 2003 LIBRARIES ..
Transcript of Risk Management and Disaster Relief Operations

Risk Management and Disaster Relief Operations
by
Nathalie Assens
Submitted to the Department of Civil and Environmental Engineeringin partial fulfillment of the requirements for the degree of
Master of Science in Civil and Environmental Engineering
at the
MASSACHUSETTS INSTITUTE OF TECHNOLOGY
June 2003
@2003 Massachusetts Institute of Technology. All rights reserved.
A uth or ...................................Department of Civil and Environm" ehtal Engineering
May 9, 2003
Certified by...Fre4Moavenzadeh
James Mason Crafts Professor of Systems Engineering and Civil andEnvironmental Engineering
Thesis Supervisor
Accepted by .....
Oral BuyukozturkChairman, Departmental Committee on Graduate Studies
MASSACHUSETTS INSTITUTEOF TECHNOLOGY
JUN 0 2 2003
LIBRARIES
..


Risk Management and Disaster Relief Operations
by
Nathalie Assens
Submitted to the Department of Civil and Environmental Engineeringon May 9, 2003, in partial fulfillment of the
requirements for the degree ofMaster of Science in Civil and Environmental Engineering
Abstract
During 2002, some 11,000 people throughout the world were killed in natural catastro-phes and man-made disasters were responsible for 10,000 fatalities worldwide; flood
claimed the most victims with more than a third of the fatalities caused by natural
disasters.
Indeed, people will always face natural disasters, but it seems that disasters nowadays
are frequently generated by or aggravated by human activities. The poverty as well
as the increase of the density of the population is making the world more and more
vulnerable since more people are living in riskier situations. The number of people
at risk is growing every year and most of this population is located in developing
countries where resources are limited.
The purpose of this study is to identify the different types of risk and risk man-
agement in order to increase the participation of the private sector in disaster relief
operations. This could generate the incentive for a collaborative work in an effective
and efficient manner despite the number of agencies involved in disaster relief and
fund raising in the corporate world.
After providing an overview of the risk management concepts, this thesis will focus
on assessing risks and ways to mitigate them before presenting risk transfer. Finally,there will be an emphasis on the importance and the role of Information Technology
in Disaster Risk Management activities.
Thesis Supervisor: Fred MoavenzadehTitle: James Mason Crafts Professor of Systems Engineering and Civil and Environ-
mental Engineering


Acknowledgments
I am grateful to many people for their support during my stay at MIT but also for
their help with this study.
First, I would like to thank my advisor Professor Fred Moavenzadeh, for his de-
tailed comments, suggestions and for introducing this project to me.
I would like to thank my family for teaching me what life is all about and putting me
on the right track. Special thanks to my parents for their love, patience and moral
support.
I would also like to thank my friends and classmates. I enjoyed studying, learn-
ing and having fun with all of you. Special thanks to Naz, Alejandro, Vikas and
Jean-Benoit for the good laughs we shared and for all the nice moments we spent
together.
Finally, I would like to thank Cynthia Stewart, James Riefstahl, Sara Goplin, Fe-
niosky Pefia-Mora and Joanie McCusker for their advice, emotional support and for
helping me to keep things in perspective while making our department a nice and
warm place to study.


Table of Contents:
1. INTR O D UCTIO N .................................................................................................................................................. 13
1.1 BACKGROUND INFORMATION ..................................................................................................................... 13
1.2 THE DIFFERENT TYPES OF M AJOR D ISASTERS ............................................................................................ 15
1.2.1 Natural disasters .................................................................................................................................. 17
Earthquakes ....................................................................................................................................................................... 18
F lo o d s ............................................................................................................................................................................... 2 0
1.2.2 Technological disasters ..................... I I ................................................................................................. 21
Industrial disasters ............................................................................................................................................................ 22
Nuclear disasters ............................................................................................................................................................... 23
1.3 N EED FOR PARTICIPATION OF THE PRIVATE SECTOR ................................................................................... 24
1.4 D ISASTER RESOURCE N ETW ORK (DRN) .................................................................................................... 26
1.5 A PPROACH ................................................................................................................................................. 28
2. R ISK A SSESSM ENT A N D RISK R ED UCTIO N ............................................................................................... 31
2.1 D ISASTERS AND RISK M ANAGEMENT DEFINITIONS .................................................................................... 32
2.1.1 Natural D isasters, Vulnerability and Hazard definitions ..................................................................... 32
2.1.2 Risk M anagem ent ................................................................................................................................. 33
2.2 H AZARD AND VULNERABILITY ANALYSIS .................................................................................................. 33
2.2.1 H azardAnalysis ................................................................................................................................... 33
2.2.2 Vulnerability Analysis .......................................................................................................................... 35
Physical factors ................................................................................................................................................................. 36
Social factors .................................................................................................................................................................... 37
Economic factors .............................................................................................................................................................. 38
Environmental factors ....................................................................................................................................................... 39
2.2.3 M apping ............................................................................................................................................... 41
2.3 RjSK REDUCTION ....................................................................................................................................... 42

2.3.1 Land planning ...................................................................................................................................... 43
2.3.2 Environm ental M anagement and Development planning ................................................................. 44
2.3.3 Resistance Strategy via the protection of major facilities ................................................................. 46
2.3.4 Early warnings ..................................................................................................................................... 47
2.3.5 Networking ........................................................................................................................................... 48
2.3.6 Recomm endations ................................................................................................................................ 49
3. IN SURA N C E .......................................................................................................................................................... 51
3.1 INTRODUCTION TO INSURANCE AND REINSURANCE ................................................................................. 51
3.2 D ISASTERS DA TA SETS .............................................................................................................................. 53
3.3 INSURANCE FOR THE VOLUNTEERS............................................................................................................. 55
3.3.1 Liability basics ..................................................................................................................................... 55
Negligence........................................................................................................................................................................57
Strict liability....................................................................................................................................................................57
Intentional m isconduct ..................................................................................................................................................... 58
3.3.2 R isk sharing and transfer ..................................................................................................................... 58
Accident and injury policies.............................................................................................................................................59
W orkers' Compensation (W C).........................................................................................................................................59
Insurance and international coverage ............................................................................................................................... 60
3.3.3 The Volunteer Protection Act............................................................................................................... 61
3.3.4 The role of Security .............................................................................................................................. 62
3.4 CONCLUSIONS ON INSURANCE.................................................................................................................... 63
4. THE ROLE OF INFORMATION TECHNOLOGY...................................................................................... 65
4.1 A SOURCE OF INFORMATION.......................................................................................................................65
4.2 A DATABASE..............................................................................................................................................70
4.3 A TOOL FOR EDUCATION AND TO COMMUNICATE ...................................................................................... 72
4.3.1 A good collaboration tool .................................................................................................................... 72
4.3.2 A tool for education.............................................................................................................................. 74
8

5. SU M M A R Y A N D C O N C LUSIO N S .................................................................................................................... 77
5.1 SUM MARY .................................................................................................................................................. 77
5.2 CONCLUSIONS ............................................................................................................................................ 79
APPENDIX A - MUNICH RE NATCATSERVICE - THE TEN LARGEST NATURAL CATASTROPHES
IN 2002 ........................................................................................................................................................................ 81
R EFER EN C ES ........................................................................................................................................................... 83

List of Figures:
FIGURE 1- NUMBER OF EVENTS 1970-2002 FORM SIGMA RE'S SIGMA STUDY 2002................................................. 14
FIGURE 2 - DISTRIBUTION OF NATURAL DISASTER FATALITIES (1975-2001)............................................................ 15
FIGURE 3 - DISTRIBUTION OF TECHNOLOGICAL DISASTERS FATALITIES (1975-2001)................................................. 16
FIGURE 4 - THE AVERAGE ANNUAL DAMAGES IN US DOLLARS PER NATURAL DISASTER TYPE FROM 1990 TO 2001 ...... 18
FIGURE 5 - WORLD SEISMICITY 1975 TO 1995 FROM USGS NATIONAL EARTHQUAKE INFORMATION CENTER............ 19
FIGURE 6 - FLOODED A USTRIA...................................................................................................................................... 21
FIGURE 7 - AVERAGE ANNUAL DAMAGES IN US DOLLARS PER TECHNOLOGICAL DISASTER TYPE FROM 1990 TO 2001 22
FIGURE 8- THIRTY YEARS OF "NATURAL" DISASTERS FROM CRED AND MUNICH RE ................................................ 25
FIGURE 9 - DISTRIBUTION OF NATURAL DISASTERS FATALITIES, BY COUNTRY AND TYPE OF PHENOMENA (1975-2001)34
FIGURE 10 - INTERACTION OF VULNERABILITY FACTORS FROM LIVING WITH RISK, A GLOBAL REVIEW OF DISASTER
REDUCTIO N IN ITIATIVES ...................................................................................................................................... 36
FIGURE 11 - ENVIRONMENTAL DEGRADATION AND RELATION TO DISASTER RISK FROM "LIVING WITH RISK" ISDR
R E PO R T ................................................................................................................................................................ 3 9
FIGURE 12 - BOSTON FLOOD HAZARD AREAS GENERATED AT HTTP://WWW.ESRI.COM/HAZARDS/MAKEMAP.HTML...... 41
FIGURE 13 - RELIEFWEB A FEW DAYS AFTER THE EARTHQUAKE THAT HIT BINGOL, AN EASTERN PROVINCE OF TURKEY,
ON T HURSDA Y 1 M AY 2003 ................................................................................................................................ 68
FIGURE 14 - WORLD WEATHER WATCH METEOROLOGICAL SATELLITE NETWORK FROM THE WORLD METEOROLOGICAL
O RG A N IZA TIO N ................................................................................................................................................... 7 1
FIGURE 15 - TENTATIVE DRN SHARED SPACE ON GROOVE.NET................................................................................. 73
FIGURE 16 - DIFFERENT TOOLS AND APPLICATIONS OF GROOVE ................................................................................... 74
10

List of Tables
TABLE I - SUMMARY TABLE OF EM-DAT, NATCAT AND SIGMA DATABASES FROM "THE QUALITY AND ACCURACY OF
DISASTER DATA: A COMPARATIVE ANALYSES OF 3 GLOBAL DATA SETS" BY DEBARATI GUHA-SAPIR AND REGINA
B E LO W ................................................................................................................................................................ 5 4
TABLE 2 - CLASSIFICATION OF THE DIFFERENT TYPES OF LIABILITIES ...................................................................... 57
11

12

Chapter 1
1. Introduction
1.1 Background information
According to Swiss Re's latest sigma study, "Natural catastrophes and man-made disasters in
2002", catastrophes cost insurers USD 13.5 billion worldwide. 344 events have been recorded of
which 130 were natural catastrophes and 214 man-made disasters. The most costly events were
the floods in Europe and the storms in the US.
During 2002, some 11,000 people throughout the world were killed in natural catastrophes in the
year 2002 and man-made disasters were responsible for 10,000 fatalities worldwide; flood
13

claimed the most victims with more than a third of the fatalities caused by natural disasters. After
the extraordinary losses of 2001, financial losses resulting from catastrophes returned to more
average levels in 2002. However, as the European floods show, large losses remain a real threat.
250
200
150
100
50
01970 1975 1980 1985 1990 1995 2000
- Natural catastrophes - Man-made disa sters
Figure 1- Number of Events 1970-2002 form Sigma Re's Sigma Study 2002
Indeed, people will always face natural disasters, but it seems that disasters nowadays are
frequently generated by or aggravated by human activities. The poverty as well as the increase of
the density of the population is making the world more and more vulnerable since more people
are living in riskier situations. The number of people at risk is growing every year and most of
this population is located in developing countries where the resources are limited. Many actions
can be taken in order to reduce the devastating consequences of disasters such as better planning
and new forecasting tools.
In order to understand how the situation is handled, we first need to analyze the different types of
high-profile natural catastrophes that are causing the highest losses, both in terms of economic
and in terms of fatalities.
14
1.2 The different types of Major Disasters
Theoretically, natural hazards, should equally affect rich and poor people but in practice, the poor
have a tendency to be more exposed and affected. One of the main reason is because the rich
people live in better housing and on safer land and are also fewer.
Every year, many important disasters are occurring in different part of the world, affecting
emerging economies as well as industrialized countries. Some of those disasters can be predicted
but others are totally unexpected.
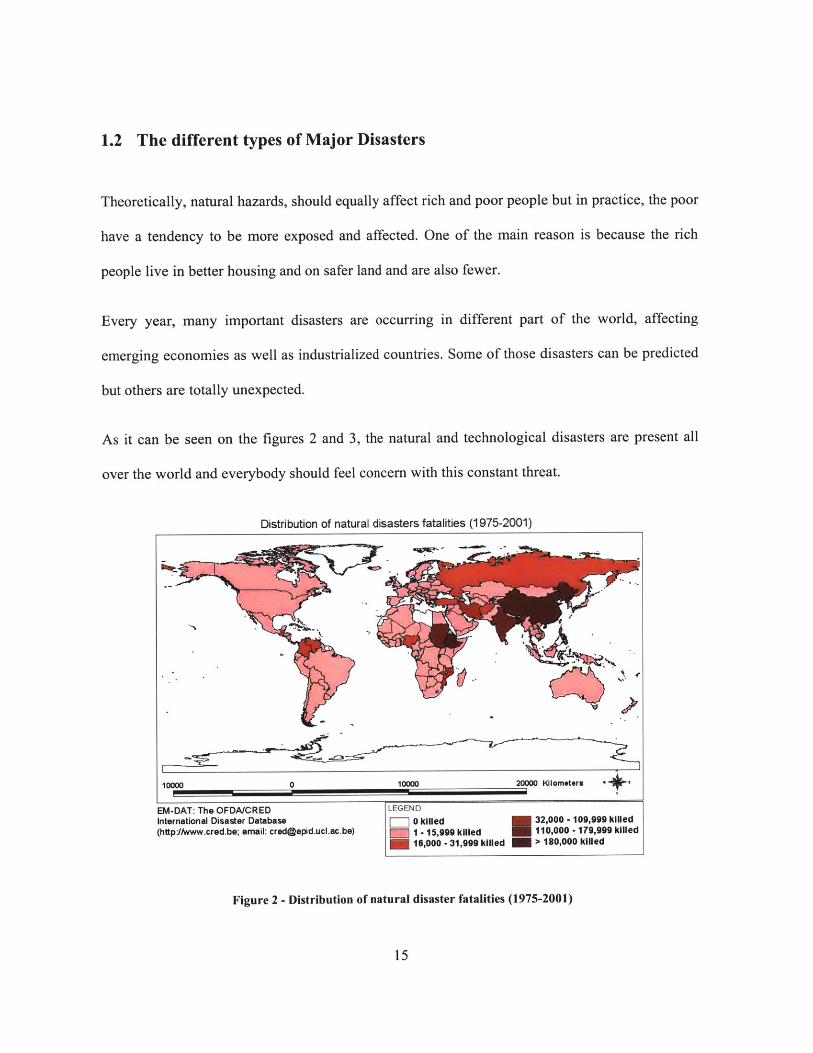
As it can be seen on the figures 2 and 3, the natural and technological disasters are present all
over the world and everybody should feel concern with this constant threat.
Distribution of natural disasters fatalities (1975-2001)
10000 0 10000 20000 KIlometers
EM-DAT: The OFDAICRED LEGEND
International Disaster Database 0 killed 32,000 - 109,999 killed(httpJlwww.cred.be; email: [email protected]) I - 15,999 killed 110,000 - 179,999 killed
15,000 - 31,999 killed > 180,000 killed
Figure 2 - Distribution of natural disaster fatalities (1975-2001)
15

Distribution of technological disasters fatalities (1975-2001)
L
10000
EM-DAT: The OFDA/CREDInternational Disaster Database(httpJ/www.cred.be; email: [email protected])
LEGEND
- 0 killed 2,301 - 4,300 killedI - 1,100 killed 4,300 - 9,500 killed
1,101 - 2,300 killed > 9,500 killed
Figure 3 - Distribution of technological disasters fatalities (1975-2001)
For the CRED in order to build their databases, a disaster is a situation or event, which
overwhelms local capacity, necessitating a request to national or international level for external
assistance. In order for a disaster to be entered in EM-DAT at least one of the following criteria
has to be fulfilled:
0 10 or more people reported killed;
* 100 people reported affected;
* a call for international assistance; and/or
* declaration of a state of emergency.
16
9! t --
10000 20000 KIlometers
10.,

With killed the people confirmed dead, or missing and presumed dead and affected the people
requiring immediate assistance during a period of emergency, i.e., requiring basic survival needs
such as food, water, shelter, sanitation and immediate medical assistance.
In order to better understand the different risks, we will first try to depict the most important
natural and technological disasters.
1.2.1 Natural disasters
Natural disasters can be of many types including floods, earthquakes, drought, storms, tropical
cyclones and hurricanes, tsunami, avalanches or volcanic eruptions.
Those natural disasters are part of 2 major groups: the geophysical and hydro-metrological
disasters. In this section, we will try to analyze the 2 types of disasters, one of each group, that
are generating the highest number of fatalities and also very high damages: the earthquakes and
the floods.
The figure 4 represents the average annual damages in US Dollars per disaster type from 1990 to
2001. It is showing that the continent that is the most affected is Asia in terms of damages and
that earthquakes, Storms and Floods have been the main sources of damages over the last 10
years.
17

Average annual damages ($US) 1990 to 2001
00 C, C: Other
W Stmo
MU C:P Voice -, 0-
Flood 0)
* Eerth u
C* Oroug
C)~ Aw/La (
C > .- 0it 10
*0 CD C
CD
0 0x
Afic AmPia Asa E"p caiaArc mrcsAsa Erp caiEMDAT The CFACE nem)lDsstrDtbs-E 8-~~crd~e
Figure 4 - the average annual damages in US Dollars per natural disaster type from 1990 to 2001
In order to better understand the risks associated to any activity closely related to disaster, we are
going to analyze the earthquakes and floods.
Earthquakes
The largest natural catastrophe in 2002 in terms of fatalities has been the earthquake that hit
Afghanistan in March and killed around 2,000 people. Earthquakes are a main source of victims
caused by natural disasters. Each year, thousands of people die and some of those lives could
have been saved with a better awareness.
An earthquake is reflected by the sudden shaking the ground due to a change of position of rock
below the Earth's surface. The shifting masses send out shock waves that may be powerful
18

enough to alter the surface of the Earth, thrusting up cliffs and opening great cracks in the
ground.
The damages that can be observed above the surface depend on the amplitude, the frequency and
the length of the vibrations.
Larger earthquakes generally initiate with slight tremors but quickly take the form of one or more
violent shocks, and end in vibrations of gradually diminishing force called aftershocks. The point
of origin of an earthquake below the surface is called its focus and above it is called the
epicenter. The magnitude and intensity of an earthquake is determined by the use of scales, e.g.,
the Richter scale and the Mercalli scale.
World Seisnidty: 1975-1995
30
0'
-30'
-U
- 0- -u
- -71
-- hi
--301
DEPTH
- -000
-30. Igo' 0 3' lO lO 1' -160' -120' -go' -60' -30'
Figure 5 - World Seismicity 1975 to 1995 from USGS National Earthquake Information Center
On average about 1,000 earthquakes with intensities of 5.0 or greater are recorded each year.
Great earthquakes (intensity 8.0 or higher) occur once a year, major earthquakes (intensity 7.0-
19

7.9) occur 18 times a year, strong earthquakes (intensity 6.0-6.9) 10 times a month, and moderate
earthquakes (intensity 5.0-5.9) more than twice a day. Because most of these occur under the
ocean or in under populated areas, they pass unnoticed by all but seismologists. Moreover, the
effects of earthquakes can be decreased through a better forecast and prevention.
On the morning of January 26, 2001 one of the most deadly earthquakes to strike India in its
recorded history happened, the Bhuj earthquake that shook the Indian Province of Gujarat
(Republic Day). One month after the earthquake, official Government of India figures place the
death toll at 19,727 and the number of injured at 166,000. Indications are that 600,000 people
were left homeless, with 348,000 houses destroyed and an additional 844,000 damaged. The
Indian State Department estimates that the earthquake affected, directly or indirectly, 15.9 million
people out of a total population of 37.8 million. More than 20,000 cattle are reported killed.
Government estimates place direct economic losses at $1.3 billion. Other estimates indicate
losses may be as high as $5 billion.
Floods
When listed by cause, floods claimed the most victims in 2002, namely more than 4000 lives.
A flood is an unusual high-water period in which water overflows its natural or artificial banks
onto normally dry land. Floods can have catastrophic consequences and usually happens as a
result of heavy rainfall, from melting ice and snow, or from a combination of these.
Floods generate millions of dollars in financial losses every year. They damage properties, cause
deaths and soil erosion and engender a lot of destruction.
20

Floods should be taken into consideration when planning the construction of bridges and dams,
for example, as well as good use of land. In 2002, many floods happened all over the world. In
August 2002, heavy rains across central and Eastern Europe have created flooding conditions not
seen for centuries, killing more than 100 people, forcing the evacuation of hundreds of thousands
of others, and devastating historic city centers in Germany and the Czech Republic. Flooding also
has hit communities in Austria, Slovakia, Russia and Romania.
Figure 6 - Flooded Austria
1.2.2 Technological disasters
We need to consider the other types of disasters that can be even more fatal than natural disasters,
the technological disasters. Many accidents are happening all over the world, involving chemicals
and radioactive materials. It can be industrial: chemical spill, collapse of industrial structures,
explosion, fire, gas leak, poisoning, radiation but also fire.
Nations, by being more and more developed are more subject to technological disasters.
21

Average annual damages ($C)
( - WaterRailRoad
Q>sMsc:OtherMsc:Fire
CD Msc:Cipse t9
Ind:Othero - nd:Fire
ot Ind: Ctpse(DcInd:Spill
C))
ADic AmEcsAi uoeOena
Ms EM0)
0.0 CN
C)0
E
Africa Americas Asia Europe Oceania
EM-DAT The OFDN/CRED International Disaster Database(http:/Avow.cred.be)
US) 1990 to 2001
Africa Americas Asia Europe Oceania
Figure 7 - Average annual damages in US Dollars per technological disaster type from 1990 to 2001
Industrial disasters
An industrial disaster is an accidental event occurring on an industrial site and leading to serious
immediate consequences for the workers, the surrounding populations, the belongings or the
environment.
In the evening of Dec. 3, 1984, one of the worst industrial disasters of all time occurred in
Bhopal, gas leaked from a tank of methyl isocyanate (MIC) at a plant in Bhopal, India, owned
and operated by Union Carbide India Limited (UCIL). This poisonous gas caused death and left
the survivors with lingering disability and diseases. The state government of Madhya Pradesh
reported that approximately 3,800 persons died, 40 persons experienced permanent total
disability, and 2,680 persons experienced permanent partial disability.
22

The Bhopal disaster was the result of a grouping of many errors: technological, organizational,
and also human. In the Union Carbide case, safety measures that should have been morally taken
were absent due to a desire to cut costs at the expense of safety but it cannot be justified.
Emergency procedures were also lacking and the absence of systems to care for and compensate
the victims worsened the long term effects.
This example illustrates the problem that could arise from negligence or willingness to save
money at all cost. Measures need to be taken in order not to have this type of disaster happening
again.
Nuclear disasters
When we are thinking about nuclear disasters, most of us are remembering the case of
Tchernobyl but it also includes the pollutions or contaminations associated with the use of
nuclear facilities and radioactive waste.
On April 26, 1986 at 1:23 am technicians at the Chernobyl Power Plant in the Ukraine (former
Soviet Union) allowed the power in the fourth reactor to fall to low levels as part of a controlled
experiment which went wrong. The reactor overheated causing a meltdown of the core. Two
explosions blew the top off the reactor building releasing clouds of deadly radioactive material in
the atmosphere for over 10 days. The people of Chernobyl were exposed to radioactivity 100
times greater than the Hiroshima bomb. The people of the world and Northern Europe were
greeted with clouds of radioactive material being blown northward through the sky. Seventy
percent of the radiation is estimated to have fallen on Belarus and 10 years later babies are sill
being born with no arms, no eyes, or only stumps for limbs. It is estimated that over 15 million
23
people have been victimized by the disaster in some way and that it will cost over 60 Billion
dollars to make these people healthy. More than 600,000 people were involved with the cleanup,
many that are now dead or sick. The Chernobyl Plant is made up of 4 graphite reactors; Number
4 exploded in 1986, Number 2 was shut down from a fire in 1991.
1.3 Need for participation of the private sector
The world has always witnessed a perpetual succession of disasters: earthquakes, floods,
hurricanes / typhoons, landslides and volcanic eruptions that have caused the loss of many
thousands of lives, caused direct economic losses in the tens of billions of dollars, and terribly
impacted the developing countries.
However, more and more people are being affected by disasters. As stated in the anniversary
edition of the World Disaster Report, reducing disaster risk is an urgent priority. Technology, as
well as the increase of the density of the population around the globe, is bringing new risks and,
in order to lessen its impact, deployment of means need to be much faster and effective through
new ways of approaching risk management.
As seen in the following graphs from the Word Disasters Report of 2002, the number of people
killed by "natural" disasters is decreasing but is still too important and should be reduced.
Additionally the populations are facing more and more technological disasters. With the
urbanization that is leading to high densities and associated with poverty, it creates a vulnerable
context where people are at risk for high impact disasters. The poor are the most exposed to
disasters since they have fewer resources to avoid or handle the impacts.
24

Thirty years of "natural" disasters2m 2 bn 700
I's M ~ s 6n500400P 2,000
M 0n 1,500300
1,000200a
O.s M o.5 bon
100 500
0 M o bn 0 apGo &
People reported People reported Economic losses US$ billions, Number of reported disasterskilled Uaffued 2000 wvues Some: CEIOSource: CRE D Surce: C ED Source: Munid Re
Figure 8- Thirty years of "natural" disasters from CRED and Munich Re
Up to the end of the 1960s, when a disaster was happening, organizations such as Red Cross or
national civil defense institutions were the only ones trying to respond to it and we can not really
say that the concept of disaster management was truly present.
During the 1970s and 1980s, the concept of disaster preparedness emerged and was developed. In
1971, the United Nations Disaster Relief Office which is now the United Nations Office for the
Coordination of Humanitarian Affairs (UNOCHA) was established to mobilize and coordinate
relief activities from all sources in times of disaster.
During the 1990s, the focus was then shifted on disaster prevention. In the words of United
Nations Secretary-General Kofi Annan, "We must, above all, shift from a culture of reaction to a
culture of prevention. The humanitarian community does a remarkable job in responding to
25

disasters. But the most important task in the medium and long-term is to strengthen and broaden
programs which reduce the number and cost of disasters in the first place. Prevention is not only
more humane than cure, it is also much cheaper" (IDNDR 1999b).
Nowadays, more and more governments and international organizations are promoting risk
reduction as the only sustainable solution for decreasing the social and economical impacts of
disasters.
This brief overview of the actual disaster situation shows the necessity of the involvement of the
private sector in disaster-related activities. Up to now, the private sector is mostly contributing
via donations but with the increase in the impacts of the disasters, it represents a reservoir of
knowledge that should be use to obtain a more effective response in case of disaster.
1.4 Disaster Resource Network (DRN)
The Disaster Resource Network, created under the auspices of the World Economic Forum,
enables responsible corporate citizens the opportunity to provide meaningful support to the global
community.
DRN was initiated in 2001 in the belief that the private sector has relevant resources to help saves
lives, mitigate suffering and damage, and put the global market back on course after serious
disruptions by natural or other disastrous events. The private sector not only has resources, it
bears an inherent responsibility to mobilize its resources.
Until then, the only way readily available to most corporations to help in disaster situations was
by providing funding to relief agencies. Of course, this remains an important and useful
26

contribution. Now, DRN uniquely provides an efficient way for firms to engage their best
resources - their employees - as volunteers in the relief effort. This engagement provides lasting
benefits to the individual volunteer and to the firm.
The Disaster Resource Network (DRN) will be most effective if it can respond to disasters
quickly and in a way that is easily incorporated into the overall relief effort. Recognizing that
disaster response requires speed and is therefore often most effective when local resources are
quickly brought to bear, DRN will operate through a network of regional coordinators and
national representatives. Its goal is to establish a decentralized network around the globe.
DRN has established working relationship with a variety of member companies in various
industry sectors, and with a range of leading humanitarian organizations. In a sense, DRN is a
coordination resource between "many resources" and "many needs". DRN helps companies to
provide support to well-established, effective humanitarian organizations. They do not duplicate
the efforts of those organizations but only make it easier to share relevant information.
DRN has decided to identify two "test regions", establishing a network over the coming year.
These regions are India and Mexico - in both countries the DRN will closely collaborate with the
local business community, government officials and humanitarian organizations to create a
network that efficiently responds to local requirements.
DRN operating funds are provided through a membership dues program and are used exclusively
to conduct DRN's mission. Although cash contribution can be made through DRN for
disbursement to humanitarian organizations, that is not the primary mission of DRN.
27

However, many factors are explaining the lack of involvement by private sector and we will try
to analyze them. There can be many reasons preventing a company to participating into disaster
related activities. Sometimes, it can be just because they never received a request, they needed a
focus of company outreach or were to far from the disaster. It can also be a problem of logistics, a
lack of awareness of specific needs or financial concerns. Ultimately, some companies might
decide not to participate due to liability concerns.
1.5 Approach
The purpose of this study is to identify the different types of risk and risk management in order to
increase the participation of the private sector in disaster relief operations. This could generate
the incentive for a collaborative work in an effective and efficient manner despite the number of
agencies involved in disaster relief and fund raising in the corporate world.
Chapter 2 after providing an overview of the risk and risk management concepts focuses on
assessing risks and through a hazard and vulnerability analysis and then by presenting ways to
mitigate them
Chapter 3 presents the ultimate solution that is insurance. It describes risk sharing and transfer
with the role of insurance and reinsurance. It also presents the different disaster data sets and
ways to insure the volunteers are discussed.
Chapter 4 presents the importance and the role of Information Technology in Disaster Risk
Management activities as an informative tool but also as an educational and communicational
tool.
28

Chapter 5 will present a summary and conclusions for this thesis with recommendations and
suggestions for the future steps.
29

30

Chapter 2
2. Risk Assessment and Risk Reduction
Risk assessment is a process based on a review of both technical features of hazards and also the
vulnerability analysis in order to determine to what extent some people would be in a potentially
risky situation.
Risk Reduction is a set of measures that can be taken by the society to lessen the impacts of a
possible disaster. This includes prevention (measures to avoid) and preparedness and mitigation
(measures to limit) of the impact of the disaster.
31

2.1 Disasters and Risk Management definitions
2.1.1 Natural Disasters, Vulnerability and Hazard definitions
Natural disasters are occurring by the coincidence of a hazard with a vulnerable situation. The
term natural disaster is used to indicate an incident caused by natural forces. Such an event
usually results in a large number of individual losses and their scale depends not only on the
severity of the natural forces concerned, but also on man-made factors such as building design or
the efficiency of disaster control in the afflicted region.
In fact, we can simply write:
Disaster = hazard x vulnerability
"Strictly speaking, there are no such things as natural disasters, but there are natural hazards. A
disaster is the result of a hazard's impact on the society. So the effects of a disaster are
determined by the extent of a community's vulnerability to the hazard (or conversely, its ability,
or capacity to cope with it). This vulnerability is not natural, but the result of an entire range of
constantly changing physical, social, economic, cultural, political, and even psychological factors
that shape people's lives and create the environments in which they live. 'Natural' disasters are
nature's judgment on what humans have wrought" John Twigg
Thus, the risk for disaster is increased by an augmentation of either the hazard factor or the
vulnerability factor (or both). However, even if the hazard factor can be reduced in some situation
thanks to technologies, it is not always the case. In order to better manage disaster situations, we
32

thus have to look at the vulnerability factor. This can be done by doing a Risk Analysis and Risk
Assessment. In fact, the more accurate the data on threats, the more accurate the risk assessment
can be. Usually, some private security companies do risk assessments of many countries but the
information is very costly and often reveals an overestimation due to the risk in case of
uncertainty.
2.1.2 Risk Management
The Presidential / Congressional Commission on Risk Assessment and Risk Management
(PCCRARM) is defining Risk Management as the process of identifying, evaluating, selecting
and implementing actions to reduce and control risk to human health and the environment. The
process involves considering scientifically sound, cost-effective actions to reduce or prevent risk,
while taking into account social, cultural, ethical, political, and legal considerations (PCCRARM,
1997a, p.1).
Risk identification which includes hazard assessment and vulnerability assessment is essential for
the definition of strategies to manage disaster risk, including risk reduction and estimation of
potential losses needed for financing and transferring risk.
2.2 Hazard and vulnerability analysis
2.2.1 Hazard Analysis
Globally, we can distinguish two different types of hazards: the ones that are totally
unpredictable and the ones that we can somehow predict with the current technologies and thus
get prepared for.
33

Distribution of natural disasters fatalities, by country and type of phenomena (1975-2001)
10000 0 10000 Kilometers
EM-DAT: The OFDA/CRED LEGENDInternational Disaster Database 312.000 killed Volcano Avalanche/Landslide
(http://ww.cred.be; email: [email protected]) 72.200141led ,mina n500 killed Epidemic Other
Figure 9 - Distribution of natural disasters fatalities, by country and type of phenomena (1975-2001)
As it can be seen of Figure 9 - Distribution of natural disasters fatalities, by country and type of
phenomena (1975-2001), natural disasters of many different types are striking everywhere in the
world. Floods and windstorms are the hazards that most frequently lead to disasters in Asia, the
Pacific, Europe and North America, while it is droughts and epidemics that are reported in
African countries. In contrast, Pacific and Caribbean islands are most vulnerable to the effects of
tropical cyclones. El Nio events, floods, volcanic eruptions and earthquakes affect in greater
degree the Andean and Meso-American countries. Even within a specific region, such as the
Pacific, the frequency and intensity of specific hazards varies from one country to another.
Hydrometeorological hazards are most common and floods alone account for two-thirds of
people affected by natural hazards.
34

Some hazards are unpredictable whereas other can be foreseen which can lessen the impact
through appropriate measures. Thus, an earthquake of the same magnitude could kill many
people in some unprepared countries of South America whereas everybody could be safe in Japan
due to appropriate installations. In fact, those last few years, the world has been more focusing on
disaster risk reduction strategies instead of emergency assistance and crisis management as it was
done previously. This is due to the fact that even if most natural hazards are inevitable, disasters
are not.
2.2.2 Vulnerability Analysis
Vulnerability and capacity assessments are an indispensable complement to hazard assessment
exercises. Vulnerability is defined as the proportion of human lives, assets and economic activity
that could be affected in a particular location if a disaster was occurring.
Both hazard and vulnerability/capacity assessments employ the same type of actions that consist
of collection of primary data, monitoring, data processing, mapping, and social surveys
techniques, among others. However, in the case of hazard assessment, methodologies and
techniques are mostly involving Scientifics whereas in the case of vulnerability and capacity
assessment, the community at risk has an important responsibility.
By calculating potential damages and costs, it can help make decisions and organize disaster
reduction policies. As we said, vulnerability is mostly governed by human activity and thus, can
not be distinguish from the continuing development efforts.
35

Vulnerability has many different aspects that can be categorized in 4 groups of factors:
" Physical factors
" Social factors
" Economic factors
" And ecological factors.
Econonic
PhysW ..
Figure 10 - Interaction of vulnerability factors from Living with Risk, a global review of disaster reduction
initiatives
Physical factors
This theory is mostly based on the use of the land. Locations as well as the buildings are the most
important aspects of the physical vulnerability. Some people are living in safe areas and
conditions whereas others are more subject to disasters.
36

Physical vulnerability is generally a function of location or construction. In order to assess the
vulnerability, a comparison between the strength of the structure and its location is done and
based on the survey, estimation of the potential damage can be provided.
As a matter of fact, 90% of the global population increase is taking place in least developed
countries. Factors like high density and design and materials used for the construction are
generating unsafe habitat.
In many cases, food production is not enough to fulfill the demand of the population. Thus, in
Africa, as many as 10 million people have emigrated those last few years but the population is
then concentrating even more in risky areas. Urbanization leads to unregulated construction in
hazardous zones and the creation of communication and knowledge nests make them vulnerable
to the impact of catastrophes.
An example of this vulnerability has been the interruption of the Central-American intra-regional
market for more than half a month after hurricane Mitch damaged some parts of the Central
American Highway in 1998
Social factors
Social vulnerability is related to the level of happiness and comfort so the current living
conditions. This vulnerability can be affected by many different factors such as the level of
education, of public health, of cohesion and the culture of the population.
Depending on the group somebody is belonging to, this person will be more or less affected by a
hazard. Thus, women, very young or very old people, minorities will be more vulnerable.
37

Indeed, public health is a decisive part in social vulnerability. Access to basic infrastructures in
particular water supply and sanitation is needed. Related to poverty, the standard of health
reflects the hygiene and sanitation of a community. It is also revealing the exposure of the
population to diseases and infections.
Naturally, cultural ideology and education like access to information on disaster risk can also be
important aspects of social vulnerability. Culturally, some populations may have a fatalistic
vision of disasters that may prevent effective preparedness. The level of illiteracy also plays a
major role in emergency situations since it is indicating the ability to give access to information
and services.
Finally, cohesion and social security can help generate a good dynamic in case of disaster and
thus have an essential role.
Economic factors
As we already said, the poor are in general more vulnerable than other people. This group is more
incline to lose more and not recover as easily after a disaster.
Indeed, economic vulnerability takes account of the individual level of poorness but also the level
of debt and access to credit and loans but also insurances. In case it is lacking, the economy will
obviously be more vulnerable to a disaster.
The use of modern methods of agriculture and land use systems is also increasing the economic
vulnerability since traditional forms of productions were providing food security in case of
disaster and nowadays, it is not anymore the case like in the Pacific islands.
38

Direct economic losses consist of losses of physical assets owned by individuals, businesses and
the government. They include damage to the structures and infrastructures as well as loss of
inventory and agricultural produce.
Indirect economic losses include losses caused by the disturbance of resource allocation like
interruptions in transport.
Environmental factors
ENVIRONMENTAL DEGRADATION
1.oss of tridition-al coping prac-tices
I.ess acces tO
livelihlotds
Rapidurt anizatiO l
I- Z ilC
1ISASTER RISK
Figure 11 - Environmental degradation and relation to disaster risk from "Living with Risk" ISDR report
39
Degradation of resource base Alteration of naturl processesS lncretased inipacts of natural di'astvrs ( ;Ibal environmncital change
I .es abilit to absorb ilpacts * Chiange, i hazard patterns
S 1)ecreased resilienc_
I kfnrestatti nSe~a keve ris
C4oital area d'gradati n
Regressi in of glac iter
Wiodiverity loss
Siltation
I )r ught
Fstremieweather(iventes
Wind~ stt rm,
V loods
Wildi tirs
II

This graph is summarizing the key aspects of the environmental vulnerability due to the
degradation of resource base and the alteration of natural processes:
* Increased impacts of natural disasters
" Less ability to absorb impacts
* Decreased resilience
" Global environmental change
* And changes in hazard patterns
This environmental vulnerability is very often interacting with socio-economical factors and
sustainable development. Thus, the environmental degradation by lowering the natural resilience
to disaster impact is becoming more and more important. We can also wonder if the increase in
the number of floods in Europe is not partially due to a change in the agricultural policies.
Even though hazard mapping is easier thanks to GIS techniques, the addition of social, economic
and environmental factors on the maps remain the goal that is not yet achieved. However, one of
the major problems lies in the way to quantify and thus represent some soft variables and some
more work need to be done.
When hazard and vulnerability assessment are combined, it is then possible to develop estimates
of potential losses. By knowing the probability of the occurrence of a certain type of disaster and
its impacts, precise loss scenarios can be developed. Those tools can then be use by many people
40

among which governments which can use them to plan for development but also for
preparedness.
2.2.3 Mapping
Not only the data need to be gathered and analyzed but the results must be understandable by
policy makers. Thus, a proper mapping and presentation have to be done by either using standard
cartographic techniques or with a GIS (geographic information system).
Each type of hazard will have it own mapping techniques. Clarity is the goal to reach while trying
to integrate the relevant information.
us F1081HAZARD AREAS. - 28
:lwdba "Middlesex Co
*100 - Yi Flood
[1500 - \Ir Flood
oWcrtw Bdg[jNo Dscdc
Xt3
9
W 2003 1ESFIlk 3.8 vi 64 km ema
Figure 12 - Boston Flood Hazard Areas generated at http://www.esri.com/hazards/makemap.html
Maps are the usual way of presenting flood hazards. The flood-hazard areas are usually divided
according to severity (deep or shallow), type (quiet water or high velocity) or frequency. In
41

general, hazard assessments maps can distinguish high, medium and low risk areas as well as no
danger zones.
As it can be seen on Figure 12 - Boston Flood Hazard Areas generated at
http://www.esri.com/hazards/makemap.html , a lot of information can be found online. FEMA
and ESRI have agreed to a National Partnership in part aimed at providing multi-hazard maps and
information to US residents, business owners, schools, community groups, and local governments
via the Internet. Those maps are thus generated to support disaster prevention and mitigation
activities.
Many GIS softwares can be downloaded for free on the web. In fact, one of the restrictive factors
in hazard mapping is most of the time the lack of proper training capabilities. Very often, some
government employees don't have access to computers and thus, hazard maps are also not as
widely employed as they could be. Moreover, many people are not conscious of their potential
and very often maps are not shared and thus data is collected several times, or mismanaged.
2.3 Risk Reduction
The devastating consequences of recent disasters are highlighting the need to make the
development and implementation of technologies and methods for disaster prevention and
preparedness better. In fact, Risk in never really managed but organizations are managed in
anticipation of the uncertainty characterized by risk.
There are two approaches used to reduce the risk of disaster:
42

" Avoidance by preventing construction in risky zones or finding ways to modify theimpact of hazards such as by building dams
* Resistance by trying to reduce the damages caused by hazards by erecting structuresthat can survive their impacts.
2.3.1 Land planning
Most of the policies of risk and disaster prevention are based on effective land-use planning.
The interaction between population growth and thus demand for housing and the use of available
land is essential for risk management but land use planning can be difficult to put into practice
due to conflicting values.
The attribution of the use of the land can easily generate arguments principally at local level and
consequently all the members of the community have to be consulted and implicated during the
process of land use planning. Moreover, the needs of neighbors that can be from another country
have to also be taken into consideration. As an illustration, actions taken on rivers can have
serious impacts on the people living downstream and should be thought about.
Although regulatory strategies have been successful, they are being undermined by many external
factors. Thus, even if it is in developing countries where mega cities are emerging that the need
for planning is the greatest, regulatory approaches are more difficult to set up.
Usually, the practice of land use management operates through the following stages: strategic
planning, administration and fiscal control and follow-up and monitoring. It is also operating at
different geographical scales, from the local level where the participation is encourages to the
national level where sectoral economic policies are linked to the administration.
43

In order to implement an efficient risk reduction strategy, a set of actions can be taken such as:
" Ban the construction of housing in certain areas
" Set some regulations and monitor the construction of new housing
" Retrofit already built housing
* Relocate vulnerable populations
As it can be seen all over the world, the poorest communities are forced to live on high-risk land.
In fact, even if some actions have been taken in order to try to educate authorities on how to
make best use of land, little has changed in developing countries. Indeed, the challenge is more to
try to put into action a strategy to combat poverty that would at the same time take into
consideration the risk for disasters.
2.3.2 Environmental Management and Development planning
In fact, disasters and environment are intrinsically linked as the degradation of the environment
aggravates the impact of natural disasters. Thus, a healthy environment can increase the capacity
of societies to reduce this impact. This strategy for disaster reduction has been taken too lightly
and should definitely be encouraged.
To illustrate this, we could look at the more and more important role given to the understanding
of some ecosystems. For example, wetlands suffered from many factors such as a more modem
agriculture and river flow regulations modified due to infrastructure development. However,
those wetlands have a major role including water storage, flood mitigation, storm protection or
44

erosion control. Indeed, their role is essential not only for sustainable development but also for
disaster reduction.
Another example would be the role of the forests to protect against floods, landslide, erosion and
avalanches. We can thus wonder if the increase in the number of floods in Europe in not partly
the consequence of the loss of healthy ecosystems.
A good example of policies with a favorable effect on the reduction of disasters is water policies
that can be proposed to encourage sustainable use of water. Through appropriate pricing and
regulations, adjustments can be made depending on the forecast to avoid floods.
In fact, many economic incentives exist to facilitate disaster reduction. It can be through tax
incentives, subsidies and loans to compensate landowners and discourage certain land uses. In
addition to that, there can be pricing structures discouraging unsound use of resources or
easements with legal agreement to limit type and amount of development taking place on a
property.
In order to transform environment and development into action, regulations need to be adopted.
More and more developing countries are adopting legislation concerning issues related to
environmental management and there is an opportunity to address other issues related to disaster
reduction. Environmental and disaster reduction policies have to be mutually supportive and by
integrating hazard-thinking into decision-making relating to environmental policies, long-term
benefits as well as sustainability should arise.
45

2.3.3 Resistance Strategy via the protection of major facilities
Resistance can be seen as building safe structure with construction standards that correspond to
expected hazard exposure instead of deciding to relocate. Existing structures should be either
reinforce if it is possible or relocated.
Following a disaster, critical facilities are playing a major role and should be protected. Those
facilities include key utilities such as water and electricity supplies and communications and key
infrastructure such as public administration (police, fire, emergency service facilities but also
government offices) and institutional facilities like schools and hospitals.
The protection of critical facilities can be done through adapted standards of design and
construction. The problem resides in the fact that even though many disaster-resistant codes exist,
they are not enforced effectively. It also seems to be coming from a lack of incentives and
rewards and thus some people might want to make money just by cutting corners and even if
there is a strict code, it is then violated during construction. Moreover, the poorest population
very often composed of migrants is usually constructing without any permission and without
following any regulations. Then, there is a combination of improper design, poor construction
and inadequate maintenance that can amplify the impact of a disaster. In the case of old building,
since retrofitting is very expensive, it is understandable that failure can occur but there should be
no justification for modern buildings.
In terms of codes and policies, their development and enforcement is the responsibility of
government. Even if the development is easy, implementation is difficult since it necessitate an
agreement on the affordability and applicability. It is once again a matter of convincing local
46

populations that those policies are very important and need to be enforced and prevention has to
be developed. By enforcing the application of the codes in all public building, governments can
demonstrate to the public the best practices and show the example. The priority resides in the
application of measures and the goal is to reach an acceptable degree of protection.
Many challenges are presents like finding a way to deal with the existing buildings, a solution to
the problem of informal settlements and incentives that could allow a more widely enforcements
of construction codes and policies.
2.3.4 Early warnings
The objective of risk management and disaster relief operations is to in the end save some lives
and assets. Thus, early warnings are playing a major role in disaster reduction. Their goal is to
reduce the possibility of loss of life and damages by letting the communities threatened by
disaster know ahead of time that a hazard is going to occur.
The early warning systems are based on the involvement of many different stakeholders: the
public by being aware and participating, the governments by promoting early warnings and by
the support of the international community.
One of the major problems resides in the lack of communication and awareness. Efficient and
modern early warning systems require the exchange of information like meteorological data
worldwide. Collaboration and the evolution of sciences help developed more sophisticated early
warning systems. As an example, tropical cyclones can be precisely forecasted 48 hours in
advance. However, there is a problem in delivering the information to the public. Moreover, the
47

loss of property is seen as worst than the loss that could be caused by a disaster. Thus, the early
warning systems are not as effective as they should be at least in developing countries.
Forecasting and monitoring activities should be combined to hazard and vulnerably assessment.
With vulnerabilities maps, risk scenarios could be generated and more effective actions could be
taken. At the end, people need to be aware of the risks they are facing, the alert systems and their
meaning and what to do in case of alert. Thus progress needs to be made to have a better
participation of the public.
2.3.5 Networking
Disaster risk reduction can be accelerated through the creation of strong networks and
partnerships of different scales: from the local level to the international level based on common
interests and the same motivation to reduce disaster risk.
There is obviously a wide range of participants, disciplines and sectors that can be involved in
those partnerships and the objective is to create platforms for disaster reduction.
Academic institution as well as the private sector can play a major role in those partnerships. A
good example of those is DRN (Disaster Resource Network) whose Steering Committee is the
main governing body. Representatives at the highest level of the business community, academia,
international and non-governmental organizations and the World Economic Forum constitute the
Steering Committee.
Those representatives, coming from the industry, academia and NGOs symbolize the type of
collaboration that should be encouraged.
48

Another good example is the ProVention Consortium whose mission is to "To help developing
countries build sustainable and successful economies and to reduce the human suffering that too
often results from natural and technological catastrophes".
The ProVention Consortium is a global coalition of governments, international organizations,
academic institutions, the private sector, and civil society organizations aimed at reducing
disaster impacts in developing countries. The Consortium functions as a network to share
knowledge and to connect and leverage resources to reduce disaster risk. It focuses on synergy
and coordination so that efforts, and benefits, are shared.
2.3.6 Recommendations
Disaster risk can be reduced by a change in behaviors. Though this analysis of the different
actions that can be taken in order to manage the risk, it has shown that more work should be done
about regulations, incentives and education.
Thanks to regulations, authorizations to build in hazard zones should be denied and safe
construction should be mandatory. It is the role of local government to make sure that those
regulations are then enforced. Incentives can generate a positive dynamic and corporations and
individuals should be rewarded when acting appropriately. Education also has a major role to
play. Poor deserve to be informed and prepared. Awareness should be raised and it is by creating
partnerships with members from different sectors that disaster reduction associated with
sustainable development can protect vulnerable populations.
49

50

Chapter 3
3. Insurance
Insurance should be seen as the ultimate solution to protect a volunteer or a population and a
valuable risk financing tool. In this chapter, we will first introduce what is insurance all about and
present the role of reinsurance. We will then look at the volunteer's perspective and cover the
liability basics, the Volunteer Protection Act, the role of security followed by the risk sharing and
transfer,
3.1 Introduction to Insurance and Reinsurance
51

Individual facing risks such as losses due to natural hazard can manage the risk by buying and
insurance. The individual is then replacing a certain small payment (the premium) for a large but
uncertain future loss and the insurance is pooling risks by charging a premium based on the
characteristics of the risk of the individual. Since happily all the policy holders are not affected
by hazards, those not impacted help compensate for the others. This is one of the reason
explaining why the more individuals are buying insurance in a same area, the higher the premium
will be. In fact the cost is linked to the perceive vulnerability but however, some studies have
shown that the vulnerability is always underestimated.
As well as individuals are transferring some of their risks to insurance companies, insurance
companies are transferring some of their risks to reinsurance companies by buying reinsurance
treaties. In case of catastrophe, the reinsurer is paying the total amount of losses above a
predetermined deductible or net retention. Thus the definition of the catastrophe as a single or
multiple loss occurrences have an impact on the different amount and should also be taken into
consideration.
The CRESTA (Catastrophe Risk Evaluating and Standardizing Target Accumulations) zone data
set promotes "the accurate and efficient assessment and control of liabilities arising from the
insurance and reinsurance of natural perils" based on the zoning system established by the
world's leading reinsurers. Those data can be downloaded for free at www.cresta.org.
Based primarily on the observed or expected seismic activity within a country, CRESTA Zones
consider the distribution of insured values within a country as well as administrative or political
boundaries for easier assessment of risks. This is the standard used by reinsurers to evaluate their
treaties.
52

3.2 Disasters Data Sets
Up to now, there is no institution in charge of providing disaster and not any worldwide
standardized method for assessing damage. Currently, there are 3 data sets widely used that are
NatCat maintained by Munich Reinsurance Company, Sigma maintained by Swiss Reinsurance
Company and EM-DAT maintained by the Centre for Research on the Epidemiology of Disasters
(CRED).
Table 1 - Summary table of EM-DAT, NatCat and Sigma databases from "The quality and
accuracy of disaster data: A comparative analyses of 3 global data sets" by Debarati Guha-Sapir
and Regina Below presents a summary of the main characteristics of each database.
Many of the reinsurance calculations are based on the PML which is a financial measure of the
seismic vulnerability of a building. The PML or Probable Maximum Loss is an estimation of the
amount of money that would needed to restore a building to its pre-earthquake condition and is
assumed with a confidence of 90% so it means that there is only 10% chance that the damage
could be higher than the PML Theses analysis can be used in order to decide if a reinsurance
policy is needed and also to measure the value of an underwriting strategy.
53

Variable EM-DAT NatCat Sigma(CRED) (Munich Re) (Swiss Re)
Period IIII - p>..nI hP7) - pS4n4 197U - ir>ii
coveredNumber of 12,1110 hiill I17,II
entries Ir s /y
Type N .1-r LI Mli I1"mn kCurI4 is1s1 .21 I 2. .aua4n1 m d
epidemic) and mn-made rought nd 11manmd iliases(xldn
Criteria III 1rAk. *hI nrx it 20 h and .
an 4 l td i1iruxo> lsudlo 1 lose 4>4> I l 4 i 2o
1)4.c1 m1..1141 44 l 114. II. .14.4 >" Nlri. Io 28 iC *l. I P .4 4. ji1 I': I It ),I.14 I .- 'IL 7 I l 2S14. 111114 W >1
- W414,' c, I*. )I, III n I!
mWh11 i t wk
Methodology (or "Alr I nr 4. r, d4ntr, I:ll I nV
Sources 1' J." agnciesJ 0 111a,,atlmhaadDaynw pprsLodt I'Vi 1IA i I.I i2 . 1 .1 141 ( 118t~lS I. 11
4k I 41'!..
S1 Ik . L I o
otlicial gournnantal Jalabases and inG1rmtinrisrmeproias
Priority ~ P'1it I4110I. f1141 1 14 (I I "Ilk I~10411>4 1 4 I .14.>I. .4
SOUrce I\'. Lt I I,1, x rs m 4 wis Irt II c1> i,,:
Access [Xils.4. N, >4 m 1 > ::.
t1sers/Ptiblic IZCNC.4. CL.4 1 I:.114> \1'I .1111 i 4 11 i t.11.1, 1i.1.. . 14
pri 1 111IIE R, IA;1 I( A. A 11 1 I I- I '
o(i .114.'Ik'I L
lS(; ,,I
. mIuro~w,.,, nid -iti~ , 11 >Ik ItI
cotaIs 11sia t I ,r!I IurIl,
Wleb address: 1%% .C .4. :4.k14 . !III.4 .:l111:]1 .1 1 Wl.,.4.41> 4 4
Table 1 - Summary table of EM-DAT, NatCat and Sigma databases from "The quality and accuracy of
disaster data: A comparative analyses of 3 global data sets" by Debarati Guha-Sapir and Regina Below
54

Munich Re and Swiss Re are undertaking analyses about risk and trends based on their databases
either to serve the client (insurance companies) or for internal commercial policy. Those high
quality analyses and publications generated with adequate financial and human resources are
client oriented. The access is restricted and much information is not made available to the public.
On the other hand, EM-DAT is designed for scientific research and development community.
Therefore great effort was made from the start to develop clear and objective methods and
definitions, which are available to all users (http://www.cred.be/emdat/intro.htm ). This allows
the consumer to evaluate the quality, coverage and accuracy of the EM-DAT data and employ it
appropriately. Serving the development community, EM-DAT also focused on ensuring
completeness of human impact data.
As stated in The quality and accuracy of disaster data: A comparative analyses of 3 global data
sets, none of the three have adequate data on socio-economic impact and the little that exists by
way of homeless, affected, dead and injured is unsatisfactorily defined and often incomplete. This
is according to Debarati Guha-Sapir and Regina Below, in part due to lack of field methods to
capture social and economic costs. But reinforced effort to compile even those that exist has not
received much attention even by EM-DAT, which responds to the development and humanitarian
agenda.
3.3 Insurance for the volunteers
3.3.1 Liability basics
55

Up to recently, most of the volunteers did not care about liabilities and were thinking that they
were covered by the doctrine of "charitable immunity". However, from its erosion and the
evolution of the mentalities have emerged the necessities for the nonprofit organizations to
assume the responsibility (legal and financial) of their volunteers.
In order to understand the concerns of the nonprofit organizations, we first need to analyze the
key concepts in nonprofit liability.
The most important liability risk is coming from the "tort liability". By definition, a tort is a
"private or civil wrong or injury other than a breach of contract for which the law provides
damages". There can be different types of torts applicable in our case like negligence, intentional
misconduct or strict liability. In fact, thirty years ago, nonprofit, charitable organizations enjoyed
a general immunity from liability for torts but that immunity, created by case law in 1965, was
abolished by case law or statute in most states.
The principal aims of the tort system are to:
" Compensate injured parties; and
" Promote due care and diligence by requiring the party causing the harm to pay for thedamage.
The tort system is governed by very formal rules and is placing the parties in an adversarial
relationship. The following table is classifying the different types of liabilities.
56

Type of Characteristicsliability
Direct The organization is held responsible for its actions or failure to act
.i u . The organization is held responsible for harm caused by personsacting on its behalf
Strict Responsibility is automatic and a finding of negligence orSmisconduct is not required
Table 2 - Classification of the different types of liabilities
According to the Risk Management Resource Center, most tort cases involving nonprofit
organizations and volunteers generally belong to one of the following categories within the area
of torts: negligence, strict liability, or intentional misconduct.
Negligence
This is the most frequent type of tort in which the volunteer has failed to meet a duty of care.
In most of the case, the claim is made because the person acting as a volunteer did not meet the
appropriate level of care that could be expected from a reasonable person with the same
qualifications in the same situation.
In that case, the plaintiff must establish the injury based on the duty and identify the beach and
the direct and/or indirect causes.
Strict liability
In some cases, a company may have its workers working in unsafe conditions. It is then its strict
liability to cover the worker regardless of whether negligence has occurred. Thus, under workers'
57

compensation laws, an employer is responsible for injuries to a worker even though the worker's
negligence may have caused the injury.
Intentional misconduct
Intentional misconduct is a deliberate action resulting in an injury to another person or damage to
another person's property.
3.3.2 Risk sharing and transfer
The more volunteers and the more actions they are involved in, the more likely one of them can
be injured or involved in an accident while working for a non profit organization.
Thus, an organization deciding to send some volunteers should ask itself some questions like:
" What is the actual insurance coverage for your workers in terms of immediate costssuch as for medical treatment and evacuation and potential long term costs that couldarise from permanent disability?
" Is this insurance still valid in risk areas?
" What are the exclusion clauses of your insurance policy like in terms of workinghours or working assignment?
Two main options should be considered by an organization if it desires to insure volunteers
against the possibility of physical harm incurred in the course of volunteer service on behalf of
the organization: a volunteer accident-injury policy or workers' compensation coverage.
58

Accident and injury policies
Those policies which usually don't have deductibles are financing the cost of medical treatment
for volunteers in case they are injured while working for the non profit organization. These
policies typically cover the costs of emergency room services and follow-up treatment to pre-
determined limits based upon the kind of injury. A unique element of accident and injury policies
is that the claim will be paid regardless of whose responsibility it is. Those insurance policies are
usually used when all the other resources (other insurances like health insurance) have already
been utilized.
Workers' Compensation (WC)
At first sight, Workers' Compensation might look like the good alternative to provide a source of
recovery for injured volunteers. Since for some organizations, it is already mandatory to carry
this type of coverage for their employees, it is then very easy to add volunteers to their existing
policy.
However, WC presents many disadvantages: volunteers would not be able to have their lost
wages reimbursed and also premiums are based on the type of job and actual losses and not on
the time spent thus an accident can dramatically increase the cost per person if the number of
workers and volunteers is important.
59

Insurance and international coverage
Even if safety and security accidents cans have major financial consequences for the volunteer,
his family and his organization, most of the time the insurance coverage is not clear and in fact,
many aid agencies don't even always have the proper insurance cover.
Demands for compensation or assistance are processed on a case-by-case basis. Even if one could
think that all the volunteers are insured in the same way, in reality it is not the case, it would be
too expensive. In the case of Disaster Resource Network, which is composed of many companies
with different insurance policies, a common saving fund could be created that. This could be
created initially via a percentage of the initial contribution and the companies' participating
employees would then pay a monthly contribution.
Another solution would be to find an insurance or reinsurance company willing to insure all the
volunteers without taking their origin into account. By negotiating globally and by having a good
training program, the premiums could be decreased.
Finally, as described in the Operational Security Management in Violent Environments by
Koenraad Van Brahant, some staff members of NGOs can benefit from the UN 'security
umbrella'. It requires the signing of a specific Memorandum of Understanding with the UN. After
having first being 'sponsored' by a UN agency, the Memorandum of Understanding required is
screened by Dol and then has to be approved by the UN Security Coordinator in New York.
60

3.3.3 The Volunteer Protection Act
There are many expressions to describe the laws protecting people and organizations in the
nonprofit sector such as Good Samaritan Laws, Charitable Immunity, Volunteer Protection and
many others. However, even though many publications can be found on the subject, there is still a
very high degree of uncertainty.
In 1997, the Congress passed the federal Volunteer Protection Act [42 U.S.C. § 14503(a)] in
order to encourage the prospective volunteers who were fearful of being sued. When the VPA
was adopted, every state had a law limiting the liability of certain volunteers. The VPA
establishes a minimum level of protection that pre-empts state law except to the extent that state
laws provide greater protection.
The VPA provides immunity for volunteers serving nonprofit organizations or governmental
entities for harm caused by their acts or omissions if:
" The volunteer was acting within the scope of his or her responsibilities at the time of
the alleged act or omission.
" Appropriate or required, the volunteer was properly licensed, certified or authorized
to act.
" The harm was not caused by willful, criminal or reckless misconduct, gross
negligence or a conscious, flagrant indifference to the rights or safety of the
individual harm.
" The harm was not caused by the volunteer operating a motor vehicle, vessel, or
aircraft where the State requires an operator's license and insurance.
61

The VPA only applies to nonprofit organizations and governmental entities and doesn't prevent a
nonprofit from bringing an action against a volunteer and as stated in State Liability Laws for
Charitable Organizations and Volunteers by the Nonprofit Risk Management Center, many
volunteers remain fully liable for any harm they cause and all the volunteers remain liable for
some actions despite the VPA and contrary to what many people may believe, these laws do not
immunize nonprofits as well as volunteers.
3.3.4 The role of Security
Security is also playing a major role since it can prevent being in a situation where insurance is
needed. There can be many types of security strategies that can range from acceptance to
protection.
The acceptance strategy aims to reduce threats by increasing the acceptance or political and
social approval for the presence and the work of a volunteer in a particular context. It should be
based on broad-based relationships, exchange of messages or other means in order to establish
and maintain contact while trying to maintain a balance in the relationships.
On a different level, the protection strategy uses protective devices and procedures to reduce the
vulnerability of the agency without concentrating on the threat.
Whenever possible, the goal should be to seek acceptance but when it is not possible, protection
should be taken off in order to limit the risks
62

3.4 Conclusions on insurance
Insurance must be seen as a solution to buy the risk whenever it is not possible to eliminate it. In
order to establish the likelihood of a catastrophe, databases are widely used. However, even if
many data sets are available, none of them have adequate data on socio-economic impacts and
this should be improved in the future since social and economic vulnerabilities have proven to be
more and more important as seen in the previous chapter.
In terms of volunteers, the most important liability is the tort liability. Even if many laws such as
the Volunteer Protection Act are protecting the volunteer in some situations, it is not always the
case and security can help reduce the threats. The risk should then be shared or transferred by
considering the adapted policies on a case by case basis.
63

64

Chapter 4
4. The role of Information Technology
Information Technology is being used in a variety of fashion in reducing the impacts of disasters.
Information Technology has a major role to play in assistance with regard to disaster situations
and has several levels of interest and tools that used in the proper ways can facilitate risk
management.
Thus, it can be use as a source of information, a database or as a tool for education and to
communicate.
4.1 A source of information
65

There is a long list of valuable information sources that can be accessed and below you will find
a selection of some websites:
* FEMA located at www.femia.gov (Federal Emergency Management Agency)
The FEMA web site is updated 24-hours per day, 7-days per week so that people can
always have the latest information relevant to emergencies in the US.
FEMA's range of activities is very broad and the following list is an example of the
multiple actions taken by this agency.
- Advising on building codes and flood plain management
- Teaching people how to get through a disaster
- Helping equip local and state emergency preparedness
- Coordinating the federal response to a disaster
- Making disaster assistance available to states, communities, businesses and
individuals
- Training emergency managers
- Supporting the nation's fire service
- Administering the national flood and crime insurance programs
In termsdifferent
of disaster awareness for example, people can find useful information on thetype of hazards at http://www.feina.gov/hazards/ . People can then read what
66

they should specifically do in an earthquake situation and read preparedness information,background information, success stories and web links.
* ReliefWeb at www.reliefweb.int
ReliefWeb is a project of the United Nations Office for the Coordination of Humanitarian
Affairs (OCHA). ReliefWeb is the world's premier electronic clearinghouse for those
needing timely information on humanitarian emergencies and natural disasters - designed
specifically to help the humanitarian community improve its response to emergencies. It
has a searchable database of over 150,000 UN documents, policy studies and analyses,
dating back to 1981 and is used by government agencies, international bodies, non-
governmental organizations, research institutions, the academic community, media and
the general public in more than 170 countries.
It provides up to date documents as seen below on figure 13 a few days after the
earthquake that hit Bingol, an eastern province of Turkey, on Thursday 1 May 2003.
It is a useful tool for the humanitarian community and helps be aware of the situation in
real time.
67

ReUe~?~ Turkey: Earthquake - May 2003
The LatestThis page contains a list of the latest major documents added to ReliefWeb
pertaining to Turkey: Earthquake - May 2003.
[The Latest] [By Month] [By Source] [By Format] [FinancialTracking] [Maps]
4rrevious Next 1
wTurkey: Earthquake - May 200304-May-2003 I OCHA Turkey - Earthquake OCHA Situation
Report No. 4 NEW,
02-May-2003 I OCHA Turkey - Earthquake OCHA SituationReport No. 3
02-Ma-2003 I AFP Greek medical team to help in quakeaftermath NEW!
02-May-2003 I UNCOR UMCOR Hotline 02 May 2003:Argentina, India, Iraq, OccupiedPalestinian territory, Turkey NEW,
02-May-2003 I IRIN Turkey: Quake victims complain of slowassistance NEW!
02-May-2003 I AFP Death toll in Turkish quake rises to127 New!
02-May-2003 I IFRC Turkey: Earthquake in Bingol ProvinceAppeal No. 09/2003NEWi
02-May-2003 I IFRC Turkey: Earthquake Information BulletinNo 2NEW!
02-May-2003 I AFP Death toll in Turkish quake hits 115 NEWi
02-May-2003 I AFP Hopes fade for children trapped inTurkish quake NEW,
02-May-2003 I AFP Turkish police clash with quake victims,fire into the airNEw,
01-Mav-2003 I Govt. Germany Federal Foreign Minister Fischer on theearthquake in Turkey NEW!
Highlighted
QCNA Turkey--Earthquake OCHSituation Report No. 4
HFRC Turkgy:Earthquake in BingilProvince Appeal No.09/I03
Earthquake InformationBulletin No. 2
Figure 13 - ReliefWeb a few days after the earthquake that hit Bingol, an eastern province of Turkey, on
Thursday 1 May 2003
68

* RMRC located at http://www.eriskcenter.org/
The goal of the Risk Management Resource Center is to provide information that helps
local governments, nonprofit organizations, and small businesses manage risks
effectively. The intent is to support anyone whose job involves protecting the people,
property, assets, reputation, financial health, and services of his or her organization by
making risk management knowledge and practical information available online.
Many free publications generally provided in acrobat reader PDF can be downloaded at
http://www.eriskcenter.org/resource/downloadablepubs/index. html
The Risk Management Resource Center is a collaborative effort of the Public Risk
Management Association (PRIMA), the Nonprofit Risk Management Center (NRMC),
and the Public Entity Risk Institute (PERI).
* The ProVention Consortium located at www.proventionconsortium .org
As we said previously, the ProVention Consortium is a global coalition of governments,
international organizations, academic institutions, the private sector, and civil society
organizations aimed at reducing disaster impacts in developing countries.
Many very useful resources can be found like resource materials for conducting various
types of disaster-related assessments and for reducing risks, many links to many online
resources and major publications. Once again, recent free publications can be downloaded
at http://www.proventionconsortium.org/publications.htm as well as selections of online
publications of ProVention Consortium partners.
69

4.2 A database
There are also some websites specialized in offering more technical data.
The CRED maintains at www.cred.be an Emergency Events Database (EM-DAT) which contains
essential core data on the occurrence and effects of over 12,800 mass disasters in the world from
1900 to present. The database is compiled from various sources, including UN agencies, non-
governmental organizations, insurance companies, research institutes and press agencies.
National Meteorological Services (NMS) was first created for aviation but after evolving and
showing general local weather at http://www.met-office.gov.uk it is now doing climate forecast
and generates severe weather warnings. The NMS services are grouped by the World
Meteorological Organization (WMO). Data from all over the world are needed to provide
weather forecasts. If there were no WMO, the nations of the world would have to conclude
individual agreements with one another to ensure the exchange and availability of data to meet
their national requirements, such as provision of forecasts for the public and special services for
various economic sectors like agriculture, utilities (gas, electric power production) and so on.
70

METEOR (Russ ia)
COMS (Russia)76 EOTTIM
O aMS (ntpan)-140*E..
Y!Y!!-- !T!!:- METEOSAT (EUMETSAT)
KK ii:Ki KW-K 09Lcng tu de
;O emergency r a a t o im e i f d
and.respo ns mso ;i d aEt sa
roe f Tishee g i ver imoNnT
.......... P ....R ...
and resosemehais . fr the prvs and exhag 1f "bser7ati..a..data.and sp.aie
products....... ....ase .f..era.de ta elasteIsrm nt n eh d o b ev t
Programme ~ ~ ~ ~ ,A:!: an*teTr::a$yI..:rormm TC)
Each~~~~~~~~~~~~~~~~~.... Aay pphsedlnstasi vr1 ilo dt hrcesad200wahrcat
through ~ ~ ~ ~ ..... three W ,3.Rg....d13NtonlM toolgclCnte opraigwt
each~ ~ ~~~~~~~~~~~~~~~... ..e.i.reain.eahr...se.ndfreatsi.a..a.ae..ngne.dfahon h
role f IT s her agan ....imp.tant
71

Many new tools are used nowadays for disaster related activities such as GIS, Remote Sensing,
Satellite communication or GPS.
On Internet, a lot of information can be found even technical and updated databases or detailed
local maps. However, even though there is a profusion of information, there is no extensive
availability and even less at a local level. Moreover, it should be regularly updated and reliable.
There is a need for availability and exchange of disaster related information but it should be
accessible at local scales especially for poor and developing countries in order to reduce their
vulnerability that is more and more critical.
4.3 A tool for Education and to communicate
4.3.1 A good collaboration tool
As we previously mentioned, networking to help manage risk better. Collaboration should be
encouraged and many new IT tools can be used to facilitate these relationships. It can be by
communicating in a faster way through email but also by saving money and time by using Visio
conferencing software like Microsoft Netmeeting.
72

~DRN shared space
Created by Nathaks Assens an 317103 7:45:40 PM
Active41Nathalie Assens
OnkneMot Online
* Christian Manasseh
* tracysSuspended
Notes:
OiscwsoFite DocWmrt Review calendarr~ts A~To
Hide Chat
Figure 15 - Tentative DRN shared space on Groove.net
A useful tool that can be used to communicate with people is groove that can be downloaded at
groove.net. Members can be all over the world and share the same space where they can
communicate by chatting or voice conversation or by doing discussions. Students working on the
same subject in different parts of the world can use Groove to share web links and contacts or
give instant feedback on other documents.
Information Technology should then be seen as a tool that can ease collaboration and facilitate
information sharing. It is also through those types of initiatives that network can be created and
experience learnt from previous work can be shared with people in the same situation.
73

INVITEExtend invitations to new
mernbers via Groe instantmessage, WniAs
Messengr ermail.
AWARENESSGCooe Warkspace tracks
W isonline, whoisactie ina shared space,
where they are in thatspace as wellasnewimformationadded to
shared spaces.
CONVERSATIONUsers can talk with one
another viaIive voice or textbased chat within the cuntext of
their shared spaces. Menbscan also open a chat window tot
ctnious connmnicationcutside the context ofa Grwove
shared space.
-0Y - -
- ie Ve b# h~~f,14
-
Omar-
ADD TOOLUses can add newknctionality to anyshared space at anytime with as few astwo dicks of a mouse.
TOOLSTools are what youu e t"( "W"'in shared spaces.
Figure 16 - Different tools and applications of Groove
4.3.2 A tool for education
Developing a set of educational tools is very important for the future since this is through
education that people can be aware of the disaster risks and then take actions to be less
vulnerable.
A clearing house resource web site like relief web but for disaster and risk management would be
very useful. People could have access to information about disaster and risks and how to be
prepared and respond to them. It could also provide databases and web links and a discussion
74

forum could also be very useful so that people could share their experiences and give advices to
other people being in situations they have already experienced.
A good example of how it can be done is the OpenCourseWare, an initiative started in September
2003 by the Massachusetts Institute of Technology that can be found at ocw.nit.edu.
This project is the publication of MIT course materials for free and opened to the world. We
could have the same type of knowledge sharing about disaster management and this could be
particularly useful to populations that don't usually have access to that kind of information
locally. This type of initiative should be encouraged and having the same type of clearing house
for information about disaster and risk management could save lives by raising awareness.
However, the emergency technological revolution should be careful not to leave less advantaged
countries behind by not trying to share information with them and therefore increasing even more
the gap in terms of disaster management.
75

76

Chapter 5
5. Summary and Conclusions
5.1 Summary
In 2002, some 11,000 people were killed in natural catastrophes worldwide. The trend is that the
number of people at risk is increasing and most of those people are located in developing
countries where resources are limited. Reducing disaster risk is thus an imperative priority since
the growth of the population as well as poverty is putting the world in a more vulnerable state.
Moreover, developing countries have a higher degree of vulnerability and the impacts of
catastrophes are thus more important and can impact development.
77

Unfortunately, even if the evolution of Technology could be seen as a solution, it is in fact
increasing even more the number of fatalities with technological disasters. In fact, Technology
should be used more efficiently and the Private sector with its reservoir of knowledge could help
achieve disaster reduction.
Obviously, there is a need for disaster management and risk should be carefully assessed. Risk
assessment is a combination of hazard and vulnerability analysis and even if hazards are
sometimes unpredictable, vulnerabilities should be clearly identified. It appears that if physical
vulnerability is often taken into account, far too often social and economical vulnerabilities are
not considered. Data also needs to represent those neglected aspects in order to have them
understood and taken care of by policy makers.
Risk reduction can then be reached through avoidance or resistance. Many aspects can then be
looked at like land planning, environmental management and development planning, protection
of major facilities or early warnings. However, there are still problems with the disparity in
development of the countries all over the world and usually, even if abundant information and
regulations exist, there are not available and applied at a local level. One reason may be that these
types of resources while very important are not well organized and understood and there is not
enough incentive to enforce regulations.
Since it is not always possible to reduce risk, insurance should be seen as the ultimate alternative
to transfer the risk so that if a disaster is happening in a developing country for example, it will
not entirely ruin many years of development. Additionally, the liabilities of volunteers from the
private sectors should be considered seriously since the Volunteer Protection Act that could be
seen as a solution does not really immunize volunteers and nonprofits.
78

5.2 Conclusions
Based on this thesis, it appears that disaster reduction should be encouraged as well as the
creation of networks with people belonging to governments, academic institutions, international
organizations and the private sector. Those groups could reduce disaster impacts in developing
countries by generating a good dynamic to fight against the increasing number of people dying
each year because of disasters worldwide. More knowledge sharing initiatives should be
encouraged and Information Technology should be used as a way to facilitate this process.
However, in order to accomplish disaster reduction, all the groups affected by disasters should be
involved and participate and more money should be spent on information in order to raise
awareness.
Moreover, future policies should be more adapted to the local situations and deal with the local
vulnerabilities while also trying to implement sustainable development.
Indeed, Information Technology has a major role to play as it can facilitate the spread of
information and the communication among the actors of disaster reduction and also be used as an
educational tool. However, the revolution in the use of more sophisticated technologies should
not leave some developing countries behind and thus increase even more the gap with the more
advanced countries. A future step for disaster reduction would be the creation of a clearing house
resource web site like Reliefweb but for disaster and risk management.
Finally, the participation of the private sector is needed in bringing its reservoir of knowledge to
efficiently mitigate risks
79

80

Appendix A - Munich Re NatCatSERVICE - The
ten largest natural catastrophes in 2002
The ten largest natural catastrophes in 2002
By economic losses
Countryltegion
EuropeNorth and South KoreaUSA esp NebraskaChinaAustraliaWestern, central EuropeCaribbean. USAChinaFranceUSA 17 federal states
Countryfregion
EuropeWestern, central EuropeUSA 17 federal statesCaritbean. USAUSA esp Tennessee OhioAlabamaFranceUSA East MidwestGermany Britain
Event
FloodsTypmoon RusaDrought, heat wavesFloodsDroughtWnter Storm JeanetnHurricane LittFloodsFloodsTornadoes, severe storm
Event
FloodsWnter Storm JeanettTornadoes, severe stormsHurricane LiftTornadoes
FloodsVnter stormW nter Storm Anna
Fatalities Economic lossesUSS m
230 18,5C150 4500
3 300500 3 100
3,00033 2,3008 2,000
250 1 70023 120010 2000
Fatalitties Economic lossesUS$
230 18,50033 230010 2 0008 2000
600
23282
Central America Caribean. USA Hurricane isidoreUSA esp lowa llinots Michigan Severe storm
Country/region
Afgharvstan
Nepal Bangladesh. lrdaIndiaChinaBangladeshChinaIranEuropeVietnamIndonesia
Event
1 200400500850250
Insured lossesUS$
30CC170
1 500750
4501.500
Insured lossesUS$
3,0001.5001 500
750460
450300300250210
Fatalities Economic losses Insured lossesUSm US$m
EarthquakeFloodsNeat waveFloodsSevere stormFloodsEarthquakeFloodsFloodsFloods
2 COO12001 100
500270250245230155150
80
3 100
1 700300
18.50025
350
3 000
200
t2002 NatCatSERV1CE VAunchenei Ruck
81
Date
4-20 831 8-09July - AugustJuneJuly - December26-28 1023 9-3 107-22 88-9 927 4-3 5
By insured losses
Date
4-20 826-28.10
27 4-3 523 9-3 1010-11 11
8-9930 1.-226 -27 2.18-25 98-11 3
By tatalitbes
Date
25/26127 3.July -August10-22,5June3.57-22 82264-20 8July - October11 1-222

82

References
Books:
The International Federation of Red Cross and Red Crescent (2002), World Disaster Report
2002, focus on reducing risk
Vincent T. Covello, Joshua Menkes and Jeryl Mumpower (1986), Risk Evaluation and
Management
Kathleen J. Tierney, Michael K. Lindell and Ronald W. Perry (2001), Facing the Unexpected
Parasuraman S. and Unnikrishnan P. V. (2000), India Disaster Report towards a policy initiative
The World Bank (2000), Managing Disaster Risk in Emerging Economies
The World Bank (1999), Managing Disaster Risk in Mexico - Market Incentives for Mitigation
Investment
Oxfam Working Papers (2000), Risk Mapping and Local Capacities
Kurt A. Frantzen (2002), Risk-Based Analysis for Environmental Managers
Paul Pritchard (2000), Environmental Risk Management
Koenraad Van Brabant (2000), Operational Security Management in Violent Environments
83

Corporate Moral Responsibility: the Bhopal Incident by Richard T. de George
Volunteer Legal Handbook - 6th Edition (2001) by James D. DeWitt
Papers and articles:
International Strategy for Disaster Reduction (2002), Living with Risk. A global review of
disaster reduction initiatives
John D. Hey (2002), Experimental Economics and the Theory of Decision Making Under Risk
and Uncertainty, Geneva Papers on Risk and Insurance Theory
Christopher M. Lewis and Kevin C. Murdock (1996), The role of government contracts in
discretionary reinsurance marketsfor natural disasters , Journal of risk and insurance 1996 Vol.
63 No4
Mark J. Browne (2000), the Demand for Flood Insurance: Empirical Evidence, Journal of Risk
and Uncertainty 20(3): 291-306; May 2000
Lisa Meulbroek (2002), The promise and challenge of integrated risk management, Risk
Management and Insurance Review 2002, Vol. 5, No 1
WHO/EHA - Panafrican Emergency Training Centre (2002), Disasters and Emergencies, Addis
Ababa Updated March 2002 by EHA
Munich Re (2002), the ten largest natural catastrophes in 2002
UNEP (2002), State of the Environment and Policy Retrospective: 1972-2002
84

Presidential / Congressional Commission on Risk Assessment and Risk Management
(PCCRARM) 1997a
C. Donald Ahrens, (1994) Meteorology Today Workbook, West Publishing Company, New York
Disaster Resource Network - Corporate Member's Handbook 2003
The Possibility of Forecasting Earthquakes by Stuart Crampin & Sergei V. Zatsepin
http://www.seisi-no.denon.co.uk/Nov7th/cranpin.htiiml
The quality and accuracy of disaster data: A comparative analyses of 3 global data sets by
Debarati Guha-Sapir and Regina Below for The ProVention Consortium and The Disaster
Management Facility, The World Bank
State Liability Laws for Charitable Organizations and Volunteers by the Nonprofit Risk
Management Center - September 2001
Report on the UNDP Caribbean Regional Seminar on the Use of Information Technology in
Comprehensive Disaster Management - May 29-31, 2002
Web Links:
ReliefWeb: http://www.reliefweb.int/w/rwb.nsf
FEMA, http://www.feiiia.gov/
Federal Insurance & Mitigation Administration (FIMA), http://www.femna.gov/fima/
Risk World: http://www.riskworld.com/
85

Nonprofit Risk: http://www.nonproflitrisk.org
Risk Management Resource Center: http://www.eriskcenter.org/
Risk Assessment Information System: http://risk.lsd.ornl.gov/rap hp.shtnil
International Institute For Disaster Risk Management: http://www.idrmhomne.org/
ProVention Consortium http://www.proventionconsortiun.org/index.hti
The Public Entity Risk Institute PERI: http://www.riskinstitute.org/
Les plans de prevention des risques PPR: http://www.primn.net/
Management Assistance for Non Profit: http://www.mnapfornonprofits.org/
Bhopal: www.bhopal.con
Tchernobyl: http://www.chernobyl.com/info.htn
Some Definitions and Concepts by John Twigg:
http://www.adrc.or.ip/LWR/LWR abridged/definitions.pdf
Coping with Natural Hazards in Canada: Scientific, Government and Insurance Industry
Perspectives http://www.utoronto.ca/env/nh/toc.htm
USGS National Earthquake Information Center for World Seismicity
86
http://neic.usgs.gov/neis/general/seisiicity/world.htiiii