יולי גרמן, רואי אנואר MCDM - Multi Attribute Utility1 תורת תועלת מרובת תכונות.

RISK ASSESSMENT IN POWER SYSTEM USING MULTI-CRITERIA
DECISION MAKING (MCDM) METHODS
CAROLINE DAME SIAGIAN
A project report submitted in partial
fulfillment of the requirement for the award of the
Degree of Master of Electrical & Electronic Engineering
Faculty of Electrical & Electronic Engineering
Universiti Tun Hussien Onn Malaysia
FEBRUARY 2013

v
ABSTRACT
In recent years, immense power system outage events have happened across the
world. This is not exceptional to the Malaysia power system whereby on 27 Jun 2013
the system blackout occurred in the state of Sarawak, due to sudden dropping of
frequency. Hence, power system risk assessment has become an important and
mandatory task in planning, operation, maintenance and asset management of
utilities. There have been efforts devoted in searching for new methods and
procedures that effectively evaluate the risk of a power system. The objective of this
study is to rank and determine the most common cause of power loss outages in the
grid. This study implements multi criteria decision-making methods such as Analytic
Hierarchy Process (AHP) and Technique for Order Preference by Similarity to Ideal
Solution (TOPSIS). For data collection, it employed interviews of key participants,
review of documents including unpublished official reports and annual reports. From
the data collected there are four criteria identified, namely Duration Time (min),
Estimated Maximum Loss of load (MW), Estimated Energy No Supplied (MW-min)
and System Minutes. On the other hand, seven causes of power loss outages are
identified, they are Treat To System Security, Equipment Failure, Fire or Explosion,
Switching Risk, Tower Collapse, Accelerated Ageing of Equipment and Supervisory
Control System Failure. Results of data analysis show that both methods have
identified that Equipment Failure is the major cause, followed by Supervisory
Control System Failure.

vi
ABSTRAK
Beberapa tahun kebelakangan ini, beberapa gangguan bekalan elektrik yang besar
berlaku di seluruh dunia. Negara Malaysia tidak terkecuali daripada perkara ini di
mana pada 27 Jun 2013, gangguan bekalan elektrik yang besar berlaku di negeri
Sarawak yang melibatkan penurunan frekuensi bekalan. Maka, penilaian risiko untuk
sistem kuasa telah menjadi satu usaha yang penting dan wajib diadakan semasa
perancangan, operasi, penyenggaraan, dan pengurusan aset untuk sistem elektrik.
Pelbagai usaha telah dilakukan untuk mencari kaedah dan prosedur baru untuk
menilai risiko ke atas sistem kuasa . Objektif kajian ini ialah untuk membuat
penarafan dan mengenalpasti punca utama berlakunya gangguan bekalan elektrik
pada grid. Kajian ini menggunakan kaedah penentu-keputusan pelbagai kriteria
seperti Analytic Hierarchy Process (AHP) dan Technique for Order Preference by
Similarity to Ideal Solution (TOPSIS). Bagi pengumpulan data, kaedah temubual
dengan pihak yang terlibat dan rujukan dokumen yang berkaitan seperti laporan
rasmi dan laporan tahunan telah dilakukan. Daripada data yang diperolehi, empat
kriteria berkenaan gangguan bekalan elektrik telah dikenalpasti iaitu Duration Time
(min), Estimated Maximum Loss of load (MW), Estimated Energy No Supplied (MW-
min) dan System Minutes. Selain itu, tujuh punca bagi gangguan bekalan elektrik
turut dikenalpasti iaitu Ancaman kepada Keselamatan Sistem, Kerosakan peralatan,
Kebakaran atau Letupan, Risiko Pensuaian, Keruntuhan Menara, Peralatan yang
telah berusia, dan Kegagalan Sistem Kawalan Penyeliaan. Analisis data yang
diperolehi menggunakan kedua-dua kaedah yang dinyatakan (AHP dan TOPSIS)
menunjukkan Kerosakan Peralatan sebagai punca utama gangguan, diikuti oleh
Kegagalan Sistem Kawalan Penyeliaan.

vii
CONTENTS
TITLE
DECLARATION ii
DEDICATION iii
ACKNOWLEDGEMENT iv
ABSTRACT v-vi
CONTENTS vii - x
LIST OF TABLE xi
LIST OF FIGURE xii - xiii
LIST OF SYMBOL AND
ABBREVIATION
xiv
LIST OF APPENDICE xv
CHAPTER 1 INTRODUCTION
1.1 Project background 1 - 2
1.2 Problem statement 2 - 4
1.3 Project objectives 4
1.4 Project scopes 4
1.5 Contribution and claims of originality 5
1.6 Thesis outline 5
1.7 Summary 6
CHAPTER 2 LITERATURE REVIEW
2.1 Introduction 7 – 8
2.2 Power System Security 8 - 12
2.3
2.3.1
Steady State Security Assessments
Deterministic Approach 13 - 14
2.3.2 Probabilistic Approach 14 - 15
2.3.3 Comparison of the Probabilistic and
Deterministic Approaches 15 - 16

viii
2.4 Dynamic Security Assessment 16 - 17
2.5 Risk Based Probabilistic Approaches
in Power System Security 17 - 19
2.6
2.6.1
Risk Assessment Techniques in Power
System Adequacy
Operating Reserve Risk Assessment
19 - 21
2.6.2 Risk Based Assessments of Available
Transfer Capability 21 - 23
2.7
2.7.1
Risk Assessment Techniques in Power
System Security
Risk of Transmission Line Overload
23 - 24
2.7.2 Risk of Transformer Loading 24 - 27
2.7.3 Annual Risk of Transmission Line and
Transformer Overload 27 - 29
2.7.4 Risk of Special Protection Systems 29 - 30
2.7.5 Voltage Security Assessment 31 - 33
2.7.6 Risk of Transient Instability 33 - 36
2.7.7 Composite Risk of Power System
Security 37
2.7.8 Risk Based Approach for Maintenance
and Scheduling 37 - 39
2.7.9 Online Risk-Based Security
Assessment 39 - 41
2.7.10 Further Aspects of Risk Based
Approaches 41
2.8 An Alternative Form of Probabilistic
Approach 42 - 43
2.9 Analytical Hierarchy Process (AHP) 43 - 48
2.10 Technique for Order Preference by
Similarity to Ideal Solution (TOPSIS) 48 - 49
2.11 2.11 Summary 50
CHAPTER 3 METHODOLOGY
3.1 Basic AHP procedure 51
3.1.1 Develop the weights for criteria 51 – 53
3.1.2 Develop the rating for each alternative
in each criterion 53
3.1.3 Calculate the overall weights and
determine the priority 53 – 58
3.2 Procedure of TOPSIS 57 – 60
3.3 Summary
61

ix
CHAPTER 4 RESULT AND ANALYSIS
4.1 SESB transmission data 62 – 66
4.2 Risk assessment using Analytic
Hierarchy Process (AHP) 67 – 68
4.2.1
4.2.1.1
Criteria
Develop a pairwise comparison matrix
for each criterion
68 – 70
4.2.1.2 Normalizing the resulting matrix 70
4.2.1.3 Averaging the values in each row to
get the corresponding rating 71
4.2.1.4 Calculating and checking the
consistency ratio 72 – 73
4.2.2
4.2.2.1
Duration time (min), C1 vs
Alternatives
Develop a pairwise comparison matrix
for each criterion (C1)
74 – 75
4.2.2.2 Normalizing the resulting matrix 75
4.2.2.3 Averaging the values in each row to
get the corresponding rating 76 – 77
4.2.2.4 Calculating and checking the
consistency ratio 77 – 80
4.2.3
4.2.3.1
Estimated maximum loss of load
(MW), C2 vs Alternative
Develop a pairwise comparison matrix
for each criterion (C2)
80 – 81
4.2.3.2 Normalizing the resulting matrix 81 – 82
4.2.3.3 Averaging the values in each row to
get the corresponding rating 82 – 83
4.2.3.4 Calculating and checking the
consistency ratio 83 – 86
4.2.4
4.2.4.1
Estimated energy no supplied
(MW_min), C3 vs Alternative
Develop a pairwise comparison matrix
for each criterion (C3)
86 – 87
4.2.4.2 Normalizing the resulting matrix 87 – 88
4.2.4.3 Averaging the values in each row to
get the corresponding rating 88 – 89
4.2.4.4 Calculating and checking the
consistency ratio 90 – 93
4.2.5
4.2.5.1
System minute (sys_min), C4 vs
Alternatives
Develop a pairwise comparison matrix
for each criterion (C4)
93 – 94
4.2.5.2 Normalizing the resulting matrix 94
4.2.5.3 Averaging the values in each row to
get the corresponding rating 95 - 96

x
4.2.5.4 Calculating and checking the
consistency ratio 96 – 99
4.2.6 AHP Result 99 – 103
4.3 Risk assessment using Technique for
Order Preference by Similarity to Ideal
Solution Process (TOPSIS)
104
4.3.1 Decision Matrix 104 – 109
4.4 Summary 110
CHAPTER 5 DISCUSSION, CONCLUSION AND
RECOMMENDATION
5.1 Discussion 111 – 115
5.2 Conclusion 116
5.3 Recommendation 117

xi
LIST OF TABLES
2.1 Security related decisions 9
2.2 The fundamental scale of absolute number 47
3.1 Random index 53
4.1 Summary of Appendix C 66
4.2 SESB data used in AHP for risk assessment 67
4.3 The pairwise comparison table of criteria for risk
assessment in transmission power system by
using AHP
69
4.4 The criteria averaged value for each row (C) 71
4.5 The duration time (min), C1 averaged value for
each row
76
4.6 The estimated maximum loss of load, (MW), C2
averaged value for each row
82
4.7 The estimated energy no supplied (MW_min),
C3 averaged value for each row
88
4.8 The system minute (sys_min), C4 averaged value
for each row
95
4.9 Calculation for the Risk Types with respect to
the Criteria
100
4.10 Priorities for all the risk types 101
5.1 Overall rank for most outages loss of supply in
the grid using AHP and TOPSIS methods 112
xii
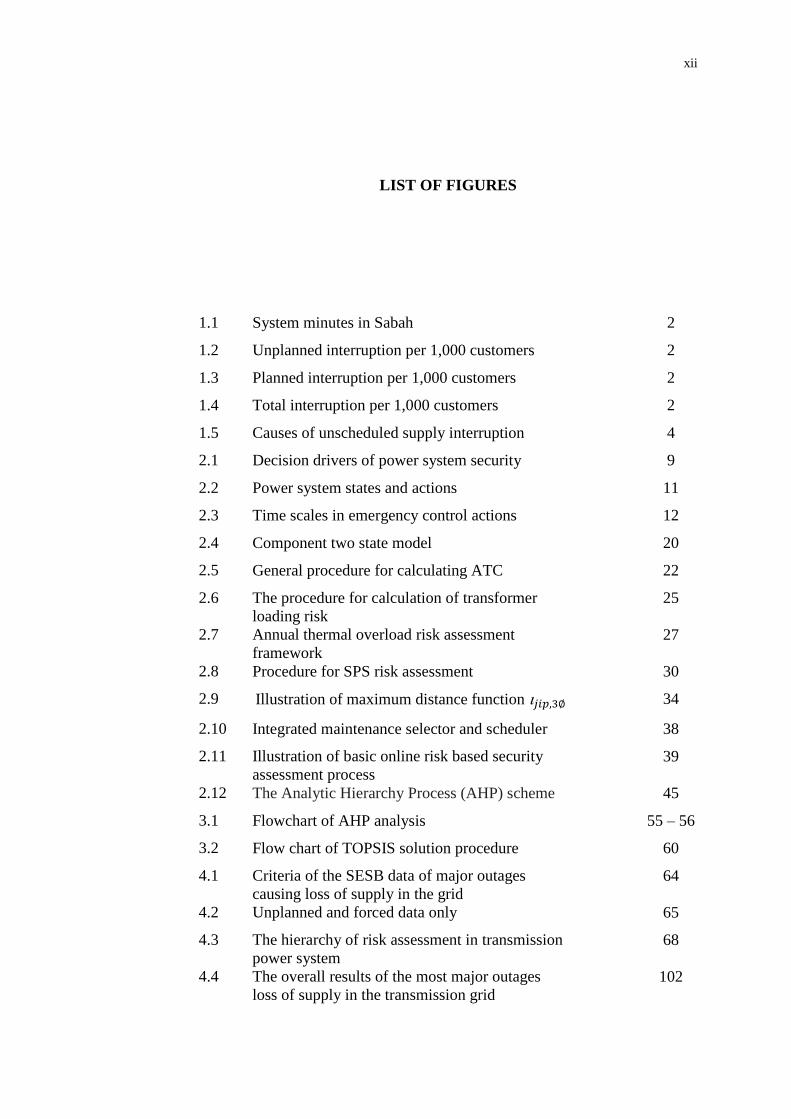
LIST OF FIGURES
1.1 System minutes in Sabah 2
1.2 Unplanned interruption per 1,000 customers 2
1.3 Planned interruption per 1,000 customers 2
1.4 Total interruption per 1,000 customers 2
1.5 Causes of unscheduled supply interruption 4
2.1 Decision drivers of power system security 9
2.2 Power system states and actions 11
2.3 Time scales in emergency control actions 12
2.4 Component two state model 20
2.5 General procedure for calculating ATC 22
2.6 The procedure for calculation of transformer
loading risk
25
2.7 Annual thermal overload risk assessment
framework
27
2.8 Procedure for SPS risk assessment 30
2.9 Illustration of maximum distance function 34
2.10 Integrated maintenance selector and scheduler 38
2.11 Illustration of basic online risk based security
assessment process
39
2.12 The Analytic Hierarchy Process (AHP) scheme 45
3.1 Flowchart of AHP analysis 55 – 56
3.2 Flow chart of TOPSIS solution procedure 60
4.1 Criteria of the SESB data of major outages
causing loss of supply in the grid
64
4.2 Unplanned and forced data only 65
4.3 The hierarchy of risk assessment in transmission
power system
68
4.4 The overall results of the most major outages
loss of supply in the transmission grid
102

xiii
4.5 The sequence of the most major outages loss of
supply in the grid using AHP method
103
4.6 The sequence of the most major outages loss of
supply in the grid using TOPSIS method
109
5.1 The most outages loss of supply in the grid using
AHP method in histogram
113
5.2 The most outages loss of supply in the grid using
TOPSIS method in histogram
114
5.3 Comparison between AHP and TOPSIS on the
most outages loss of supply in the grid
115

xiv
LIST OF SYMBOLS AND ABBREVIATIONS
UTHM - Universiti Tun Hussein Onn Malaysia
Cn - criteria
An - alternative
rij - normalized decision matrix
xij - rating Ai with respect to criterion Cj
vij - weight normalized decision matrix
wij - criteria weight
Si - ideal solution
Sni - negative ideal solution
RC - relative closeness
Wc - criteria weight
CR - consistency ratio
max - criteria in risk assessment
CI - consistency index

xv
LIST OF APPENDICES
APPENDIX TITLE PAGE
A List of risk register transmission unit in
SESB
125 - 132
B Unplanned and Forced SESB 2011 data 133 - 144
C The unplanned and forced data from
Appendix B are arrange into months in four
main groups
145 - 146

CHAPTER 1
INTRODUCTION
1.1 Project background
Power system is a complex and large-scale nonlinear dynamic system. With the
improvement of the functions of modern power system, the structure of the system is
increasingly moving towards high degree of automation and involves with high-
voltage, long distance and large-capacity power. However, random failure sometimes
appear in the system components, causes the system to function with some or all
loss. Therefore, the risk prevention of power system operation has become an
important and complex task
The application of power system risk assessment has drawn ever-increasing
interest in the electric utility industry, particularly since massive power outage events
have occurred across the world in the past years. According to an EPRI (Electric
Power Research Institute) report based on the national survey in all business sectors,
the U.S. economy alone is losing between $104 and $164 billion a year due to power
system outages. Severe power outage events have happened frequently in recent
years. For instance, a major system disturbance separated the Western Electricity
Coordinating Council (WECC) system in the west of north America into four islands
on August 10,1996, interrupting electricity service to 7.5 million customers for
period of up to nine hours. The 1998 blackout at the Auckland central business

2
district in New Zealand impacted 30 square blocks of the downtown area for about
two months, resulting in lawsuits totalling $600 million against the utility. On
August 14, 2003, the massive blackout in the east of North America covered eight
states in the United States and two provinces in Canada, bringing about 50 million
people into darkness for periods ranging from one to several days. This is not
exceptional to the Malaysia power system whereby on January 13, 2005 the system
blackout occurred due to cascading overloads (The STAR, 2005). In Sabah, on April
21, 2008, a transmission tower collapse triggered a major power blackout throughout
the state (The STAR, 2008) and recently, a massive power outage caused by
frequency dip occurred in Sarawak on June 27, 2013 (The STAR, 2013).
Due to this, risk assessment has become a challenge and an essential business
in the power utility industry today.
1.2 Problem statement
According to the statistics Figure 1.1 provided by Suruhanjaya Tenaga 2011 report,
system minutes of the grid system in Sabah has been increased significantly from
98.6% to 40.13 minutes and thus affecting the reliability of the whole supply system.
Figure 1.1 : System minutes in Sabah
Figure 1.2, Figure 1.3 and Figure 1.4 shows that the number of unplanned
interruptions per 1,000 customers has increased by 5.0% to 50.4% in Sabah for year
18.99 11.89
31.58 20.21
40.13
0
154.38
0 0 0 0
20
40
60
80
100
120
140
160
180
2007 2008 2009 2010 2011
Min
ute
Year
System Minute
Massive Incident Not Included Massive Incident Included

3
2011. The unplanned interruptions scored the highest percentage of 92% from the
total interruption in year 2011.
Figure 1.2 : Unplanned interruption per 1,000 customers
Figure 1.3 : Planned interruption per 1,000 customers
Figure 1.4 : Total interruption per 1,000 customers
There are various causes of the electricity supply interruptions such as natural
disasters, equipment failures, overload, damaged by third parties, process and quality
of work, trees, unknown causes, and others. If the most common cause of the
electricity supply interruption can be identified, SESB could take preventive action
to reduce the interruptions, as consumers demand to have an uninterruptable power
supply.
0
20
40
60
2007 2008 2009 2010 2011
52.1 48.5 43.4 48 50.4
1,0
00
nu
mb
er
of
use
rs
Year
SESB Unsheduled Interruption
0
2
4
6
8
10
2007 2008 2009 2010 2011
9.3
6.3
8.4 6.8
4.2
1,0
00
nu
mb
er
of
use
rs
Year
SESB Sheduled Interruption
45
50
55
60
65
2007 2008 2009 2010 2011
61.5
54.8 51.8
54.9 54.6
1,0
00
nu
mb
er
of
use
rs
Year
SESB Total Interruption

4
Figure 1.5 : Causes of Unscheduled Supply Interruption
This thesis will identify the most common cause of power outages and
identify the most suitable method of risk assessment in the transmission power
system.
1.3 Project objectives
There are two objectives for this project:
(i) To determine the most common cause of power outages in the grid
(ii) To implement multi criteria decision-making methods such as AHP and
TOPSIS
1.4 Project scopes
The purpose of this thesis is to determine the most common cause of power
system outages in the grid using multi criteria decision making. This thesis will only
focus on the risks in transmission line of the power system. The data analyzed is
obtained from SESB. Consequently, it will develop a systematic approach to identify
the priority based on the risk impact of the power system.
Other/No Data/ Plant Shutdown,
10.91%
Installation Failures, 35.74%
Falling Trees,
13.82%
Damages by Third Parties,
12.86%
Overload, 7.85%
Natural Disaster, 9.01%
Transient, 0.96%
Unknown, 8.86% Other/No Data/ Plant
Shutdown
Installation Failures
Falling Trees
Damages by Third Parties
Overload
Natural Disaster

5
1.5 Contribution and claims of originality
The research has identify the most common cause of power system outages in the
grid, thus SESB should take preventive action to reduce the interruptions as
maximum as possible.
1.6 Thesis outline
The subsequent chapters of the thesis are organized as follow :
Chapter 1 highlights the occurrence of power-outages events in several
countries around the world, statistics of an unplanned electricity interruption in
Sabah, and the various causes of the electricity interruption in year 2011. The
objectives of this thesis are stated in this chapter.
Chapter 2 is the literature review of this project. This review begins with the
fundamental concepts of power system security and progresses through security
assessments of different time frames. The deterministic and probabilistic approaches
to security assessment are addressed and the limitations of each of these approaches
are highlighted. The literature on the risk-based security assessments is also
reviewed.
Chapter 3 discusses about the project procedure and also approach used to
implement the project.
Chapter 4 shows the results and data analyses. The risk assessment
monitoring in electrical power system by using the Analytic Hierarchy Process
(AHP) and TOPSIS is discussed in this chapter.
Chapter 5 presents the project discussions, conclusions and
recommendations. This chapter will discuss about the conclusions of the project and
also some future recommendations.

6
1.7 Summary
This chapter of this thesis discusses about the introduction for the whole project.
Firstly, the power-outages events are introduced in the first part. Next, the problem
statement is discussed. Then, the next part is about the objectives and scopes of the
project. Lastly, the thesis outline is discussed which will give an overview for the
reader about the thesis.

CHAPTER 2
LITERATURE REVIEW
2.1 Introduction
The fundamental objective of an electric power system is to supply its customers
with electrical energy as economically as possible and with a reasonable assurance
of continuity and quality. To maintain such security standards the power systems are
required to be reliable.
Power system reliability reflects the adequacy and security in a power system
(Billinton & Li, 1994), (Billinton, Firuzabad & Aboreshaid, 1997). Adequacy with
regard to composite generation and transmission relates to the existence of both
sufficient generation capacity to supply the energy demand and of the associated
transmission facilities required to transport the energy to the major system load
points. Security relates to the ability of the system to withstand unexpected failures
and continue operating without interruption of supply to the consumers (Kirschen,
2002), (Knight, 2000). Security assessment is a major concern in planning and
operation of electric power systems.
The following sections of this chapter, review the literature relevant to this
exploration of security issues. In particular, it covers the fundamental concepts of
power system security, the deterministic and probabilistic approaches to security,
and the techniques used in adequacy and security assessments. It focuses mainly on

8
the probabilistic framework for system security, in the context of power system
operation.
2.2 Power System Security
Power system security is usually assessed on the basis of security standards, i.e., the
relationship between outages of generation and transmission plant and the level of
any acceptable loss of demand. An 'N-1' security standard requires the system to
work satisfactorily following loss of any one of its N elements (Strbac, 2001).
Loading on transmission system under normal operating conditions must be
limited to levels that permit any "credible contingency" to occur without exceeding
acceptable power quality, component or system limits (Strbac, 2001).
Contingencies may be external or internal events (for instance, faults
subsequent to lightning versus operator-initiated switching sequences) and may
consist of small/slow or large/fast disturbances (for example, random behaviour of
the demand pattern versus generator or line tripping) (Wehenkel, 1997).
Usually, numerical simulation of the contingency scenario is used to assess
the effect of a contingency on a power system in a given state. However, the non-
linear nature of the physical phenomena and the growing complexity of real-life
power systems make security assessment difficult. For example, monitoring a power
system every day calls for fast sensitivity analysis to identify the salient parameters
driving the phenomena, and suggestions on how to act on the system so as to
increase its level of security (Wehenkel, 1997).
On the other hand, increasing economic and environmental pressures make
the conflicting aspects of security and economy even more challenging as instead of
building of new transmission lines and generation facilities, operators tend to
operate power systems more closer to the critical limits (Wehenkel, 1997).
Every small change in load is a disturbance that causes a change in system
conditions. However, system security is assessed for larger changes that cause major
changes in system conditions. These changes are mainly caused by contingencies.
Most commonly contingencies result in relay operations that are designed to protect

9
the system from faults or abnormal conditions. Typical relay operations result in the
loss of a line, transformer, generator, or major load (McCalley, 2000).
Various components in a power system respond to changes that occur and
may reach an equilibrium condition that is acceptable according to some criteria.
Mathematical analysis of these responses and the new equilibrium condition is
called security analysis (McCalley, 2000).
The decision drivers of security can be classified as shown in Figure 2.1 and
the corresponding time frames for making security related decision are given in
Table 2.1.
Figure 2.1 : Decision drivers of power system security
Table 2.1 : Security related decisions
Time-frame Decision-
maker
Decision Basis for decision
On-line assessment
(Minutes to hours)
Operator How to constrain the
economic operation to
maintain the normal state?
Operating rules, online
assessment, and cost
Operational planning
(Hours to months)
Analyst What should be the operating
rules?
Minimum operating
criteria, reliability, and
cost
Planning (Months to
years)
Analyst How to reinforce/maintain
the transmission system?
Reliability criteria for
system design and cost

10
If the analysis evaluates only the expected post disturbance equilibrium
condition (steady-state operating point), then it is called Static Security Assessment
(SSA). Static or steady state security is the ability of the system to supply load
without violating operating conditions and load curtailment (Kirshen, 2001), (Kim &
Singh, 2002).
If the analysis evaluates the transient performance of the system as it
progresses after the disturbance, then it is called Dynamic Security Assessment
(DSA) (Grigsby, 2001), (Silva et al., 1999), (Ejebe et al., 1998). Further, the DSA
has been formally defined by the IEEE, Power Engineering Society (PES) working
group on DSA as an evaluation of the ability of a certain power system to withstand
a defined set of contingencies and to survive the transition to an acceptable steady
state condition. Dynamic security considers the ability of the system to supply the
load against system dynamic problems of early swing, transient instability and
oscillatory instability (Kirshen, 2001), (McCalley, Vittal & Abi-Samra, 1999).
Voltage security is the ability of a system, not only to operate in a stable
manner, but also to remain stable (maintenance of system voltage) following any
reasonable credible contingency or adverse system change (Kirshen, 2001),
(Knight,2000). Voltage security analysis is performed to investigate whether any
contingency triggers a voltage collapse (Kirshen, 2001).
SSA can be used quickly to determine if a system is insecure by simply
looking at the static outcome of each contingency. However, to know whether the
system is fully secured, DSA must be performed. It determines if the associated
dynamics of each contingency are acceptable.
A power system always resides in one of four states called normal, alert,
emergency, and restorative. The emergency state can be extreme, temporary, or
controlled (Fink & Carlsen, 1978). The importance of the four security states is that
they provide a conceptual basis for making security-related decisions. This basis
rests on the assumption that any normal state is acceptable and any other state is
unacceptable. Figure 2.2 shows the power system states and the corresponding
actions.

11
Figure 2.2 : Power system states and actions
The system planner and operator always have to consider security. Planning
standards are more rigorous than operational standards. For example, the
uncertainty in demand is not considered in operational standards.
Traditionally, security-related decisions in both operations and planning
have been made with the criterion being that the power system should remain in the
normal state at all times (McCalley, Vittal & Abi-Samra, 1999). The fundamental
drawback of this approach is that it does not reflect the quantitative difference that
can exist between two states that are considered secure.
While security assessment explores the three main areas shown in Figure
2.1, these assessments must be performed in a critical time frame. Figure 2.3 shows
the time frames that are applicable to emergency control actions (Knight, 1983).

12
Figure 2.3 : Time scales in emergency control actions
The introduction of competitive supply and the accompanying opening of the
transmission network have resulted in more highly stressed operating conditions,
more vulnerable networks, and an increased need to identify the operational security
level of the transmission system.
The determination of the security level, for given operating conditions, has
been done traditionally using deterministic method where an operating condition is
identified as secure or insecure according to whether each and every contingency in
a pre-defined set (the contingency set) satisfies specified network performance
criteria. If one or more contingencies cause violations of these operating conditions,
then action is taken to move the security level into the secure region. If no
contingencies cause violations, then no action need to be taken, or actions can be
taken to enhance the economic efficiency of the delivery of energy to end users
(McCalley et al., 2001).
Security assessment approaches can be mainly classified either as
deterministic or probabilistic. Deterministic methods provide very simple rule for
use in making decisions. However, with the industry's emphasis on economic
competition, and with the associated increased network vulnerability, researchers
have looked for other techniques that can indicate whether the system is sufficiently
secure while operating as economically as possible (Fink, 1988).
Action to contain ------- Action to prevent
Action to prevent ------ severe generation dynamic instability
1-----------------secs-----------60
1 ----------- mins --------10

13
2.3 Steady State Security Assessments
2.3.1 Deterministic Approach
The current and traditional practice uses deterministic methods with safety margins
to cover all the possible unknown uncertainties (McCalley, Vittal & Abi-Samra,
1999). In the deterministic security assessment there are six basic steps in
constructing a deterministic security boundary. They are (McCalley et al., 2001),
(Chen & McCalley, 2000) :
I. Develop a power flow base case corresponding to the time-period (year,
season) and loading conditions (peak, partial peak, off peak). Unit
commitment is selected based on typical unit availability for the chosen
time-period. The topologies selected are normally all circuits in service.
Sometimes sensitivity studies are also performed for a few weakened
topologies. In addition, short- term operational studies are often performed
with the explicit purpose of identifying limits for topologies expected in the
near future.
II. Select the contingency set. Normally this set consists of all 'N-1' events,
although some particularly credible 'N-2' events may be included (e.g. two
circuits on the same towers). This may be shortened to only include events
resulting in performance that is affected by operating conditions or facilities
pertinent to the goals of the study. Traditionally, this has been done based on
experience and knowledge of the system.
III. Identify the study parameters, which are to be maximised and the study range
of operating conditions. These study parameters are typically generation
levels for specific generators and power transfers over specific transmission
paths.
IV. Identify the event or events that "first" violate the performance evaluation
criteria as operational stress is increased within the study range. These events
are referred to as the limiting contingencies. If there are no such violations
within the study range, the region is not security constrained, and the study is
complete.

14
V. Identify the set of operating conditions within the study range where a
limiting contingency "first" violates the performance evaluation criteria. This
set of operating conditions constitutes a line that partitions the study range
when we consider two study parameters, a surface when there are three study
parameters or a hyper surface for more than three study parameters. This
line, surface, or hyper-surface is the security boundary.
VI Condense the security boundary into a set of plots or tables that are easily
understood and used by the operator. Nomo grams are one of the common
ways of expressing the security boundaries.
2.3.2 Probabilistic Approach
The power systems have shifted from a regulated system to a competitive uncertain
market environment. This has led operators to face more pressure, from economic
imperatives in the market place, to operate the power systems with lower security
margins. To operate the system closer to the traditional deterministic limits, or even
beyond them, more refined methods for power system security assessment are
needed that account for the probabilistic nature of uncertain variables in the
decision-making environment (McCalley, Vittal & Abi-Samra, 1999).
Some researches use analytical approaches (sometimes called contingency
enumeration) to solve probabilistic problems, while others use Monte Carlo
simulation for the same purpose. Analytical methods based on conditional
probability, however, are computationally intensive when applied to a system with
many components (Kim & Singh, 2002). Monte Carlo simulation however is
suitable for analysis of complicated systems.
In a probabilistic security assessment, steps of I to III and VI remain as in
section 2.3.1. However, steps IV and V have to be modified as follows (McCalley et
al., 2001), (Chen & McCalley, 2000) :
IV Evaluate the probabilistic index throughout the study range. Decide on a
particular threshold level beyond which operation is deemed unacceptable.
VI. Identify the set of operating conditions within the study range that have an
index evaluation equal to the threshold level. This set of operating conditions

15
constitutes the line (for two study parameters), a surface (for three) or a
hyper surface (for more than three) that partitions the study range. This line
surface, or hyper surface represents the security boundary; it delineates
between acceptable regions of operation.
2.3.3 Comparison of the Probabilistic and Deterministic Approaches
It is known that probabilistic methods constitute powerful tools for use in many
kinds of decision-making problems. Probabilistic assessments play an important part
when an outcome is associated with uncertainties (Sobajic, 2001).
The acceptance of probabilistic approaches is slow, mainly because they have
not acquired the level of credibility, which is accorded to the much simpler and more
transparent deterministic methods (Endrenyi, 2000).
There are also several drawbacks with the deterministic approach (Endrenyi,
2000), (McCalley et al., 2001) :
• It ignores the variability in input data.
• The selection of credible contingencies does not include events like cascading
tripping of lines or sympathetic tripping. Apparently unlikely conditions may be
under estimated.
• The assumption of no failure risk in plans satisfying traditional criteria is
misleading; in fact, the approach provides no idea on how safe the operating plan
actually is.
• It does not signal on severity of risk beyond the deterministic security boundary.
• It ignores the effects of uncertainty in operating conditions.
These drawbacks can be alleviated with the probabilistic approach because
(McCalley et al., 2001) :
• It considers the probability of the possible outages.
• It captures the increased risk caused by multiple constraints as it sums risk
associated with all contingencies and problems.
• It can reflect the risk associated with the insecure region.
• It does consider the uncertainty in near future operating conditions.

16
Therefore, it is also vital to investigate alternative security assessment tools
that combine the positive properties of deterministic and probabilistic security
indications.
2.4 Dynamic Security Assessment
Dynamic security assessment is the primary concern in systems that are constrained
by stability limits. Such assessments are performed at three stages: on-line,
operation planning and expansion planning (Silva et al., 1999).
A real time (on-line) dynamic security assessment (Ejebe et al., 1998) :
• Provides the system operator the information on the security status of the system.
• Determines the relevant operating limits (interface flow limits, generation limits)
to ensure the dynamic security of the system in the event of occurrence of any
critical contingencies.
• Identifies the limiting contingencies and computes indices quantifying the degree
of stability or instability for each case.
There are sets of criteria that are to be satisfied with the dynamic security
assessment. They are (Ejebe et al., 1998) :
• Initial transient stability (plant mode and area mode; single and multi swing).
• Voltage excursions (dip or rise) beyond specified threshold level and duration.
• Relay margin criteria.
• Minimum damping criteria for a designated short list of contingencies.
The security function in a dynamic security assessment computes the
interface flow limits that ensure dynamic security of the system for severe
contingencies. The interface flows are calculated by performing a series of power
flow and time domain simulations.

17
The basic steps to calculate the interface flow are (Ejebe et al., 1998) :
I. Select a desired interface flow
II. Change the generation and load in the appropriate control areas to obtain the
desired interface flow. Solve the power flow. Selection of the generators to
change depends on the practices of the utility. Generators are typically
dispatched economically.
III. Using time domain analysis (numerical methods such as the implicit
trapezoidal method to discretize the differential equations at each time step
and iteratively solve the machine equations and the network equations) with
early termination, simulate the contingency and compute the transient stability
index (TSI). If TSI is within the prescribed (marginally stable) threshold, then
the limiting interface flow has been found. Otherwise go to IV step.
IV. Reduce interface flow if unstable (TSI is negative), or increase it if stable (if
TSI is positive). Repeat the II and III steps.
The security function captures the interface flow for which TSI is very small
and within specified tolerance. The operating guidelines are established based on the
most limiting interface flow (Ejebe et al., 1998). If any of the contingencies results
in instability, then the operator is notified immediately to take corrective actions.
2.5 Risk Based Probabilistic Approaches in Power System Security
Today, transmission and generation owners are keen to fully utilize their facilities to
maximize the return on their investment. Deterministic assessment does not provide
sufficient information on insecurity beyond the deterministic boundary. To alleviate
such limitations reference (McCalley, Vittal & Abi-Samra, 1999), proposes a risk
based security index that can captures the security level and recognises the likelihood
and monetary impacts of unlikely events. The index proposed in (McCalley, Vittal &
Abi-Samra, 1999), measures the system's exposure to failure considering load
interruption, equipment damage, and opportunity costs due to equipment outages.

18
The basic mathematical formulation for calculating the risk is given by
Equation (2.1).
Risk (Im|Xt) = E( Im (Xi+1|Xt)
) x Risk (Im| (2.1)
Where Im denotes the impact or cost-consequences associated with load
interruption, equipment damage, or opportunity cost due to equipment
unavailability. The risk associated with the pre-contingency operating condition Xt
(e.g. loading, dispatch, voltage profile) is given by the expected values of the
monetary impact of the operating condition in the next time period Xt+1 (the next
hour) given the current operating condition, i.e., E(Im(Xt+1) | Xt). This expectation is
the integral of the product of probability of the uncertain event, defined by Ei (the
contingency state) and Xt+1 (operating condition in the next time step) times its
corresponding impact over the set of all possible events.
The risk based security assessment proposed in (McCalley, Vittal & Abi-
Samra, 1999), considers the impact of a specified contingency state Ei for a specified
operating condition Xt+1 . Its result is denoted by Risk (Im | Ei, Xt+1) . The set of
contingency states {Ei, i = 0, N} includes the possibility that the current state
remains the same, i.e., an outage does not occur.
The uncertainty associated with the impact depends on the nature of the
impact. For line overload, the uncertainty is with the ambient temperature, wind
speed and direction, and solar flux (Wan, Mccalley & Vittal, 1999). For transformer
overload, it is the ambient temperature and transformer's loading cycle (Fu,
McCalley & Vittal, 2001). For voltage security it is the interruption voltage level of
the loads at each bus (Wan, McCalley & Vittal, 2000). For dynamic (angle) security,
it is in the fault type and fault location of the outaged circuit corresponding to
contingency state Ei (McCalley et al., 1997), (Vittal, et al., 1999).
Reference (McCalley, Vittal & Abi-Samra, 1999), claims that the following
benefits can be achieved using the risk based security assessment when applied to
security problems in a power system :
• Since the risk based security assessment is performed through the expected cost

19
due to possible insecurity problems, it can signal the security and economy
against a particular operating condition. Such information is vital in
security/economy decision-making as the operator has the option to trade off
security with economy.
• Since the risk index may carry the information that may be related to the next
minutes, hours, weeks, or years, such information can be used for preventive
decisions against future operating conditions.
• Since the risk is assigned considering the problems due to each contingency and
each component, it provides vital information to identify particularly risky
components or operating conditions.
• Since the proposed risk-based security assessment can be used to calculate a risk
index for over load, voltage and dynamic (angle) security problems, it can reflect
the composite security level in the region.
• Risk can also be calculated for a time-period by summing over all the time
instances for each operating condition. Such information on cumulative risk may
be useful in assessing the influence on the security level of a particular facility
plan.
2.6 Risk Assessment Techniques in Power System Adequacy
2.6.1 Operating Reserve Risk Assessment
The two broad categories of reserve assessment in composite power systems are the
deterministic and probabilistic approaches. Deterministic criteria include
considerations such as percentage of system load or operating capacity, fixed
capacity margins, and the largest unit loading. Such an approach does not
specifically recognize the probability of component failures.
A probabilistic approach can be used to recognize the stochastic nature of
system components and incorporate these phenomena in a consistent evaluation of
the required operating reserve. The magnitude of the operating reserve and the
actual spinning requirement can be determined on the basis of system risk.

20
This risk has been defined in (Billinton & Allan, 1984), (Lian & Billinton,
1994) as the probability that the system will fail to meet the load or be able to just
meet the load during a specified time in the future. This duration is known as the
lead time and failed generating units are normally not replaced or restored to service
during this time period. In addition, the availabilities and unavailabilities of major
system elements are all functions of the studied time period, i.e., the lead-time. The
calculated system operating risk is, therefore, a function of the lead- time.
In the basic approach to operating capacity reserve assessment, each
generating unit is represented by a two state model as shown in Figure 2.4, which
includes an operating state and a failed state. In this model and are the unit
failure and repair states.
Figure 2.4 : Component two state model
The time dependent availabilities and un-availabilities of the generating units
are used to create the capacity outage probability table. The availability and
unavailability of a generating unit at lead-time T are given by Equations (2.2) and
(2.3) respectively.
(2.2)
(2.3)
In addition, the transmission facilities can also be represented by the two-
state model that is same as shown in Figure 2.4. The time-dependent state
probabilities of these components can therefore be calculated using Equations (2.2)
and (2.3). The combined outages of both generation and transmission facilities can
then be obtained assuming that these outages are independent.
Risk assessment of composite systems can consider a number of additional
constraints such as acceptable voltages at load busses, transmission line load
carrying capacities and real and reactive power considerations. In order to calculate
the operating capacity risk, the composite power system can be categorised using a
Down state
2
Up state
1

21
group of mutually exclusive operating states designated in terms of the degree to
which the security constraints are satisfied. These operating states include normal,
alert, emergency, extreme emergency and restorative.
The composite system risk assessment procedure involves two basic steps :
identifying events that lead to each of the operating states and calculating the
probabilities of each states resulting from the identified events. According to the
definitions of composite system operating states no constraints are violated or load
curtailed in either the normal or alert state and therefore the system is not at risk in
either of these two states.
A Composite System Operating State Risk (CSOSR) can therefore be
calculated by Equation (2.4) :
CSOSR = 1.0 - Pn - Pa (2.4)
Where, Pn and Pa are the probabilities of normal and alert states respectively.
The summation of the two probabilities of the normal and alert states
provides an assessment of the favourable conditions associated with the system. The
complement of the sum of these two probabilities represents the unfavourable
conditions and hence constitutes the system risk level. In this approach the
continuous Markov model (Billinton & Allan, 1983), which can be represented as a
discrete process moving in small steps, is used to calculate the required time
dependent state probabilities.
2.6.2 Risk Based Assessments of Available Transfer Capability
The knowledge of available transfer capability (ATC) is vital in order to
guide the implementation and to make competition effective and reasonable (Ou &
Singh, 2003).
Mathematically ATC can be represented as in Equation (2.5) :
ATC = TTC - Base_Case_Flow - TRM – CBM (2.5)

22
Where, TTC is the total transfer capability, TRM is the transmission reliability
margin, and CBM is the capacity benefit margin.
TTC is the largest value of power transfer that causes no violations, with or
without contingency. TRM accounts for the inherent uncertainty in system conditions
and the need for operating flexibility to ensure reliable system operation as system
conditions change.
Among the various probabilistic approaches the Monte Carlo simulation has
been proposed in (Ou & Singh, 2003). CBM is the transfer capability reserved by
load serving entities to ensure access to generation from interconnected systems to
meet generation reliability requirements.
The general procedure using a combination of Monte Carlo simulation and
Repeated Power Flow (RPF), (Ou & Singh, 2001), (Ou & Singh, 2002) to determine
TTC/ TRM is shown in Figure 2.5.
Figure 2.5 : General procedure for calculating ATC

23
In this assessment the risk is defined as (Ou & Singh, 2003) :
(2.6)
Where T represents the level of transfer and N represents the number of sampled
states and ATC(i) represents ATC level for system state i.
The percentile of a probabilistic variable can be defined as :
probability(ATC(i) ≤ value) = percentile (2.7)
Therefore, reference (Ou & Singh, 2003) suggests to use percentile to judge risk.
2.7 Risk Assessment Techniques in Power System Security
2.7.1 Risk of Transmission Line Overload
Power transfer in a transmission conductor is limited by the conductor's maximum
design temperature, which determines the maximum sag of the conductor, and the
rate of annealing. Annealing is the re-crystallisation of metal. The impacts of
thermal overload is calculated considering sag and loss of strength of the conductor
and the impacts of sag and loss of strength are given by Equation (2.8) and (2.9)
respectively (Wan, McCalley & Vittal, 1999).
(2.8)
(2.9)

24
Where,
=
= (or financial cost) corresponding to an outage of the
overload circuit
=
=
=
=
=
=
=
I[Fault ] is dependent on operating conditions, and its quantification requires
analysis with power flow and stability simulation.
For a given current I, the thermal overload risk can be expressed as the
probability of the conductor temperature being greater than times its related
impact. It is given by Equation (2.10) :
(2.10)
The conductor temperature is influenced by the conductor current I and the
ambient conditions. is the probability density function of for given I,
is the impact of sag of for given I, and R(I) is the risk of line
overloading.
2.7.2 Risk of Transformer Loading
Reference (Fu, McCalley & Vittal, 2001), proposes a risk assessment technique for
transformer loading capability, taking into account the probabilistic nature of time-
varying loads and ambient temperature. In a transformer the loading capability is

119
REFERENCES
1. “KL, Selangor, Putrajaya, Johor Hit by Major Blackout,” the Star,
January 13, 2005
2. “Vandals blamed for Sabah blackout”, April 22, 2008
3. “Cause of June 27 Sarawak blackout still a mystery”, the Star, July 02,
2013
4. Suruhanjaya Tenaga (2011). Interim Report on the Performance of the
Electricity Supply in Malaysia for the First Half Year of 2011. Retrieved
on March 30, 2012, from
http://www.st.gov.my/phocadownload/statistics_of_interim_on_the_
performance_of_the_electricity_supply_in_malaysia_2011.pdf
5. Billinton, R. and Li, W. Reliability Assessment of Electrical Power
Systems Using Monte Carlo methods, New York; London: Plenum Press,
1994.
6. Billinton, R., Firuzabad, M. F. and Aboreshaid, S. "Power System Health
Analysis," Electric Power Systems Research, vol. 55, pp. 1-8, 1997.
7. Kirschen, D. S. "Power System Security," Power Engineer, vol. 16, pp.
241-248, 2002.
8. Knight, U. G. Power Systems in Emergencies: From Contingency
Planning to Crisis Management, England: John Wiley & Sons Ltd, 2000.
9. Strbac, G. "MSc Course Materials on Power System Security,"
University of Manchester Institute of Science and Technology,
Manchester, UK, March 2001.
10. Wehenkel, L. "Machine Learning Approaches to Power System Security
Assessment," in IEEE Intelligent Systems Magazine, vol. 12, 1997, pp.
60-72.

120
11. McCalley,J. D. "Security Assessment: Decision Support Tools for Power
System Operators," Iowa State University, Ames, Iowa, 5th September
2000.
12. Kirschen D., "MSc Course Materials on Power System Operation -
Introduction and Overview," University of Manchester Institute of
Science and Technology, Manchester, UK, March 2001.
13. Kim, Y. H. and Singh, C. "Probabilistic Security Analysis Using SOM
Monte Carlo Simulation," IEEE Transactions on Power Systems, vol. 2,
2002.
14. Grigsby, L. L. The Electric Power Engineering Handbook. USA: A CRC
Handbook Published in Cooperation with IEEE Press, 2001.
15. Silva, A. M. L. D., Jardim, J. L., Rei, A. M. and Mello, J. C. O.
"Dynamic Security Risk Assessment," IEEE Transactions on Power
Systems, pp. 198-205, 1999.
16. Ejebe, G. C., Jing, C., Waight, G., Vittal, V., Pierper, G., Jamshidian, F.,
Hirsch, P. and Sobajic, D. J. "Online Dynamic Security Assessment in an
EMS," IEEE Computer Applications in Power, vol. 11, pp. 43-47, 1998.
17. McCalley, J. D., Vittal, V. and Abi-Samra, N. "An Overview of Risk
Based Security Assessment," Proceedings of the IEEE Power
Engineering Society Summer Power Meeting, pp. 173-178, 1999.
18. Fink, L. and Carlsen, K. "Operating Under Stress and Strain," IEEE
Spectrum, vol. 15, pp. 48-53, 1978.
19. Knight, U. G. "The Implementation of Emergency Control," CIGRE
IFAC Symposium on Control Applications, Paper 207-05, 1983.
20. McCalley, J., Bhavaraju, M., Billinton, R. Breipohl, A., Chao, H., Chen,
J., Endrenyi, J., Fletcher, R., Grigg, C., Hamoud, G., Logan, R.,
Meliopoulos, A. P., Rau, N., Schilling, M., Ychlumberger, Y., Schneider,
A. and Singh, C. "Comparison Between Deterministic and Probabilistic
Study Methods in Security Assessment for Operations," A task force
organized by the IEEE PES Reliability, Risk, and Probability
Applications Subcommittee, 2001.
21. Fink, L. "Security: Its Meaning and Objectives," Proceedings of the
Workshop on Power System Security Assesment, pp. 35-41, 1988.

121
22. Chen J. and McCalley, J. D. "Comparison Between Deterministic and
Probabilistic Study Methods in Security Assessment for Operations," 6th
International Conference on Probabilistic Methods Applied to Power
Systems, 2000.
23. Sobajic, D. J. "Enhancing Reliability of the North American
Transmission Grid," presented at Power Delivery EPRI, 2001.
24. Endrenyi, J. "Power System Reliability Concepts," Ontario Power
Technologies, Toronto 2000.
25. Wan, H., McCalley, J. D. and Vittal, V. "Increasing Thermal Rating by
Risk Analysis," IEEE Transactions on Power Systems, vol. 14, pp. 815-
823, 1999.
26. Fu, W., McCalley, J. D. and Vittal, V. "Risk Assessment for Transformer
Loading," IEEE Transactions on Power Systems, vol. 16, pp. 346-353,
2001.
27. Wan, H., McCalley, J. D. and Vittal, V. "Risk Based Voltage Security
Assessment," IEEE Transactions on Power Systems, vol. 15, pp. 1247-
1254, 2000.
28. McCalley, J. D., Fouad, A. A., Agrawal, B. L. and Farmer, R. G. "A
Risk-Based Security Index for Determining Operating Limits in Stability-
Limited Electric Power Systems," IEEE Transactions on Power Systems,
vol. 12, pp. 1210-1217, 1997.
29. Vital, V., McCalley, J. D., Acker, A. V., Fu, W. and Abi-Samra, N.
"Transient Instability Risk Assessment," Proceedings of the IEEE Power
Engineering Society Summer Power Meeting, pp. 206-211, 1999
30. Billinton, R. and Allan R., Reliability Evaluation of Power Systems, New
York: Plenum Press, 1984.
31. Lian, G. and Billinton, R. "Operating Reserve Risk Assessment in
Composite Power Systems," IEEE Transactions on Power Systems, vol.
9, pp. 1270-1276, 1994.
32. Billinton, R. and Allan, R. Reliability Evaluation of Engineering Systems.
New York: Plenum Press, 1983.

122
33. Ou, Y. and Singh, C. "Calculation of Risk and Statistical Indices
Associated with Available Transfer Capability," IEE Proceedings on
Generation Transmission and Distribution, vol. 150, pp. 239-244, 2003.
34. Ou, Y. and Singh, C. "Improvement of Total Transfer Capability Using
TCSC and SVC," presented at Proceedings of IEEE PES Summer
Meeting, Vancouver, Canada, 2001.
35. Ou, Y. and Singh, C. "Assessment of Available Transfer Capability and
Margins," IEEE Transactions on Power Systems, vol. 17, pp. 463-468,
2002.
36. Casella, G. and Berger, R. L. Statistical Inference, Belmont, California:
Duxbury Press, 1990.
37. Dai, Y., McCalley J. D., Abi-Samra, N. and Vittal, V. "Annual Risk
Assessment for Overload Security," IEEE Transactions on Power
Systems, vol. 16, pp. 616623, 2001.
38. Borkowska, B. "Probabilistic Load Flow," IEEE Transactions on Power
Apparatus and Systems, vol. PAS-93, 1974.
39. Klitin, O. A. "Stochastic Load Flows," IEEE Transaction on Power
Apparatus and Systems, vol. PAS-94, 1975.
40. Allan, R. "Probabilistic Load Flow Using Multilinearizations," IEE
Proceedings - C, vol. 130, pp. 165-171, 1983.
41. Sirisena H. R. and Brown, E. P. M. "Representation of Non-Gaussian
Probability Distribution in Stochastic Load Flow Studies by the Method
of Gaussian Sum Approximations," IEE Proceedings - C, vol. 130, pp.
165-171, 1983.
42. Fu, W., Zhao, S., McCalley, J. D., Vittal, V. and Abi-Samra, N. "Risk
Assessment for Special Protection Systems," IEEE Transactions on
Power Apparatus and Systems, vol. 17, pp. 63-72, 2002.
43. Kundur, P. Power System Stability and Control, New York; London:
McGraw- Hill Inc., 1994.
44. McCalley, J. D., Vital, V. A., Acker, V. and Abi-Samra, N. "Risk Based
Transient Stability Assessment," presented at IEEE PES Summer
Meeting, Edmonton, Canada, 1999.

123
45. Jiang, Y., Ni, M., McCalley, J. D. and Voorhis, T. V. "Risk-based
Maintenance Allocation and Scheduling for Bulk Electric Power
Transmission System Equipment," presented at Proceedings of the Fifth
International Conference on Systems Engineering, Las Vegas, 2002.
46. Ni, M., McCalley, J. D., Vittal, V. and Tayyib, T. "Online Risk Based
Security Assessment," IEEE Transactions on Power Systems, vol. 18, pp.
258-265, 2003.
47. Lee, S. T. and Hoffman, S. "Industry-wide Power Delivery Reliability
Initiative Bears Fruit," in IEEE Computer Applications in Power, 2001.
48. Ozdagoglu, A. & Ozdagoglu, G. (2007). Comparison of AHP and Fuzzy
AHP for the Multi-criteria Decision Making Process with Linguistic
Evaluations. Retrieved on March 26, 2010 from
http://www.iticu.edu.tr/Kutuphane/dergi/f11/M00178.pdf
49. Saaty, T. L. & Vargas, L. G.. Decision Making with the Analytic Network
Process. Springer, Pittsburgh. 2006.
50. Lin, Z., Gao, L., Zhang, D., Ren, P. & Li, Y.. Application of Analytical
Hierarchy Process in Power Lines Maintenance. Proceedings of the 6th
World Congress of Intelligent Control and Automation, 2. 2006. pp.
7596 - 7599.
51. Douligeris, D. & Pereira, I. J.. A Telecommunications Quality Study
using the Analytic Hierarchy Process. IEEE Journal of Selected Areas in
Communications, 12. 1994. pp. 241 - 250.
52. Kang, H. G. & Seong, P. H.. A Methodology for Evaluating Alarm
Processing Systems using Informational Entropy-based Measure and the
Analytic Hierarchy Process. IEEE Journal of Nuclear Science, 46. 1999.
pp. 2269 - 2280.
53. Yang, C. L., Chuang, S. P., Huang, R. H. & Tai, C. C.. Location
Selection Based on AHP/ANP Approach. Industrial Eng. & Eng.
Management 2008 IEEM. 2008. pp. 1148 - 1153.
54. Frair, L., Matson, J. O. & Matson, J. E.. An Undergraduate Curriculum
Evaluation with the Analytic Hierarchy Process. 28th
annual Forntiers in
Education Conf. 1998, 3. 1998. pp. 992 - 997.
124
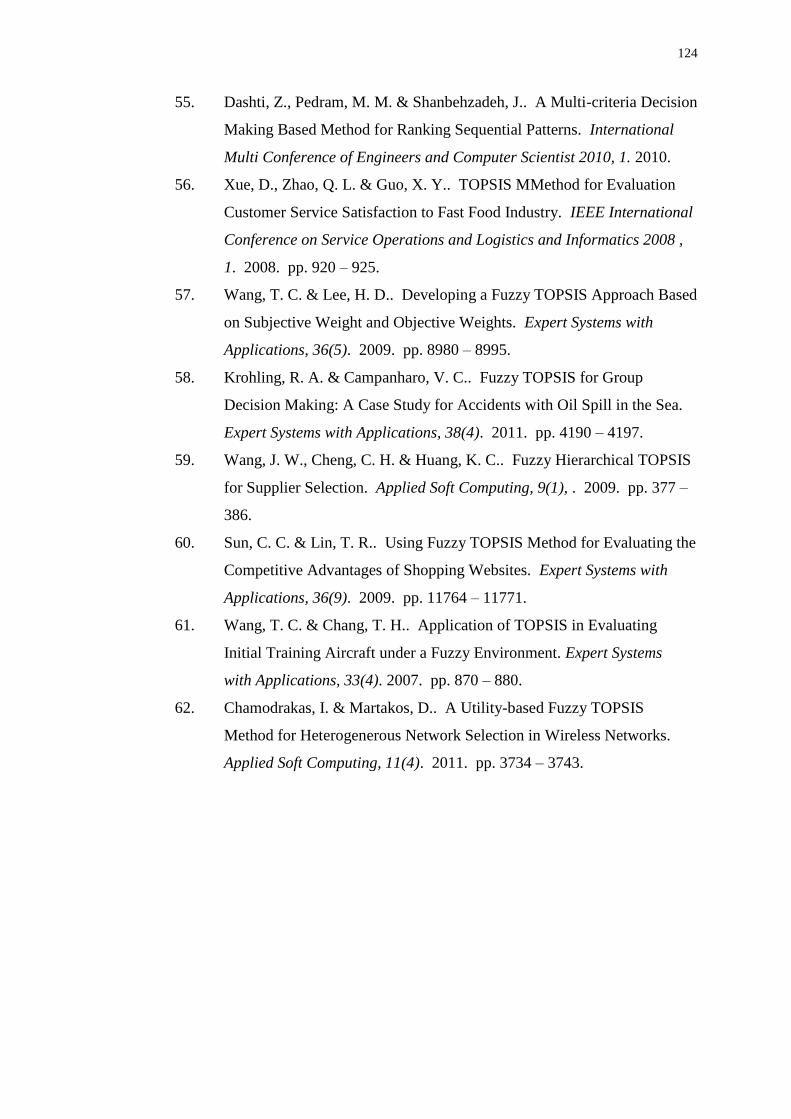
55. Dashti, Z., Pedram, M. M. & Shanbehzadeh, J.. A Multi-criteria Decision
Making Based Method for Ranking Sequential Patterns. International
Multi Conference of Engineers and Computer Scientist 2010, 1. 2010.
56. Xue, D., Zhao, Q. L. & Guo, X. Y.. TOPSIS MMethod for Evaluation
Customer Service Satisfaction to Fast Food Industry. IEEE International
Conference on Service Operations and Logistics and Informatics 2008 ,
1. 2008. pp. 920 – 925.
57. Wang, T. C. & Lee, H. D.. Developing a Fuzzy TOPSIS Approach Based
on Subjective Weight and Objective Weights. Expert Systems with
Applications, 36(5). 2009. pp. 8980 – 8995.
58. Krohling, R. A. & Campanharo, V. C.. Fuzzy TOPSIS for Group
Decision Making: A Case Study for Accidents with Oil Spill in the Sea.
Expert Systems with Applications, 38(4). 2011. pp. 4190 – 4197.
59. Wang, J. W., Cheng, C. H. & Huang, K. C.. Fuzzy Hierarchical TOPSIS
for Supplier Selection. Applied Soft Computing, 9(1), . 2009. pp. 377 –
386.
60. Sun, C. C. & Lin, T. R.. Using Fuzzy TOPSIS Method for Evaluating the
Competitive Advantages of Shopping Websites. Expert Systems with
Applications, 36(9). 2009. pp. 11764 – 11771.
61. Wang, T. C. & Chang, T. H.. Application of TOPSIS in Evaluating
Initial Training Aircraft under a Fuzzy Environment. Expert Systems
with Applications, 33(4). 2007. pp. 870 – 880.
62. Chamodrakas, I. & Martakos, D.. A Utility-based Fuzzy TOPSIS
Method for Heterogenerous Network Selection in Wireless Networks.
Applied Soft Computing, 11(4). 2011. pp. 3734 – 3743.


