
Rights Issue and Capital Enhancement...
33
Rights Issue and Capital Enhancement Proposals 3 November 2009
Transcript of Rights Issue and Capital Enhancement...
Rights Issue and Capital Enhancement Proposals
3 November 2009

2
DISCLAIMER
THIS DOCUMENT IS STRICTLY CONFIDENTIAL AND IS BEING PROVIDED TO YOU SOLELY FOR YOUR INFORMATION AND FOR USE AT A PRESENTATION TO BE HELD IN CONNECTION WITH THE PROPOSED RIGHTS ISSUE AND EXCHANGE OFFER BY THE COMPANY AND MAY NOT BE REPRODUCED IN ANY FORM OR FURTHER DISTRIBUTED TO ANY OTHER PERSON OR PUBLISHED, IN WHOLE OR IN PART, FOR ANY PURPOSE. FAILURE TO COMPLY WITH THIS RESTRICTION MAY CONSTITUTE A VIOLATION OF APPLICABLE SECURITIES LAWS.
This presentation does not constitute an offer to sell, or a solicitation of an offer to subscribe for any security in Lloyds Banking Group (the “Company”) (including the ordinary shares in the Company proposed to be issued under the rights issue or any other securities in the Company proposed to be issued in connection with the exchange offers, the terms of which were announced by the Company on 3 November 2009 (the “Proposals”)) in any jurisdiction in which such offer or solicitation is unlawful. This presentation is not for distribution, directly or indirectly, in or into Australia, South Africa, Canada, the United States or Japan or any other state or jurisdiction in which it would be unlawful to do so. This presentation does not constitute or form a part of any offer or solicitation to purchase or subscribe for securities in the United States.
The securities mentioned herein (the “Securities”) have not been, and will not be, registered under the United States Securities Act of 1933 (the “Securities Act”). The Securities may not be offered or sold in the United States absent registration or an applicable exemption from the registration requirements of the Securities Act. There will be no public offer of the Securities in the United States.
Neither the content of the Company’s website nor any website accessible by hyperlinks on the Company’s website are incorporated in, or form part of, this presentation.
This presentation is an advertisement and not a prospectus and investors should not subscribe for any shares referred to in this presentation except on the basis of information in the prospectus published by the Company. Copies of the prospectus are available from the Company and on the Company’s website at http://lloydsbankinggroup.com. The prospectus includes a description of risk factors in relation to an investment in the Company.
This presentation is being made only to and is directed at (a) persons who have professional experience in matters relating to investments who fall within Article 19(1) of the Financial Services and Markets Act 2000 (Financial Promotion) Order 2005 (the “Order”) or (b) high net worth entities, and other persons to whom it may otherwise lawfully be communicated, falling within article 49(1) of the Order (all such persons together being referred to as “relevant persons”). Any person who is not a relevant person should not act or rely on this presentation or any of its contents.
This presentation and its contents are confidential and should not be distributed, published or reproduced (in whole or in part) or disclosed by recipients to any other person. The distribution of this presentation and/or any other documents related to the Proposals or any other offering of securities or the transfer or offering of securities into jurisdictions other than the United Kingdom (“UK”) may also be restricted by law. Persons into whose possession this presentation comes should inform themselves about and observe any such restrictions. Any failure to comply with these restrictions may constitute a violation of the securities laws of any such jurisdiction.
This presentation contains certain confidential information that has not been publicly disclosed and that may contain material price sensitive information (including inside information). By receipt of this presentation you recognise and accept that some or all of the information in this document may be "inside information“ as defined in section 118C of the Financial Services and Markets Act 2000 (the "FSMA"), the Disclosure and Transparency Rules (the "DTRs") published by the Financial Services Authority ("FSA") and/or section 56 of the Criminal Justice Act 1993 (the "CJA"), that such information is being provided to you by the Company pursuant to DTR 2.5.7G(2)b and that you will not: (i) deal in securities that are price-affected securities (as defined in the CJA) in relation to the inside information, encourage another person to deal in price-affected securities or disclose the information except as permitted by the CJA before the inside information is made public; (i) deal or attempt to deal in a qualifying investment or related investment (as defined in the FSMA) on the basis of the inside information; (iii) disclose the inside information to another person other than in the proper course of the exercise of your employment, profession or duties; or (iv) engage in behaviour based on any inside information which would amount to market abuse for the purposes of the FSMA.
Other than as set out in this disclaimer, the information in this presentation has been provided by the Company or obtained from publicly available sources. The information in this presentation is still in draft form and will only be finalised at the time the Prospectus is published and the Group's third quarter interim management statement announced. None of the Company, its advisers, or anyother party is under any duty to update or inform you of any changes to information in this presentation, provide you with access to any additional information or to correct any inaccuracies in any such information which may become apparent. No representation or warranty (express or implied) is given that the information in this presentation is correct or complete.

3
DISCLAIMER
Certain information in this presentation is based on management estimates. Such estimates have been made in good faith and represent the genuine belief of applicable members of management. Those management members believe that such estimates are founded on reasonable grounds. However, by their nature, estimates may not be correct or complete. Accordingly, no representation or warranty (express or implied) is given that such estimates are correct or complete or founded on reasonable grounds.
None of The Commissioners of Her Majesty's Treasury, the Solicitor for the Affairs of Her Majesty's Treasury, UK Financial Investments Limited, the Asset Protection Agency, or any person controlled by or controlling any such person, or any director, officer, official or employee of any such person (each such person, an "HMT Representative") accepts any responsibility for the contents of, or makes any representation or warranty (express or implied) as to the accuracy, completeness or fairness of any information in, this presentation. Each HMT Representative expressly disclaims anyliability whatsoever for any loss howsoever arising from, or in reliance upon, the whole or any part of the contents of this presentation. No HMT Representative has approved or verified, or will approve or verify, the contents of this presentation.
FORWARD LOOKING STATEMENTSThis presentation includes certain forward looking statements within the meaning of the US Private Securities Litigation Reform Act of 1995 with respect to the business, strategy and plans of the Company and its current goals and expectations relating to its future financial condition and performance. Statements that are not historical facts, including statements about the Company’s or its directors’ and/or management’s beliefs and expectations, are forward looking statements. Words such as ‘believes’, ‘anticipates’, ‘estimates’, ‘expects’, ‘intends’, ‘aims’, ‘potential’, ’will’, ‘would’, ‘could’, ‘considered’, ‘likely’, ‘estimate’ and variations of these words and similar future or conditional expressions are intended to identify forward looking statements but are not the exclusive means of identifying such statements. By their nature, forward looking statements involve risk and uncertainty because they relate to events and depend upon circumstances that will occur in the future.
Examples of such forward looking statements include, but are not limited to, projections or expectations of the Company’s future financial position including profit attributable to shareholders, provisions, economic profit, dividends, capital structure, expenditures or any other financial items or ratios; statements of plans, objectives or goals of the Company or its management including in respect of the integration of HBOS and the achievement of certain synergy targets; statements about the future business and economic environments in the UK and elsewhere including trends in interest rates, foreign exchange rates, credit and equity market levels and demographic developments, competition, regulation, dispositions and consolidation or technological developments in the financial services industry; and statements of assumptions underlying such statements. Factors that could cause actual results to differ materially from the plans, objectives, expectations, estimates and intentions expressed in such forward looking statements made by the Company or on the Company’s behalf include, but are not limited to, general economic conditions in the UK and internationally; inflation, deflation, policies of the Bank of England and other G7 central banks and interest rate, exchange rate, market and monetary fluctuations; changing demographic developments including consumer spending, saving and borrowing habits, technological changes, natural and other disasters, adverse weather, terrorist acts and other acts of war or hostility and responses to those acts; changes in laws, regulations, taxation, Government policies or accounting standards or practices and similar contingencies outside the Company’s control; the ability to derive cost savings and other benefits as well as mitigate exposures from the acquisition and integration of HBOS; inadequate or failed internal or external processes, people and systems; exposure to regulatory scrutiny, legal proceedings or complaints; changes in competition and pricing environments; the inability to hedge certain risks economically; the adequacy of loss reserves; the ability to secure new customers and develop more business from existing customers; the degree of borrower credit quality; the ability to achieve value-creating mergers and/or acquisitions at the appropriate time and prices and the success of the Company in managing the risks of the foregoing. The Company may also make or disclose written and/or oral forward looking statements in reports filed with or furnished to the US Securities and Exchange Commission, the Company’s annual report and accounts, annual review, half-year announcement, proxy statements, offering circulars, prospectuses (including the prospectus in respect of the Proposals), press releases and other written materials and in oral statements made by the directors, officers or employees of the Company to third parties, including financial analysts. The forward looking statements contained in this presentation are made as of the date hereof, and the Company undertakes no obligation to update any of its forward looking statements.

Introduction
Sir Winfried BischoffChairman

Key Highlights
Eric DanielsGroup Chief Executive

6
TODAY’S PROPOSALSA market-based solution to Lloyds’ capital needs
At least £21 billion core1 capital generation: proceeds fully underwritten– £13.5 billion rights issue2
– £7.5+ billion exchange offers into enhanced capital notes (ECNs) and equity3
HMT/UKFI will fully subscribe to rights issue
Good momentum in 2009Q3 results
Proposals structured to:
Create a higher quality, more efficient capital structure
Reinforce capital ratios in stress conditions
Secure less onerous EU remedies than GAPS
Deliver superior economic value compared to GAPS
1 Core tier 1 and contingent core tier 1 capital2 Before expenses3 In limited circumstances, cash or additional ECNs (Non-US Exchange Offer)
POSITIONING LLOYDS BANKING GROUP FOR FUTURE GROWTH

7
SUPERIOR ECONOMIC VALUE TO GAPS
CAPITAL AND VALUE INSURANCE PROVIDED
PROPOSALS
£13.5 billion1 immediate cash and core tier 1 capital
GAPS payment of £2.5 billion
Lower dilution2
EPS and RoE enhancing relative to GAPS
£7.5 billion of contingent core tier 1 capital3
Converts into core tier 1 capital in times of severe stress
Coverage extends to all Group’s assets
£15.6 billion cost with marginal benefit
Public shareholders potentially diluted from 57% to 38% for limited value
Excess initial capital, excess medium term leverage as GAPS fee amortises
Adverse operational and commercial impact
GAPS
No net GAPS claims under Group central case
Even under FSA stress test net claims less than £15.6 billion fee
Coverage limited to GAPS assets
1 Before expenses2 Assumes no conversion of ECNs3 Based on fully underwritten exchange offers

8
Leading market positionsBreadth of revenue opportunitiesSignificant cost synergies
Significantly less onerous expected remedies than GAPSCost synergy target unchanged
UK economic outlook beginning to stabiliseStabilising marginsOverall impairments peaked
Core tier 1 ratio increases to 8.6%1
Liability management exercise creates contingent core tier 1 buffer of 1.6%2
Meets FSA stress test requirements
1 Pro-forma at 30 June 2009, excludes impact of any equity generated as part of exchange offers and after expenses and GAPS payment
2 Pro-forma at 30 June 2009, based on fully underwritten exchange offers
BUILDING POSITIVEMOMENTUM
HIGH QUALITY, EFFICIENTCAPITAL STRUCTURE
PROGRESS ONSTATE AID REMEDIES
COMPELLING INVESTMENTPROPOSITION
Rigorous risk managementLower asset intensityExcellent long term earnings and returns potential
A COMPELLING INVESTMENT PROPOSITION

9
BUILDING POSITIVE MOMENTUMPerforming in line with recent guidance
REVENUE GROWTH
COST:INCOME RATIO
INTEGRATION BENEFITS
REDUCTION IN BALANCE SHEET
ASSETS
High single digit growth within
2 years
c.200 p.a. basis points improvement
>£1.5 billion savings p.a. by end 2011
£200 billion asset reduction over
5 years
MARGINS Lower in 2009H2,rising in 2010
Business trending in line
with recent guidance
IMPAIRMENTS Overall impairments peaked in 2009H1
RECENT GUIDANCE Q3 TREND

10
£7.5bn £7.5bn
HIGH QUALITY, EFFICIENT CAPITAL STRUCTURE
Immediate 230bps increase in core tier 1 capital ratio to 8.6%
Appropriate and efficient core tier 1 capital base
160bps contingent core tier 1 capital buffer
ECNs convert to core tier 1 if published core tier 1 ratio falls below 5%
Downside protection in severe stress
Conversion trigger:
published core tier 1 below 5%
6.3%
8.6%
STRONG CORE TIER 1 CAPITAL EFFECTIVE DOWNSIDE PROTECTION
1 Pro-forma at 30 June 2009, excludes impact of any equity generated as part of exchange offers2 Net of tax
£30.3bn
£13.0bn
£41.5bn
As at30 June
2009
Rights issuenet of
expenses
GAPSpayment2
Pro-formapost
rights1
£1.8bn
Exchangeoffers
Total

11
STATE AID No materially negative impact on the Group’s business
c.£180 billion asset reduction
Divestment of retail banking business with at least 600 branches, a 4.6% personal current account market share and approximately 19% of the Group’s mortgage book, to include:
– C&G savings accounts and all C&G branch-based mortgages, all branches but not the brand
– Lloyds TSB Scotland, including all branch-based customers, but not the brand– TSB brand– Some Lloyds TSB branches in England and Wales1
– Intelligent Finance
2 year prohibition on discretionary coupon payments/calls on existing hybrids; no restriction on new issuance
– Consequent prohibition on ordinary share dividend payments for a similar period
Prohibition on making certain acquisitions for approximately 3 to 4 years
CONTINUE TO EXPECT COST SYNERGIES OF OVER £1.5 BILLION PER ANNUM BY 2011
1 Together with their branch-based customers

12
• A leading provider of banking products and services
• 35 million retail and nearly 1 million commercial customers
• Focused on most attractive segments in retail and wholesale
A LEADING UK FINANCIAL SERVICES COMPANY
LEADING MARKET POSITIONS
WINNING BUSINESS MODEL
EXCELLENT EARNINGS AND
RETURNS POTENTIAL
POWERFUL BRAND PRESENCE
• Deep and enduring customer relationships• Strong operational efficiency• Prudent risk disciplines• Capital disciplines
Income growth(high single digit within 2 years)
2% p.a. cost:income ratio
improvement (higher in earlier years)
Run off / redeploy£200 billion of assets;
core tier 1 ratio target of >7%
On track to achieve £1.5 billion cost
savings p.a.

Proposal Structure andThird Quarter Update
Tim TookeyGroup Finance Director

14
£21 BILLION OF CORE TIER 1 AND CONTINGENT CORE TIER 1 CAPITAL GENERATED
1 Before expenses2 Or in limited circumstances, cash or additional ECNs (Non-US Exchange Offer)
RIGHTS ISSUE£13.5bn1
£13.5 billion of new core tier 1 capital
Fully underwritten
HMT / UKFI will fully subscribe
EXCHANGE OFFERS AT LEAST
£7.5bn
£7.5 billion exchange offers into enhanced capital notes (ECNs) and new ordinary shares2
£7.5 billion fully underwritten

15
EXCHANGE OFFERSOverview
Offers to eligible holders of £16 billion Existing Securities (tier 1/upper tier 2 capital securities) to exchange into either of:
– Enhanced Capital Notes (ECNs) on a par for par basis with enhanced coupon; or
– Ordinary shares1 at a discount to the par value of Existing Securities exchanged
– maximum value of ordinary shares issued capped at £1.5 billion
– maximum ordinary shares equal to £1.5 billion divided by 75% of ECN conversion price
New ECNs treated as lower tier 2 at issue and convert into ordinary shares if Group’s published core tier 1 ratio falls below 5%
– ECN conversion price is the higher of (i) 5 day VWAP2 or (ii) 90% of the closing price as at 17 November 2009 (adjusted for the bonus element of the Rights Issue)
£7.5 billion underwriting of Exchange Offers provided by investment banks
Lloyds may limit quantum of Existing Securities accepted in Exchange Offers
1 In limited circumstances, cash or additional ECNs2 Volume weighted average price

16
BENEFITS OF EXCHANGE OFFERSAn attractive proposition for eligible holders
Benefits to ordinary shareholders
– Limited upfront dilution1
– Provides protection against severe downside
– Modest additional coupon cost
Investors exchanging into ECNs will benefit from
– Par for par exchange
– Certainty of coupon payments: many Existing Securities subject to deferral/suspension of coupon payments required by EU
– Fixed maturity date: ECNs are lower tier 2 bonds with fixed maturity date
Investors exchanging into ordinary shares will benefit from
– Greater liquidity in ordinary shares
– Premium to prevailing market price of their Existing Securities
1 Assumes no conversion of ECNs. Up to a maximum number of ordinary shares being equal to £1.5 billion divided by75% of ECN conversion price.
17
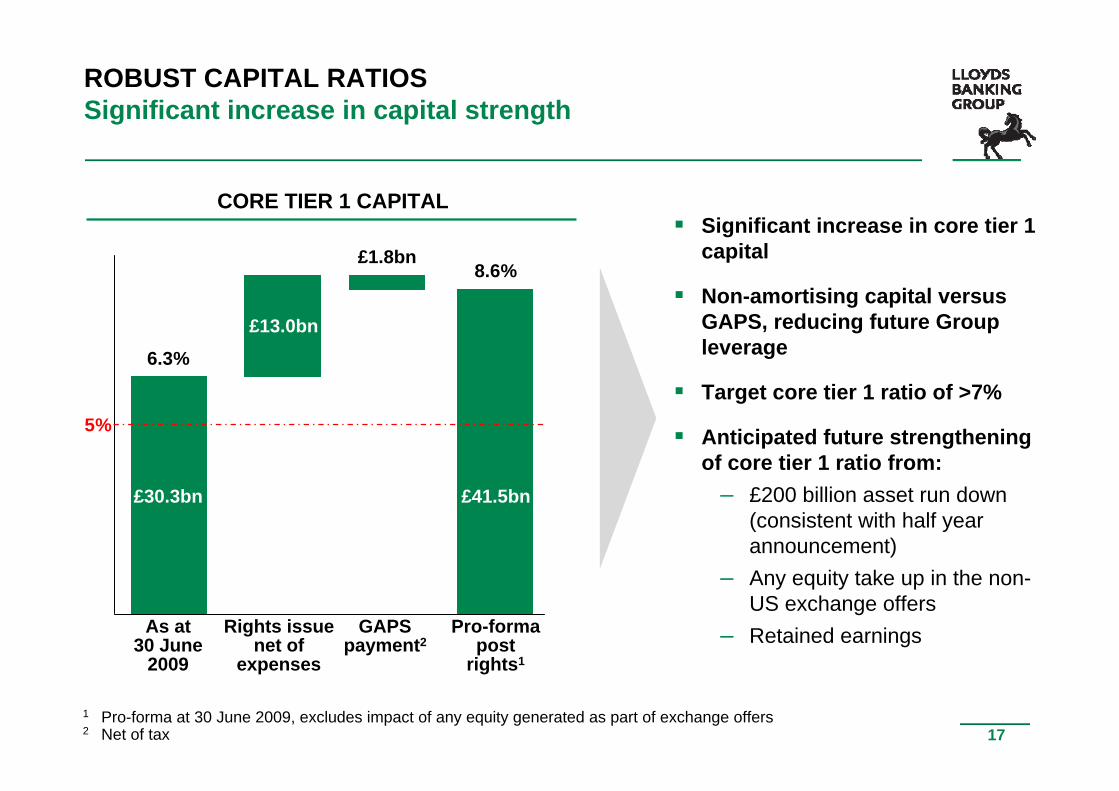
ROBUST CAPITAL RATIOSSignificant increase in capital strength
Significant increase in core tier 1 capital
Non-amortising capital versus GAPS, reducing future Group leverage
Target core tier 1 ratio of >7%
Anticipated future strengthening of core tier 1 ratio from:
– £200 billion asset run down (consistent with half year announcement)
– Any equity take up in the non-US exchange offers
– Retained earnings
CORE TIER 1 CAPITAL
1 Pro-forma at 30 June 2009, excludes impact of any equity generated as part of exchange offers2 Net of tax
5%
6.3%
8.6%
£30.3bn
£13.0bn
£41.5bn
As at30 June
2009
Rights issuenet of
expenses
GAPSpayment2
Pro-formapost
rights1
£1.8bn

18
HIGH QUALITY CAPITAL BASE1
Improving quantity and quality of capital base
If Exchange Offers not fully taken up, additional tier 1/ tier 2 capital (maximum £7.5 billion)
£7.5 billion capital buffer available for severe stress
Core tier 1 + contingent core tier 1 represents 78% of total capital (vs 66% under GAPS) post fee amortisation
1 As at 30 June 20092 Excludes value of tier 1 and upper tier 2 notes that could be exchanged into ECNs or equity
+47%
Coretier 1
Tier 1/tier 2
ECN
£62.6bn2
Proposals
+48%
March 2009GAPS
post feeamortisation
£bn
Coretier 1
(B shares)
Coretier 1
Coretier 1
Tier 1/tier 2
Tier 1/tier 2
March 2009GAPS
£53.1bn
£42.6bn
0
10
20
30
40
50
60
70

19
HIGH QUALITY CAPITAL BASEA more sustainable capital position (as at 30 June 2009)
GAPS RWA relief reduces as assets run-off
Capital reduced as GAPS fee amortises
Reversal of first loss deduction
Higher quality new core tier 1 capital
ECNs convert if published core tier 1 ratio falls below 5%
1 Assumes full £7.5bn of ECNs issued through underwriting2 Assumes constant RWAs unless otherwise specified and takes no account of retained earnings or losses3 Assumes GAPS assets fully run-off over 7 years
Immediate After 7 years
Net capital (‘B’ shares) 3.2% 3.2%
Reduced RWAs 4.6% 0.0%3
Amortising GAPS fee -0.2% -2.3%
50% of first loss -2.0% 0.0%deduction
Total 5.6% 0.9%
March 2009 GAPS participation: contribution to core tier 12
Immediate After Core tier 17 years below 5%
Right issue (net of 2.3% 2.3% 2.3%expenses/GAPS payment)
Liability management1 1.6%
Total 2.3% 2.3% 3.9%
November 2009 proposals: contribution to core tier 12
– –
20
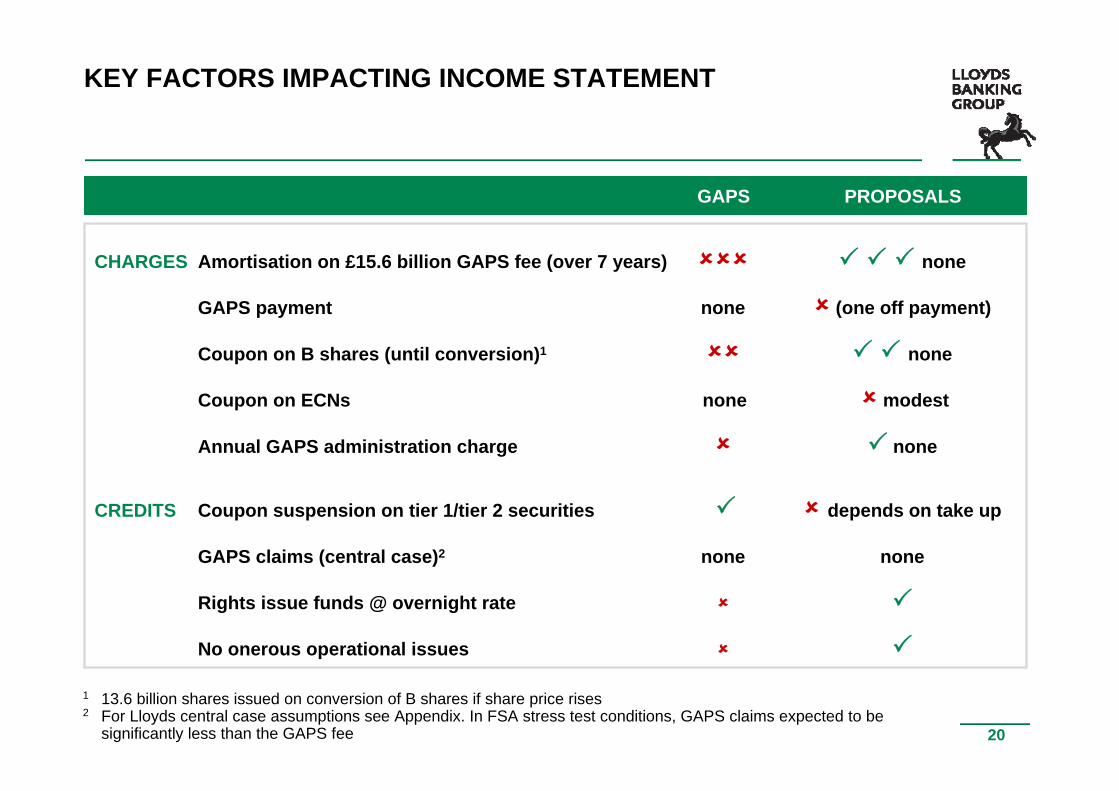
KEY FACTORS IMPACTING INCOME STATEMENT
1 13.6 billion shares issued on conversion of B shares if share price rises2 For Lloyds central case assumptions see Appendix. In FSA stress test conditions, GAPS claims expected to be
significantly less than the GAPS fee
CHARGES Amortisation on £15.6 billion GAPS fee (over 7 years) none
GAPS payment none (one off payment)
Coupon on B shares (until conversion)1 none
Coupon on ECNs none modest
Annual GAPS administration charge none
CREDITS Coupon suspension on tier 1/tier 2 securities depends on take up
GAPS claims (central case)2 none none
Rights issue funds @ overnight rate
No onerous operational issues
GAPS PROPOSALS

21
EU STATE AIDNo materially negative impact on the Group’s business
£2.5 billion before tax
Total income: c.£1.4 billion
Costs: c.£600 million
Profit before tax: c.£500 million
Customer lending: c.£70 billion
Customer deposits: c.£30 billion
CONTINUE TO EXPECT COST SYNERGIES OF OVER £1.5 BILLION PER ANNUM BY 2011
1 Subject to final State Aid decision and based on initial high level estimates only. Figures likely to change when final shape of banking divestments is agreed
‘NON-CORE’ ASSET REDUCTION BANKING DIVESTMENTS (2008)1
GAPS PAYMENT FEE
Consistent with half-year communication
Committed to reduce c.£180 billion over 5 years

22
Third Quarter Update

23
THIRD QUARTER UPDATEBuilding positive momentum
Continued to deliver good revenue performance in 2009Q3
Banking net interest margin flat in 2009Q3 compared to 2009H1
Costs continue to be well controlled: 2% lower compared to 9 months to 30 September 2008
Excellent progress on integration: £50 million higher run-rate of cost synergies than previously announced
Overall impairments on improving trend, 2009Q3 £5.2 billion compared to 2009H1 £13.4 billion:
– Overall run-rate has improved, particularly in Wholesale
– Ireland remains a concern
– We expect overall impairments to fall significantly in 2009H2

24
INTEGRATION UPDATECost synergy delivery ahead of schedule
Integration benefits continue to run ahead of schedule
Integration savings in first 9 months of 2009 of £250 million
Increased estimates for synergy delivery in 2009: year end run-rate of c.£750 million (up from £700 million)
Continue to expect over £1.5 billion of cost synergies per annum by end 2011 despite expected State Aid remedies
SYNERGY DELIVERY AS AT 3Q IMS (£m)
107
>1,500
250
c.450
c.750
2009H1 2011 run-rate
YTDSept2009
2009FYestimate
2009YErun-rate

25
IMPAIRMENTS TRENDSOverall Group impairments have peaked
Run-rate of impairments has slowed in 2009Q3
Continue to expect 2009H2 charge to be significantly lower than 2009H1 charge
2008H1 2008H2 2009H1 2009Q3
13.4
2.5
12.4
5.2
GROUP IMPAIRMENT CHARGES (£bn)
Significant reduction in mortgage impairment run-rate
Better house price index performance than expected
Mortgage arrears trends improving
Unsecured lending portfolio impacted by rising unemployment as expected
RETAIL IMPAIRMENT CHARGES (£bn)
2.21.4
2.31.1
2008H1 2008H2 2009H1 2009Q3

26
IMPAIRMENTS TRENDSOverall Group impairments have peaked
Significant reduction in impairment charge run-rate as expected
Reduction driven by sharp fall in commercial real estate impairments
2009H2 charge expected to be significantly lower than that in 2009H1
WHOLESALE IMPAIRMENT CHARGES (£bn)
High level of impairments in 2009H1 continued into 2009Q3
Two thirds of 2009Q3 charge related to Irish exposures
Outlook for Irish economy continues to be difficult, and expect high levels of impairments to continue through 2009
WEALTH & INT’L IMPAIRMENT CHARGES (£bn)
9.7
1.1
9.3
3.2
2008H1 2008H2 2009H1 2009Q3
1.50.1 0.7 0.9
2008H1 2008H2 2009H1 2009Q3

27
IMPAIRMENT GUIDANCEOverall impairments expected to have peaked in 2009H1
RETAIL
WHOLESALE
WEALTH & INTERNATIONAL
GROUP
Expected to peakin 2009H2
Expected to be significantlylower in 2009H2
Expected to be significantly lower in 2009H2
Concern over Irish exposures
Expected to have peakedin 2009H1
RECENT GUIDANCE
Lower than H1Guidance unchanged
Significantly lower than H1Guidance unchanged
Ongoing concerns with Irish economy. High level of
impairments to continue throughout 2009
Lower than H1Guidance unchanged
Q3 PERFORMANCE

28
HIGH QUALITY LIQUID ASSET BUFFERMaterial increase in liquidity buffer
Definitions:Minimum prudential requirement = minimum FSA liquid asset holdingExcess prime liquidity = eligible liquidity per FSA PS09/16 definition, i.e. G7 government debtSecondary liquidity = unencumbered CB eligible debt (post haircuts)
Secondaryliquidity
Excess primeliquidity
Minimum prudentialrequirement
£9.3bn
£11.7bn
£27.4bn
£25.0bn
31 Mar2009
25 Sept2009
£28.0bn
£48.3bn
£61.7bn
£88.0bn
Liquidity buffer in excess of 8% of total assets
A multiple of current regulatory requirements
Lloyds Banking Group already planning to use expected new FSA liquidity requirements

29
LLOYDS BANKING GROUPA compelling investment proposition
Significant improvement in quality and quantity of core tier 1 capital
Significant capital buffer from new contingent core tier 1 capital
Meets FSA stress test requirements
Not entering GAPS in favour of a market-based solution is a superior economic alternative for shareholders
Business performance and impairment trends continue to improve
PROPOSALS UNDERPIN THE GROUP’S LONG-TERM EARNINGS POTENTIAL

Appendix

31
CAPITAL GENERATION STRUCTURETimetable
General meeting 26 November 2009
Rights issue
– Rights issue terms announced 24 November 2009
– Dealing in nil-paids commences 27 November 2009
– Last date for acceptance/payment 11 December 2009
– New ordinary shares start trading fully paid 14 December 2009
Liability management
– Announce results of exchange offers (Non-US and early bird US) 23 November 2009
– Announce results of US exchange offer 9 December 2009
Each element of transaction on approval by shareholders of all other elements
HMT / UKFI can vote on all resolutions to approve transaction other than relating to GAPS payment

32
ECONOMIC FORECASTS
1 Forecast for year. Source FSA May 20092 Lloyds internal forecasts3 Year to Q4
FSA Stress LloydsTest1 Central Case2
2009 FORECAST 2010 FORECAST
FSA Stress LloydsTest1 Central Case2
-3.8 -4.0
-24.7 0.0
-30.3 -15.0
8.1 8.2
-2.0 +1.8
-20.4 0.0
-16.1 0.0
10.4 10.1
% change year-on-year
– GDP
– House prices3
– Commercial real estate3
Unemployment (%)

Rights Issue and Capital Enhancement Proposals
3 November 2009


![Commissioners for HM Revenue v Tower Mcashback...Easter Term [2011] UKSC 19 On appeal from: [2010] EWCA Civ 32 JUDGMENT Commissioners for Her Majesty's Revenue and Customs (Appellant)](https://static.fdocuments.us/doc/165x107/5f02a3a57e708231d40544b5/commissioners-for-hm-revenue-v-tower-mcashback-easter-term-2011-uksc-19-on.jpg)
