
RICHMOND LANDFILL TOWN OF GREATER …brec-currentops.wm.com/documents/2010-WESA-Annual-Report.pdfof...
54
WESA WESA 2010 ANNUAL MONITORING REPORT WASTE MANAGEMENT OF CANADA RICHMOND LANDFILL TOWN OF GREATER NAPANEE, ONTARIO Prepared for: WASTE MANAGEMENT OF CANADA 1271 Beechwood Road Napanee, Ontario K7R 3L1 March 2011
Transcript of RICHMOND LANDFILL TOWN OF GREATER …brec-currentops.wm.com/documents/2010-WESA-Annual-Report.pdfof...

WE
SA
WE
SA
2010 ANNUAL MONITORING REPORT
WASTE MANAGEMENT OF CANADA RICHMOND LANDFILL
TOWN OF GREATER NAPANEE,
ONTARIO
Prepared for: WASTE MANAGEMENT OF CANADA 1271 Beechwood Road Napanee, Ontario K7R 3L1 March 2011

Ref: Richmond LF 2010 Annual Report FINAL_20110325.docx
2010 ANNUAL MONITORING REPORT
WASTE MANAGEMENT OF CANADA
RICHMOND LANDFILL TOWN OF GREATER NAPANEE, ONTARIO
Prepared for:
WASTE MANAGEMENT OF CANADA 1271 Beechwood Road Napanee, ON K7R 3L1
Prepared by:
WESA Inc. 4 Cataraqui Street
The Tower, The Woolen Mill Kingston ON K7K 1Z7
WESA Project No.: KB8578-00-04
March 2010

2010 Annual Monitoring Report FINAL REPORT WM Richmond Landfill
E-1
EXECUTIVE SUMMARY
This report provides a summary and analysis of the environmental monitoring program at the Waste Management of Canada Corporation (WM) Richmond Landfill Site during the period from January 1 to December 31, 2010. The report is prepared in accordance with the Amended Provisional Certificate of Approval No. A371203 dated March 31, 2010, specifically Conditions 9[a] (environmental monitoring aspects only), 9[b][i], 9[b][xx] and 9[b][xxii]. Activities related to Site development, operations and closure are reported under separate cover.
The environmental monitoring program includes water quality analyses for groundwater and surface water, in the spring and fall, on and around the site. The groundwater flow directions interpreted from the 2010 monitoring program are consistent with the results obtained in previous years for the shallow flow zone, as well as for the intermediate bedrock flow zone. The direction of groundwater flow in the shallow groundwater flow zone in the vicinity of the landfill is divergent to the north and south reflecting local discharge to Marysville Creek toward the north and to Beechwood Ditch to the south. The predominant direction of groundwater flow in the intermediate bedrock is towards the west, south and southeast, and is consistent with regional information.
Groundwater quality data from 2010 are generally consistent with historical results.
Slightly elevated concentrations of a number of water quality parameters are seen in the shallow groundwater zone northwest and north of the Phase 1 landfill footprint, suggesting that the groundwater chemistry shows a dilute leachate signature. In other areas of the site, there is no evidence of groundwater impacts away from the landfill footprint in the shallow groundwater flow zone. The geochemical results for the intermediate bedrock groundwater flow zone indicate higher concentrations of water quality parameters south of the landfill relative to the concentrations west and north of the landfill. The higher concentrations are downgradient from the landfill footprint and occur in monitoring wells that are known to be hydraulically connected to each other. The concentrations at some of the monitoring wells immediately south of the landfill footprint may reflect minor groundwater impacts from site activities. Elsewhere south of the landfill footprint, the parameter concentrations exhibit different geochemical characteristics, and are believed to be the result of historic surface water infiltration and/or off-site sources. No comparison was made to Reasonable Use (RU) Limits since WM and MOE are actively continuing to address questions related to the Environmental Monitoring Plan (EMP). In any event, evaluation of the groundwater quality data indicates chemistry consistent with historical data and no off-site migration of leachate impacted groundwater. Continued groundwater monitoring within the shallow and intermediate bedrock groundwater flow zones between the landfill footprint and the low-head areas is warranted to further examine groundwater quality and trends over time.

2010 Annual Monitoring Report FINAL REPORT WM Richmond Landfill
E-1
The PWQO objectives were exceeded for some constituents in surface water at both upstream and downstream locations; consistent with historical results. The continuing sampling of Marysville Creek indicates that the landfill is not impacting the water quality of this creek.

2010 Annual Monitoring Report FINAL REPORT WM Richmond Landfill
i
TABLE OF CONTENTS
EXECUTIVE SUMMARY ........................................................................................................ E-1 1.0 INTRODUCTION ......................................................................................................... 1 2.0 MONITORING PROGRAM .......................................................................................... 1
2.1 MONITORING PROGRAM MODIFICATIONS IN 2010 ............................................................... 1 2.2 PROGRAM METHODOLOGY ................................................................................................. 1 2.3 SAMPLE COLLECTION AND LABORATORY ANALYSIS METHODOLOGY ........................................ 3
3.0 MONITORING RESULTS AND DISCUSSION ................................................................ 4 3.1 SITE HYDROGEOLOGY AND HYDROLOGY ............................................................................. 4 3.2 LEACHATE RESULTS ............................................................................................................ 5 3.3 GROUNDWATER RESULTS ................................................................................................... 5
3.3.1 Groundwater Elevations ......................................................................................... 5 3.3.2 Groundwater Chemistry Quality Assurance / Quality Control (QA/QC) ................. 6 3.3.3 Groundwater Sampling Results and Evaluation ....................................................... 7 3.3.4 Results from Off-Site Domestic Water Supply Wells ................................................ 8
3.4 SURFACE WATER RESULTS ................................................................................................... 8 3.4.1 Surface Water Flow Rates ....................................................................................... 9 3.4.2 Surface Water Quality Assurance / Quality Control (QA/QC) ................................. 9 3.4.3 Surface Water Sampling Results and Data Evaluation .............................................. 9
3.5 SUBSURFACE GAS SAMPLING ............................................................................................... 10 3.6 MONITORING WELL STATUS AND CONDITIONS .................................................................... 11
4.0 SUMMARY AND CONCLUSIONS ............................................................................... 11 4.1 LEACHATE ........................................................................................................................ 12 4.2 GROUNDWATER ............................................................................................................... 12 4.3 SURFACE WATER .............................................................................................................. 13 4.4 SUBSURFACE GAS .............................................................................................................. 13
5.0 LIMITING CONDITIONS ............................................................................................ 14

2010 Annual Monitoring Report FINAL REPORT WM Richmond Landfill
ii
LIST OF TABLES (at end of text)
Table 1a: Summary of Environmental Monitoring Program (Spring 2010) Table 1b: Summary of Environmental Monitoring Program (Fall 2010) Table 2a: Analytical Parameters for Water and Leachate Samples (Spring 2010) Table 2b: Analytical Parameters for Water and Leachate Samples (Fall 2010) Table 3a: Groundwater Elevation Monitoring Locations (Spring 2010) Table 3b: Groundwater Elevation Monitoring Locations (Fall 2010) Table 4: Leachate Quality Results (Spring 2010) Table 5a: Groundwater Elevations – April 28, 2010 Table 5b: Groundwater Elevations – October 25, 2010 Table 6a: Groundwater Quality Results – May 3-6, 2010 Table 6b: Groundwater Quality Results – October 26-28, 2010 Table 7: Water Quality Results from Off-Site Domestic Supply Wells – October 27, 2010 Table 8a: Surface Water Characteristics – May 3, 2010 Table 8b: Surface Water Characteristics – October 25, 2010 Table 9a: Surface Water Quality Results – May 3, 2010 Table 9b: Surface Water Quality Results – October 25, 2010 Table 10a: Subsurface Gas Monitoring Results – May 5, 2010 Table 10b: Subsurface Gas Monitoring Results – October 25, 2010
LIST OF FIGURES (at end of text)
Figure 1a: Site Plan and Monitoring Locations (Spring 2010) Figure 1b: Site Plan and Monitoring Locations (Fall 2010) Figure 2a: Shallow Groundwater Flow Zone Potentiometric Surface – April 28, 2010 Figure 2b: Shallow Groundwater Flow Zone Potentiometric Surface – October 25, 2010 Figure 3a: Intermediate Bedrock Groundwater Flow Zone Potentiometric Surface –
April 28, 2010 Figure 3b: Intermediate Bedrock Groundwater Flow Zone Potentiometric Surface –
October 25, 2010

2010 Annual Monitoring Report FINAL REPORT WM Richmond Landfill
Page 1
1.0 INTRODUCTION The purpose of this document is to present results and to provide an interpretation of the data that were collected during the spring and fall 2010 semi-annual monitoring events at the Waste Management of Canada Corporation (WM) Richmond Landfill. This annual report is designed to summarize the results provided in the individual monitoring event reports previously submitted to MOE.
The WM Richmond Landfill is approved as a 16.2 hectare waste disposal (landfilling) facility within a total site area of 138 hectares, located on parts of Lots 1, 2 and 3, Concession IV of the former Township of Richmond, now in the Town of Greater Napanee, Ontario.
The site is licensed under the following Provisional Certificate of Approval (C of A)
A371203 dated March 20, 1988 and subsequently amended on September 4, 1991, September 2, 1994, August 1, 1995, September 11, 1996, August 29, 2000, January 27, 2002, November 24, 2003, March 21, 2007 and March 31, 2010.
2.0 MONITORING PROGRAM 2.1 MONITORING PROGRAM MODIFICATIONS IN 2010
As required in the March 31, 2010 Amendment to the Provisional C of A, the spring monitoring event was conducted in accordance with condition 8(a) of the amended C of A. Condition 8(b) of the amended C of A required that WM prepare and submit an updated environmental monitoring plan (EMP) to MOE. An updated EMP, based on the previously submitted and MOE accepted Site Conceptual Model, was submitted to the MOE on June 29, 2010. Upon submittal of the updated EMP, condition 8(b) of the amended C of A stipulates that “Pending final approval of the EMP by the Director, the Owner shall implement the EMP upon submission to Director.” As such, the fall monitoring event was conducted in accordance with the updated EMP. Due to the timing of the updated EMP submittal and implementation, the spring and fall monitoring programs differ from each other. Methodology details regarding each of the monitoring events are presented in the follow section. 2.2 PROGRAM METHODOLOGY Spring 2010 Semi-Annual Monitoring Event The spring monitoring event was conducted between April 28 and May 6, 2010. The results from this event were submitted to MOE for review in a report dated September, 2010. The site layout and monitoring locations are shown on Figure 1a. The environmental monitoring

2010 Annual Monitoring Report FINAL REPORT WM Richmond Landfill
Page 2
program is presented in Table 1a, while the groundwater and leachate parameters analysed are summarized in Table 2a. Table 3a presents the groundwater elevation monitoring locations. A total of 70 groundwater monitors were sampled from 42 locations during the spring groundwater sampling event conducted between May 3 and 6, 2010. Nine (9) groundwater monitoring wells could not be sampled because they (a) were dry (M3A-2, M46-1 and M99-1), (b) had insufficient recovery for sampling after purging (M4-1, M4-2, M29 and M50-2), or (c) because they were damaged (M23 and M58-4). Spring surface water sampling was conducted on May 3, 2010 from locations S2, S3, S7 and S8R, while locations S4R and S5 were dry. Leachate samples were collected from the North Chamber and South Chamber on May 4, 2010 and were analyzed for parameters listed in Table 2a (Lists C and D). Landfill gas migration monitoring was conducted on May 5, 2010. Field measurements were made with a RKI Eagle probe calibrated to methane gas response at five (5) gas monitors (GM1 and GM3 to GM6). Additionally, nine (9) field duplicate samples, three (3) field blanks, eight (8) trip blanks, and two (2) equipment blanks were collected during the spring sampling event, for a total of 16 Quality Assurance/Quality Control (QA/QC) samples. Deionised water for analysis of blank samples was supplied by the laboratory. Fall 2010 Semi-Annual Monitoring Event The fall monitoring event was conducted between October 25 and October 28, 2010. The results from this event were submitted to MOE for review in a report dated December, 2010. The site layout and monitoring locations are shown on Figure 1b. The environmental monitoring program is presented in Table 1b, while the groundwater and leachate parameters analysed are summarized in Table 2b. Table 3b presents the groundwater elevation monitoring locations in relation to the landfill footprint and hydrostratigraphic unit. Construction of the two new groundwater monitoring wells (M105 and M106) specified in Table 1 of the EMP (intermediate bedrock groundwater zone) was not completed at the time of the fall 2010 monitoring event; consequently these wells were not used to record water levels or for sampling as part of this event. A total of 39 groundwater monitors were sampled from 36 locations. Three (3) groundwater monitoring wells could not be sampled because they (a) had insufficient recovery for sampling after purging (M29 and M39), or (b) were damaged (the standpipe in M58-4 was broken below the ground surface and contained bentonite).

2010 Annual Monitoring Report FINAL REPORT WM Richmond Landfill
Page 3
Eight (8) off-site domestic water supply wells were sampled on October 27, 2010. Water samples from private supply wells were analyzed for groundwater inorganic and general parameters, as well as for VOCs. Fall surface water sampling was conducted on October 27, 2010 from locations S2, S3, S5 and S8R, while location S4R was dry. Surface water samples were analyzed for the surface water inorganic and general parameters. Landfill gas migration monitoring was conducted on October 25, 2010. Field measurements were made with a RKI Eagle probe calibrated to methane gas response at five (5) gas monitors (GM1 and GM3 to GM6). Additionally, six (6) field duplicate samples, three (3) field blanks, and one (1) equipment blank were collected during the fall sampling event, for a total of 10 Quality Assurance/Quality Control (QA/QC) samples. Deionised water for analysis of blank samples was supplied by the laboratory. 2.3 SAMPLE COLLECTION AND LABORATORY ANALYSIS METHODOLOGY Groundwater and surface water samples were collected in accordance with accepted industry protocols. Groundwater samples were collected using dedicated Waterra inertial lift pumps connected to dedicated polyethylene tubing. Between one and three casing volumes of water were removed from each monitoring well prior to the collection of groundwater samples. During purging, readings for pH, conductivity and temperature were recorded on a regular basis. The stabilization of the parameters was used to assess when well purging was complete. Low producing wells were purged dry and allowed to recover prior to sampling. If the monitoring well had not recovered sufficiently for sampling within 24 hours, the monitor was considered dry and a sample was not collected. Domestic supply wells were sampled at an access point before any treatment system. A typical sampling location was a tap or access located near the pressure tank or when access to the treatment system was not available, the sample was collected from the kitchen tap (with the aerator screen removed). Prior to collecting the water sample, the water was allowed to run for a minimum of five but more typically closer to 10 minutes to ensure the volume of the pressure tank and supply line was purged and that the sample would be representative of well water conditions. Surface water samples were taken using a 50 cc syringe and carefully collecting the surface water as not to disturb the bottom sediments. Surface water sampling locations were sampled from downstream to upstream to prevent any re-suspension of sediment impacting the

2010 Annual Monitoring Report FINAL REPORT WM Richmond Landfill
Page 4
downstream sampling locations. The pH, temperature, and conductivity of the surface water were obtained in the field at all surface water sampling points while minimizing disturbance of the bottom sediment. All water samples were placed in bottles supplied and prepared by the laboratory. The samples were packed in coolers with ice and shipped by courier to the laboratory. All samples were analysed by Maxxam Analytics Inc. of Mississauga, ON, which is accredited by the Canadian Association for Laboratory Accreditation Inc. (CALA) 3.0 MONITORING RESULTS AND DISCUSSION 3.1 SITE HYDROGEOLOGY AND HYDROLOGY
Background information concerning the site geology and hydrogeology were described in
detail in the Site Conceptual Model (SCM) report1, and is summarized here. The SCM report describes the groundwater flow conditions at the Richmond Landfill. Based on the results from extensive studies conducted previously at the site, the basic hydrogeological framework for the facility has been defined as follows:
· the active groundwater flow zone at the site extends to a depth of approximately 30 metres below the top of bedrock;
· the shallow groundwater flow zone is conceptualized as the overburden, the overburden-bedrock contact and the upper one to two metres of bedrock;
· the direction of groundwater flow in the shallow flow zone is strongly influenced by topography;
· the intermediate bedrock flow zone extends from one to two metres below top of bedrock to a depth of approximately 30 metres below top of bedrock;
· groundwater flows through a well-connected network of fractures in the upper 30 metres of bedrock;
· the dominant fracture orientation is horizontal to sub-horizontal; however, vertical to subvertical fractures are present providing hydraulic connection between horizontal fractures;
· intermediate bedrock flownets show that groundwater generally flows to the west from the western edge of the landfill, to the south-southeast from the southern edge of the landfill, to the southwest from the southwest corner of the landfill and north to northwest from the northwest portion of the landfill;
1 Site Conceptual Model Report, WM Richmond Landfill, prepared by Dr. B.H. Kueper and WESA Inc., October 2009

2010 Annual Monitoring Report FINAL REPORT WM Richmond Landfill
Page 5
· the hydraulic conductivity of the intermediate bedrock is lower to the north and east of the landfill compared to other areas of the site, implying that the rate of groundwater flow is lower than in areas south, southeast and west of the landfill; and
· flow directions in the intermediate bedrock zone are variable with season. 3.2 LEACHATE RESULTS
The spring 2010 leachate chemistry results from the North and South Chambers are
summarized in Table 4 (sampled May 4, 2010). Leachate at the Richmond Landfill is characterized by elevated concentrations of general water quality parameters such as alkalinity, ammonia, conductivity, DOC, hardness, toluene, and TKN, as well as selected VOCs for both the North and South Chamber samples. In general, the parameters that characterize the leachate are more elevated in the samples collected from the South Chamber compared to the North Chamber.
3.3 GROUNDWATER RESULTS
3.3.1 Groundwater Elevations
The groundwater flow directions were inferred by interpolating groundwater elevations
from the hydraulically responsive wells screened within the corresponding groundwater flow zone, and are consistent with historical results. Groundwater elevations from program monitoring wells were measured on April 28, 2010 and October 25, 2010 and are presented in Tables 5a and 5b, respectively. The groundwater flownets for the shallow groundwater flow zone is shown on Figures 2a and 2b for the spring and fall events, respectively. Figures 3a and 3b present the groundwater flownets for the intermediate bedrock groundwater flow zone for the spring and fall events, respectively. The 2010 shallow groundwater flownets are similar for spring and fall data and are consistent with historical results. The flownets show that the Empey Hill drumlin southwest from the landfill creates a flow divide with shallow groundwater being directed both to the north and the south. The northerly flowing groundwater flows toward Marysville Creek, while shallow groundwater to the south flows towards Beechwood Ditch. Shallow groundwater south of Beechwood Road flows locally to the north-northwest, towards an area of lower hydraulic head in the south part of the site. Shallow groundwater east of the landfill is influenced by a local zone of higher water levels in the vicinity of monitoring wells M96 and M70. The 2010 intermediate bedrock zone flownets show that groundwater in the intermediate bedrock flow zone generally flows to the west from the western edge of the landfill, to the south-southeast from the southern edge of the landfill, and to the southwest from the southwest corner of the landfill. The hydraulic influence of Empey Hill is seen in the intermediate flow zone

2010 Annual Monitoring Report FINAL REPORT WM Richmond Landfill
Page 6
in that a relatively stagnant zone (weaker hydraulic gradients) is created to the west and southwest of the landfill. In the portion of the site to the south and southeast of the landfill, between the waste and Beechwood Road, groundwater flows to the south and southeast. In this area, groundwater elevations in the intermediate bedrock flow zone were higher in the spring (Figure 3a) than in the fall (Figure 3b) in a number of wells, resulting in a pronounced easterly component of groundwater flow in the fall compared to the spring. This seasonal variation in groundwater flow orientation south of the landfill is consistent with historical interpretations. Overall, the directions of groundwater flow within the intermediate flow zone are consistent with the regional directions of groundwater flow, towards the south. The deep groundwater is saline and not suitable for potable use. There is limited hydraulic interaction between the intermediate and deep bedrock flow zones because of the differences in groundwater density related to salinity. Deep bedrock groundwater will generally flow to the south and will generally flow in a horizontal direction, although vertical components of flow may also exist. The bulk rock hydraulic conductivity is generally lower at depths greater than 30 m below the top of bedrock, and the fracture apertures are generally smaller. It follows that groundwater flow in the deep bedrock flow zone will be slower than in the shallow and intermediate flow zones. 3.3.2 Groundwater Chemistry Quality Assurance / Quality Control (QA/QC)
An evaluation of the QA/QC data (from duplicate and blank samples) was provided in the spring and fall semi-annual reports submitted to MOE for review in September and December, 2010. Analytical results were compared between regular samples and their corresponding field duplicate samples, submitted to the laboratory without identifying the location they were collected from. A standard margin of error of 20% (relative percent difference (RPD) between regular sample and duplicate) was deemed acceptable for field duplicates. In general, the comparison between samples and duplicates shows very good correlation for the majority of analyzed constituents. All parameters for groundwater duplicate QA/QC sampling were well within the 20% margin of error with few exceptions.
Spring 2010 Semi-Annual Monitoring Event For the May, 2010 monitoring event, all parameters for groundwater duplicate QA/QC
sampling were well within the 20% margin of error with the exception of total Kjeldahl nitrogen (4 of 8 duplicate samples), chemical oxygen demand (3 of 8), nitrate (2 of 8) and nitrite (2 of 8). Of these, all except one (nitrite at M10-2) were measured at low concentrations (less than 5 times the MDL) and are therefore within acceptable margin of error. All parameters were near or below the MDL in trip, equipment and field blanks.

2010 Annual Monitoring Report FINAL REPORT WM Richmond Landfill
Page 7
Fall 2010 Semi-Annual Monitoring Event For the October 2010 monitoring event, only eight individual results had an RPD greater
than 20%; of these, all except three (calcium, dissolved organic carbon and hardness at M96) were measured at low concentrations (less than 5 times the MDL) and are therefore within acceptable margin of error. All parameters were near or below the MDL in equipment and field blanks.
3.3.3 Groundwater Sampling Results and Evaluation
Analytical results from the groundwater monitoring wells sampled in spring and fall 2010 are presented in Tables 6a and 6b, respectively. Note that because of the change in monitoring programs between the spring and fall 2010 sampling events (see Section 2.1 for details), the groundwater monitoring wells that were monitored are different between spring and fall. Groundwater quality data from the 2010 monitoring events are similar to historical results, and are discussed in this section.
Shallow Groundwater Flow Zone Slightly elevated concentrations of a number of water quality parameters (e.g., alkalinity,
chloride, conductivity, DOC, iron, manganese, phenols, sodium and/or TDS) were observed in some shallow groundwater zone monitoring wells located northwest and north of the unlined Phase 1 landfill footprint. The chemistry identified here suggests that the groundwater chemistry shows a dilute leachate signature. In other areas of the site, there is no evidence of groundwater impacts away from the landfill footprint in the shallow groundwater flow zone. Isolated occurrences of elevated concentrations of water quality parameters (i.e., one or two parameters per sample) are seen elsewhere on the Site, particularly on or immediately adjacent to the landfill footprint. No indication of elevated concentrations related to landfill impacts were identified at the property boundary in the shallow flow zone.
Intermediate Bedrock Groundwater Flow Zone Analytical results from intermediate bedrock groundwater monitors sampled in May and
October, 2010 show that groundwater quality in this zone is variable across the site. These findings are consistent with historical results. Intermediate bedrock zone groundwater and surface water chemistry conditions south of the landfill were reviewed in a technical memorandum previously submitted to the MOE2 (dated June 14, 2010). This study investigated the apparently increasing concentrations of some parameters (e.g., alkalinity, ammonia, COD, iron, chloride, sodium, etc.) over time at selected monitoring wells installed in the intermediate bedrock flow 2 On-Site Groundwater and Surface Water Quality Assessment, Waste Management (WM) Richmond Landfill, technical memorandum to Chris Prucha (WM), June 14, 2010.

2010 Annual Monitoring Report FINAL REPORT WM Richmond Landfill
Page 8
zone south (M9-2, M9-3, M10-1, M49-1, M49-2 and M71) and north/northwest (M5-2 and M6-3) of the site. It was concluded that the groundwater chemistry changes seen at these monitoring wells are most likely related to surface water infiltration and off-site sources. Wells immediately south of the landfill, such as M9-2 and M9-3, may have historically shown effects from leachate; however, there are no indications that these concentrations have resulted in off-site impact. Further evaluation of the groundwater conditions south of the landfill, including the drilling of new monitoring wells, is currently underway and will be completed through 2011. The additional investigations will assist in refining the understanding of groundwater flow directions and groundwater chemistry in the area. 3.3.4 Results from Off-Site Domestic Water Supply Wells Results from off-site private water supply wells sampled in fall 2010 as part of the EMP are presented in Table 7. Comparison with Ontario Drinking Water Quality Objectives and Guidelines (ODWSOG, 2006) revealed all parameters were below their respective maximum acceptable concentrations (MAC) or interim maximum acceptable concentrations (IMAC) as specified in Table 2 of the ODWSOG. Some inorganic parameters (general chemistry and dissolved metals) were measured at concentrations exceeding their respective aesthetic objective (AO) or operational guideline (OG) from Table 4 of the ODWSOG. As was the case in investigations conducted recently, most volatile organic compounds (VOCs) in off-site supply wells were reported below the laboratory reporting limit (RL) at all locations, with the exception of some VOCs that were detected in measurable quantities above the RL at some locations. In all cases, VOC concentrations were below the MAC or AO. The moderate mineralization observed at the private water supply wells sampled (elevated alkalinity, hardness, TDS and sodium) is consistent with the local hydrogeological setting (carbonate aquifer with documented saline groundwater at depth). The origin of the elevated concentrations of some dissolved metals (iron, manganese) and DOC at some locations is unknown. The low levels of VOCs observed at some locations adjacent to 1252 Beechwood Road are likely attributable to the historical release of VOCs at this location (former abattoir).
3.4 SURFACE WATER RESULTS The two water courses that receive surface water/storm water runoff from the Richmond Landfill Site are Marysville Creek to the north of the waste mound and Beechwood Ditch to the south (Figures 1a and 1b). Surface water monitoring locations were the same for the spring and fall, 2010 monitoring events and are shown on Figures 1a and 1b, respectively.

2010 Annual Monitoring Report FINAL REPORT WM Richmond Landfill
Page 9
3.4.1 Surface Water Flow Rates Visual observations of surface water flow and general water characteristics for the 2010 sampling program are summarized in Table 8a and 8b (spring and fall monitoring events, respectively). In May, 2010, surface water flow was too low to measure, while in October, 2010, surface water flow was very low (on the order of 1-2 cm/s) and at times also below the recording capabilities of the flow meter. 3.4.2 Surface Water Quality Assurance / Quality Control (QA/QC)
An evaluation of the QA/QC data (from duplicate samples) was provided in the spring and fall semi-annual reports submitted to MOE for review in September and December, 2010. Analytical results were compared between regular samples and their corresponding field duplicate samples, submitted to the laboratory without identifying the location they were collected from. A standard margin of error of 20% was deemed acceptable for field duplicates. In general, the comparison between samples and duplicates shows very good correlation for the majority of analyzed constituents.
All parameters for surface water duplicate QA/QC sampling were well within the 20%
margin of error with the exception of colour, total phosphorus, total suspended solids and turbidity during the May, 2010 event, while all parameters for the surface water duplicate QA/QC sample (location S2) in October, 2010 were well within the 20% margin of error. 3.4.3 Surface Water Sampling Results and Data Evaluation The results from the surface water locations sampled in spring and fall 2010 are presented and compared to the Provincial Water Quality Objectives (PWQO) in Tables 9a and 9b, respectively. Surface water quality data for the spring and fall 2010 monitoring events were similar to historical results and are discussed below. Upstream surface water quality was monitored at station S2 for Marysville Creek, while background surface water quality for Beechwood Ditch was recorded from station S5 in fall only (background surface water quality for Beechwood Ditch could not be determined during the May, 2010 event since station S5 was dry at the time of sampling). Storm water runoff from the existing landfill area flows to one of three storm water sedimentation retention ponds, located to the northeast, northwest and south of the landfill footprint. The retention pond located south of the landfill was reconstructed in 2008 and now has an increased storage volume and, as a result, an increased retention time. A fourth pond receives runoff from the compost pad; however, there is no direct discharge from this pond to surface water.

2010 Annual Monitoring Report FINAL REPORT WM Richmond Landfill
Page 10
Results from spring and fall 2010 are presented below and indicate that the landfill is not causing any adverse impacts to surface water quality.
Spring 2010 Semi-Annual Monitoring Event All constituents analysed in surface water samples collected in May, 2010 were below
their respective PWQO, with the exception of (a) iron at sampling location S3 which slightly exceeded the PWQO (0.33 mg/L vs. 0.3 mg/L); and (b) phosphorus which was detected at concentrations exceeding the PWQO of 0.03 mg/L at all locations sampled, including the upstream location S2 along Marysville Creek. An elevated phosphorus concentration was observed at location S8R (0.59 mg/L); note however this location was only sampled on one previous occasion (2009), therefore additional monitoring results are required in order to confirm the results.
Fall 2010 Semi-Annual Monitoring Event
All constituents analysed in surface water samples collected in October, 2010 were below their respective PWQO, with the exception of phosphorus which was detected at concentrations slightly exceeding the PWQO of 0.03 mg/L at Marysville Creek downstream location S3 (0.031 mg/L), Beechwood Ditch upstream location S5 (0.11 mg/L), and location S8R (0.032 mg/L) located in a drainage swale exiting the southwest portion of the site that feeds into Beechwood Ditch.
It should be noted that total phosphorus concentrations have historically been detected at concentrations frequently exceeding the PWQO at background locations (e.g., see 2009 Annual Monitoring Report), as well as downstream from the landfill site, and are not attributable to the landfill.
3.5 SUBSURFACE GAS SAMPLING On May 5 and October 25, 2010, WESA inspected the subsurface gas monitoring probes and obtained measurements from the gas probes. Measurements were made using a RKI Eagle probe calibrated to methane gas response. The location and condition of the gas monitors and the measurement results are shown in Tables 10a and 10b for the spring and fall events, respectively. Readings were between 0 ppm and 40 ppm in the spring, and between 0 ppm and 130 ppm in the fall, well below the trigger level of 50% LEL (25,000 ppm) specified in the EMP dated June 29, 2010.

2010 Annual Monitoring Report FINAL REPORT WM Richmond Landfill
Page 11
3.6 MONITORING WELL STATUS AND CONDITIONS During the various monitoring events conducted throughout the year, the conditions of monitoring wells in the program were inspected. Any repairs, such as new locks, labels or well caps, etc. were made as necessary. At M58-4, the PVC standpipe has been damaged below ground surface; however, the steel protective casing around the standpipe remains in place, and is capped. Watertight casings and seals are in place at all other monitors to ensure that surface water or foreign materials do not infiltrate the wells. These monitoring wells comply with the applicable sections of Ontario Regulation 903 relevant to “test holes” as defined in the regulation, as well as the overall intent of the regulation to protect groundwater supplies. Of all of the monitoring wells included in the EMP only M58-4 is currently inactive; additional repairs and inspections are required to bring this monitor back into commission. 4.0 SUMMARY AND CONCLUSIONS
The 2010 annual monitoring program included recording groundwater elevations, collection of groundwater, surface water and leachate samples, and landfill gas monitoring, in accordance with the site groundwater monitoring requirements outlined in the Amendment to the C of A issued on March 31, 2010. The spring 2010 monitoring event was conducted as specified in the amended C of A, while the fall 2010 monitoring event was conducted in accordance with the revised EMP dated June 29, 2010.
Spring 2010 Semi-Annual Monitoring Event
· Water levels were measured on April 28, 2010 at all (182) monitoring wells
specified in Schedule B of the Amended C of A. · 70 groundwater monitors were sampled from 42 locations during the spring
groundwater sampling event. A total of 22 Quality Assurance/Quality Control (QA/QC) samples were also collected (9 field duplicates, 3 field blanks, 8 trip blanks and 2 equipment blanks).
· Surface water samples were collected on May 3, 2010. Of the six surface water locations in the monitoring program, only four (4) were sampled (S4R and S5 were dry).
· Leachate samples were collected from the North Chamber (monthly from January to May, 2010) and South Chamber (April and May, 2010).
· Subsurface gas concentrations were recorded from five on-site gas monitoring wells.
Fall 2010 Semi-Annual Monitoring Event · Water levels were measured from 65 groundwater monitoring wells (39 in the
shallow groundwater flow zone and 22 in the intermediate bedrock flow zone).

2010 Annual Monitoring Report FINAL REPORT WM Richmond Landfill
Page 12
· 39 groundwater monitors were sampled from 36 locations (17 completed in the shallow zone and 22 in the intermediate bedrock).
· Eight (8) off-site domestic water supply wells located along Beechwood Road were sampled.
· Four (4) surface water locations were sampled. · A total of 10 Quality Assurance/Quality Control (QA/QC) samples were collected (6
field duplicates, 3 field blanks and 1 equipment blank). · Subsurface gas concentrations were recorded from five on-site gas monitoring wells.
4.1 LEACHATE
· Leachate quality for samples collected from the North and South Chambers in spring 2010 was similar to historical values, and is characterized by elevated concentrations of general water quality parameters such as alkalinity, ammonia, conductivity, DOC, hardness, toluene, and TKN, as well as selected VOCs for both the North and South Chamber samples.
· The parameters that characterize the leachate from the North and South Chambers are similar but generally more elevated in the samples collected from the South Chamber.
4.2 GROUNDWATER
· Groundwater flow directions interpreted from monitors known to be hydraulically active were consistent with historical flownets:
o Shallow groundwater flow is influenced by local topographic highs in the southwestern (Empey Hill Drumlin) and eastern (M96/M70 area) portions of the site, and is characterized by a flow divide with shallow groundwater being directed both to the north (toward Marysville Creek) and the south (toward Beechwood Ditch).
o Groundwater in the intermediate bedrock flow zone generally flows to the west from the western edge of the landfill, to the south-southeast from the southern edge of the landfill, and to the southwest from the southwest corner of the landfill. Overall, the directions of groundwater flow within the intermediate flow zone are consistent with the regional directions of groundwater flow, towards the south.
· Groundwater quality data from fall 2010 are generally consistent with historical results.
· Slightly elevated concentrations of a number of water quality parameters were seen in the shallow groundwater zone northwest and north of the Phase 1 landfill footprint. In other areas of the site, no evidence was observed of groundwater impact away from the landfill footprint in the shallow groundwater flow zone.

2010 Annual Monitoring Report FINAL REPORT WM Richmond Landfill
Page 13
· The geochemical results for the intermediate bedrock groundwater flow zone indicate higher concentrations of water quality parameters south of the landfill relative to the concentrations west and north of the landfill. The higher concentrations are downgradient from the landfill footprint and occur in monitoring wells that are known to be hydraulically connected to each other.
· The moderate mineralization observed at the off-site private water supply wells along Beechwood Road (elevated alkalinity, hardness, TDS and sodium) is consistent with the local hydrogeological setting (carbonate aquifer with documented saline groundwater at depth). The origin of the elevated concentration in some dissolved metals (iron, manganese) and DOC at some locations is unknown. The low levels of VOCs observed at some locations adjacent to 1252 Beechwood Road are likely attributable to the historical release of VOCs at this location (former abattoir).
· Continued groundwater monitoring within the shallow and intermediate bedrock groundwater flow zones between the landfill footprint and the low-head areas is warranted in order to further examine groundwater quality and any trends over time. Additional investigative work related to the observed groundwater chemistry is ongoing at this time.
4.3 SURFACE WATER
· The concentrations observed were within the range of historical monitoring results. · Similar to historic surface water quality, concentrations of total phosphorous
exceeded the PWQO objective during the fall 2010 sampling event at the upstream (S5) and downstream (S8R) locations in Beechwood Ditch, as well as downstream location in Marysville Creek.
· The results indicate that surface water runoff from the site is not affecting Marysville Creek or Beechwood Ditch.
4.4 SUBSURFACE GAS
· All measurements for methane gas were below the trigger level of 50% LEL, or 25,000 ppm.

2010 Annual Monitoring Report FINAL REPORT WM Richmond Landfill
Page 14
5.0 LIMITING CONDITIONS The 2010 monitoring program involved the collection of groundwater (from on-site monitoring wells and off-site domestic supply wells), surface water and sub-surface gas for analyses at the site monitoring locations. The data collected during this investigation represent the conditions at the sampled locations only. The conclusions presented in this report represent our professional opinion, in light of the terms of reference, scope of work, and any limiting conditions noted herein. Respectfully submitted, François A. Richard, Ph.D, P.Geo. David Harding, M.Sc. P.Eng. Senior Hydrogeologist Senior Consulting Engineer

LIST OF TABLES
Table 1a: Summary of Environmental Monitoring Program (Spring 2010) Table 1b: Summary of Environmental Monitoring Program (Fall 2010)
Table 2a: Analytical Parameters for Water and Leachate Samples (Spring 2010) Table 2b: Analytical Parameters for Water and Leachate Samples (Fall 2010)
Table 3a: Groundwater Elevation Monitoring Locations (Spring 2010) Table 3b: Groundwater Elevation Monitoring Locations (Fall 2010)
Table 4: Leachate Quality Results (Spring 2010) Table 5a: Groundwater Elevations – April 28, 2010 Table 5b: Groundwater Elevations – October 25, 2010
Table 6a: Groundwater Quality Results – May 3-6, 2010 Table 6b: Groundwater Quality Results – October 26-28, 2010
Table 7: Water Quality Results from Off-Site Domestic Supply Wells – October 27, 2010 Table 8a: Surface Water Characteristics – May 3, 2010
Table 8b: Surface Water Characteristics – October 25, 2010 Table 9a: Surface Water Quality Results – May 3, 2010
Table 9b: Surface Water Quality Results – October 25, 2010 Table 10a: Subsurface Gas Monitoring Results – May 5, 2010
Table 10b: Subsurface Gas Monitoring Results – October 25, 2010

Table 1a: Summary of Environmental Monitoring Program (Spring 2010)
LocationLeachate
Collection Chamber
Shallow Monitoring Well
Intermediate Monitoring Well
Deep Monitoring
Well
Parameter List*
M35 AM39 A
M5 (1/2/3) AM6 (1/3) A
M6-2 A, EM45 (2/3) AM46 (1/2) A
OW1 AOW4 A
OW55 (d/i) AOW55-s A
OW56 (d/i) AOW56-s AM103 A, B, EM104 A, B, E
CD
LocationLeachate Monitor
Shallow Monitoring Well
Intermediate Monitoring Well
Deep Monitoring
Well
Parameter List
M19 AM23 A
M47-3 M47 (1/2) AM50 (1/2) A, B, E
M50-3 AM51 (1/2) A, B, E
M51-3 AM52 (1/2) A, B, E
M52-3 AM96 A, B, E
LocationLeachate Monitor
Shallow Monitoring Well
Intermediate Monitoring Well
Deep Monitoring
Well
Parameter List
M12 AM14 A
M53-4 M53 (2/3) AM9 (2/3) A
M9R-1 A, EM10 (1/2/3) A
M43-3 AM49 (1/3) A
M49-2 A, B, EM97 A, B, E
OW54 (d/i) A, B, EOW54-s AOW57 A
2054 (Open BH) A, B, E2055 A, B, E
CD
LocationLeachate Monitor
Shallow Monitoring Well
Intermediate Monitoring Well
Deep Monitoring
Well
Parameter List
M28 AM29 A
M42-3 AM58-4 M58 (2/3) A
M3A (1/2/3) AM4 (1/3) A
M4-2 A, EM48 (2/3) A
M98 A, B, EM99-2 M99-1 A, B, EM100 A, B, EM101 A, B, EM102 A, B, E
LocationParameter
ListMarysville
CreekS3 S7 SW
Beechwood Ditch
S4R S8R** SW
* Refer to Table 2a for Parameter Lists (Spring 2010)
** Location S8R is located in a drainage swale exiting the southwest
portion of the site that feeds into Beechwood Ditch
S5
S2
Surface Water StationUpstream from Landfill
Surface Water StationDownstream from Landfill
Wes
t o
f La
ndfil
lEa
st o
f La
ndfil
lSo
uth
of
Land
fill
South Chamber
No
rth
of
Land
fill
North Chamber
Page 1 / 1

Table 1b: Summary of Environmental Monitoring Program (Fall 2010)
Parameter Suite **
Groundwater Elevations
Groundwater Inorganic & General
Groundwater Elevations
Groundwater Inorganic & General
S5, S4R and S8RSurface Water Inorganic and
General
S2 and S3Surface Water Inorganic and
General
% methaneby volume
1097 Beechwood Road 1206 Beechwood Road1121 Beechwood Road 1250 Beechwood Road1144 Beechwood Road 1252 Beechwood Road1181 Beechwood Road 1264 Beechwood Road
* M105 and M106: new monitors (unavailable at the time of fall 2010 semi-annual sampling event)
M29, M39, M41, M53-4, M54-4, M58-4, M66-2, M67-2, M68-4, M70-3, M80-2, M81, M87-2, M96, M97, M99-2, M101, M102, M103, OW37-s
M12, M14, M15, M16, M18, M19, M23, M27, M28, M29, M30, M31, M35, M38, M39, M41, M47-3, M53-4, M54-4, M58-4, M60-4, M66-2, M67-2, M68-4, M70-3, M77, M80-2, M81, M87-2, M88-2, M89-2, M96, M97, M98, M99-2, M100, M101, M102, M103, OW37-s, OW57
Monitoring Locations
Shallow Groundwater Flow Zone Monitors
Intermediate Bedrock Groundwater Flow Zone Monitors
M5-3, M6-3, M9-3, M10-1, M49-1, M56-2, M57, M58-3, M59-2, M59-3, M59-4, M70-1, M71, M72, M74, M75, M80-1, M82-1, M82-2, M91-1, M95-1, M105*, M106*, OW54-d
M3A-3, M9-3, M10-1, M49-1, M50-3, M56-2, M57, M58-3, M59-2, M59-3, M59-4, M60-1, M63-2, M64-2, M70-1, M71, M72, M73, M74, M80-1, M82-1, M82-2, M91-1, M95-1, M105*, M106*, OW54-i, OW54-d
Beechwood Ditch
Marysville Creek
Surface Water Sampling Locations
Landfill Gas Monitoring Wells
Groundwater Inorganic & General,
VOCs
GM1, GM2, GM3, GM4-1, GM4-2, GM5, GM6
Off-site Domestic Water Supply Wells
Page 1 / 1
M105 and M106: new monitors (unavailable at the time of fall 2010 semi annual sampling event)
** Refer to Table 2b for Parameter Suites (Fall 2010)
Page 1 / 1

Table 2a: Analytical Parameters for Groundwater and Leachate Samples (Spring 2010)
Parameter List
General Chemistry
Major Ions Metals NutrientsVolatile Organic
Compounds (VOCs)Polycyclic Aromatic
Hydrocarbons (PAHs)Other
pH Alkalinity Aluminum Nitrate Benzene MercuryConductivity Chloride Cadmium Nitrite Toluene Phenols
Hardness Sodium Chromium TOC EthylbenzeneIon Balance Sulphate Copper COD Xylenes
Calcium Iron BODMagnesium Silver AmmoniaPotassium TKN
1,1-Dichloroethylene Naphthalene1,1-Dichloroethane Acenaphthylene
1,1,1-Trichloroethane AcenaphtheneTetrachloroethylene Fluorene 1,4-Dichlorobenzene Anthracene
PhenanthreneFluoranthene
PyreneBenzo[a]anthracene
ChryseneBenzo[b]fluorantheneBenzo[k]fluoranthene
Benzo[a]pyreneIndeno[1,2,3,cd]pyreneDibenzo[a,h]anthracene
Benzo[g,h,i]perylenepH Alkalinity Arsenic Ammonia Benzene Naphthalene Mercury
Hardness Cadmium DOC Toluene Acenaphthylene PhenolsCobalt Nitrate Ethylbenzene Acenaphthene
Chromium Nitrite Xylenes FluoreneCopper TKN List E Anthracene
Molybdenum PhenanthreneNickel FluorantheneLead Pyrene
Selenium Benzo[a]anthraceneZinc Chrysene
Benzo[b]fluorantheneBenzo[k]fluoranthene
Benzo[a]pyreneIndeno[1,2,3,cd]pyreneDibenzo[a,h]anthracene
Benzo[g,h,i]peryleneConductivity Calcium Silver BOD
Sodium AluminumMagnesium Boron
Total Phosphorus BariumHydrogen Sulfide Beryllium
Sulphate ManganeseIron
AcetoneBenzene
BromodichloromethaneBromoform
BromomethaneCarbon Tetrachloride
ChlorobenzeneChloroform
Dibromochloromethane1,2-Dichlorobenzene1.3-Dichlorobenzene1,4-Dichlorobenzene1,1-Dichloroethane1,2-Dichloroethane
1,1-Dichloroethylenecis-1,2-Dichloroethylene
trans-1,2-Dichloroethylene1,2-Dichloropropane
cis-1,3-Dichloropropenetrans-1,3-Dichloropropene
EthylbenzeneEthylene DibromideMethylene Chloride
Methyl Isobutyl KetoneMethyl Ethyl Ketone
Methyl t-butyl ether (MTBE)Styrene
1,1,1,2-Tetrachloroethane1,1,2,2-Tetrachloroethane
TetrachloroethyleneToluene
1,1,1-Trichloroethane1,1,2-Trichloroethane
TrichloroethyleneVinyl Chloridep+m-Xylene
o-XyleneXylene (Total)
pH Alkalinity Arsenic Total Ammonia
Benzene Cyanide
Conductivity Chloride Barium Nitrate Toluene MercuryIon Balance Sodium Boron Nitrite Ethylbenzene Phenols
Sulphate Cadmium TKN Xylenes TurbidityPotassium Chromium Colour
Cobalt TemperatureCopper BOD TSS
Iron COD TDSLeadZinc
List
SW
(Su
rfac
e W
ater
)
Purgeable Hydrocarbons
Total Trihalomethanes
Un-iodized Ammonia
Total Phosphorus
List
ALi
st B
List
CLi
st D
List
E (
USE
PA 6
24)
Page 1 / 1

Table 2b. Analytical Parameters for Water and Leachate Samples (Fall 2010)
Alkalinity Conductivity Nitrite Ammonia (total) Copper pHArsenic Dissolved organic carbon PhenolsBarium Hardness Phosphorus (total)Biological oxygen demand Iron PotassiumBoron Lead SodiumCadmium Magnesium SulphateCalcium Manganese Total dissolved solidsChemical oxygen demand Mercury Total Kjeldahl NitrogenChloride Naphthalene ZincChromium (total) Nitrate
Alkalinity Cyanide (free) Total dissolved solidsAmmonia (total) Hardness Total kjeldahl nitrogenArsenic Iron Total phosphorusBarium Lead Total suspended solidsBiological oxygen demand Magnesium ZincBoron MercuryCadmium NaphthaleneCalcium Nitrate Field measured:Chemical oxygen demand Nitrite conductivityChloride Phenols dissolved oxygenChromium (total) Potassium estimated flow rateConductivity Sodium pHCopper Sulphate temperature
1,1,1,2-Tetrachloroethane Benzene m&p-Xylene1,1,1-Trichloroethane Bromodichloromethane o-Xylene1,1,2,2-Tetrachloroethane Bromoform Styrene1,1,2-Trichloroethane Bromomethane Toluene1,1-Dichloroethane Carbon tetrachloride Trans-1,2-Dichloroethylene1,1-Dichloroethylene Chlorobenzene Trans-1,3-Dichloropropylene1,2-Dibromoethane Chloroethane Tetrachloroethylene1,2-Dichlorobenzene Chloroform Trichloroethylene1,2-Dichloroethane Chloromethane Trichlorofluoromethane1,2-Dichloropropane Cis-1,2-Dichloroethylene Vinyl chloride1,3,5-Trimethylbenzene Cis-1,3-Dichloropropylene1 3-Dichlorobenzene
Volatile Organic Compounds (VOCs)
Groundwater Inorganic and General Parameters
Surface Water Inorganic and General Parameters
Dichloromethane (methylene chloride)
Page 1 /1
1,3-Dichlorobenzene1,4-Dichlorobenzene Ethylbenzene
Dichloromethane (methylene chloride)
Page 1 /1

Table 3a: Groundwater Elevation Monitoring Locations (Spring 2010)
Page 1 /1Page 1 /1
M4 1 M55 4 M70 2 OW37
Monitoring Well
Monitoring Well
Monitoring Well
Monitoring Well
2054 M48-1 M61-1 M842055 M48-2 M61-2 M85M100 M48-3 M61-3 M86M101 M49-1 M61-4 M87-1
M10-1 M49-2 M6-2 M87-2M102 M49-3 M62-1 M88-1M10-2 M50-1 M62-2 M88-2M103 M50-2 M62-3 M89-1M10-3 M50-3 M62-4 M89-2M104 M5-1 M6-3 M90-1M12 M51-1 M63-1 M90-2M14 M51-2 M63-2 M9-1M15 M51-3 M64-1 M91-1M16 M5-2 M64-2 M91-2M18 M52-1 M65-1 M9-2M19 M52-2 M65-2 M93M23 M52-3 M66-1 M9-3M27 M5-3 M66-2 M94-1M28 M53-1 M67-1 M94-2M29 M53-2 M67-2 M95-1M30 M53-3 M68-1 M95-2M31 M53-4 M68-2 M96M35 M54-1 M68-3 M97M38 M54-2 M68-4 M98M39 M54-3 M69-1 M99-2
M3A-1 M54-4 M69-2 M9R-1M3A-2 M55-1 M69-3 OW1M3A-3 M55-2 M69-4 OW36M41 M55-3 M70-1 OW37-d
M4 1 - M55 4- M70 2- OW37-sM4-2 M56-1 M70-3 OW4M42-1 M56-2 M71 OW5M42-2 M57 M72 OW54-dM42-3 M58-1 M73 OW54-iM4-3 M58-2 M74 OW54-sM43-1 M58-3 M75 OW55-dM43-2 M58-4 M76 OW55-iM43-3 M59-1 M77 OW55-sM45-1 M59-2 M78 OW56-dM45-2 M59-3 M79 OW56-iM45-3 M59-4 M80-1 OW56-sM46-1 M60-1 M80-2 OW57M46-2 M60-2 M81 PW1M47-1 M60-3 M82-1 PW2M47-2 M60-4 M82-2M47-3 M6-1 M83

Table 3b. Groundwater Elevation Monitoring Locations (Fall 2010)
Location
M27 M58-4 M98 M3A-3 M59-4 M82-1 M28 M67-2 M99-2 M56-2 M72 M82-2 M29 M87-2 M100 M58-3 M73 M91-1 M30 M88-2 M101 M59-2 M74 M95-1 M31 M89-2 M102 M59-3 M38 M97 OW37-sM35 M66-2 M60-1 M39 M103
M60-4M12 M18 M80-2 M9-3 M64-2 M105* M14 M41 M81 M10-1 M71 M106* M15 M53-4 OW57 M49-1 M80-1 M16 M54-4 M57 OW54-i
M63-2 OW54-dM19 M68-4 M96 M50-3 M23 M70-3 M70-1
M47-3 M77* M105 and M106: new monitors (unavailable at the time of fall 2010 semi-annual sampling event)
Southof landfill footprint
Shallow Groundwater Flow Zone
Intermediate Groundwater Flow Zone
Eastof landfill footprint
Westof landfill footprint
Northof landfill footprint
Page 1 / 1Page 1 / 1

Table 4: Leachate Chemistry Results (Spring 2010)
North Chamber
South Chamber
4-May-10 4-May-101,1,1,2-Tetrachloroethane mg/L < 0.001 < 0.0011,1,1-Trichloroethane mg/L < 0.001 < 0.0011,1,2,2-Tetrachloroethane mg/L < 0.002 < 0.0021,1,2-Trichloroethane mg/L < 0.002 < 0.0021,1-Dichloroethane mg/L 0.002 0.0011,1-Dichloroethylene mg/L < 0.001 < 0.0011,2-Dibromoethane mg/L < 0.002 < 0.0021,2-Dichlorobenzene (o) mg/L < 0.002 < 0.0021,2-Dichloroethane mg/L < 0.002 < 0.0021,2-Dichloropropane mg/L < 0.001 < 0.0011,3-Dichlorobenzene (m) mg/L < 0.002 < 0.0021,4-Dichlorobenzene (p) mg/L 0.009 0.011Acenaphthene mg/L 0.00071 0.0094Acenaphthylene mg/L < 0.00005 < 0.0005Acetone mg/L 0.2 0.55Alkalinity mg/L 5470 7930Aluminum mg/L 0.28 0.4Ammonia mg/L 861 1560Anthracene mg/L 0.00021 0.0051Arsenic mg/L 0.02 0.052Barium mg/L 0.35 0.32Benzene mg/L < 0.001 0.006Benzo(a)anthracene mg/L 0.00006 0.001Benzo(a)pyrene mg/L 0.00002 0.0003Benzo(b)fluoranthene mg/L < 0.00005 < 0.0005Benzo(g,h,i)perylene mg/L < 0.0001 < 0.001Benzo(k)fluoranthene mg/L < 0.00005 < 0.0005Beryllium mg/L < 0.006 < 0.006Biochemical Oxygen Demand mg/L 210 400
Constituent Units
Biochemical Oxygen Demand mg/L 210 400Boron mg/L 7.8 12Bromodichloromethane mg/L < 0.001 < 0.001Bromoform mg/L < 0.002 < 0.002Bromomethane mg/L < 0.005 < 0.005Cadmium mg/L 0.0002 < 0.001Calcium mg/L 160 51Carbon Tetrachloride mg/L < 0.001 < 0.001Chloride mg/L 1700 2600Chlorobenzene mg/L < 0.001 < 0.001Chlorodibromomethane mg/L < 0.002 < 0.002Chloroform mg/L < 0.001 < 0.001Chromium mg/L 0.14 0.29Chrysene mg/L < 0.00005 0.0008Cis-1,2-Dichloroethylene mg/L < 0.001 < 0.001Cis-1,3-Dichloropropylene mg/L < 0.002 < 0.002Cobalt mg/L 0.043 0.071Conductivity μS/cm 14900 22600Copper mg/L 0.004 < 0.02Dibenzo(a,h)anthracene mg/L < 0.0001 < 0.001Dichloromethane mg/L < 0.005 < 0.005Dissolved Organic Carbon mg/L 481 895Ethylbenzene mg/L < 0.001 < 0.001Fluoranthene mg/L 0.00023 0.0066Fluorene mg/L 0.00063 0.01Hardness mg/L 1000 690Indeno(1,2,3-cd)pyrene mg/L < 0.0001 < 0.001
Page 1 / 2

Table 4: Leachate Chemistry Results (Spring 2010)
North Chamber
South Chamber
4-May-10 4-May-10Constituent Units
Iron mg/L 12 4.6Lead mg/L 0.0056 < 0.005m+p-Xylene mg/L 0.055 0.045Magnesium mg/L 160 130Manganese mg/L 0.55 0.17Mercury mg/L < 0.0002 < 0.0002Methyl Ethyl Ketone mg/L 0.19 0.29Methyl Isobutyl Ketone mg/L < 0.05 < 0.05Methyl Tert Butyl Ether mg/L 0.002 0.003Molybdenum mg/L 0.008 < 0.02Naphthalene mg/L 0.0059 0.028Nickel mg/L 0.19 0.36Nitrate mg/L < 1 < 1Nitrite mg/L 0.1 0.1o-Xylene mg/L 0.011 0.038pH (Lab) unitless 7.6 7.8Phenanthrene mg/L 0.00085 0.024Phenols mg/L 0.153 0.53Phosphorus (total) mg/L 6.6 14Potassium mg/L 460 610Pyrene mg/L 0.0002 0.0043Selenium mg/L < 0.005 < 0.05Silver mg/L < 0.001 < 0.001Sodium mg/L 1600 2300Styrene mg/L < 0.002 < 0.002Sulphate mg/L 5 64Sulphide mg/L 0.29 10Tetrachloroethylene mg/L < 0.001 < 0.001Toluene mg/L < 0 002 0 014Toluene mg/L < 0.002 0.014Total Kjeldahl Nitrogen mg/L 960 1800Total Trihalomethanes mg/L < 0.002 < 0.002Total Xylenes mg/L 0.066 0.083TPH (F1 C6-C10 - BTEX) mg/L < 0.1 < 0.1TPH (F1 C6-C10) mg/L 0.24 0.24Trans-1,2-dichloroethylene mg/L < 0.001 < 0.001Trans-1,3-dichloropropene mg/L < 0.002 < 0.002Trichloroethylene mg/L < 0.001 < 0.001Vinyl Chloride mg/L < 0.002 < 0.002Zinc mg/L 0.064 < 0.1
Page 2 / 2

Table 5a: Groundwater Elevations (April 28, 2010)
Page 1 / 1Page 1 / 1
M4 1 95 68 M55 4 121 28 M70 2 122 46 OW37 122 07
Monitoring Well
Water Level (masl)
Monitoring Well
Water Level (masl)
Monitoring Well
Water Level (masl)
Monitoring Well
Water Level (masl)
2054 124.66 M48-1 122.61 M61-1 124.47 M84 121.892055 122.02 M48-2 122.85 M61-2 107.27 M85 122.80M100 125.02 M48-3 122.85 M61-3 124.71 M86 123.13M101 124.19 M49-1 121.74 M61-4 125.61 M87-1 125.43
M10-1 121.82 M49-2 122.53 M6-2 109.93 M87-2 124.18M102 124.07 M49-3 119.58 M62-1 126.20 M88-1 125.90M10-2 122.27 M50-1 123.48 M62-2 126.35 M88-2 128.23M103 123.67 M50-2 123.61 M62-3 125.73 M89-1 112.02M10-3 122.08 M50-3 124.49 M62-4 126.02 M89-2 129.26M104 123.32 M5-1 120.61 M6-3 123.47 M90-1 124.65M12 125.32 M51-1 109.13 M63-1 121.80 M90-2 125.68M14 126.51 M51-2 124.88 M63-2 121.13 M9-1 125.49M15 124.75 M51-3 125.48 M64-1 113.34 M91-1 122.97M16 124.09 M5-2 122.94 M64-2 118.88 M91-2 123.81M18 127.10 M52-1 115.57 M65-1 122.26 M9-2 122.16M19 128.32 M52-2 122.77 M65-2 123.07 M93 124.72M23 127.16 M52-3 124.41 M66-1 121.78 M9-3 122.47M27 126.14 M5-3 122.76 M66-2 123.08 M94-1 124.08M28 125.98 M53-1 121.87 M67-1 122.67 M94-2 123.60M29 123.42 M53-2 121.71 M67-2 122.70 M95-1 122.83M30 124.20 M53-3 122.47 M68-1 124.46 M95-2 123.23M31 124.37 M53-4 124.74 M68-2 124.38 M96 128.78M35 124.08 M54-1 123.88 M68-3 124.14 M97 125.27M38 125.01 M54-2 124.05 M68-4 124.07 M98 129.75M39 123.64 M54-3 124.12 M69-1 125.17 M99-2 130.04
M3A-1 118.86 M54-4 124.06 M69-2 125.62 M9R-1 119.57M3A-2 101.98 M55-1 125.12 M69-3 125.62 OW1 122.83M3A-3 124.95 M55-2 122.34 M69-4 125.41 OW36 122.71M41 125.02 M55-3 113.51 M70-1 121.21 OW37-d 123.02
M4 1 - 95 68. M55 4- 121 28. M70 2- 122 46. OW37 s-s 122 07.M4-2 102.45 M56-1 108.84 M70-3 127.17 OW4 123.61M42-1 75.59 M56-2 122.95 M71 122.12 OW5 123.76M42-2 120.52 M57 122.78 M72 122.76 OW54-d 121.85M42-3 123.04 M58-1 122.88 M73 122.82 OW54-i 121.88M4-3 123.24 M58-2 103.93 M74 123.78 OW54-s 124.12M43-1 121.20 M58-3 122.97 M75 123.09 OW55-d 122.23M43-2 120.35 M58-4 124.70 M76 124.43 OW55-i 122.87M43-3 121.71 M59-1 124.38 M77 126.04 OW55-s 122.85M45-1 118.07 M59-2 122.98 M78 124.35 OW56-d 123.04M45-2 118.01 M59-3 122.95 M79 125.53 OW56-i 123.04M45-3 120.68 M59-4 122.95 M80-1 123.01 OW56-s 122.33M46-1 108.96 M60-1 122.94 M80-2 123.30 OW57 129.54M46-2 123.07 M60-2 123.74 M81 124.23 PW1 121.82M47-1 123.88 M60-3 124.33 M82-1 122.86 PW2 123.18M47-2 124.36 M60-4 124.23 M82-2 122.75M47-3 124.69 M6-1 109.05 M83 123.28

Table 5b: Groundwater Elevations (October 25, 2010)
Monitoring Well
Water Level (masl)
Monitoring Well
Water Level (masl)
Monitoring Well
Water Level (masl)
Monitoring Well
Water Level (masl)
M12 125.10 M31 DRY M67-2 122.38 M98 129.67M14 125.82 M35 124.18 M68-4 124.18 M99-2 129.56M15 DRY M38 124.67 M70-3 127.25 M100 124.61M16 124.11 M39 123.02 M77 124.48 M101 124.14M18 126.49 M41 125.30 M80-2 123.46 M102 124.06M19 126.59 M47-3 124.52 M81 124.33 M103 122.76M23 125.56 M53-4 124.75 M87-2 123.26 OW37-s 122.15M27 126.08 M54-4 124.08 M88-2 127.03 OW57 129.33M28 126.53 M58-4 123.89 M89-2 128.92M29 122.98 M60-4 124.32 M96 127.53M30 124.17 M66-2 123.25 M97 123.88
M3A-3 124.72 M58-3 123.11 M70-1 119.95 M82-2 122.93M9-3 120.57 M59-2 123.14 M71 120.51 M91-1 123.06M10-1 120.39 M59-3 123.13 M72 122.92 M95-1 122.98M49-1 120.11 M59-4 123.13 M73 122.98 OW54-d 119.98M50-3 124.39 M60-1 122.36 M74 123.73 OW54-i 119.98M56-2 123.10 M63-2 121.22 M80-1 123.15M57 120.29 M64-2 118.55 M82-1 122.86
Shallow Groundwater Flow Zone
Intermediate Bedrock Groundwater Flow Zone
Page 1 / 1Page 1 / 1

Table 6a: Groundwater Quality Results (May 3-6, 2010)
Name 1,1,
1,2-
Tet
rach
loro
etha
ne m
g/L
1,1,
1-T
rich
loro
etha
ne m
g/L
1,1,
2,2-
Tet
rach
loro
etha
ne m
g/L
1,1,
2-T
rich
loro
etha
ne m
g/L
1,1-
Dic
hlo
roet
hane
mg/
L
1,1-
Dic
hlo
roet
hyle
ne m
g/L
1,2-
Dib
rom
oet
hane
mg/
L
1,2-
Dic
hlo
robe
nzen
e (o
) m
g/L
1,2-
Dic
hlo
roet
hane
mg/
L
1,2-
Dic
hlo
ropr
opa
ne m
g/L
1,3-
Dic
hlo
robe
nzen
e (m
) m
g/L
1,4-
Dic
hlo
robe
nzen
e (p
) m
g/L
Ace
naph
then
e m
g/L
Ace
naph
thyl
ene
mg/
L
Ace
tone
mg/
L
Alk
alin
ity
mg/
L
Alu
min
um m
g/L
Am
mo
nia
mg/
L
Ant
hrac
ene
mg/
L
Ben
zene
mg/
L
Ben
zo(a
)ant
hrac
ene
mg/
L
Ben
zo(a
)pyr
ene
mg/
L
Ben
zo(b
)flu
ora
nthe
ne m
g/L
Ben
zo(g
,h,i)
per
ylen
e m
g/L
Ben
zo(k
)flu
ora
nthe
ne m
g/L
Bio
chem
ical
Oxy
gen
Dem
and
mg/
L
Bro
mo
dich
loro
met
hane
mg/
L
2054 < 0.0001 < 0.0001 < 0.0002 < 0.0002 < 0.0001 < 0.0001 < 0.0002 < 0.0002 < 0.0002 < 0.0001 < 0.0002 < 0.0002 < 0.00005 < 0.00005 < 0.01 178 < 0.02 2.24 < 0.00005 0.0003 < 0.00005 < 0.00001 < 0.00005 < 0.0001 < 0.00005 5 < 0.00012055 < 0.001 < 0.001 < 0.002 < 0.002 0.002 < 0.001 < 0.002 < 0.002 < 0.003 < 0.001 < 0.002 < 0.002 < 0.00005 < 0.00005 < 0.1 121 < 0.8 22 0.00005 0.061 0.00014 0.0001 0.00012 < 0.0001 < 0.00005 3 < 0.001M3A-1 300 < 0.02 0.5 0.0003 3M3A-3 196 0.029 0.49 0.0003 4M4-3 339 < 0.02 0.59 0.0009 10M5-1 404 < 0.02 0.73 0.0039 4M5-2 405 < 0.02 0.99 0.039 120M5-3 432 < 0.02 1.14 < 0.0001 23M6-1 191 < 0.2 15.5 0.11 8M6-2 < 0.005 < 0.005 < 0.01 < 0.01 < 0.005 < 0.005 < 0.01 < 0.01 < 0.01 < 0.005 < 0.01 < 0.01 < 0.5 67 < 0.2 17.1 0.31 26 < 0.005M6-3 1950 0.049 8.16 0.002 13M9-2 630 < 0.02 0.64 < 0.0001 3M9-3 255 < 0.02 1 0.0005 3M9R-1 < 0.003 < 0.003 < 0.005 < 0.005 < 0.003 < 0.003 < 0.005 < 0.005 < 0.007 < 0.003 < 0.005 < 0.005 < 0.3 211 < 0.8 15 0.12 5 < 0.003M10-1 422 < 0.02 0.49 0.0003 < 2M10-2 402 < 0.02 1.06 0.0002 < 2M10-3 321 < 0.02 1.1 < 0.0001 3M12 259 < 0.02 < 0.15 < 0.0001 < 2M14 303 < 0.02 < 0.15 < 0.0001 < 2M19 311 < 0.02 < 0.15 < 0.0001 < 2M28 260 < 0.02 < 0.15 < 0.0001 < 2M35 503 < 0.02 < 0.15 < 0.0001 < 2M39 562 < 0.02 < 0.15 < 0.0001 < 2M42-3 153 0.063 3.74 0.001 29M43-3 520 < 0.2 1.33 0.0003 5M45-2 28 < 2 30.2 0.024 < 2M45-3 42 < 0.02 30.9 0.11 < 2M46-2 484 < 0.02 0.94 < 0.0001 8M47-1 283 < 0.2 3.29 0.031 23M47-2 489 < 0.02 1.58 0.0004 7M47-3 188 < 0.02 < 0.15 < 0.0001 < 2M48-2 281 < 0.02 0.41 0.0013 6M48-3 195 < 0.02 0.45 0.0015 < 2M49-1 368 0.031 0.55 < 0.0001 < 2M49-2 < 0.0005 < 0.0005 < 0.001 < 0.001 < 0.0005 < 0.0005 < 0.001 < 0.001 < 0.001 < 0.0005 < 0.001 < 0.001 < 0.00005 < 0.00005 < 0.05 643 < 0.02 1.22 < 0.00005 0.0008 < 0.00005 < 0.00001 < 0.00005 < 0.0001 < 0.00005 40 < 0.0005
Page 1 / 6

Table 6a: Groundwater Quality Results (May 3-6, 2010)
Name 1,1,
1,2-
Tet
rach
loro
etha
ne m
g/L
1,1,
1-T
rich
loro
etha
ne m
g/L
1,1,
2,2-
Tet
rach
loro
etha
ne m
g/L
1,1,
2-T
rich
loro
etha
ne m
g/L
1,1-
Dic
hlo
roet
hane
mg/
L
1,1-
Dic
hlo
roet
hyle
ne m
g/L
1,2-
Dib
rom
oet
hane
mg/
L
1,2-
Dic
hlo
robe
nzen
e (o
) m
g/L
1,2-
Dic
hlo
roet
hane
mg/
L
1,2-
Dic
hlo
ropr
opa
ne m
g/L
1,3-
Dic
hlo
robe
nzen
e (m
) m
g/L
1,4-
Dic
hlo
robe
nzen
e (p
) m
g/L
Ace
naph
then
e m
g/L
Ace
naph
thyl
ene
mg/
L
Ace
tone
mg/
L
Alk
alin
ity
mg/
L
Alu
min
um m
g/L
Am
mo
nia
mg/
L
Ant
hrac
ene
mg/
L
Ben
zene
mg/
L
Ben
zo(a
)ant
hrac
ene
mg/
L
Ben
zo(a
)pyr
ene
mg/
L
Ben
zo(b
)flu
ora
nthe
ne m
g/L
Ben
zo(g
,h,i)
per
ylen
e m
g/L
Ben
zo(k
)flu
ora
nthe
ne m
g/L
Bio
chem
ical
Oxy
gen
Dem
and
mg/
L
Bro
mo
dich
loro
met
hane
mg/
L
M49-3 467 < 0.02 < 0.15 < 0.0001 < 2M50-1 < 0.005 < 0.005 < 0.01 < 0.01 < 0.005 < 0.005 < 0.01 < 0.01 < 0.01 < 0.005 < 0.01 < 0.01 < 0.00005 < 0.00005 < 0.5 326 < 0.2 9.15 < 0.00005 0.29 < 0.00005 < 0.00001 < 0.00005 < 0.0001 < 0.00005 < 2 < 0.005M50-3 228 < 0.2 9.46 0.0005 28M51-1 < 0.003 < 0.003 < 0.005 < 0.005 < 0.003 < 0.003 < 0.005 < 0.005 < 0.006 < 0.003 < 0.005 < 0.005 < 0.00005 < 0.00005 < 0.3 44 < 2 31.3 < 0.00005 0.13 < 0.00005 < 0.00001 < 0.00005 < 0.0001 < 0.00005 5 < 0.003M51-2 < 0.0001 < 0.0001 < 0.0002 < 0.0002 < 0.0001 < 0.0001 < 0.0002 < 0.0002 < 0.0002 < 0.0001 < 0.0002 < 0.0002 < 0.00005 < 0.00005 < 0.02 473 < 0.02 0.93 < 0.00005 0.0002 < 0.00005 < 0.00001 < 0.00005 < 0.0001 < 0.00005 18 < 0.0001M51 2 < 0.0001 < 0.0001 < 0.0002 < 0.0002 < 0.0001 < 0.0001 < 0.0002 < 0.0002 < 0.0002 < 0.0001 < 0.0002 < 0.0002 < 0.00005 < 0.00005 < 0.02 473 < 0.02 0.93 < 0.00005 0.0002 < 0.00005 < 0.00001 < 0.00005 < 0.0001 < 0.00005 18 < 0.0001M51-3 512 < 0.02 0.67 0.0001 3M52-1 < 0.0002 < 0.0002 < 0.0004 < 0.0004 < 0.0002 < 0.0002 < 0.0004 < 0.0004 < 0.0007 < 0.0002 < 0.0004 < 0.0004 < 0.00005 < 0.00005 < 0.1 413 < 0.02 1.03 < 0.00005 0.015 < 0.00005 < 0.00001 < 0.00005 < 0.0001 < 0.00005 23 < 0.0002M52-2 < 0.0001 < 0.0001 < 0.0002 < 0.0002 < 0.0001 < 0.0001 < 0.0002 < 0.0002 < 0.0002 < 0.0001 < 0.0002 < 0.0002 < 0.00005 < 0.00005 < 0.01 376 < 0.02 1.14 < 0.00005 0.0001 < 0.00005 < 0.00001 < 0.00005 < 0.0001 < 0.00005 15 < 0.0001M52-3 589 < 0.02 1.19 0.009 3M53-2 377 < 0.02 0.48 < 0.0001 < 2M53-3 402 < 0.02 0.9 < 0.0001 < 2M53-4 318 < 0.02 < 0.15 < 0.0001 < 2M58-2 457 < 0.02 0.43 < 0.0001 2M58-3 271 < 0.02 < 0.15 < 0.0001 < 2M96 < 0.0001 < 0.0001 < 0.0002 < 0.0002 < 0.0001 < 0.0001 < 0.0002 < 0.0002 < 0.0002 < 0.0001 < 0.0002 < 0.0002 < 0.00005 < 0.00005 < 0.01 315 < 0.02 < 0.15 < 0.00005 < 0.0001 < 0.00005 < 0.00001 < 0.00005 < 0.0001 < 0.00005 < 2 < 0.0001M97 < 0.0001 < 0.0001 < 0.0002 < 0.0002 < 0.0001 < 0.0001 < 0.0002 < 0.0002 < 0.0002 < 0.0001 < 0.0002 < 0.0002 < 0.00005 < 0.00005 < 0.01 207 < 0.02 < 0.15 < 0.00005 < 0.0001 < 0.00005 < 0.00001 < 0.00005 < 0.0001 < 0.00005 < 2 < 0.0001M98 < 0.0001 < 0.0001 < 0.0002 < 0.0002 < 0.0001 < 0.0001 < 0.0002 < 0.0002 < 0.0002 < 0.0001 < 0.0002 < 0.0002 < 0.00005 < 0.00005 < 0.01 379 < 0.02 < 0.15 < 0.00005 < 0.0001 < 0.00005 < 0.00001 < 0.00005 < 0.0001 < 0.00005 < 2 < 0.0001M99-2 < 0.0001 < 0.0001 < 0.0002 < 0.0002 < 0.0001 < 0.0001 < 0.0002 < 0.0002 < 0.0002 < 0.0001 < 0.0002 < 0.0002 < 0.00005 < 0.00005 < 0.01 259 < 0.02 0.21 < 0.00005 < 0.0001 < 0.00005 < 0.00001 < 0.00005 < 0.0001 < 0.00005 < 2 < 0.0001M100 < 0.0001 < 0.0001 < 0.0002 < 0.0002 0.0002 < 0.0001 < 0.0002 < 0.0002 < 0.0002 < 0.0001 < 0.0002 < 0.0002 < 0.00005 < 0.00005 < 0.01 369 < 0.02 < 0.15 < 0.00005 < 0.0001 < 0.00005 < 0.00001 < 0.00005 < 0.0001 < 0.00005 < 2 < 0.0001M101 < 0.0001 < 0.0001 < 0.0002 < 0.0002 < 0.0001 < 0.0001 < 0.0002 < 0.0002 < 0.0002 < 0.0001 < 0.0002 < 0.0002 < 0.00005 < 0.00005 < 0.02 345 < 0.02 0.15 < 0.00005 < 0.0001 < 0.00005 < 0.00001 < 0.00005 < 0.0001 < 0.00005 < 2 < 0.0001M102 < 0.0001 < 0.0001 < 0.0002 < 0.0002 < 0.0001 < 0.0001 < 0.0002 < 0.0002 < 0.0002 < 0.0001 < 0.0002 < 0.0002 < 0.00005 < 0.00005 < 0.01 481 < 0.02 < 0.15 < 0.00005 < 0.0001 < 0.00005 < 0.00001 < 0.00005 < 0.0001 < 0.00005 < 2 < 0.0001M103 < 0.0001 < 0.0001 < 0.0002 < 0.0002 < 0.0001 < 0.0001 < 0.0002 < 0.0002 < 0.0002 < 0.0001 < 0.0002 < 0.0002 < 0.00005 < 0.00005 < 0.02 828 < 0.02 0.31 < 0.00005 < 0.0001 < 0.00005 < 0.00005 < 0.00005 < 0.0001 < 0.00005 < 2 < 0.0001M104 < 0.0001 < 0.0001 < 0.0002 < 0.0002 < 0.0001 < 0.0001 < 0.0002 < 0.0002 < 0.0002 < 0.0001 < 0.0002 < 0.0002 < 0.00005 < 0.00005 < 0.04 1380 < 0.08 0.9 < 0.00005 0.0003 < 0.00005 < 0.00001 < 0.00005 < 0.0001 < 0.00005 3 < 0.0001OW1 393 < 0.02 1.19 < 0.0002 16OW1 393 0.02 1.19 0.0002 16OW4 998 < 0.02 1.1 0.0008 8OW54-d < 0.0001 < 0.0001 < 0.0002 < 0.0002 < 0.0001 < 0.0001 < 0.0002 < 0.0002 < 0.0002 < 0.0001 < 0.0002 < 0.0002 < 0.00005 < 0.00005 < 0.01 259 < 0.02 0.99 < 0.00005 < 0.0001 < 0.00005 < 0.00001 < 0.00005 < 0.0001 < 0.00005 < 2 < 0.0001OW54-i < 0.0001 < 0.0001 < 0.0002 < 0.0002 < 0.0001 < 0.0001 < 0.0002 < 0.0002 < 0.0002 < 0.0001 < 0.0002 < 0.0002 < 0.00005 < 0.00005 < 0.01 254 < 0.02 1.03 < 0.00005 < 0.0001 < 0.00005 < 0.00001 < 0.00005 < 0.0001 < 0.00005 3 < 0.0001OW54-s 260 0.22 1.5 < 0.0001 < 2OW55-d 342 < 0.2 0.9 0.0017 < 2OW55-i 283 < 0.2 4.26 0.0016 14OW55-s 151 < 0.2 2.66 0.0002 13OW56-d 400 < 0.02 0.57 < 0.0001 5OW56-i 412 < 0.02 1.43 < 0.0001 44OW56-s 405 < 0.02 < 0.15 < 0.0001 < 2OW57 76 < 0.02 < 0.15 < 0.0001 < 2
Page 2 / 6

Table 6a: Groundwater Quality Results (May 3-6, 2010)
Name
20542055M3A-1M3A-3M4-3
Bro
mo
form
mg/
L
Bro
mo
met
hane
mg/
L
Cad
miu
m m
g/L
Cal
cium
mg/
L
Car
bon
Tet
rach
lori
de m
g/L
Che
mic
al O
xyge
n D
eman
d m
g/L
Chl
ori
de
mg/
L
Chl
oro
benz
ene
mg/
L
Chl
oro
dibr
om
om
etha
ne m
g/L
Chl
oro
form
mg/
L
Chr
om
ium
mg/
L
Chr
ysen
e m
g/L
Cis
-1,2
-Dic
hlo
roet
hyle
ne m
g/L
Cis
-1,3
-Dic
hlo
rop
rop
ylen
e m
g/L
Co
nduc
tivi
ty μ
S/cm
Co
pp
er m
g/L
Dib
enzo
(a,h
)ant
hrac
ene
mg/
L
Dic
hlo
rom
etha
ne m
g/L
Ethy
lben
zene
mg/
L
Fiel
d C
ond
ucti
vity
μS/
cm
Fluo
rant
hene
mg/
L
Fluo
rene
mg/
L
Har
dne
ss m
g/L
Ind
eno
(1,2
,3-c
d)p
yren
e m
g/L
Ioni
c B
alan
ce %
Iro
n m
g/L
m+
p-X
ylen
e m
g/L
< 0.0002 < 0.0005 < 0.0001 62 < 0.0001 4 530 < 0.0001 < 0.0002 < 0.0001 < 0.005 < 0.00005 < 0.0001 < 0.0002 2200 < 0.002 < 0.0001 < 0.0005 < 0.0001 2016 < 0.00005 < 0.00005 350 < 0.0001 3.95 0.19 < 0.0001< 0.002 < 0.005 < 0.005 5900 < 0.001 560 49000 < 0.001 < 0.002 < 0.001 < 0.3 0.0001 < 0.001 < 0.002 > 100000 < 0.1 < 0.0001 < 0.005 < 0.001 99457 0.00022 < 0.00005 30000 < 0.0001 2.85 < 5 < 0.001
< 0.0001 23 12 24 < 0.005 696 < 0.002 < 0.0001 759 130 0.83 < 0.1 < 0.0001< 0.0001 5.5 12 12 < 0.005 474 < 0.002 0.0002 505 18 7.6 < 0.1 0.0009< 0.0001 18 9 14 < 0.005 691 < 0.002 0.0003 471 130 4.89 0.27 0.0009
M5-1M5-2M5-3M6-1M6-2M6-3M9-2M9-3M9R-1M10-1 M10-2M10-3M12M14M19M28M35M39M42-3
< 0.0001 14 25 160 < 0.005 1330 < 0.002 < 0.0001 850 77 3.09 < 0.1 < 0.0001< 0.0001 21 130 210 < 0.005 1840 < 0.002 0.0012 1164 120 1.1 < 0.1 0.00310.0003 34 27 41 < 0.005 983 < 0.002 < 0.0001 595 200 3.28 < 1 < 0.0001< 0.001 2300 440 23000 < 0.05 60700 < 0.02 < 0.003 39450 12000 3.84 20 < 0.003
< 0.01 < 0.03 < 0.001 2700 < 0.005 370 23000 < 0.005 < 0.01 < 0.005 < 0.05 < 0.005 < 0.01 55300 < 0.02 < 0.03 < 0.005 40520 16000 7.58 < 1 0.016< 0.0001 920 110 960 0.016 10900 0.003 < 0.001 7980 2300 5.46 < 0.1 0.002< 0.0001 180 37 200 < 0.005 1710 < 0.002 < 0.0001 1930 660 2.01 9.6 < 0.0001< 0.0001 35 7 68 < 0.005 768 < 0.002 < 0.0001 950 190 2.06 0.15 < 0.0001
< 0.005 < 0.01 < 0.005 2500 < 0.003 390 22000 < 0.003 < 0.005 < 0.003 < 0.3 < 0.003 < 0.005 58800 < 0.1 < 0.01 < 0.003 62530 15000 4.1 6.8 < 0.003< 0.0001 110 51 67 < 0.005 1010 < 0.002 < 0.0001 1020 390 1.99 17 < 0.0001< 0.0001 23 < 4 35 < 0.005 934 < 0.002 < 0.0001 919 130 2.44 0.96 < 0.0001< 0.0001 42 < 4 23 < 0.005 677 < 0.002 < 0.0001 653 230 0.8 0.12 < 0.0001< 0.0001 100 10 22 < 0.005 625 < 0.002 < 0.0001 463 320 2.38 < 0.1 < 0.0001< 0.0001 81 5 13 < 0.005 723 < 0.002 < 0.0001 470 320 2.23 < 0.1 < 0.0001< 0.0001 100 10 31 < 0.005 880 < 0.002 < 0.0001 604 430 1.24 < 0.1 < 0.0001< 0.0001 65 6 12 < 0.005 578 < 0.002 < 0.0001 380 290 2.67 < 0.1 < 0.0001< 0.0001 34 9 39 < 0.005 1120 < 0.002 < 0.0001 707 490 2.9 < 0.1 < 0.0001< 0.0001 42 14 5 < 0.005 1140 < 0.002 < 0.0001 693 220 10.6 < 0.1 < 0.0001< 0.0001 55 17 920 < 0.005 3770 < 0.002 < 0.001 4350 140 0.83 < 0.1 0.001
M43-3M45-2M45-3M46-2M47-1M47-2M47-3M48-2M48-3M49-1M49-2
< 0.001 92 46 1700 < 0.05 6440 < 0.02 0.0001 6143 520 3.95 < 1 0.0001< 0.01 13000 1200 94000 < 0.5 > 100000 < 0.2 < 0.001 124223 58000 3.91 10 < 0.001
< 0.0001 7200 810 65000 0.022 > 100000 0.019 0.004 95162 43000 0.17 < 5 0.035< 0.0001 17 11 54 < 0.005 1130 < 0.002 < 0.0001 1250 110 3.46 0.11 < 0.0001< 0.001 650 140 6300 < 0.05 19900 < 0.02 0.001 21800 3600 4.76 3.8 0.0006
< 0.0001 26 37 500 < 0.005 2630 < 0.002 < 0.0001 2720 160 1.55 < 0.1 < 0.0001< 0.0001 2.1 22 57 < 0.005 565 < 0.002 < 0.0001 794 12 1.57 < 0.1 < 0.0001< 0.0001 6 5 34 < 0.005 751 < 0.002 < 0.0001 489 26 1.63 < 0.1 < 0.0001< 0.0001 7.3 11 100 < 0.005 780 < 0.002 < 0.0001 514 31 0.81 0.1 < 0.0001< 0.0001 7.3 12 240 < 0.005 1560 < 0.002 < 0.0001 1505 37 3.77 < 0.1 < 0.0001
< 0.001 < 0.003 < 0.0001 10 < 0.0005 31 230 < 0.0005 < 0.001 < 0.0005 < 0.005 < 0.00005 < 0.0005 < 0.001 2160 < 0.002 < 0.0001 < 0.003 < 0.0005 2244 < 0.00005 < 0.00005 62 < 0.0001 0.03 < 0.1 < 0.0005
Page 3 / 6

Table 6a: Groundwater Quality Results (May 3-6, 2010)
Name
M49-3M50-1M50-3M51-1M51-2
Bro
mo
form
mg/
L
Bro
mo
met
hane
mg/
L
Cad
miu
m m
g/L
Cal
cium
mg/
L
Car
bon
Tet
rach
lori
de m
g/L
Che
mic
al O
xyge
n D
eman
d m
g/L
Chl
ori
de
mg/
L
Chl
oro
benz
ene
mg/
L
Chl
oro
dibr
om
om
etha
ne m
g/L
Chl
oro
form
mg/
L
Chr
om
ium
mg/
L
Chr
ysen
e m
g/L
Cis
-1,2
-Dic
hlo
roet
hyle
ne m
g/L
Cis
-1,3
-Dic
hlo
rop
rop
ylen
e m
g/L
Co
nduc
tivi
ty μ
S/cm
Co
pp
er m
g/L
Dib
enzo
(a,h
)ant
hrac
ene
mg/
L
Dic
hlo
rom
etha
ne m
g/L
Ethy
lben
zene
mg/
L
Fiel
d C
ond
ucti
vity
μS/
cm
Fluo
rant
hene
mg/
L
Fluo
rene
mg/
L
Har
dne
ss m
g/L
Ind
eno
(1,2
,3-c
d)p
yren
e m
g/L
Ioni
c B
alan
ce %
Iro
n m
g/L
m+
p-X
ylen
e m
g/L
< 0.0001 41 28 36 < 0.005 2150 < 0.002 < 0.0001 2001 210 5.33 < 0.1 < 0.0001< 0.01 < 0.03 < 0.001 1300 < 0.005 360 13000 < 0.005 < 0.01 < 0.005 < 0.05 < 0.00005 < 0.005 < 0.01 34700 < 0.02 < 0.0001 < 0.03 0.007 35900 < 0.00005 < 0.00005 7100 < 0.0001 3.28 11 < 0.005
< 0.001 550 76 7000 < 0.05 20400 < 0.02 0.0003 21800 3600 3.21 1.3 0.0004< 0.005 < 0.01 < 0.01 5500 < 0.003 950 51000 < 0.003 < 0.005 < 0.003 < 0.5 < 0.00005 < 0.003 < 0.005 > 100000 < 0.2 < 0.0001 < 0.01 < 0.003 100000 < 0.00005 < 0.00005 29000 < 0.0001 4.42 < 10 < 0.003
< 0.0002 < 0.0005 < 0.0001 11 < 0.0001 7 140 < 0.0001 < 0.0002 < 0.0001 < 0.005 < 0.00005 < 0.0001 < 0.0002 1290 < 0.002 < 0.0001 < 0.0005 < 0.0001 1520 < 0.00005 < 0.00005 61 < 0.0001 3.48 0.13 < 0.0001M51 2M51-3M52-1M52-2M52-3M53-2M53-3M53-4M58-2M58-3M96M97M98M99-2M100M101M102M103M104OW1
< 0.0002 < 0.0005 < 0.0001 11 < 0.0001 7 140 < 0.0001 < 0.0002 < 0.0001 < 0.005 < 0.00005 < 0.0001 < 0.0002 1290 < 0.002 < 0.0001 < 0.0005 < 0.0001 1520 < 0.00005 < 0.00005 61 < 0.0001 3.48 0.13 < 0.0001< 0.0001 32 17 250 < 0.005 2050 < 0.002 < 0.0001 2590 150 28.1 0.12 < 0.0001
< 0.0004 < 0.001 < 0.0001 24 < 0.0002 25 180 < 0.0002 < 0.0004 < 0.0002 < 0.005 < 0.00005 < 0.0002 < 0.0004 1410 < 0.002 < 0.0001 < 0.001 0.0007 1790 < 0.00005 < 0.00005 120 < 0.0001 5.33 0.84 0.0019< 0.0002 < 0.0005 < 0.0001 17 < 0.0001 4 200 < 0.0001 < 0.0002 < 0.0001 < 0.005 < 0.00005 < 0.0001 < 0.0002 1350 < 0.002 < 0.0001 < 0.0005 < 0.0001 1490 < 0.00005 < 0.00005 92 < 0.0001 0.39 < 0.1 0.0001
< 0.0001 55 8 810 < 0.005 3800 < 0.002 < 0.0001 4770 280 5.79 0.81 < 0.0001< 0.0001 100 18 44 < 0.005 861 < 0.002 < 0.0001 864 350 2.71 16 < 0.0001< 0.0001 47 6 58 < 0.005 1230 < 0.002 < 0.0001 1173 260 2.65 0.25 < 0.0001< 0.0001 140 4 10 < 0.005 887 < 0.002 < 0.0001 624 470 5.1 < 0.1 < 0.0001< 0.0001 51 8 73 < 0.005 1560 < 0.002 < 0.0001 1303 220 0.42 0.89 < 0.0001< 0.0001 88 4 5 < 0.005 595 < 0.002 < 0.0001 429 350 7.14 < 0.1 < 0.0001
< 0.0002 < 0.0005 < 0.0001 72 < 0.0001 < 4 5 < 0.0001 < 0.0002 < 0.0001 < 0.005 < 0.00005 < 0.0001 < 0.0002 662 < 0.002 < 0.0001 < 0.0005 < 0.0001 922 < 0.00005 < 0.00005 320 < 0.0001 0.01 < 0.1 < 0.0001< 0.0002 < 0.0005 < 0.0001 32 < 0.0001 21 7 < 0.0001 < 0.0002 < 0.0001 < 0.005 < 0.00005 < 0.0001 < 0.0002 498 < 0.002 < 0.0001 < 0.0005 < 0.0001 331 < 0.00005 < 0.00005 210 < 0.0001 2.97 < 0.1 < 0.0001< 0.0002 < 0.0005 < 0.0001 100 < 0.0001 14 19 < 0.0001 < 0.0002 < 0.0001 < 0.005 < 0.00005 < 0.0001 < 0.0002 882 < 0.002 < 0.0001 < 0.0005 < 0.0001 630 < 0.00005 < 0.00005 460 < 0.0001 0.24 0.19 < 0.0001< 0.0002 < 0.0005 < 0.0001 58 < 0.0001 20 33 < 0.0001 < 0.0002 < 0.0001 < 0.005 < 0.00005 < 0.0001 < 0.0002 833 < 0.002 < 0.0001 < 0.0005 < 0.0001 929 < 0.00005 < 0.00005 390 < 0.0001 1.73 0.94 < 0.0001< 0.0002 < 0.0005 < 0.0001 120 < 0.0001 < 4 47 < 0.0001 < 0.0002 < 0.0001 < 0.005 < 0.00005 < 0.0001 < 0.0002 924 < 0.002 < 0.0001 < 0.0005 < 0.0001 629 < 0.00005 < 0.00005 480 < 0.0001 2.91 0.8 < 0.0001< 0.0002 < 0.0005 < 0.0001 150 < 0.0001 17 150 < 0.0001 < 0.0002 < 0.0001 < 0.005 < 0.00005 < 0.0001 < 0.0002 1300 < 0.002 < 0.0001 < 0.0005 < 0.0001 1480 < 0.00005 < 0.00005 600 < 0.0001 4.24 0.34 < 0.0001< 0.0002 < 0.0005 < 0.0001 160 < 0.0001 8 48 < 0.0001 < 0.0002 < 0.0001 < 0.005 < 0.00005 < 0.0001 < 0.0002 1130 < 0.002 < 0.0001 < 0.0005 < 0.0001 1290 < 0.00005 < 0.00005 550 < 0.0001 0.97 0.78 < 0.0001< 0.0002 < 0.0005 < 0.0001 140 < 0.0001 17 150 < 0.0001 < 0.0002 < 0.0001 < 0.005 < 0.00005 < 0.0001 < 0.0002 1940 < 0.002 < 0.0001 < 0.0005 < 0.0001 2200 < 0.00005 < 0.00005 770 < 0.0001 1.37 1.1 < 0.0001< 0.0002 < 0.0005 < 0.0005 130 < 0.0001 170 880 < 0.0001 < 0.0002 < 0.0001 < 0.03 < 0.00005 < 0.0001 < 0.0002 5070 < 0.01 < 0.0001 < 0.0005 < 0.0001 2996 < 0.00005 < 0.00005 880 < 0.0001 4.76 6.5 < 0.0001
< 0.0001 30 27 57 < 0.005 995 < 0.002 0.0018 666 160 20.3 < 0.1 < 0.0002OW1OW4OW54-dOW54-iOW54-sOW55-dOW55-iOW55-sOW56-dOW56-iOW56-sOW57
0.0001 30 27 57 0.005 995 0.002 0.0018 666 160 20.3 0.1 0.0002< 0.0001 170 140 540 < 0.005 3380 < 0.002 0.0097 3660 910 3.34 15 0.0005
< 0.0002 < 0.0005 < 0.0001 43 < 0.0001 < 4 71 < 0.0001 < 0.0002 < 0.0001 < 0.005 < 0.00005 < 0.0001 < 0.0002 773 < 0.002 < 0.0001 < 0.0005 < 0.0001 742 < 0.00005 < 0.00005 220 < 0.0001 0.96 < 0.1 < 0.0001< 0.0002 < 0.0005 < 0.0001 42 < 0.0001 < 4 67 < 0.0001 < 0.0002 < 0.0001 < 0.005 < 0.00005 < 0.0001 < 0.0002 773 < 0.002 < 0.0001 < 0.0005 < 0.0001 715 < 0.00005 < 0.00005 220 < 0.0001 2.44 < 0.1 < 0.0001
< 0.0001 1.8 < 4 76 < 0.005 1090 < 0.002 < 0.0001 1297 5 0.35 < 0.1 < 0.0001< 0.001 360 53 3000 < 0.05 9980 < 0.02 < 0.0001 10800 1900 0.9 < 1 < 0.0001< 0.001 260 60 2900 < 0.05 8770 < 0.02 < 0.0001 9420 1600 0.08 < 1 < 0.0001< 0.001 180 43 2600 < 0.05 7970 < 0.02 < 0.0001 8650 1200 1.93 13 < 0.0001
< 0.0001 77 < 4 270 < 0.005 1860 < 0.002 < 0.0001 2060 380 1.81 0.23 < 0.0001< 0.0001 61 6 250 < 0.005 1610 < 0.002 < 0.0001 1280 330 3.04 < 0.1 < 0.0001< 0.0001 30 8 280 < 0.005 1970 < 0.002 < 0.0001 2150 190 2.77 < 0.1 < 0.0001< 0.0001 3.7 < 4 19 < 0.005 579 < 0.002 < 0.0001 559 18 0.89 < 0.1 < 0.0001
Page 4 / 6

Table 6a: Groundwater Quality Results (May 3-6, 2010)
Name
20542055M3A-1M3A-3M4-3
Mag
nesi
um m
g/L
Mer
cury
mg/
L
Met
hyl
Ethy
l K
eto
ne m
g/L
Met
hyl
Iso
buty
l K
eto
ne m
g/L
Met
hyl
Ter
t B
utyl
Eth
er m
g/L
Nap
htha
lene
mg/
L
Nit
rate
mg/
L
Nit
rite
mg/
L
o-X
ylen
e m
g/L
pH (
Lab)
uni
tles
s
Phen
anth
rene
mg/
L
Phen
ols
mg/
L
Pota
ssiu
m m
g/L
Pyre
ne m
g/L
Silv
er m
g/L
Sodi
um m
g/L
Styr
ene
mg/
L
Sulp
hate
mg/
L
Tet
rach
loro
ethy
lene
mg/
L
To
luen
e m
g/L
To
tal
Kje
ldah
l N
itro
gen
mg/
L
To
tal
Org
anic
Car
bon
mg/
L
To
tal
Xyl
enes
mg/
L
Tra
ns-1
,2-d
ichl
oro
ethy
lene
mg/
L
Tra
ns-1
,3-d
ichl
oro
pro
pen
e m
g/L
Tri
chlo
roet
hyle
ne m
g/L
Vin
yl C
hlo
rid
e m
g/L
47 < 0.0002 < 0.005 < 0.005 < 0.0002 0.00007 < 0.1 0.01 < 0.0001 8.2 < 0.00003 < 0.004 27 < 0.00005 < 0.0004 290 < 0.0002 21 < 0.0001 < 0.0002 3.2 1.5 < 0.0001 < 0.0001 < 0.0002 < 0.0001 < 0.00023600 < 0.0002 < 0.05 < 0.05 < 0.002 0.00027 0.1 < 0.01 < 0.001 7.1 0.00024 0.03 170 0.00017 < 0.02 16000 < 0.002 130 < 0.001 < 0.002 23 3.5 < 0.001 < 0.001 < 0.002 < 0.001 < 0.002
17 < 0.0002 < 0.1 < 0.01 < 0.0001 8.2 0.011 7.8 < 0.0004 110 29 < 0.0002 < 7 1.5 < 0.00011.1 < 0.0002 < 0.1 < 0.01 0.0003 8.6 < 0.004 4.7 < 0.0004 120 28 0.0008 < 7 4 0.001221 < 0.0002 < 0.1 < 0.01 0.0005 8.2 < 0.004 44 < 0.0004 97 8 0.0008 1 1.4 0.0014
M5-1M5-2M5-3M6-1M6-2M6-3M9-2M9-3M9R-1M10-1 M10-2M10-3M12M14M19M28M35M39M42-3
9.9 < 0.0002 < 0.1 < 0.01 < 0.0001 8.3 0.016 8.5 < 0.0004 290 41 < 0.0002 < 10 2.4 < 0.000116 < 0.0002 < 0.1 < 0.01 0.0034 8.3 0.22 11 < 0.0004 380 240 0.004 < 70 1 0.006527 < 0.0002 < 0.1 < 0.01 < 0.0001 8.1 0.037 12 < 0.0004 150 26 < 0.0002 < 4 0.8 < 0.0001
1400 < 0.0002 < 0.1 < 0.01 < 0.003 7.4 < 0.004 120 < 0.004 11000 250 < 0.005 18 4 < 0.0032300 < 0.0002 < 0.3 < 0.3 < 0.01 < 0.1 < 0.01 < 0.005 9.2 0.014 220 < 0.004 9900 < 0.01 14 < 0.005 0.074 18 5.4 0.016 < 0.005 < 0.01 < 0.005 < 0.01
< 0.05 < 0.0002 < 0.1 < 0.01 < 0.001 12 0.008 86 < 0.0004 570 2 0.005 12 31.6 0.00252 < 0.0002 < 0.1 < 0.01 < 0.0001 7.6 < 0.004 6.3 < 0.0004 130 19 < 0.0002 4 11.6 < 0.000125 < 0.0002 < 0.1 < 0.01 < 0.0001 8.1 < 0.004 18 < 0.0004 84 32 < 0.0002 1.3 1.2 < 0.0001
2000 < 0.0002 < 0.1 < 0.1 < 0.005 < 0.1 < 0.01 < 0.003 7.5 < 0.004 65 < 0.02 9600 < 0.005 1000 < 0.003 < 0.005 16 4.7 < 0.003 < 0.003 < 0.005 < 0.003 < 0.00529 < 0.0002 < 0.1 < 0.01 < 0.0001 7.6 < 0.004 4.5 < 0.0004 61 20 < 0.0002 3 8.6 < 0.000117 < 0.0002 0.1 0.07 < 0.0001 8.3 < 0.004 12 < 0.0004 170 39 < 0.0002 3 2.3 < 0.000130 < 0.0002 < 0.1 < 0.01 < 0.0001 8.1 0.006 12 < 0.0004 49 8 < 0.0002 2.3 1.2 < 0.000116 < 0.0002 2 < 0.01 < 0.0001 8 < 0.004 0.48 < 0.0004 12 31 < 0.0002 < 0.7 1 < 0.000129 < 0.0002 0.8 < 0.01 < 0.0001 8 < 0.004 9 < 0.0004 20 67 < 0.0002 < 0.7 1.2 < 0.000143 < 0.0002 0.4 < 0.01 < 0.0001 8.1 < 0.004 5.8 < 0.0004 11 110 < 0.0002 < 0.7 0.8 < 0.000130 < 0.0002 0.6 0.05 < 0.0001 8.2 < 0.004 1.5 < 0.0004 5.1 34 < 0.0002 < 0.7 0.9 < 0.000198 < 0.0002 0.1 < 0.01 < 0.0001 8.2 < 0.004 0.38 < 0.0004 50 70 < 0.0002 < 0.7 1.2 < 0.000128 < 0.0002 < 0.1 < 0.01 < 0.0001 8.2 < 0.004 0.73 < 0.0004 140 70 < 0.0002 < 0.7 3.1 < 0.0001
< 0.05 < 0.0002 < 0.1 < 0.01 < 0.001 11 0.046 17 < 0.0004 690 180 < 0.002 7 1.6 0.001M43-3M45-2M45-3M46-2M47-1M47-2M47-3M48-2M48-3M49-1M49-2
70 < 0.0002 < 0.1 < 0.01 < 0.0001 8.1 < 0.004 15 < 0.004 1200 38 < 0.0002 2.5 4.4 0.00016200 < 0.0002 0.2 < 0.01 < 0.001 6.8 < 0.02 350 < 0.04 30000 680 0.006 33 3.2 < 0.0016000 < 0.0002 0.1 < 0.01 0.009 6.8 0.02 300 < 0.0004 22000 240 0.061 31 4.7 0.045
16 < 0.0002 < 0.1 < 0.01 0.0001 8.3 < 0.004 11 < 0.0004 230 30 < 0.0002 1.7 2.1 0.0001480 < 0.0002 < 0.1 < 0.01 < 0.0002 7.7 < 0.004 52 < 0.004 3000 17 0.0014 3.6 1.6 0.000623 < 0.0002 < 0.1 < 0.01 0.0001 8.4 0.045 18 < 0.0004 500 44 < 0.0002 4 1.7 0.00011.6 < 0.0002 < 0.1 < 0.01 < 0.0001 9.7 < 0.004 1.2 < 0.0004 130 13 < 0.0002 2 1.4 < 0.00012.8 < 0.0002 < 0.1 < 0.01 < 0.0001 8.4 < 0.004 4.1 < 0.0004 160 28 < 0.0002 < 1 1.1 < 0.00013 < 0.0002 < 0.1 < 0.01 < 0.0001 8.4 < 0.004 4.9 < 0.0004 150 24 0.0006 < 4 2.4 < 0.0001
4.5 < 0.0002 < 0.1 < 0.01 < 0.0001 8.5 < 0.004 6.4 < 0.0004 290 20 < 0.0002 1.8 3.6 < 0.00018.8 < 0.0002 < 0.03 < 0.03 < 0.001 0.00014 < 0.1 < 0.01 < 0.0005 8.2 0.00006 0.14 11 < 0.00005 < 0.0004 460 < 0.001 110 < 0.0005 < 0.001 18 1.9 < 0.0005 < 0.0005 < 0.001 < 0.0005 < 0.001
Page 5 / 6

Table 6a: Groundwater Quality Results (May 3-6, 2010)
Name
M49-3M50-1M50-3M51-1M51-2
Mag
nesi
um m
g/L
Mer
cury
mg/
L
Met
hyl
Ethy
l K
eto
ne m
g/L
Met
hyl
Iso
buty
l K
eto
ne m
g/L
Met
hyl
Ter
t B
utyl
Eth
er m
g/L
Nap
htha
lene
mg/
L
Nit
rate
mg/
L
Nit
rite
mg/
L
o-X
ylen
e m
g/L
pH (
Lab)
uni
tles
s
Phen
anth
rene
mg/
L
Phen
ols
mg/
L
Pota
ssiu
m m
g/L
Pyre
ne m
g/L
Silv
er m
g/L
Sodi
um m
g/L
Styr
ene
mg/
L
Sulp
hate
mg/
L
Tet
rach
loro
ethy
lene
mg/
L
To
luen
e m
g/L
To
tal
Kje
ldah
l N
itro
gen
mg/
L
To
tal
Org
anic
Car
bon
mg/
L
To
tal
Xyl
enes
mg/
L
Tra
ns-1
,2-d
ichl
oro
ethy
lene
mg/
L
Tra
ns-1
,3-d
ichl
oro
pro
pen
e m
g/L
Tri
chlo
roet
hyle
ne m
g/L
Vin
yl C
hlo
rid
e m
g/L
27 0.0002 13 0.03 < 0.0001 8.2 < 0.004 14 < 0.0004 350 530 < 0.0002 5 7.7 < 0.0001950 < 0.0002 < 0.3 < 0.3 < 0.01 0.0001 < 0.1 < 0.01 < 0.005 7.6 < 0.00003 < 0.004 57 < 0.00005 < 0.004 5700 < 0.01 18 < 0.005 < 0.01 9 1.7 < 0.005 < 0.005 < 0.01 < 0.005 < 0.01530 < 0.0002 < 0.1 < 0.01 0.0004 7.7 < 0.004 82 < 0.004 3300 9 0.0012 10 2 0.00083800 < 0.0002 < 0.1 < 0.1 < 0.005 0.00018 < 0.1 < 0.01 < 0.003 7 0.00006 0.012 160 < 0.00005 < 0.04 23000 < 0.005 740 < 0.003 0.025 34 7.6 < 0.003 < 0.003 < 0.005 < 0.003 < 0.0058.2 < 0.0002 < 0.005 < 0.005 < 0.0002 0.00008 < 0.1 < 0.01 < 0.0001 8.3 < 0.00003 < 0.004 10 < 0.00005 < 0.0004 290 < 0.0002 3 < 0.0001 < 0.0002 2 1.6 < 0.0001 < 0.0001 < 0.0002 < 0.0001 < 0.0002M51 2
M51-3M52-1M52-2M52-3M53-2M53-3M53-4M58-2M58-3M96M97M98M99-2M100M101M102M103M104OW1
8.2 < 0.0002 < 0.005 < 0.005 < 0.0002 0.00008 < 0.1 < 0.01 < 0.0001 8.3 < 0.00003 < 0.004 10 < 0.00005 < 0.0004 290 < 0.0002 3 < 0.0001 < 0.0002 2 1.6 < 0.0001 < 0.0001 < 0.0002 < 0.0001 < 0.000218 < 0.0002 0.3 0.11 < 0.0001 8.1 < 0.004 11 < 0.0004 180 130 < 0.0002 3 6.1 < 0.000116 < 0.0002 < 0.01 < 0.01 < 0.0004 0.0001 < 0.1 < 0.01 0.0008 8 < 0.00003 < 0.004 12 < 0.00005 < 0.0004 270 < 0.0004 3 < 0.0002 < 0.0004 4 4 0.0027 < 0.0002 < 0.0004 < 0.0002 < 0.000412 < 0.0002 < 0.005 < 0.005 < 0.0002 0.00008 < 0.1 < 0.01 < 0.0001 8.2 < 0.00003 0.011 11 < 0.00005 < 0.0004 260 < 0.0002 20 < 0.0001 < 0.0002 3 1.2 0.0001 < 0.0001 < 0.0002 < 0.0001 < 0.000234 < 0.0002 0.2 0.07 < 0.0001 8.1 < 0.004 17 < 0.0004 610 120 < 0.0002 2 2.3 < 0.000124 < 0.0002 < 0.1 < 0.01 < 0.0001 7.7 < 0.004 3.2 < 0.0004 44 18 < 0.0002 < 0.7 5.6 < 0.000134 < 0.0002 < 0.1 < 0.01 < 0.0001 8 < 0.004 12 < 0.0004 150 160 < 0.0002 2.5 1.6 < 0.000130 < 0.0002 < 0.1 < 0.01 < 0.0001 7.9 < 0.004 0.54 < 0.0004 39 170 < 0.0002 0.9 3 < 0.000122 < 0.0002 0.2 0.09 < 0.0001 8.2 < 0.004 7.9 < 0.0004 280 270 < 0.0002 0.8 1.8 < 0.000131 < 0.0002 0.4 < 0.01 < 0.0001 8.1 < 0.004 1.8 < 0.0004 10 42 < 0.0002 < 0.7 0.8 < 0.000135 < 0.0002 < 0.005 < 0.005 < 0.0002 < 0.00005 1.8 < 0.01 < 0.0001 8.2 < 0.00003 < 0.004 4.2 < 0.00005 < 0.0004 25 < 0.0002 50 < 0.0001 < 0.0002 2 2.5 < 0.0001 < 0.0001 < 0.0002 < 0.0001 < 0.000231 < 0.0002 < 0.005 < 0.005 < 0.0002 < 0.00005 < 0.1 < 0.01 < 0.0001 8.3 0.00007 < 0.004 1.8 < 0.00005 < 0.0004 17 < 0.0002 45 < 0.0001 < 0.0002 < 10 1.9 < 0.0001 < 0.0001 < 0.0002 < 0.0001 < 0.000251 < 0.0002 < 0.005 < 0.005 < 0.0002 < 0.00005 < 0.1 < 0.01 < 0.0001 8 < 0.00003 < 0.004 3.1 < 0.00005 < 0.0004 14 < 0.0002 88 < 0.0001 < 0.0002 < 4 2.4 < 0.0001 < 0.0001 < 0.0002 < 0.0001 < 0.000260 < 0.0002 < 0.005 < 0.005 < 0.0002 0.00009 < 0.1 0.04 < 0.0001 8.2 0.0001 < 0.004 2.6 < 0.00005 < 0.0004 21 < 0.0002 150 < 0.0001 < 0.0002 < 10 3.3 < 0.0001 < 0.0001 < 0.0002 < 0.0001 < 0.000243 < 0.0002 < 0.005 < 0.005 < 0.0002 < 0.00005 < 0.1 0.04 < 0.0001 8.1 < 0.00003 < 0.004 4.6 < 0.00005 < 0.0004 18 < 0.0002 61 < 0.0001 < 0.0002 < 7 4.3 < 0.0001 < 0.0001 < 0.0002 < 0.0001 < 0.000258 < 0.0002 < 0.005 < 0.005 < 0.0002 < 0.00005 0.1 0.05 < 0.0001 7.9 < 0.00003 < 0.004 6 < 0.00005 < 0.0004 19 < 0.0002 140 < 0.0001 < 0.0002 < 4 6.3 < 0.0001 < 0.0001 < 0.0002 < 0.0001 < 0.000238 < 0.0002 < 0.005 < 0.005 < 0.0002 < 0.00005 < 0.1 < 0.01 < 0.0001 7.8 0.00005 < 0.004 1.9 < 0.00005 < 0.0004 25 < 0.0002 71 < 0.0001 < 0.0002 < 7 5.1 < 0.0001 < 0.0001 < 0.0002 < 0.0001 < 0.0002100 < 0.0002 < 0.005 < 0.005 < 0.0002 < 0.00005 0.1 0.25 < 0.0001 7.9 < 0.00003 < 0.004 8.4 < 0.00005 < 0.0004 160 < 0.0002 51 < 0.0001 < 0.0002 < 4 8 < 0.0001 < 0.0001 < 0.0002 < 0.0001 < 0.0002130 < 0.0002 < 0.005 < 0.005 0.0004 < 0.00005 0.1 0.03 < 0.0001 7.8 < 0.00003 < 0.004 12 < 0.00005 < 0.002 940 < 0.0002 66 < 0.0001 < 0.0002 < 10 56.4 < 0.0001 < 0.0001 < 0.0002 < 0.0001 < 0.000220 < 0.0002 < 0.1 < 0.01 < 0.0002 8 0.039 8.4 < 0.0004 81 48 < 0.0004 < 4 4.6 < 0.0002OW1
OW4OW54-dOW54-iOW54-sOW55-dOW55-iOW55-sOW56-dOW56-iOW56-sOW57
20 0.0002 0.1 0.01 0.0002 8 0.039 8.4 0.0004 81 48 0.0004 4 4.6 0.0002120 < 0.0002 < 0.1 < 0.01 < 0.0005 8 < 0.004 13 < 0.0004 430 4 0.021 8 47.2 0.000527 < 0.0002 < 0.005 < 0.005 < 0.0002 < 0.00005 < 0.1 < 0.01 < 0.0001 8.2 < 0.00003 < 0.004 12 < 0.00005 < 0.0004 73 < 0.0002 30 < 0.0001 < 0.0002 1.3 0.8 < 0.0001 < 0.0001 < 0.0002 < 0.0001 < 0.000228 < 0.0002 < 0.005 < 0.005 < 0.0002 0.00007 < 0.1 < 0.01 < 0.0001 8.1 < 0.00003 < 0.004 13 < 0.00005 < 0.0004 77 < 0.0002 39 < 0.0001 < 0.0002 1.8 1.1 < 0.0001 < 0.0001 < 0.0002 < 0.0001 < 0.0002
0.099 < 0.0002 0.8 0.58 < 0.0001 11 < 0.004 26 < 0.0004 190 86 < 0.0002 1.8 1.1 < 0.0001250 < 0.0002 2.9 0.33 < 0.0001 7.8 43 < 0.004 1400 360 < 0.0002 1.4 1.5 < 0.0001220 < 0.0002 < 0.1 < 0.01 < 0.0001 7.8 0.01 44 < 0.004 1300 39 < 0.0002 6 1.8 < 0.0001180 < 0.0002 < 0.1 < 0.01 < 0.0001 7.7 0.007 35 < 0.004 1200 45 < 0.0002 < 4 2.5 < 0.000146 < 0.0002 < 0.1 < 0.01 < 0.0001 8 < 0.004 19 < 0.0004 240 120 < 0.0002 2 0.7 < 0.000142 < 0.0002 < 0.1 < 0.01 < 0.0001 8.2 0.072 17 < 0.0004 220 16 < 0.0002 3 0.5 < 0.000128 < 0.0002 0.2 < 0.01 < 0.0001 8.4 < 0.004 16 < 0.0004 370 150 < 0.0002 < 0.7 1.4 < 0.00012.1 < 0.0002 < 0.1 < 0.01 < 0.0001 9.4 < 0.004 1.5 < 0.0004 110 160 < 0.0002 1 1.6 < 0.0001
Page 6 / 6

Table 6b: Groundwater Quality Results (October 26-28, 2010)
Alk
alin
ity
Am
mo
nia
Ars
enic
Bar
ium
Bio
chem
ical
Oxy
gen
Dem
and
Bo
ron
Cad
miu
m
Cal
cium
Che
mic
al O
xyge
n D
eman
d
Chl
ori
de
Chr
om
ium
Co
nduc
tivi
ty
Co
pper
Dis
solv
ed O
rgan
ic C
arbo
n
Har
dnes
s
Iro
n
Lead
Mag
nesi
um
Man
gane
se
Mer
cury
Nap
htha
lene
Nit
rate
Nit
rite
pH (
Lab)
Phen
ols
Pho
spho
rus
(to
tal)
Pota
ssiu
m
Sodi
um
Sulp
hate
To
tal D
isso
lved
So
lids
To
tal K
jeld
ahl N
itro
gen
Zinc
mg/L mg/L mg/L mg/L mg/L mg/L mg/L mg/L mg/L mg/L mg/L μS/cm mg/L mg/L mg/L mg/L mg/L mg/L mg/L mg/L mg/L mg/L mg/L unitless mg/L mg/L mg/L mg/L mg/L mg/L mg/L mg/L
M41 28/10/2010 464 < 0.05 < 0.001 0.087 < 2 0.07 < 0.0001 145 18 170 < 0.005 1550 < 0.002 3.7 680 0.55 < 0.0005 78.5 0.069 < 0.0001 < 0.0005 < 0.1 0.01 7.76 < 0.004 < 0.03 18 41.6 86 992 < 0.7 < 0.01
M53-4 28/10/2010 362 < 0.05 < 0.001 0.05 < 2 < 0.02 < 0.0001 134 14 5 < 0.005 1010 < 0.002 3 450 < 0.02 < 0.0005 29.2 < 0.002 < 0.0001 < 0.0005 < 0.1 < 0.01 7.7 < 0.004 0.03 < 1 55.3 180 648 < 0.7 < 0.01
M54-4 26/10/2010 363 < 0.05 < 0.001 0.18 < 2 0.037 < 0.0001 131 9 78 0.034 980 < 0.002 2.2 430 < 0.02 < 0.0005 25.4 0.002 < 0.0001 < 0.0005 0.2 < 0.01 7.8 < 0.004 2.5 1 54.8 39 620 3 < 0.01
M66-2 26/10/2010 341 0.33 0.002 0.025 < 2 1.4 < 0.0001 101 14 140 0.015 1720 < 0.002 2.3 430 1.11 < 0.0005 43.6 0.027 < 0.0001 < 0.0005 0.3 < 0.01 8.03 < 0.004 0.08 8 218 340 1070 0.9 < 0.01
M67 2 26/10/2010 388 1 7 0 008 0 27 < 2 0 77 < 0 0001 47 6 21 5 0 008 881 < 0 002 2 6 230 0 59 < 0 0005 27 1 0 082 < 0 0001 < 0 0005 0 3 0 4 8 13 0 007 0 23 9 76 6 77 552 6 < 0 01
Name DateShallow Groundwater Flow Zone*
Page 1 / 1
M67-2 26/10/2010 388 1.7 0.008 0.27 < 2 0.77 < 0.0001 47.6 21 5 0.008 881 < 0.002 2.6 230 0.59 < 0.0005 27.1 0.082 < 0.0001 < 0.0005 0.3 0.4 8.13 0.007 0.23 9 76.6 77 552 6 < 0.01
M68-4 28/10/2010 368 < 0.05 < 0.001 0.17 < 2 < 0.02 < 0.0001 147 16 55 0.013 901 < 0.002 2.9 460 0.4 < 0.0005 22.4 0.1 < 0.0001 < 0.0005 < 0.1 < 0.01 7.52 < 0.004 0.9 < 1 19.7 26 562 1 < 0.01
M70-3 27/10/2010 254 < 0.05 < 0.001 0.024 < 2 < 0.02 < 0.0001 141 51 35 0.032 882 < 0.002 4.2 450 < 0.02 < 0.0005 23.1 < 0.002 < 0.0001 < 0.0005 < 0.1 < 0.01 7.78 < 0.004 1 < 1 18.8 130 552 7 < 0.01
M80-2 26/10/2010 296 0.46 < 0.001 0.074 < 2 0.074 < 0.0001 70.2 36 18 0.042 772 < 0.002 1.5 330 0.52 < 0.0005 36.8 0.019 < 0.0001 < 0.0005 < 0.1 < 0.01 7.97 < 0.004 2.6 3 17.5 93 502 3 < 0.01
M81 26/10/2010 353 0.13 0.003 0.041 < 2 0.19 < 0.0001 96.1 28 49 0.044 915 < 0.002 2.4 420 3.74 < 0.0005 44.8 0.061 < 0.0001 < 0.0005 < 0.1 < 0.01 7.89 < 0.004 2.4 6 62 58 592 1.1 < 0.01
M87-2 27/10/2010 221 < 0.05 0.001 0.058 < 2 0.043 < 0.0001 57.6 23 29 0.059 611 < 0.002 1.2 300 < 0.02 < 0.0005 38.7 0.007 < 0.0001 < 0.0005 < 0.1 < 0.01 7.98 < 0.004 2.1 2 16.3 53 392 2 < 0.01
M96 27/10/2010 306 < 0.05 < 0.001 0.14 < 2 0.071 < 0.0001 77.8 8 5 < 0.005 670 < 0.002 2 330 < 0.02 < 0.0005 34 0.006 < 0.0001 < 0.0005 2.1 < 0.01 7.96 < 0.004 0.14 4 17.3 40 438 < 0.7 < 0.01
M97 27/10/2010 211 0.07 0.002 0.081 < 2 0.067 < 0.0001 36.5 17 7 0.023 520 < 0.002 1.6 230 0.02 < 0.0005 34.8 0.02 < 0.0001 < 0.0005 < 0.1 < 0.01 8.12 < 0.004 1.3 2 21.6 50 328 1.5 < 0.01
M99-2 26/10/2010 282 0.19 0.002 0.05 < 2 0.094 < 0.0001 63.1 28 33 0.026 838 < 0.002 3.1 400 1.21 < 0.0005 59.8 0.015 < 0.0001 < 0.0005 < 0.1 < 0.01 7.96 < 0.004 5.7 3 20.8 130 518 3 < 0.01
M101 26/10/2010 367 0.11 0.002 0.25 < 2 0.1 < 0.0001 245 16 140 < 0.005 1320 0.007 7.3 870 6.28 0.0034 62.6 0.23 < 0.0001 < 0.0005 0.2 < 0.01 7.93 < 0.004 0.41 6 18.5 130 822 1.3 0.027
M102 26/10/2010 473 0.19 0.002 0.15 < 2 0.044 < 0.0001 168 14 51 < 0.005 1130 < 0.002 5.4 570 1.12 < 0.0005 37.1 0.31 < 0.0001 < 0.0005 < 0.1 < 0.01 7.84 < 0.004 0.3 2 28.2 61 726 1.1 < 0.01
M103 26/10/2010 852 0.36 0.003 0.18 < 2 0.4 < 0.0001 145 22 140 0.006 1940 < 0.002 7.7 750 1.19 < 0.0005 94.3 0.043 < 0.0001 < 0.0005 < 0.1 0.18 7.9 < 0.004 0.19 8 159 43 1190 1.6 < 0.01
OW37-s 27/10/2010 132 < 0.05 < 0.001 0.11 < 2 0.088 < 0.0001 39 7 71 < 0.005 514 < 0.002 1.5 150 0.42 < 0.0005 13.8 0.3 < 0.0001 < 0.0005 < 0.1 < 0.01 7.9 < 0.004 < 0.15 8 35 9 326 < 0.7 < 0.01
M5-3 26/10/2010 424 1.2 < 0.001 0.19 8 1.1 < 0.0001 35 9 40 < 0.005 978 < 0.002 1.8 190 0.03 < 0.0005 26 0.003 < 0.0001 < 0.0005 < 0.1 < 0.01 7.88 0.054 0.04 13 141 29 624 1.8 < 0.01
M6-3 26/10/2010 1690 8.6 0.002 2.2 < 2 < 0.02 < 0.0001 937 100 980 0.018 11400 0.002 30.4 2300 < 0.2 0.0016 < 0.5 < 0.002 < 0.0001 < 0.005 < 0.1 < 0.01 12.4 0.01 < 0.15 79 509 < 1 7590 12 < 0.01
M9-3 28/10/2010 579 0.64 < 0.001 0.26 < 2 0.28 < 0.0001 152 33 160 < 0.005 1520 < 0.002 10.5 540 7.08 < 0.0005 38.2 0.26 < 0.0001 < 0.0005 < 0.1 < 0.01 7.17 < 0.004 0.09 6 102 12 948 1.5 < 0.01
Intermediate BedrockGroundwater Flow Zone
M10-1 28/10/2010 587 0.49 0.003 0.27 2 0.26 < 0.0001 188 33 150 < 0.005 1530 < 0.002 10 650 28.2 < 0.0005 44.2 1.2 < 0.0001 < 0.0005 < 0.1 < 0.01 7.27 < 0.004 0.04 6 89.8 25 960 1.3 < 0.01
M49-1 28/10/2010 372 0.56 < 0.001 0.023 < 2 0.86 < 0.0001 8.19 16 240 < 0.005 1590 < 0.002 2.9 37 0.03 < 0.0005 4.04 0.007 < 0.0001 < 0.0005 < 0.1 0.12 8.19 < 0.004 0.12 7 328 22 1000 1.2 < 0.01
M56-2 27/10/2010 272 0.11 < 0.001 0.2 < 2 0.08 < 0.0001 80.1 8 25 < 0.005 757 < 0.002 1.5 390 0.09 < 0.0005 46.7 0.055 < 0.0001 < 0.0005 < 0.1 < 0.01 7.96 < 0.004 0.03 3 12.8 90 482 < 0.7 < 0.01
M57 28/10/2010 80 9.3 0.009 0.012 < 2 0.7 < 0.0001 8.39 25 610 < 0.005 2330 0.002 3.3 21 < 0.02 < 0.0005 0.12 < 0.002 < 0.0001 < 0.0005 < 0.1 0.06 9.59 < 0.004 0.06 13 430 71 1450 9.3 < 0.01
M58-3 26/10/2010 313 < 0.05 < 0.001 0.15 < 2 < 0.02 < 0.0001 96.3 < 4 6 < 0.005 686 < 0.002 1.1 370 < 0.02 < 0.0005 31.4 < 0.002 < 0.0001 < 0.0005 0.3 < 0.01 7.98 < 0.004 < 0.03 1 5.9 48 432 < 0.7 < 0.01
M59-2 26/10/2010 419 0.44 < 0.001 0.21 < 2 0.23 < 0.0001 128 26 61 < 0.005 997 < 0.002 8.2 470 < 0.02 < 0.0005 36.9 0.013 < 0.0001 < 0.0005 < 0.1 < 0.01 7.91 0.005 0.06 5 34.1 38 628 2 < 0.01
M59-3 26/10/2010 267 < 0.05 < 0.001 0.063 < 2 0.025 < 0.0001 102 6 18 < 0.005 592 < 0.002 2.8 300 0.08 < 0.0005 11 0.01 < 0.0001 < 0.0005 < 0.1 < 0.01 7.94 < 0.004 < 0.03 < 1 8.2 26 378 < 0.7 < 0.01
M59-4 26/10/2010 323 2.3 0.005 0.12 < 2 0.56 < 0.0001 63.1 40 4 < 0.005 643 < 0.002 3.5 300 0.63 < 0.0005 33.5 0.02 < 0.0001 < 0.0005 < 0.1 0.01 8.01 < 0.004 0.26 8 23.1 23 418 6.6 < 0.01
M70-1 27/10/2010 210 6.6 < 0.01 0.31 < 2 3.1 < 0.001 922 120 8400 0.005 25100 < 0.04 2.6 4900 18.9 < 0.005 640 0.23 < 0.0001 < 0.0005 0.3 < 0.01 7.36 < 0.004 0.15 55 3330 270 15100 7.7 < 0.1
M71 28/10/2010 610 2 < 0.001 0.081 7 0.46 < 0.0001 169 26 230 < 0.005 1840 < 0.002 8.3 640 < 0.02 < 0.0005 52.3 0.009 < 0.0001 < 0.0005 < 0.1 < 0.01 7.29 0.008 0.07 15 131 19 1180 3.1 < 0.01
M72 28/10/2010 255 0.46 < 0.001 0.15 9 0.37 < 0.0001 55.1 13 22 < 0.005 605 < 0.002 1.6 270 < 0.02 < 0.0005 32.1 < 0.002 < 0.0001 < 0.0005 < 0.1 < 0.01 7.86 0.043 < 0.03 8 17.6 32 384 2 < 0.01
M74 28/10/2010 298 1.2 < 0.001 0.1 3 0.93 < 0.0001 33.4 14 17 < 0.005 670 < 0.002 2.3 170 0.15 < 0.0005 22 0.01 < 0.0001 < 0.0005 < 0.1 0.01 8.12 0.005 0.16 12 72.5 30 428 2 < 0.01
M75 28/10/2010 506 2.9 0.002 0.051 9 1.3 < 0.0001 29.5 100 96 0.011 1260 < 0.002 12 150 0.77 0.005 18 0.025 < 0.0001 < 0.001 < 0.1 0.03 7.93 0.034 1.7 18 202 75 798 9 < 0.01
M80-1 26/10/2010 187 0.44 < 0.001 0.034 7 0.4 < 0.0001 27.1 18 9 < 0.005 406 < 0.002 1.4 120 < 0.02 < 0.0005 12.8 0.009 < 0.0001 < 0.0005 < 0.1 < 0.01 8.33 0.044 0.04 5 44.2 38 280 3 < 0.01
M82-1 27/10/2010 316 0.84 < 0.001 0.18 3 1.1 < 0.0001 48 11 45 < 0.005 862 < 0.002 2.2 230 0.09 < 0.0005 26.9 < 0.002 < 0.0001 < 0.0005 < 0.1 < 0.01 7.86 < 0.004 < 0.03 10 94.7 55 542 1.4 < 0.01
M82-2 27/10/2010 328 0.25 < 0.001 0.14 < 2 0.19 < 0.0001 111 13 35 < 0.005 829 < 0.002 2.9 400 < 0.02 < 0.0005 29.7 0.019 < 0.0001 < 0.0005 < 0.1 < 0.01 7.8 < 0.004 < 0.03 4 22.8 63 528 1.1 < 0.01
M91-1 26/10/2010 275 0 47 < 0 001 0 085 < 2 0 53 < 0 0001 50 22 25 0 016 722 < 0 002 2 4 230 0 84 < 0 0005 24 4 0 007 < 0 0001 < 0 0005 0 5 < 0 01 8 19 < 0 004 0 34 9 59 4 63 462 1 7 < 0 01M91-1 26/10/2010 275 0.47 < 0.001 0.085 < 2 0.53 < 0.0001 50 22 25 0.016 722 < 0.002 2.4 230 0.84 < 0.0005 24.4 0.007 < 0.0001 < 0.0005 0.5 < 0.01 8.19 < 0.004 0.34 9 59.4 63 462 1.7 < 0.01
M95-1 28/10/2010 322 < 0.05 < 0.001 0.13 < 2 0.024 < 0.0001 115 8 10 < 0.005 751 < 0.002 2.2 400 0.38 < 0.0005 27.6 0.006 < 0.0001 < 0.0005 0.1 < 0.01 7.71 < 0.004 0.06 2 7.6 64 476 < 0.7 < 0.01
OW54-d 28/10/2010 261 0.97 < 0.001 0.047 2 0.55 < 0.0001 42.9 4 72 < 0.005 772 < 0.002 1.3 220 < 0.02 < 0.0005 26.6 0.037 < 0.0001 < 0.0005 < 0.1 < 0.01 7.95 < 0.004 < 0.03 13 72.7 20 482 1.3 < 0.01
* Shallow groundwater monitoring wells not sampled: M29, M39, M58-4 (see text for details)
Page 1 / 1

Table 7: Water Quality Results from Off-Site Domestic Supply Wells (October 27, 2010)
Parameter Units 1097
Bee
chw
oo
d R
oad
1121
Bee
chw
oo
d R
oad
1144
Bee
chw
oo
d R
oad
1181
Bee
chw
oo
d R
oad
120
6 B
eech
wo
od
Ro
ad
1250
Bee
chw
oo
d R
oad
1252
Bee
chw
oo
d R
oad
1264
Bee
chw
oo
d R
oad
Alkalinity mg/L 266 300 498 409 334 614 362 572Ammonia mg/L < 0.05 < 0.05 0.85 1.2 < 0.05 0.47 0.13 0.18Arsenic mg/L < 0.001 < 0.001 < 0.001 < 0.001 < 0.001 0.003 < 0.001 < 0.001Barium mg/L 0.093 0.07 0.025 0.079 0.078 0.3 0.16 0.11Biochemical Oxygen Demand mg/L < 2 < 2 < 2 4 < 2 < 2 < 2 < 2Boron mg/L 0.062 0.03 0.24 0.61 0.027 0.19 0.11 0.27Cadmium mg/L < 0.0001 < 0.0001 < 0.0001 < 0.0001 < 0.0001 < 0.0001 < 0.0001 < 0.0001Calcium mg/L 86 90 140 86 120 190 110 170Chemical Oxygen Demand mg/L 6 5 17 13 12 31 5 28Chloride mg/L 14 31 110 150 47 140 60 140Chromium mg/L < 0.005 < 0.005 < 0.005 < 0.005 < 0.005 < 0.005 < 0.005 < 0.005Conductivity μS/cm 628 791 1300 1280 823 1560 950 1470Copper mg/L 0.003 0.002 < 0.001 0.002 0.014 0.002 0.005 < 0.001Dissolved Organic Carbon mg/L 2 1.5 5.9 3.2 3.8 8 1.8 7.4Hardness mg/L 300 370 540 370 380 650 410 590Iron mg/L < 0.1 < 0.1 < 0.1 < 0.1 0.15 32 9 13Lead mg/L < 0.0005 < 0.0005 < 0.0005 < 0.0005 0.0015 < 0.0005 < 0.0005 < 0.0005Magnesium mg/L 21 36 44 38 18 42 30 41Manganese mg/L < 0.002 0.022 0.002 < 0.002 0.006 1.9 0.25 0.72Mercury mg/L < 0.0001 < 0.0001 < 0.0001 < 0.0001 < 0.0001 < 0.0001 < 0.0001 < 0.0001Naphthalene mg/L < 0.0005 < 0.0005 < 0.0005 < 0.0005 < 0.0005 < 0.0005 < 0.003 < 0.0005Nitrate mg/L 1.8 1.2 < 0.1 < 0.1 0.5 < 0.1 0.3 < 0.1Nitrite mg/L < 0.01 < 0.01 < 0.01 < 0.01 < 0.01 < 0.01 0.02 < 0.01
Inorganic and General Parameters
g/pH (Lab) unitless 8.1 8.03 7.7 7.92 7.83 7.54 7.86 7.65Phenols mg/L < 0.001 < 0.001 0.002 0.026 < 0.001 < 0.001 < 0.001 < 0.001Phosphorus (total) mg/L 0.03 0.03 < 0.02 0.02 0.04 < 0.02 < 0.02 < 0.02Potassium mg/L 8.2 2.6 10 11 6.3 4.7 3.1 5.6Sodium mg/L 13 20 68 120 22 80 41 86Sulphate mg/L 39 74 35 26 24 30 50 24Total Dissolved Solids mg/L 408 498 828 778 520 968 606 908Total Kjeldahl Nitrogen mg/L 0.4 0.3 1.5 1.4 0.5 1.4 0.5 0.9Zinc mg/L 0.012 0.032 0.016 < 0.005 < 0.005 0.058 0.017 < 0.005
Page 1 / 2

Table 7: Water Quality Results from Off-Site Domestic Supply Wells (October 27, 2010)
Parameter Units 1097
Bee
chw
oo
d R
oad
1121
Bee
chw
oo
d R
oad
1144
Bee
chw
oo
d R
oad
1181
Bee
chw
oo
d R
oad
120
6 B
eech
wo
od
Ro
ad
1250
Bee
chw
oo
d R
oad
1252
Bee
chw
oo
d R
oad
1264
Bee
chw
oo
d R
oad
1,1,1,2-Tetrachloroethane mg/L < 0.0001 < 0.0001 < 0.0001 < 0.0001 < 0.0001 < 0.0001 < 0.0005 < 0.00011,1,1-Trichloroethane mg/L < 0.0001 < 0.0001 < 0.0001 < 0.0001 < 0.0001 < 0.0001 0.043 < 0.00011,1,2,2-Tetrachloroethane mg/L < 0.0002 < 0.0002 < 0.0002 < 0.0002 < 0.0002 < 0.0002 < 0.001 < 0.00021,1,2-Trichloroethane mg/L < 0.0002 < 0.0002 < 0.0002 < 0.0002 < 0.0002 < 0.0002 < 0.001 < 0.00021,1-Dichloroethane mg/L < 0.0001 < 0.0001 < 0.0001 < 0.0001 < 0.0001 0.0061 0.079 0.00061,1-Dichloroethylene mg/L < 0.0001 < 0.0001 < 0.0001 < 0.0001 < 0.0001 0.0002 0.0082 0.00041,2-Dibromoethane mg/L < 0.0002 < 0.0002 < 0.0002 < 0.0002 < 0.0002 < 0.0002 < 0.001 < 0.00021,2-Dichlorobenzene (o) mg/L < 0.0002 < 0.0002 < 0.0002 < 0.0002 < 0.0002 < 0.0002 < 0.001 < 0.00021,2-Dichloroethane mg/L < 0.0002 < 0.0002 < 0.0002 < 0.0002 < 0.0002 < 0.0002 < 0.001 < 0.00021,2-Dichloropropane mg/L < 0.0001 < 0.0001 < 0.0001 < 0.0001 < 0.0001 < 0.0001 < 0.0005 < 0.00011,3,5-Trimethylbenzene mg/L < 0.0002 < 0.0002 < 0.0002 < 0.0002 < 0.0002 < 0.0002 < 0.001 < 0.00021,3-Dichlorobenzene (m) mg/L < 0.0002 < 0.0002 < 0.0002 < 0.0002 < 0.0002 < 0.0002 < 0.001 < 0.00021,4-Dichlorobenzene (p) mg/L < 0.0002 < 0.0002 < 0.0002 < 0.0002 < 0.0002 < 0.0002 < 0.001 < 0.0002Benzene mg/L < 0.0001 < 0.0001 < 0.0001 < 0.0001 < 0.0001 < 0.0001 < 0.0005 < 0.0001Bromodichloromethane mg/L 0.001 < 0.0001 0.0002 0.0012 < 0.0001 < 0.0001 < 0.0005 < 0.0001Bromoform mg/L < 0.0002 < 0.0002 < 0.0002 0.0012 < 0.0002 < 0.0002 < 0.001 < 0.0002Bromomethane mg/L < 0.0005 < 0.0005 < 0.0005 < 0.0005 < 0.0005 < 0.0005 < 0.003 < 0.0005Carbon Tetrachloride mg/L < 0.0001 < 0.0001 < 0.0001 < 0.0001 < 0.0001 < 0.0001 < 0.0005 < 0.0001Chlorobenzene mg/L < 0.0001 < 0.0001 < 0.0001 < 0.0001 < 0.0001 < 0.0001 < 0.0005 < 0.0001Chloroethane mg/L < 0 0002 < 0 0002 0 0004 0 0012 < 0 0002 0 0038 0 009 0 022
Volatile Organic Compounds (VOCs)
Chloroethane mg/L < 0.0002 < 0.0002 0.0004 0.0012 < 0.0002 0.0038 0.009 0.022Chloroform mg/L 0.0043 0.0008 0.0024 0.0008 < 0.0001 < 0.0001 < 0.0005 < 0.0001Chloromethane mg/L < 0.0005 < 0.0005 < 0.0005 0.0021 < 0.0005 < 0.0005 < 0.003 < 0.0005Cis-1,2-Dichloroethylene mg/L < 0.0001 < 0.0001 < 0.0001 < 0.0001 < 0.0001 < 0.0001 < 0.0005 < 0.0001Cis-1,3-Dichloropropylene mg/L < 0.0002 < 0.0002 < 0.0002 < 0.0002 < 0.0002 < 0.0002 < 0.001 < 0.0002Dichloromethane mg/L < 0.0005 < 0.0005 < 0.0005 < 0.0005 < 0.0005 < 0.0005 < 0.003 < 0.0005Ethylbenzene mg/L < 0.0001 < 0.0001 < 0.0001 < 0.0001 < 0.0001 < 0.0001 < 0.0005 < 0.0001m+p-Xylene mg/L < 0.0001 < 0.0001 < 0.0001 < 0.0001 < 0.0001 < 0.0001 < 0.0005 < 0.0001o-Xylene mg/L < 0.0001 < 0.0001 < 0.0001 < 0.0001 < 0.0001 < 0.0001 < 0.0005 < 0.0001Styrene mg/L < 0.0002 < 0.0002 < 0.0002 < 0.0002 < 0.0002 < 0.0002 < 0.001 < 0.0002Tetrachloroethylene mg/L < 0.0001 < 0.0001 < 0.0001 < 0.0001 < 0.0001 < 0.0001 < 0.0005 < 0.0001Toluene mg/L < 0.0002 < 0.0002 < 0.0002 < 0.0002 < 0.0002 < 0.0002 < 0.001 < 0.0002Trans-1,2-dichloroethylene mg/L < 0.0001 < 0.0001 < 0.0001 < 0.0001 < 0.0001 < 0.0001 < 0.0005 < 0.0001Trans-1,3-dichloropropene mg/L < 0.0002 < 0.0002 < 0.0002 < 0.0002 < 0.0002 < 0.0002 < 0.001 < 0.0002Trichloroethylene mg/L < 0.0001 < 0.0001 < 0.0001 < 0.0001 < 0.0001 < 0.0001 < 0.0005 < 0.0001Trichlorofluoromethane mg/L < 0.0002 < 0.0002 < 0.0002 < 0.0002 < 0.0002 < 0.0002 < 0.001 < 0.0002Vinyl Chloride mg/L < 0.0002 < 0.0002 < 0.0002 < 0.0002 < 0.0002 < 0.0002 < 0.001 < 0.0002
Page 2 / 2
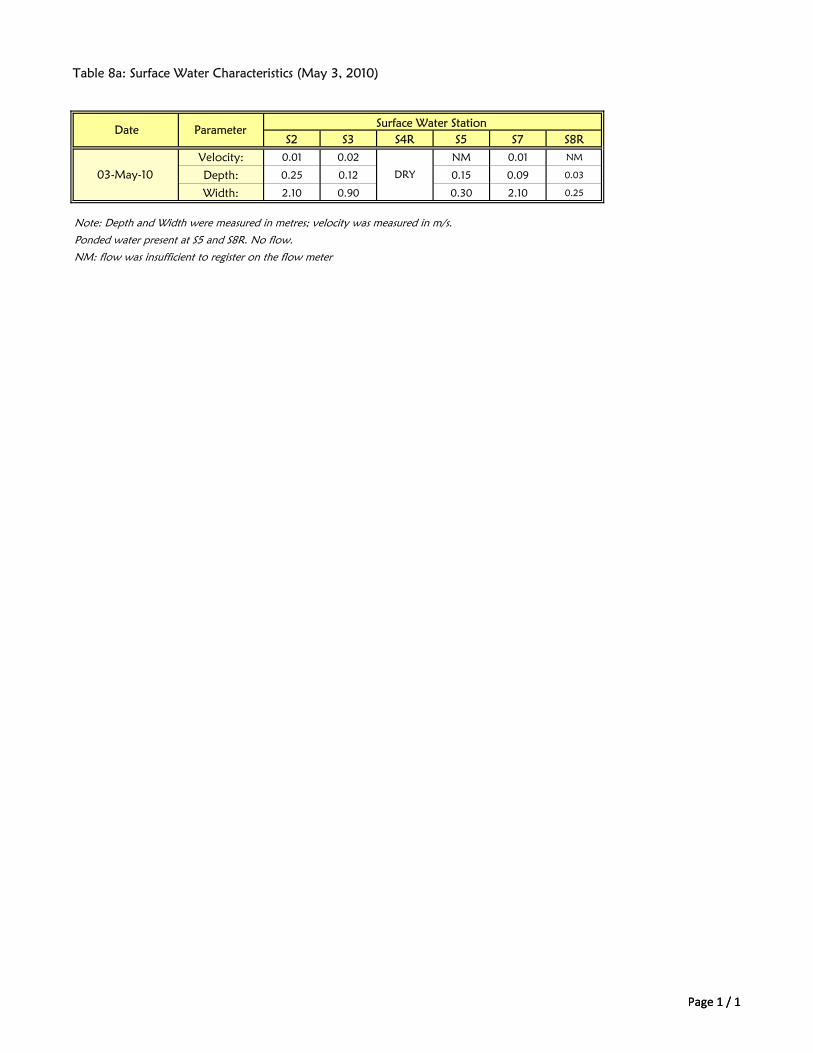
Table 8a: Surface Water Characteristics (May 3, 2010)
S2 S3 S4R S5 S7 S8R
Velocity: 0.01 0.02 NM 0.01 NM
Depth: 0.25 0.12 0.15 0.09 0.03
Width: 2.10 0.90 0.30 2.10 0.25
Note: Depth and Width were measured in metres; velocity was measured in m/s.
Ponded water present at S5 and S8R. No flow.
NM: flow was insufficient to register on the flow meter
Date Parameter
03-May-10
Surface Water Station
DRY
Page 1 / 1Page 1 / 1

Table 8b: Surface Water Characteristics (October 25, 2010)
S2 S3 S4R S5 S8RVelocity: m/s NM NM NM NM
Depth: m 0.60 0.22 0.12 0.1
Width: m 1.50 0.83 0.76 0.35
Estimated Flow Rate: m3/s NM NM NM NM
Ponded water present at S5. No flow.
NM: Not Measured (flow was insufficient to register on the flow meter - very small flow observed)
Date Parameter Surface Water Station
25-Oct-10 DRY
Page 1 /1 Page 1 /1

Table 9a: Surface Water Quality Results (May 3, 2010)
S2 S7 S3 S5 S4R S8R(upstream) (upstream)
Reading Name Units PWQO DRY DRYAlkalinity mg/L 264 279 288 332Ammonia mg/L < 0.15 < 0.15 < 0.15 0.4Arsenic mg/L 0.1 0.001 < 0.001 < 0.001 0.001Barium mg/L 0.06 0.042 0.05 0.078Benzene mg/L 0.1 < 0.0001 < 0.0001 < 0.0001 < 0.0001Biochemical Oxygen Demand mg/L 2 3 < 2 4Boron mg/L 0.2 < 0.02 < 0.02 0.023 0.044Cadmium mg/L 0.0002 < 0.0001 < 0.0001 < 0.0001 < 0.0001Chemical Oxygen Demand mg/L 81 64 49 18Chloride mg/L 23 22 27 7Chromium mg/L 0.1 < 0.005 < 0.005 < 0.005 < 0.005Cobalt mg/L 0.0009 0.0006 < 0.0005 < 0.0005 < 0.0005Colour TCU 110 93 54 9Conductivity μS/cm 559 577 618 652Copper mg/L 0.005 < 0.002 < 0.002 < 0.002 < 0.002Cyanide (free) mg/L 0.005 < 0.002 < 0.002 < 0.002 < 0.002Dissolved Oxygen mg/L 2.86 3.99 4.53 11.26Ethylbenzene mg/L 0.008 < 0.0001 < 0.0001 < 0.0001 < 0.0001Field Conductivity μS/cm 625 638 699 831Field pH unitless 6.5-8.5 7.5 7.45 7.58 7.33Field Temperature °C 18.3 19.5 17.4 17.4Ionic Balance % 5.07 4.99 4.79 2.53Iron mg/L 0.3 0.16 < 0.1 0.33 < 0.1Lead mg/L 0.025 < 0.0005 < 0.0005 < 0.0005 < 0.0005m+p-Xylene mg/L 0.03 < 0.0001 < 0.0001 < 0.0001 < 0.0001Mercury mg/L 0.0002 < 0.0002 < 0.0002 < 0.0002 < 0.0002Nitrate mg/L < 0.1 < 0.1 < 0.1 1.8Nitrite mg/L < 0.01 < 0.01 < 0.01 0.14o-Xylene mg/L 0.04 < 0.0001 < 0.0001 < 0.0001 < 0.0001pH (Lab) unitless 8.3 8.4 8.3 8.3Phenols mg/L 0.001 < 0.001 < 0.001 < 0.001 < 0.001Phosphorus (total) mg/L 0.03 0.061 0.068 0.041 0.59Potassium mg/L 4.4 3.1 3.4 4.7Sodium mg/L 13 13 17 8.3Sulphate mg/L < 1 < 1 < 1 15Toluene mg/L 0.0008 < 0.0002 < 0.0002 < 0.0002 < 0.0002Total Dissolved Solids mg/L 360 380 400 410Total Kjeldahl Nitrogen mg/L 2 1.4 1.4 1.4Total Suspended Solids mg/L < 1 3 6 4Total Xylenes mg/L < 0.0001 < 0.0001 < 0.0001 < 0.0001Turbidity NTU 1.8 5.4 1.6 5.4Unionized Ammonia mg/L 0.02 < 0.02 < 0.02 < 0.02 < 0.02Zinc mg/L 0.03 < 0.01 < 0.01 < 0.01 < 0.01
Marysville Creek Beechwood Ditch
(downstream) (downstream)
Page 1 / 1

Table 9b: Surface Water Quality Results (October 25, 2010)
S2 S3 S5 S4R S8R(upstream) (downstream) (upstream) (downstream) (downstream)
Reading Name Units PWQO DRYAlkalinity mg/L 248 250 276 253Ammonia mg/L < 0.15 < 0.15 < 0.15 < 0.15Ammonia (unionized) mg/L 0.02 < 0.02 < 0.02 < 0.02 < 0.02Arsenic mg/L 0.1 < 0.001 < 0.001 < 0.001 < 0.001Barium mg/L 0.061 0.056 0.073 0.079Biochemical Oxygen Demand mg/L < 2 < 2 < 2 < 2Boron mg/L 0.2 0.024 0.034 < 0.02 0.027Cadmium mg/L 0.0002 0.0001 < 0.0001 0.0002 < 0.0001Calcium mg/L 95 95 99 96Chemical Oxygen Demand mg/L 43 36 32 13Chloride mg/L 30 35 32 18Chromium mg/L 0.01 < 0.005 < 0.005 < 0.005 < 0.005Conductivity μS/cm 574 613 616 637Copper mg/L 0.005 < 0.002 < 0.002 0.004 < 0.002Cyanide (free) mg/L 0.005 < 0.002 < 0.002 < 0.002 < 0.002Hardness mg/L 250 260 310 280Iron mg/L 0.3 0.18 0.12 0.19 < 0.1Lead mg/L 0.025 < 0.0005 < 0.0005 < 0.0005 < 0.0005Magnesium mg/L 14 15 20 20Mercury mg/L 0.0002 < 0.0002 < 0.0002 < 0.0002 < 0.0002Naphthalene mg/L 0.007 < 0.0005 < 0.0005 < 0.0005 < 0.0005Nitrate mg/L < 0.1 < 0.1 < 0.1 0.2Nitrite mg/L < 0.01 < 0.01 < 0.01 < 0.01Phenols mg/L 0.001 < 0.001 < 0.001 < 0.001 < 0.001Phosphorus (total) mg/L 0.03 0.022 0.031 0.11 0.032Potassium mg/L 3.7 3.9 5.2 2.7Sodium mg/L 12 19 8.2 17Sulphate mg/L 13 21 13 63Total Dissolved Solids mg/L 360 392 392 392Total Kjeldahl Nitrogen mg/L 1.3 1 1.1 < 0.7Total Suspended Solids mg/L < 1 2 18 < 1Zinc mg/L 0.03 < 0.01 < 0.01 < 0.01 < 0.01
Estimated Flow Rate* m3/s NM NM NM NMConductivity (Field) μS/cm 579 601 609 627Dissoved Oxygen (Field) mg/L 7.4 9.7 7.52 11.36pH (Field) unitless 6.5-8.5 7.25 6.49 7.48 7.73Temperature (Field) °C 7.70 7.24 8.03 8.80* NM: not measured (negligible flow observed)
Marysville Creek Beechwood Ditch
Field Measured
Page 1 / 1

Table 10a: Subsurface Gas Monitoring Results (May 5, 2010)
Gas Monitor Location Reading (ppm)
GM1 North of garage area, south of waste mound
40
GM3 North-east corner of waste mound
30
GM4-1 35
GM4-2 30
GM5 North-west corner of waste mound
0
GM6 North of waste mound 15
South-east corner of waste mound
Page 1 / 1

Table 10b: Subsurface Gas Monitoring Results (October 25, 2010)
Gas Monitor Location Reading (ppm)
GM1 North of garage area, south of waste mound
130
GM3 North-east corner of waste mound
0
GM4-1 0
GM4-2 0
GM5 North-west corner of waste mound
130
GM6 North of waste mound 0
South-east corner of waste mound
Page 1 / 1
LIST OF FIGURES
Figure 1a: Site Plan and Monitoring Locations (Spring 2010) Figure 1b: Site Plan and Monitoring Locations (Fall 2010)
Figure 2a: Shallow Groundwater Flow Zone Potentiometric Surface – April 28, 2010 Figure 2b: Shallow Groundwater Flow Zone Potentiometric Surface – October 25, 2010
Figure 3a: Intermediate Bedrock Groundwater Flow Zone Potentiometric Surface – April 28, 2010
Figure 3b: Intermediate Bedrock Groundwater Flow Zone Potentiometric Surface – October 25, 2010

CONC
CONC WALL
RUIN
Earth Dam
Earth Dam
125.92
129.96
V2
V11
116.22HV 12
H1
H10
CONC
CONC
CONC
TANK
OBSCURED
OBSCUREDOBSCURED
125.5
125.5
127.3
126.6127.5
127.4
127.6
128.4
127.
812
8.5
128.3
128.2
129.8
128.4
129.5
130.4
129.5
128.6
128.2128.4
128.2
125.
6
126.2
125.8
125.6125.4
125.
6
127.2
126.6
127.2
126.7
126.7126.7126.3
126.8
125.6
124.9
125.3
125.5
124.9
124.9
124.7124.9
125.1
125.4
125.3
125.1
125.4
125.1
124.8
124.8
124.4
125.6
126.2
124.3
125.1
124.9
125.3
126.5
127.5
125.2
125.6
128.4
128.2
128.2 127.9
126.3
127.5
127.3
127.
512
6.9
125.9
125.9
127.6
127.5
123.5
124.1
123.8
122.4
121.4
120.8
121.6
123.
412
4.6
124.5 124.6
123.3
123.5122.6
125.4
124.5123.5
123.7
124.5
127.2
125.2
123.8
123.9
124.1
124.1
124.5
124.1
124.3
124.3
124.4
124.4
124.6
126.2
124.6
127.9125.4
126.8
126.9
127.1
126.6
126.3
126.6126.2
125.8
125.5
125.5
125.4
126.4127.1
127.3
130.5 129.7
129.5
128.4
128.6128.4
128.7
129.4
129.1
129.7
129.4
125.4 126.7
127.
612
6.8
126.3
125.1 124.8
128.5
129.3
163.9
164.9
157.6
127.1126.4
125.4
122.9
124.1
165.5
130.5
130.4
132.2
130.7127.3
126.
612
4.4
123.
8
124.5124.6
124.3
124.3
125.8
126.4
122.2
121.5
120.5
122.5
122.8
123.6
126.6
127.5
123.5
130.3
133.
1 139.8
130.4130.7 130.6
129.6
131.9
129.4
128.5
127.6
129.4
138.4
131.
5
137.2
137.5129.7
127.8126.2
127.4
126.1
127.5
126.6
127.6
126.6
125.5
125.2
125.
4
129.6 128.3 127.3 129.5 130.2
125.1
130.1
129.5
128.8
127.9
128.3
128.4
127.7
127.2
127.6
127.7
127.3
128.3
121.5
121.6
124.1
126.8
129.9
130.4
128.3
127.7
128.8129.7
124.
2
128.4
127.4
128.7
130.4
130.1
127.3
127.1
129.3
129.7
127.8
123.4
122.3
122.4
121.5
120.9
121.1
121.4
121.3122.7
120.5
120.4
120.5
120.4
120.2
127.3
125.1
125.3 127.3
126.3
127.3
124.5123.5122.6
124.6
124.7
124.8
122.7123.3
119.5
119.4
120.
7
118.3
119.3
120.4
121.4
128.5
125.8
121.6
120.4
118.6
118.5
114.7
116.6
116.3
118.5
117.5
119.4
119.3
117.5
119.4
120.8
123.7
119.4
OBSCURED
124.9
127.8
125
125
125
125
125
130
130
125
125 12
5
125
125125
125
125
130
125
125
125
125
125
125125
135
130
140
145
150
155
130
135 140
145
150 155 160
130
135
14014
5
150
155
130
135
140
145
150
155
160
130
125
125
125
125125
120
120
125
125
125130
130
135
130
130
135
135
125
130
130
125
125
125
125120
120
130
137.2
125
!.
!.
!.
!A
!A
!A
!A
!AA
A
AA
AAA
AA!A
AA!A
AAA
AAA A
A
A
A
A
A
AA
A
AA
A
A
A
!A
AAA
AAA
AAA
AA
AAA
AAA
AA
AA
AAA
AAA
A!AA!A
AAA!A
AAAA
A
AA
A
AA
AAAA
AAAA
A
AA
AA
A!AA!A
AAA!A
AAAA
!A
A
A
A
A
!A
A
A
A
A
A!A
AA
AA
AA
A
A
AA
A
!A
!A
A
A!A
A
!A
!A
!A A
A
AA
AA!A
A
AAA
AAA
A
A
A
A
!A
!A
!A
A
!A
!A
!AA
!A!A!A
A
A
A
!AA!A
!A
!A
A
!A
!A!A
!A!A
!A
!A
!A
!A !A
!A
!AA
S5
S2
S3
GM4
GM3
GM1
GM6
GM5
M5-3
M6-3
M41
M53-4M54-4
M66-2M67-2
M81
M87-2
M96
M97
M99-2
M101
M102
M103
OW37-s
M49-1M56-2M57
M58-3
M59-2M59-3
M59-4
M70-1M70-3
M72
M74
M80-1
M80-2
M82-1M82-2
M91-1
M95-1
M105
M106M107
M108
2054
M3A-1
M3A-2
M4-2
M5-2
M6-1
M9R-1
M10-3 M14
M15M16
M18
M19
M23
M27M28
M29
M30M31
M35
M38
M39
M42-2
M42-3
M43-1M43-3
M46-1
M46-2
M47-1
M47-2M47-3
M48-1M48-2
M48-3
M49-2M49-3
M50-1
M50-2
M51-1M51-2
M51-3
M52-1
M52-2M52-3
M53-1M53-3
M54-1
M54-2
M55-1
M55-2
M55-3
M55-4
M56-1
M58-1
M58-2
M59-1
M60-2M60-3
M63-1
M64-1M64-2
M65-1M65-2
M66-1M67-1
M68-1M68-2 M68-3
M76M77
M78
M79
M83
M84M85
M86
M87-1M88-1M88-2
M89-1M89-2
M91-2
M94-1M94-2
M95-2
M98
M99-1
M100
M104
OW1
OW4OW5
OW36OW37-d
OW54-s
OW55-dOW55-iOW55-s
OW56-iOW56-s
OW57
PW1
PW2
M3A-3
M50-3
M58-4
M60-1
M60-4
M63-2
M70-2
M73
OW54-i
OW56-d
M93
M90-2M90-1
M61-4M61-3M61-2M61-1
M54-3M43-2
M42-1
M12M10-2
M9-2
M9-1
M6-2
M5-1
M4-3
M4-1
2055 OW54-dM71
M10-1
M9-3
M75
M68-4
M53-2
WASTE MANAGEMENTRICHMOND LANDFILL2010 ANNUAL MONITORING REPORT
0 25 50 75 10012.5Metres
O Scale: 1:5000
Prepared by:WESA GeomaticsUnits:UTM NAD 83 Zone 18
Marysville Creek
BeechwoodDitch
Figure 1a: Site Plan andMonitoring Locations (Spring 2010)
Project : K-B8578-00-04Data Source: WM Canada, WESA, HPA Ltd. Base Mapping 2009Date: March 2011
A Monitoring Well Used to Measure Water Level (Not Sampled)M53-1!A Monitoring Well Used to Measure Water Level and Sampled for ChemistryM53-2!A Gas Monitoring WellGM1!5 Surface Water Monitoring Location
!5!5
S4RS8R
S2
The following monitoring wells locatedto the north of the area shown are alsoincluded in the monitoring program:M45-1, M45-2, M45-3M61-1, M61-2, M61-3, M61-4M62-1, M62-2, M62-3, M62-4M69-1, M69-2, M69-3, M69-4M90-1, M90-2, M90-3

CONC
CONC WALL
RUIN
Earth Dam
Earth Dam
125.92
129.96
V2
V11
116.22HV12
H1
H10
CONC
CONC
CONC
TA NK
OBSCU RED
OBSCU REDOBSCU RED
OBSCU RED
OBSCU RED
127 .6 129 .2128 .4
126 .5128 .1
127 .1
126 .4
126.
612
7 .1
125 .5
125 .5
125 .5
125 .5
125 .5
127 .3
126 .6127 .5
127 .4
127 .6
129 .3
127 .7
128 .4
127.
212
6.9
127 .
812
8.5
128 .3
128 .2
129 .8
128 .4
129 .5
130 .4
129 .5
128 .6
128 .2128 .4
128 .2
127 .7
125.
812
5 .6
126 .2
125 .8
126 .1
125 .6
125 .4
125 .8
125 .6 125 .4
125.
6
127 .2
126 .3
125 .7
125 .4
125 .7
125 .7
125 .3
126 .1
125 .1
125 .1
125 .1
125 .1
125 .4
128 .6
127 .1
126 .9
126 .6
126 .7
126 .4
126 .6
127 .2
126 .7
126 .7126 .7
126 .8
127 .4
127 .4
130 .3128 .4
127 .3
127 .7
128 .3
128 .1
126 .5
126 .4
126 .3
126 .8
126 .7
125 .6
124 .9
125 .3
125 .5
124 .9
124 .9
124 .7124 .9
125 .1
125 .4
125 .3
125 .1
125 .4
125 .1
124 .8
124 .8
124 .4
125 .6
126 .2
124 .3
125 .1
124 .9
125 .3
126 .5
127 .5
125 .2
125 .6
128 .4
128 .2
128 .2 127 .9
126 .3
127 .5
127 .3
127.
512
6 .9
125 .9
125 .9
125 .8
126 .3
127 .6
127 .5
123 .5
123 .5
124 .1
123 .8
122 .4
122 .4
121 .4
121 .5
120 .8
121 .6
123.
412
4 .6
124 .5 124 .6
123 .3
123 .5122 .6
125 .4
124 .5123 .5
123 .7
124 .5
127 .2
125 .2
123 .8
123 .9
124 .1
124 .1
124 .5
124 .1
124 .3
124 .3
124 .4
124 .4
124 .6
126 .2
124 .6
127 .9125 .4
126 .8
126 .9
127 .1
126 .6
126 .3
126 .6126 .2
125 .8
125 .5
125 .5
125 .4
126 .4
126 .8
127 .8
127 .5127 .1
127 .8127 .3
126 .6
129 .7
133 .8
129 .1130 .2
130 .5 129 .7
129 .5
128 .4
128 .6
130 .4
128 .4
128 .7
129 .4
129 .1
129 .7
129 .4
125 .4 126 .7
127.
612
6 .8
126 .3
125 .1 124 .8
128 .5
129 .3
163 .9
164 .9
157 .6
127 .1126 .4
125 .4
122 .9
124 .1
165 .5
130 .5
130 .4
132 .2
130 .7127 .3
126.
612
4.4
123 .
8
124 .5124 .6
124 .3
124 .3
125 .8
126 .4
122 .2
121 .5
120 .5
122 .5
122 .8
123 .6
126 .6
127 .5
123 .5
130 .3
133.
1 139 .8
130 .4130 .7
130 .6
129 .6
131 .9
129 .4
128 .5
127 .6
129 .4
138 .4
131.
5
137 .2
137 .5129 .7
127 .8126 .2
127 .4
126 .1
127 .5
126 .6
127 .6
126 .6
125 .5
125 .2
125.
4
129 .6 128 .3 127 .3 129 .5
130.2
125 .1
130 .1
129 .5
128 .8
127 .9
128 .3
128 .4
127 .7
127 .2
127 .6
127 .7
127 .3
130 .3
129 .6
129 .3
128 .3
129 .3
128 .4
132 .7
124 .3
131 .7
123 .9125 .6
124 .4121 .7
121 .7
121 .3
123 .2
120 .1
120 .4
121 .5
121 .6
124 .1
126 .8
129 .9
130 .4
128 .3
127 .7
128 .8129 .7
124.
2
128 .4
127 .4
128 .7
130 .4
130 .1
127 .3
127 .1
129 .3
129 .7
127 .8
123 .4
122 .3
122 .4
121 .5
120 .9
121 .1
121 .4
121 .3122 .7
120 .5
120 .4
120 .5
120 .4
120 .2
127 .3
125 .1
125 .3 127 .3
126 .3
127 .3
124 .5123 .5122 .6
124 .6
124 .7
124 .8
122 .7123 .3
119. 5
119. 4
120.
7
118. 3
119. 3
120 .4
121 .4
128 .5
125 .8
121 .6
120 .4
118. 6
118. 5
114. 7
116. 6
116. 3
118.
5
117. 5
119. 4
119. 3
117. 5
119. 4
120 .8
123 .7
119. 4
119. 6
118. 9
121 .4
OBSCU RED
OBSCU RED
OBSCU RED
OBSCU RED
OBSCU RED
124 .9
OBSCU RED
127 .8
130
125
125
125
125
125
130
130
125
125
125 12
5
125
125125
125
125
130
130
130 130 130
125
125
125
125
125
125125
135
130
140
145
150
155130
135 140
145
150 155 160
130
135
14014
5
150
155
130
135
140
145
150
155
160
130
125
125
125
125125
120
120
125
125
125130
130
135
130
130
135
135
125
130
130
125
125
125
130
125
120
120
125120
120
130
137 .2
125
!.
!.
!.
!A
!A
!A
!A
!A
A
A A
A
A
A
A
A
AA
AA
A
A
A A
A
A
A
A
A
A
A
A A
A
A
A
!A
!A
!A
!A
!A
!A!A
!A!A
!A
!A!A
!A!A!A
!A!A
!A
!A!A
!A
!A
!A
!A!A
!A
!A!A
!A
!A
!A
!A
!A
!A
!A
!A
!A
!A
!A
!A
!A
!A
!A!A
!A
!A
!A!A!A!A
S5
S2
S3
GM4
GM3
GM1
GM6
GM5
M3A-3
M12 M14
M15
M16
M18
M19
M23
M27M28
M30M31
M35
M38M47-3
M50-3
M60-1
M60-4
M63-2
M64-2
M73
M77
M88-2
M89-2 M98
M100
OW54-i
OW57
M39
M41
M49-1
M53-4M54-4
M56-2
M57
M58-3M58-4
M59-2M59-3
M59-4
M66-2M67-2
M68-4
M70-1M70-3
M71
M72
M74
M80-1M80-2
M81
M82-1M82-2
M87-2
M91-1
M95-1
M9-3
M97
M99-2
M101
M102
M103
OW37-s
OW54-d
M10-1
M96
M29
M6-3
M5-3 M75
1097 Beechwood Rd
1121Beechwood Rd
1144Beechwood Rd
1181Beechwood Rd
1206Beechwood Rd
1250 Beechwood Rd1252Beechwood Rd
1264 Beechwood Rd
WASTE MANAGEMENTRICHMOND LANDFILL2010 ANNUAL MONITORING REPORT
0 25 50 75 10012.5Metres
O Scale: 1:6000
Prepared by:WESA GeomaticsUnits:UTM NAD 83 Zone 18
Marysville Creek
BeechwoodDitch
Figure 1b: Site Plan andMonitoring Locations (Fall 2010)
Project : K-B8578-00-04Data Source: WM Canada, WESA, HPA Ltd. Base Mapping 2009Date: March 2011
A Monitoring Well Used to Measure Water Level (Not Sampled)M35
!A Monitoring Well Used to Measure Water Level and Sampled for ChemistryM53-4
!A Gas Monitoring WellGM1 !5 Surface Water Monitoring Location
!5!5
S4RS8R
S2
!A!A
M5-31097Beechwood
Monitoring Well Sampled for Chemistry (Not used for Water Levels)Domestic Water Supply Well Sampled for Chemistry

CONC
CONC WALL
RUIN
Earth Dam
Earth Dam
125.92
129.96
V2
V11
H1
H10
CONC
CONC
CONC
TANK
OBSCURED
OBSCURED
OBSCURED
OBSCURED
OBSCURED
OBSCURED
OBSCURED
126.
612
7.1
125.5
125.5
125.5
127.3
126.6127.5
127.4
127.6
129.3
127.7
128.4
127.
212
6.9
127.
812
8.5
128.3
128.2
129.8
128.4
129.5
130.4
129.5
128.6
128.2128.4
128.2
127.7
125.
812
5.6
126.2
125.8
125.8
125.6 125.4
125.
6
127.2
126.4
126.6
127.2
126.7
126.7126.7
128.4
127.3
126.5
126.4
126.3
126.8
126.7
125.6
124.9
125.3
125.5
124.9
124.9
124.7124.9
125.1
125.4
125.3
125.1
125.4
125.1
124.8
124.8
124.4
125.6
126.2
124.3
125.1
124.9
125.3
126.5
127.5
125.2
125.6
128.4
128.2
128.2 127.9
126.3
127.5
127.3
127.
512
6.9
125.9
125.9
125.8
126.3
127.4
127.6
127.5
123.5
123.5
124.1
123.8
122.4
122.4
121.4
121.5
120.8
121.6
123.
412
4.6
124.5 124.6
123.3
123.5122.6
125.4
124.5123.5
123.7
124.5
127.2
125.2
123.8
123.9
124.1124.1
124.5
124.1
124.3
124.3
124.4
124.4
124.6
126.2
124.6
127.9125.4
126.8
126.9
127.1
126.6
126.3
126.6126.2
125.8
125.5
125.5
125.4
126.4
126.8
127.8
127.5127.1
127.8127.3
126.6
129.7
133.8
130.7129.1130.2
130.5 129.7
129.5
128.4
128.6
128.6
130.4
132.1
128.4
128.7
129.4
129.1
129.7
129.4
125.4 126.7
127.
612
6.8
126.3
125.1 124.8
128.5
129.3
163.9
164.9
157.6
127.1126.4
125.4
122.9
124.1
165.5
130.5
130.4
132.2
130.7127.3
126.
612
4.4
123.
8
124.5124.6
124.3
124.3
125.8
126.4
122.2
121.5
120.5
122.5
122.8
123.6
126.6
127.5
123.5
130.3
133.
1 139.8
130.4130.7 130.6
129.6
131.9
129.4
128.5
127.6
129.4
138.4
131.
5
137.2
137.5129.7
127.8126.2
127.4
126.1
127.5
126.6
127.6
126.6
125.5
125.2
125.
4129.6 128.3 127.3 129.5
130.2
125.1
130.1
129.5
128.8
127.9
128.3
128.4
127.7
127.2
127.6
127.7
127.3
130.3
129.6
133.4129.3
128.3
129.3
128.4
132.7
124.3
131.7
124.1123.9125.6
124.4121.7
121.7
121.3
122.4
123.2
120.5
120.1
120.4
121.5
121.6
124.1
126.8
129.9
130.4
128.3
127.7
128.8129.7
124.
2
128.4
127.4
128.7
130.4
130.1
127.3
127.1
129.3
129.7
127.8
123.4
122.3
122.4
121.5
120.9
121.1
121.4
121.3122.7
120.5
120.4
120.5
120.4
120.2
127.3
125.1
125.3 127.3
126.3
127.3
124.5123.5122.6
124.6
124.7
124.8
122.7123.3
119.5
119.4
120.
7
120.4
121.4
128.5
125.8
121.6
120.4
119.4
119.3
119.4
120.8
123.7
119.4
119.6
118.9
121.4
OBSCURED
OBSCURED
OBSCURED
124.9
OBSCURED
127.8
125
125
125
125
125
130
130
125
125
125 12
5
125
125125
125
125
130
130
130
130 130 130
125
125
125
125
125
125125
135
130
140
145
150
155
130
135 140
145
150 155 160
130
135
14014
5
150
155
130
135
140
145
150
155
160
130
125
125
125
125125
120
125
125
125130
130
135
130
130
135
135
125
130
130
125
125
125
130
125
120
120
125120
120
130
137.2
125
!A
!A
!A
!A
!A !A
!A
!A
!A
!A
!A
!A!A
!A
!A!A
!A
!A
!A
!A
!A
!A!A
!A
!A
!A!A
!A
!A
!A
!A
!A
!A
!A
!A
!A
!A
!A
!A
!A
!A
#
#
#
#
#
#
##
#
#M101124.19
M102124.07
M103123.67
M12125.32
M14126.51
M15124.75
M18127.1
M19128.32
M23127.16
M27126.14M28
125.98
M29123.42
M31124.37
M35124.08
M38125.01
M39123.64
M41125.02
M47-3124.69
M53-4124.74
M58-4124.7
M60-4124.23
M66-2123.08M67-2
122.7
M68-4124.07
M70-3127.17
M80-2123.30
M81124.23
M87-2124.18
M88-2128.23
M89-2129.26
M96128.78
M97125.27
M98129.74
OW37-s122.07
OW57129.54M99-2
130.04
M77126.04
M54-4124.06
M30124.2
M16124.09
M100125.02
129
128
124123
122
125
126127
127
126
125
124
123
128
WASTE MANAGEMENTRICHMOND LANDFILL2010 ANNUAL MONITORING REPORT
0 25 50 75 10012.5Meters
O Scale: 1:5000
Project : K-B8578-00-04Data Source: WM Canada, WESA, HPA Ltd. Base Mapping 2009Date: March 2011
Prepared by:WESA GeomaticsUnits:UTM NAD 83 Zone 18
Figure 2a:Shallow Groundwater Flow Zone Potentiometric Surface - April 28, 2010
!AM58-4 Shallow Groundwater Zone Elevation Monitor
Topographic Contour LinesSurface WaterHydro Tower
Potentiometric Surface (masl)#
Inferred Groundwater Flow Direction

CONC
CONC WALL
RUIN
Earth Dam
Earth Dam
125.92
129.96
V2
V11
H1
H10
CONC
CONC
CONC
TANK
OBSCURED
OBSCURED
OBSCURED
OBSCURED
OBSCURED
OBSCURED
OBSCURED
126.
612
7.1
125.5
125.5
125.5
127.3
126.6127.5
127.4
127.6
129.3
127.7
128.4
127.
212
6.9
127.
812
8.5
128.3
128.2
129.8
128.4
129.5
130.4
129.5
128.6
128.2128.4
128.2
127.7
125.
812
5.6
126.2
125.8
125.8
125.6 125.4
125.
6
127.2
126.4
126.6
127.2
126.7
126.7126.7
128.4
127.3
126.5
126.4
126.3
126.8
126.7
125.6
124.9
125.3
125.5
124.9
124.9
124.7124.9
125.1
125.4
125.3
125.1
125.4
125.1
124.8
124.8
124.4
125.6
126.2
124.3
125.1
124.9
125.3
126.5
127.5
125.2
125.6
128.4
128.2
128.2 127.9
126.3
127.5
127.3
127.
512
6.9
125.9
125.9
125.8
126.3
127.4
127.6
127.5
123.5
123.5
124.1
123.8
122.4
122.4
121.4
121.5
120.8
121.6
123.
412
4.6
124.5 124.6
123.3
123.5122.6
125.4
124.5123.5
123.7
124.5
127.2
125.2
123.8
123.9
124.1124.1
124.5
124.1
124.3
124.3
124.4
124.4
124.6
126.2
124.6
127.9125.4
126.8
126.9
127.1
126.6
126.3
126.6126.2
125.8
125.5
125.5
125.4
126.4
126.8
127.8
127.5127.1
127.8127.3
126.6
129.7
133.8
130.7129.1130.2
130.5 129.7
129.5
128.4
128.6
128.6
130.4
132.1
128.4
128.7
129.4
129.1
129.7
129.4
125.4 126.7
127.
612
6.8
126.3
125.1 124.8
128.5
129.3
163.9
164.9
157.6
127.1126.4
125.4
122.9
124.1
165.5
130.5
130.4
132.2
130.7127.3
126.
612
4.4
123.
8
124.5124.6
124.3
124.3
125.8
126.4
122.2
121.5
120.5
122.5
122.8
123.6
126.6
127.5
123.5
130.3
133.
1 139.8
130.4130.7 130.6
129.6
131.9
129.4
128.5
127.6
129.4
138.4
131.
5
137.2
137.5129.7
127.8126.2
127.4
126.1
127.5
126.6
127.6
126.6
125.5
125.2
125.
4129.6 128.3 127.3 129.5
130.2
125.1
130.1
129.5
128.8
127.9
128.3
128.4
127.7
127.2
127.6
127.7
127.3
130.3
129.6
133.4129.3
128.3
129.3
128.4
132.7
124.3
131.7
124.1123.9125.6
124.4121.7
121.7
121.3
122.4
123.2
120.5
120.1
120.4
121.5
121.6
124.1
126.8
129.9
130.4
128.3
127.7
128.8129.7
124.
2
128.4
127.4
128.7
130.4
130.1
127.3
127.1
129.3
129.7
127.8
123.4
122.3
122.4
121.5
120.9
121.1
121.4
121.3122.7
120.5
120.4
120.5
120.4
120.2
127.3
125.1
125.3 127.3
126.3
127.3
124.5123.5122.6
124.6
124.7
124.8
122.7123.3
119.5
119.4
120.
7
120.4
121.4
128.5
125.8
121.6
120.4
119.4
119.3
119.4
120.8
123.7
119.4
119.6
118.9
121.4
OBSCURED
OBSCURED
OBSCURED
124.9
OBSCURED
127.8
125
125
125
125
125
130
130
125
125
125 12
5
125
125125
125
125
130
130
130
130 130 130
125
125
125
125
125
125125
135
130
140
145
150
155
130
135 140
145
150 155 160
130
135
14014
5
150
155
130
135
140
145
150
155
160
130
125
125
125
125125
120
125
125
125130
130
135
130
130
135
135
125
130
130
125
125
125
130
125
120
120
125120
120
130
137.2
125
!A !A
!A
!A
!A
!A
!A
!A!A
!A!A!A
!A
!A
!A
!A
!A
!A!A
!A!A
!A
!A
!A
!A
!A
!A
!A
!A
!A
!A
!A
!A
!A
!A
!A
!A
!A
!A
!A
!A
#
#
#
#
#
##
#
M12125.10
M14125.82
M15DRY
M16124.11
M18126.49
M19126.59
M23125.56
M27126.08
M28126.53
M29122.98
M30124.17M31
DAMAGED
M35124.18
M38124.67
M39123.02
M41125.30
M47-3124.52
M53-4124.75
M54-4124.08
M66-2123.25M67-2
122.38
M68-4124.18
M77124.48
M81124.33
M87-2123.26
M88-2127.03
M89-2128.92
M96127.53
M97123.88
M98129.66
M99-2129.56
M100124.61
M101124.14
M102124.06
M103122.76
OW37-s122.15
OW57129.33
M58-4123.89
M60-4124.32
M70-3127.25
M80-2123.45
128
126
123
127
124
124
126128
129125
125
127
126
WASTE MANAGEMENTRICHMOND LANDFILL2010 ANNUAL MONITORING REPORT
0 25 50 75 10012.5Meters
O Scale: 1:5000
Project : K-B8578-00-04Data Source: WM Canada, WESA, HPA Ltd. Base Mapping 2009Date: March 2011
Prepared by:WESA GeomaticsUnits:UTM NAD 83 Zone 18
Figure 2b:Shallow Groundwater Flow Zone Potentiometric Surface - October 25, 2010
!AM58-4 Shallow Groundwater Zone Elevation Monitor
Topographic Contour LinesSurface WaterHydro Tower
Potentiometric Surface (masl)#
Inferred Groundwater Flow Direction

CONC
CONC WALL
RUIN
Earth Dam
Earth Dam
125.92
129.96
V2
V11
116.22HV 12
H1
H10
CONC
CONC
CONC
TANK
OBSCURED
OBSCUREDOBSCURED
125.5
127.3
127.6
128.
5
128.3
128.2
129.8
129.5
130.4
129.5
128.4
125.
6
124.7
125.4
125.1
124.8
124.8
124.4
125.6
126.2
124.3
125.3
126.5
127.5
125.2
125.6
128.4
128.2
128.2 127.9
126.3
127.5
127.3
127.
512
6.9
127.6
127.5
123.5
124.1
123.8
122.4
121.4
120.8
121.6
123.
412
4.6
124.5 124.6
123.3
123.5122.6
125.4
124.5
123.5123.7
124.5
127.2
125.2
123.8
123.9
124.1124.1
124.5
124.1
124.3
124.3
124.4
124.4
124.6
126.2
124.6
127.9125.4
126.8
126.9
127.1
126.3
126.6126.2
125.8
125.5
125.5
125.4
126.4
126.8
127.8
127.1
127.8127.3
130.2130.5 129.7
129.5
128.4
128.6128.4
128.7
129.4
129.1
129.7
129.4
125.4 126.7
127.
612
6.8
126.3
125.1 124.8
128.5
129.3
163.9
164.9
157.6
127.1126.4
125.4
122.9
124.1
165.5
130.5
130.4
132.2
130.7127.3
126.
612
4.4
123.
8
124.5124.6
124.3
124.3
125.8
126.4
122.2121.5
120.5
122.5
122.8
123.6
126.6
127.5
123.5
130.3
133.
1 139.8
130.4130.7
130.6
129.6
131.9
129.4
128.5
127.6
129.4
138.4
131.
5
137.2
137.5129.7
127.8
126.2
127.4
126.1
127.5
126.6
127.6
126.6
125.5
125.2
125.
4
129.6 128.3 127.3 129.5
130.2
125.1
130.1
129.5
128.8
127.9
128.3
128.4
127.7
127.2
127.6
127.7
127.3
130.3
128.3
129.3
128.4
120.4
121.5
121.6
124.1
126.8
129.9
130.4
128.3
127.7
128.8129.7
124.
2
128.4
127.4
128.7
130.4
130.1
127.3
127.1
129.3
129.7127.8
123.4
122.3
122.4
121.5
120.9
121.1
121.4
121.3122.7
120.5
120.4
120.5
120.4
120.2
127.3
125.1
125.3 127.3
126.3
127.3
124.5123.5122.6
124.6
124.7
124.8
122.7123.3
119.5
119.4
120.
7
118.3
119.3
120.4
121.4
128.5
125.8
121.6
120.4
118.6
118.5
114.7
116.6
116.3
118.5
117.5
119.4
119.3
117.5
119.4
120.8
123.7
119.4118.9
OBSCURED
124.9
127.8
125
130
130
125
125 12
5
125
125
130
130 130
125
125
125
125
125
125125
135
130
140
145
150
155
130
135 140
145
150 155 160
130
135
14014
5
150
155
130
135
140
145
150
155
160
130
125
125
125
125125
120
120
125
125
125130
130
135
130130
135
135
125
130
130
125
125
125
120
125120
120
130
137.2
125
!A
!A
!A
!A
!A
!A
!A
!A
!A
!A
!A!A!A
!A
!A
!A
!A
!A
!A
!A
!A
!A
!A
!A
!A!A
!A
!A
!A
!A
!A!A
!A
#
#
#
#
#
M10-1121.82
M3A-3124.95
M49-1121.74
M50-3124.49
M56-2122.95
M57122.78
M58-3122.97
M59-2122.98
M59-3122.95
M59-4122.95
M60-1122.94
M63-2121.13
M64-2118.88
M70-1121.21
M72122.76
M73122.82
M74123.78
M80-1123.01
M82-1122.86
M82-2122.75
M91-1122.97
M9-3122.47
M95-1122.83
OW54-d121.85
OW54-i121.88
119
120
121
122
123
124
WASTE MANAGEMENTRICHMOND LANDFILL2010 ANNUAL MONITORING REPORT
Scale: 1:5000
Prepared by:WESA GeomaticsUnits:UTM NAD 83 Zone 18
Figure 3a:Intermediate Bedrock Groundwater Flow Zone Potentiometric Surface - April 28, 2010
Project : K-B8578-00-04Data Source: WM Canada, WESA, HPA Ltd. Base Mapping 2009Date: March 2011
30 0 30 6015Meters
OTopographic Contour Lines
!AM58-3Intermediate Groundwater Zone Elevation Monitor
Surface WaterHydro Tower
Potentiometric Surface (masl)Inferred Groundwater Flow Direction
#

CONC
CONC WALL
RUIN
Earth Dam
Earth Dam
125.92
129.96
V2
V11
116.22HV 12
H1
H10
CONC
CONC
CONC
TANK
OBSCURED
OBSCUREDOBSCURED
125.5
127.3
127.6
128.
5
128.3
128.2
129.8
129.5
130.4
129.5
128.4
125.
6
124.7
125.4
125.1
124.8
124.8
124.4
125.6
126.2
124.3
125.3
126.5
127.5
125.2
125.6
128.4
128.2
128.2 127.9
126.3
127.5
127.3
127.
512
6.9
127.6
127.5
123.5
124.1
123.8
122.4
121.4
120.8
121.6
123.
412
4.6
124.5 124.6
123.3
123.5122.6
125.4
124.5
123.5123.7
124.5
127.2
125.2
123.8
123.9
124.1124.1
124.5
124.1
124.3
124.3
124.4
124.4
124.6
126.2
124.6
127.9125.4
126.8
126.9
127.1
126.3
126.6126.2
125.8
125.5
125.5
125.4
126.4
126.8
127.8
127.1
127.8127.3
130.2130.5 129.7
129.5
128.4
128.6128.4
128.7
129.4
129.1
129.7
129.4
125.4 126.7
127.
612
6.8
126.3
125.1 124.8
128.5
129.3
163.9
164.9
157.6
127.1126.4
125.4
122.9
124.1
165.5
130.5
130.4
132.2
130.7127.3
126.
612
4.4
123.
8
124.5124.6
124.3
124.3
125.8
126.4
122.2121.5
120.5
122.5
122.8
123.6
126.6
127.5
123.5
130.3
133.
1 139.8
130.4130.7
130.6
129.6
131.9
129.4
128.5
127.6
129.4
138.4
131.
5
137.2
137.5129.7
127.8
126.2
127.4
126.1
127.5
126.6
127.6
126.6
125.5
125.2
125.
4
129.6 128.3 127.3 129.5
130.2
125.1
130.1
129.5
128.8
127.9
128.3
128.4
127.7
127.2
127.6
127.7
127.3
130.3
128.3
129.3
128.4
120.4
121.5
121.6
124.1
126.8
129.9
130.4
128.3
127.7
128.8129.7
124.
2
128.4
127.4
128.7
130.4
130.1
127.3
127.1
129.3
129.7127.8
123.4
122.3
122.4
121.5
120.9
121.1
121.4
121.3122.7
120.5
120.4
120.5
120.4
120.2
127.3
125.1
125.3 127.3
126.3
127.3
124.5123.5122.6
124.6
124.7
124.8
122.7123.3
119.5
119.4
120.
7
118.3
119.3
120.4
121.4
128.5
125.8
121.6
120.4
118.6
118.5
114.7
116.6
116.3
118.5
117.5
119.4
119.3
117.5
119.4
120.8
123.7
119.4118.9
OBSCURED
124.9
127.8
125
130
130
125
125 12
5
125
125
130
130 130
125
125
125
125
125
125125
135
130
140
145
150
155
130
135 140
145
150 155 160
130
135
14014
5
150
155
130
135
140
145
150
155
160
130
125
125
125
125125
120
120
125
125
125130
130
135
130130
135
135
125
130
130
125
125
125
120
125120
120
130
137.2
125
!A
!A
!A
!A
!A
!A
!A
!A
!A
!A
!A!A!A
!A
!A
!A
!A
!A
!A
!A
!A
!A!A
!A
!A
!A!A
#
#
#
#
#
M64-2118.55
M3A-3124.72
M9-3120.57
M10-1120.39
M49-1120.11
M50-3124.39
M56-2123.10
M57120.29
M58-3123.11
M59-2123.14
M59-3123.13
M59-4123.13
M60-1122.36
M63-2121.22
M70-1119.95
M71120.51
M73122.98
M74123.73
M80-1123.15
M82-1122.86
M82-2122.93
M91-1123.06
M95-1122.98
OW54-d119.98
OW54-i119.98
M72122.92
M4-3123.56
119
120
121
122
123
124
WASTE MANAGEMENTRICHMOND LANDFILL2010 ANNUAL MONITORING REPORT
Scale: 1:5000
Prepared by:WESA GeomaticsUnits:UTM NAD 83 Zone 18
Figure 3b:Intermediate Bedrock Groundwater Flow Zone Potentiometric Surface - October 25, 2010
Project : K-B8578-00-04Data Source: WM Canada, WESA, HPA Ltd. Base Mapping 2009Date: March 2011
20 0 20 4010Meters
OTopographic Contour Lines
!AM58-3Intermediate Groundwater Zone Elevation Monitor
Surface WaterHydro Tower
Potentiometric Surface (masl)Inferred Groundwater Flow Direction
#

WESA Envir-Eau WESA Tech WESA Tecnologias S.A. de C.V.
440, Blvd Rene-Levesque Ouest
Bureau 350
Montréal, Québec
Canada H2Z 1V7
Téléphone: 514.844.7199
Télécopieur: 514.841.9111
160, boul. de l'Hôpital, #204
Gatineau, Québec
Canada J8T 8J1
Téléphone: 819.243.7555
Télécopieur: 819.243.0167
4 Cataraqui Street
The Tower, The Woolen Mill
Kingston, Ontario
Canada K7K 1Z7
Tel: (613) 531-2725
Fax: (613) 531-1852
Calle La Mascota, Pasaje # 4,
Casa # 3, Colonia La Mascota,
San Salvador, El Salvador
Teléfono: 011-503-2513-1335
Fax: 613-839-5376
WESA Inc.
3108 Carp Road
P. O. Box 430
Ottawa, Ontario
Canada K0A 1L0
Tel: (613) 839-3053
Fax: (613) 839-5376
4 Cataraqui Street
The Tower, The Woolen Mill
Kingston, Ontario
Canada K7K 1Z7
Tel: (613) 531-2725
Fax: (613) 531-1852
171 Victoria Street North
Kitchener, Ontario
Canada N2H 5C5
Tel: (519) 742-6685
Fax: (519) 742-9810
273 Elm Street
Sudbury, Ontario
Canada P3C 1V5
Tel: (705) 525-6075
Fax: (705) 525-6077
4 Kern Road, Suite 1,
Toronto, Ontario,
Canada M3B 1T1
Tel: (416) 383-0957
Fax: (416) 383-0956
3506 Wiley Road
Suite #302
Yellowknife, NT
Canada X1A 2L6
Tel: (867) 446-2346
Fax: (867) 873-3500
240 – 523 Woodpark Blvd. SW
Calgary, Alberta
Canada T2W 4J3
Tel: (403) 862-9215
Fax: (403) 238-5460
www.wesa.ca


![Richmond Times-Dispatch.(Richmond, Va) 1919-09-07 [p …...Richmond Times-Dispatch.(Richmond, Va) 1919-09-07 [p SEVEN]. Subject: Page from Richmond Times-Dispatch \(newspaper\). [See](https://static.fdocuments.us/doc/165x107/606ef8923fffa51917735731/richmond-times-dispatchrichmond-va-1919-09-07-p-richmond-times-dispatchrichmond.jpg)


