RI Low Resolution Coring/Sediment Samplingpassaic.sharepointspace.com/Public Documents/LPRRP...RI...
314
CV08031a-TC Quality Assurance Project Plan RI Low Resolution Coring/Sediment Sampling Lower Passaic River Restoration Project RI/FS Revision 1, July 18, 2008 Document No.: 12182-003-0220
Transcript of RI Low Resolution Coring/Sediment Samplingpassaic.sharepointspace.com/Public Documents/LPRRP...RI...

CV08031a-TC
Quality Assurance Project PlanRI Low Resolution Coring/Sediment Sampling
Lower Passaic River Restoration Project RI/FS
Revision 1, July 18, 2008
Document No.: 12182-003-0220

Quality Assurance Project Plan RI Low Resolution Coring / Sediment Sampling May 2, 2008 Revision 0
CPG’s Responses to EPA June 13, 2008 Comments June 27, 2008
FIELD SAMPLING PLAN SYSTEMATIC SAMPLING PLAN 1. The proposed coring plan includes systematic coring on transects spaced every half mile
between RM0 and RM1 with three cores per transect. Consequently, the mouth of the Lower Passaic River has a lower coring density than the other sections of the river due to the comparatively large length of each transect. EPA, thru Malcolm Pirnie, Inc., is conducting surface sediment sampling in the mudflats between RM0 and RM1 to support the Source Control Early Action: Focused Feasibility Study. This program will include 11 surface sediment samples arranged in a triangular fashion on the mudflat. EPA recommends that coring locations be established to re-occupy these sampling locations to increase data density on the mudflats. See figures 1 and 2.
Response: Per EPA acknowledgement, this comment has been tabled until the EMBM QAPP Addendum (May 2008) sediment grab data from RM 0 to RM 1 is made available to the CPG.
2. The rationale for a systematic sampling plan between RM1 and RM7 is unclear, especially
since this section of the river has been extensively sampled. Using historic data, the following comments provide direction on the movement of certain sample cores and request additional cores to more fully complete characterization of the sediment.
Response: As stated in the QAPP/FSP Addendum, the sampling is proposed at 1-mile intervals. The following rationale will be added to the QAPP/FSP Addendum for clarification:
1) Refresh surface sediment concentrations, the Passaic River Study Area (PRSA)
sediment data were obtained in 1995
2) Characterize cores that are considered “incomplete” (i.e., cores with elevated concentrations in the deepest segment analyzed). Note that the goals for the two studies differ. The goal for sampling the PRSA (i.e., RM1 to RM7) was to define the 1940 horizon. The RI/FS goal is to characterize sediment to the red brown clay, sand, or refusal. However, where PRSA cores are “complete” (i.e., low concentrations were detected at depth) the CPG will sample from the 2008 sediment-water interface to the sediment-water interface sampled in 1995, including a 0-6inch BAZ sample, with then the agreed upon segment sampling from -6 inches to the 1995 elevation.
20080627 LRC Response to Comments.doc 1

LRC QAPP Response to Comments June 27, 2008 Page 2 of 39
3) Complete RI/FS requirements for determining nature and extent.
3. EPA recommends the movement of stations 15 and 16 downriver to re-occupy TSI cores 201 and 202, respectively, and the movement of stations 33 and 34 upriver to TSI cores 293 and 259, respectively. Station 38 could also be moved downriver to TSI core 268. See figures 3, 8 and 9.
Response: Per discussion with EPA on June 20, 2008, the proposed locations will be retained as planned.
4. EPA recommends that movement of coring station number 21 to TSI 214 which has a high
historical concentration along with an incomplete mercury inventory along. See figure 4.
Response: Comment will be incorporated in the revised plan. 5. EPA recommends the movement of CLRC 022 to the vicinity of former TSI 284, which is
likely more depositional. Also, there doesn't seem to be a reason to locate CLRC 022 and CLRC 023 so closely in the center of the channel. See figure 5.
Response: Comment will be incorporated in the revised plan.
6. EPA recommends the movement of CLRC 030 downriver to re-occupy TSI 243, which has
elevated historical concentrations. See figure 7.
Response: Per discussion with EPA on June 20, 2008, the proposed location will be retained as planned. A new core will be placed in the location of TSI core 243 as requested during the discussion.
7. The rationale for changing the systematic sampling plan from 3 cores per transect from RM0
to RM8 to 2 cores per transect above RM8 is unclear. Please provide further explanation. Sampling may also explore both channel and shoal locations along each transect.
Response: The CPG approach was to obtain data that represent sediment conditions within each transect. Therefore, the CPG used geomorphology data— bathymetry and surface sediment type—to locate proposed samples. In the lower river, the data suggested that three samples per transect were required; whereas, in the upper river, above RM8, two samples per transect could meet the objective. The CPG believes this level of effort is reasonable for this phase of the low resolution coring (LRC) program. Text will be added to QAPP/FSP Addendum to clarify.
8. Above RM13 (stations 78 through 92) and above RM16 (stations 93 through 97), gravel,
cobble, and silty-gravel areas may be encountered. While sediment samples composed of varying combinations of silts, sands, and fine gravel are expected to provide useful data, it is possible that usable samples can be obtained from gravel/cobble areas. The CPG should
20080627 LRC Response to Comments.doc 2

LRC QAPP Response to Comments June 27, 2008 Page 3 of 39
consider adding a probing or another reconnaissance step in these areas prior to attempting core collection. An appropriate location might be identified within the 25-foot target radius identified in Attachment A to the draft FSP prior to attempting to recover vibracores. If an acceptable core cannot be obtained after three attempts (as stated in Attachment A to the FSP), additional vicinity probing prior to departing, in consultation with sediment texture maps, may provide crucial information for recommendation of a new target location within 300 feet. Without careful consideration of sediment texture and probing data, the planned 3 attempts at the original location plus only one attempt each at alternative upstream and downstream locations may not be a robust enough approach to ensure that adequate samples are obtained in upstream areas where sediment types may vary widely.
Response: Comment noted. The CPG’s field effort plans to include one day a week for recon and probing of the next week’s locations. The first week of the LRC program will accommodate this probing effort. The probing will be conducted to ensure obstructions are not present. The purpose of the RI/FS is to determine nature and extent of contamination, not to specifically find small pockets of silt and sand. If a river section is composed of a sediment type that can not easily be sampled, it is important to know this and note it in the RI Report. An RI/FS should document the presence and absence as part of site conditions. It is CPG’s goal to sample all reasonable and acceptable locations. EPA agreed to this approach during our discussion on June 18, 2008. The QAPP/FSP Addendum will be updated to include probing locations before sampling.
ADDITIONAL CORING LOCATIONS EPA and its partner agencies have identified additional locations which should be sampled. The CPG may incorporate these locations, which are identified below, in its upcoming field sampling program or may include them in subsequent sampling rounds. 9. Additional cores are needed along the banks at RM 4 at TSI 240 and TSI 237 and TSI 242.
See figure 6.
Response: Per discussion with EPA on June 20, 2008, these locations will be considered in future mudflat sampling.
10. A transect of corings is needed between former TSI transects 14 and 15, which coincides
with Riverbank Park and has been identified as an area of potential high contaminant inventory based on existing data. Response: The transect with core locations CLRC-030, -031, and -032 will be moved to this location, as requested. However, this area has a bridge and pipeline crossings; exact locations will be determined in the field.
20080627 LRC Response to Comments.doc 3

LRC QAPP Response to Comments June 27, 2008 Page 4 of 39 11. Additional judgmental cores should be positioned in mudflat habitat throughout the Lower
Passaic River, especially at the mouth of tributaries along the east and west bank near RM2 (including the vicinity of the wetland immediately upriver of the western bridge support at RM1.75).
Response: Due to the different goals and Data Use Objectives suggested by this comment, as compared with the LRC program, EPA on June 20, 2008 agreed that this sampling will be conducted in association with FSP1 Task 5.3.6 Mudflat Sampling rather than FSP1 Task 5.3.3, Low Resolution Coring.
OTHER CORING STATIONS 12. Several historical sediment grab samples were collected on both banks of the river near
RM3.1 and RM3.2; some of these locations (e.g., 14SDM and 14SDU) have higher contamination levels than the referenced historical grab 5SDM. Consequently, the positioning of station 26 is unclear, and the rationale for the extended chemistry list is unclear. EPA recommends the movement of station 26 to the opposite bank of the river near the former Diamond Alkali Superfund site. See figure 5.
Response: EPA agreed, on June 20, 2008, to leave station 26 in the proposed location.
13. The rationale for the cores at stations 50 through 53 near Second River and stations 88
through 90 near Saddle River for potential source track down is unclear. These locations are located very close to the confluence of these tributaries and the Lower Passaic River; tidal mixing will likely obscure any local gradients between these station clusters. Stations located above the head-of-tide should be compared to stations in the main stem to assess impacts of these tributaries to the river. See figures 12 and 15.
Response: This comment contradicts comment #17, below. In discussion with EPA on June 20, 2008, CPG explained that historical sediment data may be best represented at the confluence between the Passaic and its tributaries. As a result, EPA agreed to leave these sample locations as proposed.
14. The rationale for the cores at stations 59 and 60 near an unnamed creek for potential source
track down is unclear, especially if no samples are anticipated to be collected in the unnamed creek. EPA recommends that these stations be moved upriver. Tidal mixing will likely obscure any unique contaminated signature associated with a potential source on the unnamed creek. See figure 14.
Response: See response to comment #13. In addition, as discussed with EPA on June 20, 20008, the CPG will add a sample location above the head of tide in the unnamed creek. A reconnaissance will be performed during the field program to determine a proposed location which will be discussed with EPA prior to collection.
20080627 LRC Response to Comments.doc 4

LRC QAPP Response to Comments June 27, 2008 Page 5 of 39 15. The proposed sampling plan includes re-occupying 5 of the 2008 low resolution cores
collected by Malcolm Pirnie, Inc. (e.g., cores 2, 5, 10, 14, and 17). The rationale for selecting these locations is unclear.
Response: Where the transect samples were on, or close to, the 2008 EMBM cores, the locations were included for sampling. This is intended to determine, more precisely, the vertical distribution of contaminants in the sediment column because the 2008 EMRM cores were segmented into only two samples: a 6-inch surface sample and a composite sample of the remaining core length. This rationale will be clarified in FSP Addendum Table 1 and Worksheet #18.
16. The sampling plan rationale above Dundee Dam is unclear and needs to address the potential
for changing field conditions since sediment types are unknown. EPA recommends a field reconnaissance be conducted prior to coring and a contingency plan be developed.
Response: As discussed with EPA on June 18, 2008, EPA indicated that the addition of limited probing would address this comment. The QAPP/FSP Addendum will be updated to clarify the sampling plan rationale consistent with the response to comment #8.
17. Table 1 indicates that proposed low resolution cores on Second River, Third River, and
Saddle River will be positioned below the head-of-tide. However, the maps on Figure 2-I indicate that one core will be positioned above the head-of-tide and two cores will be positioned below the head-of-tide. It is important to collect cores above the head-of-tide, below the head-of-tide, and at the confluence with the Lower Passaic River to investigate potential gradients along the tributaries. Field notes have been provided to the CPG to assist in the selection of suitable coring locations based on our 2007-2008 field reconnaissance efforts on these tributaries.
Response: The tables and figures have been updated. As discussed with EPA on June 20, 2008, the tributary sampling will be revised as requested in this comment. Note, the sample at the confluence may be moved downstream to ensure a sample can be collected based on sediment type. The locations will be field determined and discussed with EPA prior to collection.
TARGET DEPTHS 18. Low resolution cores collected in 2006 by Malcolm Pirnie, Inc. showed that the underlying
sand layer is contaminated with mercury and polycyclic aromatic hydrocarbon (PAH) compounds. Consequently, all proposed 2008 low resolution cores should penetrate the underlying sand layer/red-clay layer (or refusal). Also, the underlying sands should be sampled and analyzed.
Response: The goal for core collection is to reach the red brown clay layer, sand, or refusal, as stated in the AOC/SOW. This may not be achievable in the upper parts of the river where
20080627 LRC Response to Comments.doc 5

LRC QAPP Response to Comments June 27, 2008 Page 6 of 39
finer-grained sediments (e.g., silt, silt and sand, and sand) may not be encountered at all locations. Limited sampling to include analysis of PAHs, metals, cyanide, SVOCs, TEPH, TOC, grain size, and volatiles will be performed where sand is encountered at the bottom of the core, as agreed with EPA on June 18, 2008 and via e-mail from EPA on June 20, 2008. As agreed to with EPA, the analytes will be taken out of the primary core only, so all analytes may not be achievable in all samples. In addition, in a follow up e-mail from Mr. Len Warner, Malcolm Pirnie (MPI), on June 20, 2008, MPI suggested that a small subset of the samples from the sand layer (even under a significant depth of fine-grained sediment) be analyzed for a larger suite of contaminants (including pesticides and PCBs) for verification of the characterization of the apparent product contamination in the sand layer. The CPG does not plan to do this additional analysis at this time.
19. The rationale for the target depths for stations 36 and 37 is unclear (e.g., transition from silt
to gravel is 10 feet). Please clarify why this depth was selected. Moreover, station 35 in this transect is classified differently and has a target depth of 5 feet. Station 35 should penetrate to similar depth as the other cores in the transect or more clarification on coring rationale should be provided.
Response: The UFP-QAPP requires an estimate of the total number of samples (Worksheet #20). The target depth was estimated for each location in order to estimate a reasonable number of samples for the program. The estimated target depth was determined by reviewing available core logs and MPI probing data, which included depth to refusal. The cores will be collected to the red brown clay layer, sand, or refusal. The target depth of 5 feet applies to eight of the proposed locations where the transect fell on a PRSA core that was considered complete. The recently deposited sediment will be sampled (core is not estimated to be longer than 5 feet). FSP Addendum Table 1 and Worksheet #18 will be revised to more clearly state the sample segmentation for this subset of samples.
20. Geotechnical borings at RM16 indicate silty-gravel at the surface and refusal at 2 feet. More
explanation on sampling approach is needed for cores in this area (e.g., stations 91 and 92) that are anticipated to extend 6 feet. Similarly, geotechnical borings at RM14 indicate a heterogeneous mix of gravels and sands with refusal at less than 5 feet. The proposed cores in this area (stations 83 and 84) are anticipated to extend 8 feet. Although the 2008 low resolution cores in fine-grained sediment deposits between RM8 and RM14 yielded recoveries up to 9.5 feet of sediment, a contingency plan for these proposed target depths may be needed.
Response: See response to comment #19 above; no change necessary.
20080627 LRC Response to Comments.doc 6

LRC QAPP Response to Comments June 27, 2008 Page 7 of 39 21. Several target depths listed in Table 1 may be too shallow (based on historical data or nearby
geotechnical borings) to characterize the depth of contamination. The CPG should anticipate collecting deeper cores before penetrating the underlying sand layer/red-clay layer. Table A below lists cores and corresponding target depths that may be too shallow.
Table A: Stations with Shallow Target Depths Coring Station CPG Estimated
Target Depth Evidence from Historical Cores or Geotechnical BoringSuggesting that Target Depth is Shallow
Stations 1, 5, and 9 10 feet Station 13 at RM0.75 (near geotechnical boring 1A-B) indicates a target depth of 18 feet. In addition, a comparison of the 2004 bathymetric survey and the authorized depth ofthe federal navigation channel suggests that approximately 15feet of sediments may have deposited in portions of thechannel between RM0 and RM1 since maintenance halted(refer to the Conceptual Site Model, Malcolm Pirnie, Inc., February 2007).
Station 19 5 feet A nearby geotechnical boring indicates 10 feet of silt, andmercury contamination in TSI core 208 extends greater than15 feet.
Station 30, 31, and 32 5 feet Historical mercury contamination from the TSI cores extends to 14 feet. Low resolution cores (LR05 and LR10) collectedby Malcolm Pirnie, Inc. also indicate that mercurycontamination extends to the underlying sand layer.
Station 40, 41, and 42 5 feet TSI cores 273, 274, and 275 indicate that mercury contamination is greater than 5 ppm at a 5-foot depth. Note that the 2005 low resolution core (LR08) also indicated acontaminated underlying sand layer.
Stations 43 through 52 8 feet The authorized depth of the former navigational channel was 16 feet.
Station 67 6 feet The high resolution core at RM11 (HRC29A) penetratedapproximately 8 feet.
Station 74 3 feet The high resolution core at RM12.6 (HRC32A) penetrated 6feet.
Response: See comment response #19. TABLE 1 TERMINOLOGY 22. The geomorphic region for station 24 is identified as a “channel, dredge area.” This
identification may be incorrect since only station 25 is located in the 2005 Environmental Dredge Pilot Study area. Please clarify the reference to “dredge area.”
Response: Comment will be incorporated in the revised plan. Revised Response: Station 24 is located in the side channel, not dredge area. Edit was made to Table 1 and Worksheet #18.
23. For several stations, the rationale for the target depth is labeled “recent seds only” (e.g.,
stations 40, 41, and 42). This terminology is unclear, especially if the siting rationale states that the proposed coring location is intended to confirm the nature and extent of
20080627 LRC Response to Comments.doc 7

LRC QAPP Response to Comments June 27, 2008 Page 8 of 39
contamination. All proposed 2008 low resolution cores should penetrate to the underlying sand layer/red-clay layer (or refusal), and the underlying sands should be sampled.
Response: See comment response #19.
24. For several stations, the rationale for the target depth is labeled “refusal” (e.g., stations 43,
44, 45, and 49). All proposed 2008 low resolution cores should penetrate to the underlying sand layer/red-clay layer (or refusal), and the underlying sands should be sampled.
Response: The column information will be updated to indicated that the low resolution cores will penetrate to the underlying sand layer/red-clay layer (or refusal), and the underlying sands and will be sampled and analyzed for PAHs, metals, cyanide, SVOCs, TEPH, TOC, grain size, and VOCs. As agreed to with EPA, the analytes will be taken out of the primary core only, so all analytes may not be achievable in all samples.
25. The rationale for the target depth at station 74 is unclear (i.e, “HRC complete”) since this
high resolution core (HRC32A) penetrated to refusal in the underlying sand layer. Please explain.
Response: Text will be modified to indicate that the high resolution core was completed.
TABLE 2: ANALYTE LIST 26. Table 2 provides a proposed analytical list for the 2008 coring program. Analytes in Group
B and Group C will only be reported for select coring stations in the 0-6 inch sediment sample. The rationale for selecting these coring stations is unclear – it appears that stations positioned near combined sewer overflow (CSO) sites or stations co-located with historical cores (e.g., station 67) were selected. Further rationale for these locations should be provided on these locations in Table 1 or 2.
Response: CPG will provide further rationale in the text of the QAPP/FSP Addendum. For Group B analytes, sample locations were selected by reviewing the sample maps to ensure coverage within the full length of the river, with a focus on areas of finer-grained sediments, and review of station details in terms of depths and expected sediment type. Group C samples will be determined based on lab screening as discussed in comment response 78.
27. Between RM0 and RM1, only station 1 is designated for an extended chemistry list. This station is located in the channel; consequently, the mudflats near Kearny Point will not be tested for the extended chemistry list. Another location in the mudflats near Kearny Point is needed for the extended chemistry list.
Response: The CPG will add one more station in this area at 2008 CLRC-007 for extended chemistry (Group A, B, and C).
20080627 LRC Response to Comments.doc 8
LRC QAPP Response to Comments June 27, 2008 Page 9 of 39
Additional locations will be added as part of the mudflat sampling task (FSP1 Task 5.36), rather than with the Low Resolution Coring (FSP1 Task 5.3.6).
28. More rationale should be provided regarding why only 12 core tops are designated for Group
B analyses. This sample size yields an insufficient number of methylmercury and AVS/SEM samples.
Response: As discussed with EPA on June 18, 2008, the purpose of these samples is to determine the relevance of these analytes for future investigations. EPA agreed to the 12 proposed sample locations.
29. The list of alkyl PAH compounds is ambiguous; which compounds will be analyzed?
Response: The alkyl PAHs are summed as a homolog group. All the specific isomers within the group are unknown and it is not the purpose of the analysis to characterize them individually. Due to the complexity of the isomer mix and the limited availability of isomer-specific reference materials, it is not possible to analyze every isomer separately.
OTHER CONCERNS 30. The maps presented in Figures 2A-F and the information in Table 1 occasionally contradict
each other. For example, stations 23 and 24 on the map identify different co-located cores than those cores mentioned in Table 1. The rationale for station 30 appears to contradict the location on the map.
Response: The transcription error at stations 23 and 24 will be corrected, in addition figures and tables will be checked closely prior to submittal to EPA for approval.
FINE SEGMENTATION SAMPLING FOR RISK ASSESSMENT AND MODELING The following locations identify eight coring locations for collecting finely segmented core top samples to support the risk assessment and modeling efforts. These locations should replace those locations discussed during the conference call on May 27, 2008, between EPA, and de maximus. Note that the results of these samples will be a subset of the full fine segmentation effort. In order to properly characterize the entire study area, additional samples will be needed.
o Core 2008-CLRC-078 should be relocated to RM13.23 since it appears to be currently located in a rock and gravel area. Alternately, the CPG could locate an additional core at RM13.23
Response: As discussed with EPA on June 20, 2008, core 2008-CLRC-078 will be relocated to RM13.23.
o RM10 – Core 2008-CLRC-062. (RM10 has some of the highest detected surface
sediment dioxin concentrations.)
20080627 LRC Response to Comments.doc 9

LRC QAPP Response to Comments June 27, 2008 Page 10 of 39
Response: Comment will be incorporated in the revised plan.
o RM7.5 – Core 2008-CLRC-047.
Response: Comment will be incorporated in the revised plan.
o RM5.3 – Core 2008-CLRC-034.
Response: Comment will be incorporated in the revised plan.
o RM4.5 – Locate a core at RM4.5 at former TSI 243.
Response: Comment will be incorporated in the revised plan. o RM3.5 – Core 2008-CLRC-028.
Response: Comment will be incorporated in the revised plan.
o RM2.6 – The proposed coring locations (2008-CLRC-022 through 024) seem to be co-
located with historic TSI cores 222-224. A finely segmented core should be collected at TSI 223.
Response: As clarified by EPA on June 20, 2008, the requested location is -022. Comment incorporated.
o RM1.5 – Core 2008-CLRC-019.
Response: Comment will be incorporated in the revised plan.
Response: At the meeting with EPA on June 18, 2008, the CPG requested consideration of the use of a box corer for this data collection. The box corer will reliably collect 20 inches of sediment. With the extensive analyte list, this is the best collection device to use for obtaining sufficient sample volume. EPA approved the use of a box corer. The deepest segment identified by EPA for collection was 30 cm to 2 feet. The bottom depth of these eight locations will be clearly identified when they are less than 2 feet (where the fifth segment is not collected as deep as requested). EPA agreed this was an acceptable approach. Note, as agreed to with EPA, the objective of the program is to sample potentially erosional areas to determine if there is fine scale vertical variation in sediment properties and contamination.
20080627 LRC Response to Comments.doc 10

LRC QAPP Response to Comments June 27, 2008 Page 11 of 39 Quality Assurance Project Plan General Comments 31. Introduction, page 3 (and elsewhere in the QAPP and appendices). The CPG is proposing to
use a modified Van Veen grab sampler to collect a surface sediment sample at each sampling location. The grab sample will provide a 0-1 inch segment for the analysis of beryllium-7 (Be-7), which is an acceptable approach; however, the CPG is also proposing to collect a 0-6 inch sediment sample with the Van Veen grab sampler, which would replace the 0-6 inch segment from the corresponding low resolution sediment core for chemical analysis. The 0-6 inch segment from the corresponding low resolution core would be discarded and the core would be processed from 6 inches to the core bottom. This core processing approach is flawed because low resolution cores should be processed in a continuous fashion from the core top to the core bottom. Grab samples should only be used for the collection of surface sediment for beryllium-7 analysis. The QAPP should be revised so that the most significant chemical parameters are collected continuously from the sediment core, from the surface to the target depth/refusal, with consideration of analytical volume requirements.
Response: As discussed with EPA on June 18, 2008, the use of a vibracorer for surface samples is listed as a disadvantage according to EPA guidance (Appendix E—Methods for Collection, Storage, and Manipulation of Sediments for Chemical and Toxicological Analyses: Technical Manual 2001), as the surface is disturbed in the vibracoring process. Because it is not one of CPG’s DQOs to date the cores, the CPG proposed to continue using the grab sampler. EPA stated their concern with the sediment grab sample being disconnected from the core and that they would prefer the CPG prioritize the analyte list to maximize the key analyte collection out of the core with the remainder out of the grab sample. The CPG agreed to do this. CPG and EPA further agreed to use the Phase II Newark Bay RI/FS Work Plan Table 6-6 as the base for this prioritization. On June 20, 2008 via e-mail from Len Warner, EPA provided a suggested prioritization of analyses from the 0-6 inch core sample, as shown below:
1. Radionuclides Cs-137, Pb-210 and K-40 2. Dioxins/Furans 3. PCB Congeners and PCB Aroclors 4. HR Pesticides (EPA suggested the CPG not perform Method 8081A Pesticides on 0-6
inch segment) 5. Hg 6. SVOCs and PAHs 7. TAL Metals and Titanium 8. Herbicides 9. Cyanide 10. TEPH 11. Butyltins 12. VOCs
20080627 LRC Response to Comments.doc 11

LRC QAPP Response to Comments June 27, 2008 Page 12 of 39
13. Total Sulfide 14. Grain Size 15. Specific Gravity 16. Bulk Density 17. Atterberg Limits 18. Be-7 (always collected from co-located grab sample)
The CPG has reviewed this suggested prioritization and will comply with it, a table has been added as attached to address this prioritization. Method 8081A pesticides will not be completed on the 0-6” samples. It was agreed by all that the list of analytes from the core would vary due to the varying moisture content which affects the available sample volume. It was noted by all that the list of analytes from the core will be flexible as the moisture content affects the available sample volume. The CPG will make best effort to keep the core(s) and grab samples at a location within 10 feet of each other with the same sediment type.
Note, a second core will also be necessary to obtain sample mass needed for the 1-foot intervals. The above prioritization will be used for this section as well. To investigate the lateral heterogeneity, the CPG would recommend adding copper and nickel analysis to all locations in the one core, and the grab.
32. Acronyms. Please revise the document to ensure that the acronym list is complete and that
each acronym employed is spelled out in the text or tables at the first use.
Response: Comment will be incorporated in the revised plan. 33. Worksheets 12 and 28. Many of the terms and limits provided in these tables do not
correspond as they should. The terms and acceptance limits in Worksheets 12 and 28 must be revised to be internally consistent. Examples are highlighted in the specific comments. The Measurement Performance Criteria and QC Sample tables should also reflect the QC acceptance limits given in the referenced analytical SOPs and USEPA methods.
Response: Comment will be incorporated in the revised plan; however, note that the QC limits in the analytical methods or USEPA methods may be superseded by project-specific QC limits if the project-specific limits are more stringent.
34. Radiological Data. The QAPP should be revised to state that error bars on the radiological
data will be provided in the final data package.
Response: Comment will be incorporated in the revised plan. 35. To meet the analytical demands of the project, samples will need to be split among many
individual laboratory facilities (five lab subcontractors are listed and two have multiple facilities; CAS has three facilities and Test America has seven). The SOP for Core Processing, LPR-S-O4, does not contain nearly enough guidance to aid the field technicians
20080627 LRC Response to Comments.doc 12

LRC QAPP Response to Comments June 27, 2008 Page 13 of 39
in the logistical challenges associated with providing “representative aliquots” to each of the designated facilities within 24 hours of sampling.
Response: Per discussion with EPA on June 18, 2008, this information, while important, is not typically included in SOPs due to their program-wide nature. The field facility staff will be provided with written guidelines on the containers and sample volumes needed for each laboratory involved in the LRC sampling effort.
Specific Comments 36. Introduction, page 3. Include a reference to Appendix D.
Response: Reference to Appendix D is included on Page 4 with the Group C analytes. No change is necessary.
37. QAPP Worksheet 2, QAPP Identifying Information, page 10. The required information
column of this worksheet indicated that the streamlining data review information will be completed following data evaluation. However, this information should be completed in the appropriate worksheet along with the rationale behind streamlining the data review process.
Response: Per discussion with EPA on June 18, 2008, it was agreed that addition of the requested information is not appropriate at this time. Streamlining the data may be appropriate for future data presentation and in the Site Characterization Report. No change is necessary.
38. Worksheet 4. Include a blank sign-off sheet to be employed by assigned team members to
document that they have read the applicable sections of the QAPP/FSP.
Response: Comment will be incorporated in the revised plan. 39. Worksheet 4, Project Personnel Sign-Off Sheet. Each of the laboratories should review and
sign off on the QAPP as a final check regarding their commitment.
Response: Comment will be incorporated in the revised plan. Revised Response: Will be sent after finalized and distributed. Signed Worksheet #4 will be submitted under separate cover.
40. Worksheet 10. Add a 5th bullet to highlight the “Need to understand how shallow shoreline
habitat sediment may differ from depositional and erosional locations along the main stem of the river.” A 4th station is recommended at the shallow end of 10-12 transects spread from RM0-15 to produce a sufficient number of cores to characterize these habitats and allow an evaluation of whether pertinent risk assessment exposure point concentrations ought to be derived from main stem core results.
20080627 LRC Response to Comments.doc 13

LRC QAPP Response to Comments June 27, 2008 Page 14 of 39
Response: EPA agreed, during our discussion on June 18, 2008, that this comment will be addressed in association with FSP1 Task 5.3.6 (mudflat sampling) and will most logically be implemented with the grab sampling in FSP2.
41. QAPP Worksheet 12. The worksheets should also include the criteria associated with
analysis for the water matrix and the sediment associated with Group C samples that will be used towards the development of a project specific method for sediment/pore water coefficients for PCB.
Response: Please see response to comment #149. Revised Response: There was a typo in the comment response, it should have referenced #148. There is no change necessary.
42. Worksheet 12, pages 32-56. In general, the measurement performance criteria listed in the
Worksheet 12 and 28 tables are not consistent. Evaluate and revise these to be consistent. Some specific comments follow.
Response: Comment will be incorporated in the revised plan.
43. Worksheet 12, page 30. “Contamination” is listed as a DQI for method blanks and field
blanks, while the corresponding DQI in Worksheet 28 tables appears as “Accuracy/Bias- Contamination”. Revise the blank DQI entries to “Accuracy/Bias” or “Accuracy/Bias-Sensitivity”. Also revise the terminology used for DQIs to be consistent throughout the Worksheet 12 and 28 tables.
Response: Comment will be incorporated in the revised plan. “Accuracy/Bias” will be used.
44. Worksheet 12, pages 30- 56. Revise the “Completeness” Measurement Performance Criteria
to be 95% instead of 90% in all the applicable Worksheet 12 tables.
Response: Region 2 CERCLA guidance does not specify a required completeness objective. The MPI 2005 QAPP includes 95% completeness for field sampling and 90% for analytical completeness. These completeness goals will be adopted for the LRC program. The completeness discussion in Worksheet 37 will also be expanded to include field completeness.
45. Worksheet 12, pages 30-56. Performance Evaluation Samples are specified as QA samples.
Please provide the EPA with additional information on the proposed Performance Evaluation Samples including a list of the individual parameters in these samples and the acceptance limits.
Response: This information cannot be included in the QAPP because the labs get the QAPP. It will be sent to EPA as a separate submittal. EPA also requested on June 18, 2008 that the certificates be included; certificates will be provided.
20080627 LRC Response to Comments.doc 14

LRC QAPP Response to Comments June 27, 2008 Page 15 of 39 46. Worksheet 12, page 30. The measurement performance criterion for the Laboratory Control
Sample is listed as “compound-specific, approximately 70-130%”. This is not consistent with the “60-140% , Compound Specific” QC acceptance limits for the Laboratory Control Sample listed in Worksheet 28, QC Samples Table, on page 151. Reconcile and revise the acceptance limits given in the Worksheet 12 and 28 tables for the Laboratory Control Samples to be consistent. Also ensure that the limits given in all Worksheets 12 and 28 tables are consistent and reflect the acceptance criteria in the EPA methods referenced in the lab SOPs in Appendix C.
Response: Comment will be incorporated in the revised plan. Please refer to Comment 33 regarding the agreement of the QC limits with the EPA methods.
47. Worksheet 12, footnote “d”. The footnote states the “Analyte specific limits may be found in
Appendix C.” Revise this note for each analytical group table to specify the SOP or method reference with the section, page and or table number where the referenced acceptance limits can be found.
Response: Comment will be incorporated in the revised plan.
48. Worksheet 12, page 32. For PAHs, evaluate and reconcile the differences in the acceptance
criteria given in Worksheet 12 and Worksheet 28, page 155, for “Pre-extraction internal standards” (60-140% vs. 30-120%). Also resolve the difference between the limits given for the “Laboratory Control Standard” in these tables.
Response: Comment will be incorporated in the revised plan.
49. Worksheet 12, page 33. For the Organochlorine Pesticides (GC/ECD), surrogates are not
listed in this table as a QC yet they are listed in the corresponding Worksheet 28 on page 157. Evaluate and revise to be consistent.
Response: Comment will be incorporated in the revised plan.
50. Worksheet 12, page 34. For the Organochlorine Pesticides (HRGC/HRMS), the table
includes a Laboratory Control Sample with recovery limits. The corresponding Worksheet 28 table on page 159 indicates that the Laboratory Control Standard is also an Ongoing Precision and Recovery Sample. If this standard will be employed to track precision then precision limits should be given or referenced. In addition, the measurement performance columns in Worksheets 12 and 28 for Organochlorine Pesticides (HRGC/HRMS) are not consistent and need to be reconciled.
Response: Comment will be incorporated in the revised plan.
20080627 LRC Response to Comments.doc 15

LRC QAPP Response to Comments June 27, 2008 Page 16 of 39 51. Worksheet 12, page 37. For Herbicides, the Matrix spike recovery is unusually broad (10%-
120%). Please determine if the lab can tighten these limits and revise the document appropriately.
Response: The CPG will discuss this further with the lab; however, these are the limits provided by the lab. The analysis of herbicides is notoriously difficult. Revised Response: Received revised control limits from lab; recovery limits are down to 10% for individual analytes as previously reported. No change
52. Worksheet 12, page 40. For Radiochemistry, evaluate and revise as appropriate the
acceptance criteria and limits given in this table with those in Worksheet 28, page 169 and the lab’s SOP to ensure that they are appropriate and consistent.
Response: Comment will be incorporated in the revised plan.
53. Worksheet 12, page 43. For Mercury, the Method Blank criteria are not consistent with the
acceptance limits in Worksheet 28, page 172. Please evaluate and revise to be internally consistent.
Response: Comment will be incorporated in the revised plan.
54. Worksheet 12, page 47. For General Chemistry – AVS/SEM, this table does not include the
Laboratory Control Sample (LCS) acceptance limits for metals. Provide the LCS acceptance limits in a revised table.
Response: The LCS limits for the metals associated with the AVS/SEM analysis should be the same as those for routine ICP/Mercury LCS values. Comment incorporated.
55. Worksheet 13. Please revise the stated data limitations in consultation with EPA. Almost all
USEPA/Malcolm Pirnie, Inc. programs have listed limitations while CPG data is categorized as usable without limitation. For example, the CPG incorrectly states that the Newark Bay Phase I dataset has no limitations – on the contrary, analytical problems rendered much of the pesticide data as non-detect.
Response: Comment will be incorporated in the revised plan. Revised Response: Limitations addressed in Worksheet 13 are not data use limitations but rather qualifications to data sets. A statement was added to each entry where this is applicable.
56. Worksheet 14, Summary of Project Tasks, Page 61 of 240, Third Paragraph. The proposed
reduction in segment length due to observation of a different sediment texture should not result in an alteration of the segmentation scheme. For comparability between stations, maintaining the segmentation scheme at each coring location is desirable and it is therefore preferable to subsample the segment if there is an obvious change in sediment within a
20080627 LRC Response to Comments.doc 16

LRC QAPP Response to Comments June 27, 2008 Page 17 of 39
segment. This comment applies to this issue throughout the QAPP as well as Attachment 1, Data Quality Objectives, and Appendix A, Field Sampling Plan.
Response: As discussed with EPA on June 18, 2008, the CPG is concerned that, in most cases, the sample volume may not be sufficient to subsample and that this information would not be known until the core is processed. It was agreed that the existing QAPP/ FSP Addendum text is sufficient; no change is necessary.
57. Worksheet 15 should be checked for inconsistencies (e.g., method references SW 8082 vs.
SW 8082A).
Response: Comment will be incorporated in the revised plan.
58. Worksheet 15. The limits appear low for sediment and need to consider the high water content of this matrix.
Response: As discussed with EPA on June 18, 2008, the CPG has certainly considered the high water content and attempted to get accurate information on the typical percent moisture levels encountered by others. For the Worksheet 15 limits, the CPG can only report the best limits the lab estimates it can achieve with a full understanding of the moisture and matrix issues they are likely to encounter with these samples. EPA agreed that no change is necessary.
59. Worksheet 15. Phosphorus is reported in aqueous units (mg/L) but there is no information
provided on how the aqueous extract will be collected. The SOP included in Appendix C (L-26) references Method 365.3 which specifies a 10 gram soil aliquot but does not detail the procedure for a soil/sediment extraction.
Response: The laboratory has been requested to add more detail to its SOP.
60. Worksheet 15. The reporting units provided on the worksheets (e.g., mg/kg) do not provide
reference to “wet” or “dry” weight. All sample size estimates need to consider the dry weight correction (expecting an average of 50% solids). Worksheet #19 includes a footnote regarding the need for additional sample to meet dry weight reported project quantitation limits. Worksheet #23 notes the modification with increased aliquot size to achieve the DQLs. When cleanup procedures are proposed (e.g., GPC in L-15), the sample size required may be altered (e.g., GPC cleanup can increase the reporting limit twofold unless the extract concentration procedures are modified).
Response: Worksheet #15 should have been referenced as dry weight and will be revised accordingly. The CPG is aware of the moisture issue, but would prefer not to estimate the reporting limits based on an average moisture level. EPA agreed on June 18, 2008 to this approach. The laboratory cleanups, such as GPC, will not cause any analytical losses requiring reporting limit adjustments. The comment about cleanup above has been addressed with updated methods and is no longer relevant.
20080627 LRC Response to Comments.doc 17

LRC QAPP Response to Comments June 27, 2008 Page 18 of 39
Revised Response: The original response was incorrect. The worksheet should have referenced wet weight which is now included.
61. Worksheet 15. If the sediment units are to be expressed on a dry weight basis, each of the
facilities processing samples need to do their own in-house moisture determination. The QAPP includes SOPs (L-40 and L-43) from only two laboratories.
Response: Agreed. CPG will obtain specific percent moisture SOPs from other labs.
62. Worksheet 15.Final dry weight reporting limits for ammonia and phosphorus can be calculated knowing the initial weight of sediment extracted and the percent solids of the representative aliquot.
Response: Comment will be incorporated in the revised plan.
63. Worksheet 15. Please include a description of the considerations for optimization of
detection limits for those methods that do not meet the project quantitation limit goals (e.g., larger sample size, extra cleanup/concentration, etc.). With the exception of the comment included on Worksheet #23 for L-3, no direct reference to increasing sample size is listed in the QAPP. Two other SOPs include reference to sample size adjustments (L-7 Section 2.2.3 and L-11 Section 1.1.2).
Response: Comment will be incorporated in the revised plan. The information will be added to Worksheet 15.
64. Worksheet 15. In the discussion of Group A COPCs, it states that toxaphene will be analyzed
by two different methods but it is not clear whether the full complement will be reported for each method. How will the data user know which result is most appropriate? There is also a possible error on page 78 where both the MDL and the QL are identical. The SOP for his method states 0.010 mg/kg as the QL. Page 80 includes the same detail; if this is correct, then the HRGC/HRMS appears to also report at 0.010 mg/kg. If both methods have the same reporting limits, it is unclear why both methods are proposed.
Response: As discussed with EPA on June 18, 2008, the CPG will report all pesticides using both methods. The HRMS method may provide more accurate compound identification than the GC/ECD technique in complex matrices. The method is more sensitive and less subject to noise from interferences. The CPG will review this comment with the most current versions of the lab SOPs and respond or clarify. Revised Response: As discussed with EPA on June 18, 2008, the CPG will report the same target analyte pesticides using both methods. The HRMS method may provide more accurate compound identification than the GC/ECD technique in complex matrices. The HRMS method is generally more sensitive and less subject to interferences, however for toxaphene the sensitivity is limited by calibration with a complex mixture and the highly fragmented mass spectra of the polychlorinated bornane components. The specificity of the HRMS method for accurate toxaphene detection should be better than GC/ECD even if the sensitivity is roughly the same.
20080627 LRC Response to Comments.doc 18

LRC QAPP Response to Comments June 27, 2008 Page 19 of 39 65. Worksheet 15. The footnote states that the actual EDLs will be reported for PAHs and alkyl
PAHs rather than the QLs. It is unclear why the table includes only QLs for the alkyl naphthalenes.
Response: See response to comment #29. The CPG will review the worksheet and footnote and clarify as needed. Revised Response: There are no reference standards used for the homolog PAH groups. Therefore, there are not official QLs for these groups. No change to QAPP necessary.
66. Worksheet 15. For VOCs by 8260B:
a. The SW 5035A reference should be added that will allow low level reporting. b. The footnotes say that 1,4-dioxane will be analyzed by Method 8270. The reporting
details included may be incorrectly from the semivolatile method. 1,4-dioxane is not included in the target compounds listed for Method 8270C.
Response: a) The values in Worksheet 15 are based on low-level reporting. Reference to method 5035Awill be added. b) Determination of 1,4-dioxane from the SVOC method is believed to be more technically sound; this compound is frequently rejected from the VOC run due to low response factors.
67. Worksheet 15. For TPH-purgeables, add reference to SW 5035A.
Response: Comment will be incorporated in the revised plan. 68. Worksheet 15. For metals:
a. MDLs and IDLs are not typically the same. Confirm the most appropriate header. b. SW 6010B and 6020 are both referenced for the hardness metals. c. The detail appears to be from an ICP run; please remove the ICP/MS reference. d. MDLs and MQLs for some metals are the same; please check.
Response: Comment will be incorporated in the revised plan. Revised Response: a) The analytical methods list IDLs. The MDL reference is removed from this worksheet. b) The reference to 6020 for these metals have been removed. c) Adjusted worksheet to show which method MDLs and QL are from. d)This is consistent with the data provided by the lab.
69. Worksheet 15. The values provided in the reference limit tables should be presented in consistent units to those given in the applicable lab SOPs in Appendix C. Currently, all the units are expressed in exponential notation and some of the significant figures given appear to differ from those given for the reporting limits in the applicable lab SOPs. This comment applies to all of the Worksheet 15 tables.
Response: Comment will be incorporated in the revised plan.
20080627 LRC Response to Comments.doc 19

LRC QAPP Response to Comments June 27, 2008 Page 20 of 39 70. Worksheet 15. Revise the second sentence in Worksheet 15, footnote a, “DQLs are very
conservative, generic analytical goals used solely for the purpose of evaluating laboratory analytical methods and achievable laboratory limits; these are not project-specific screening levels or preliminary remediation goals.” to state the following: “DQLs are analytical goals listed solely for the purpose of evaluating laboratory analytical methods and achievable laboratory limits; these are not project-specific screening levels or preliminary remediation goals and are not approved by the USEPA as the appropriate risk assessment criteria for this project”. Make this change in all the applicable worksheet 15 tables.
Response: Comment will be incorporated in the revised plan.
71. Worksheet 15, Reference Limits. The CPG references the Lower Passaic River Restoration
Project 2005 QAPP (prepared by Malcolm Pirnie, Inc.) for their analytical reporting limits (RLs) and project quantitation limits (QLs); however, the achievable laboratory limits for many contaminants across the various chemical classes are higher than the RLs and QLs.
Response: As discussed with EPA on June 18, 2008, the CPG reviewed the limits requested by the risk assessors and those listed by MPI in the QAPP/FSP Addendum for Lower Passaic River Restoration Project Empirical Mass Balance Evaluation (December, 2007) and asked the labs to attempt to reach the lower of those two limits for each analyte. In some cases, the lab felt those limits could not be achieved in light of the high percent moisture and likely matrix interferences that would be encountered. If the limits provided by the lab were higher than the goals, the lab limit was highlighted in the worksheet.
72. Worksheet 15, page 81, PAHs. Benzo [j] fluoranthene is not listed as an analyte. Please ask
the lab to determine if this compound co-elutes with another compound such as Benzo[k] fluoranthene. If so please list it as a co-eluting compound.
Response: This compound was not in the 2005 MPI Quality Assurance Project Plan, but was apparently added in the December 2007 QAPP/FSP Addendum for Lower Passaic River Restoration Project Empirical Mass Balance Evaluation as benzo(j,k)fluoranthene. The CPG will explore the addition of this analyte with the lab; it likely will co-elute with benzo(k)fluoranthene. CPG will confirm with TestAmerica and add as appropriate. Revised Response: Per confirmation from the lab, benzo j and k co-elute, this was added to Worksheet 15.
73. Worksheet 15, pages 75-76. If available, please include in the table or footnotes the range of
estimated sample specific reporting limits for the Dioxins/Furans which the lab anticipates that they can achieve based upon their experience analyzing similar sediment samples.
Response: The lab has been requested to respond to this comment.
20080627 LRC Response to Comments.doc 20

LRC QAPP Response to Comments June 27, 2008 Page 21 of 39 74. Worksheet 16, page 104. Add entries describing the deliverables in the “Deliverables”
column for all the activities including “Collection of Samples and Submission for Analysis,” “Laboratory Analysis” and “Evaluation of Sample Data.”
Response: Comment will be incorporated in the revised plan. Note that this table will also be updated to reflect the schedule based on EPA’s approval.
75. Worksheet 17. The text states that “2-foot segments continue to the red-brown clay layer,
sand, or refusal.” It should be clarified throughout the document that the target sand layer is a layer that completely underlies the recent, contaminated, fine-grained sediments to distinguish it from a potential shallow sand lens that could be encountered. A sample should be collected from this sand layer for analysis, as contamination was encountered in this stratum in the 2005-2006 coring efforts.
Response: See comment response #18.
76. Worksheet 17, Sampling Design and Rationale. While it is understood that the surficial
sample (0 – 0.5 ft) will be collected from the grab sample, consideration should be made to initially save the 0-0.5 ft segment of the corresponding Vibracore sample. This is for the case when there is a need for additional sample volume to meet the required minimum as outlined in Worksheet #19.
Response: This comment contradicts comment #31; EPA indicated this comment should be disregarded.
77. Worksheet 18. Revise the QAPP to provide data on ranges of water depths in the proposed
sampling areas so that EPA can verify that there are sufficient samples proposed to evaluate specific risk scenarios, such as exposure of piscivorous and invertivorous wading birds at mudflat locations.
Response: Where the water depth is known, the information is included in Worksheet #18. This information will be gathered along with the LRC program and will be updated appropriately. No change is necessary.
78. Table 1 to the FSP - The QAPP indicates that six stations will be analyzed for Group C
analytes as provided in Table 2, of the Field Sampling Plan Addendum; however, it is not clear where these six samples will be collected. Neither Table 1 of Appendix A nor Worksheet 18, Sampling Locations and Methods/SOP Requirements, provide such information. In addition, Appendix D Bioavailability Protocols indicates that a screening level PCB analysis on the surface sediments will be used along with the physical description to select the six samples for testing. The information in the QAPP should be revised to reflect the type of screening level PCB analysis and the specific physical description that will used for sample selection
20080627 LRC Response to Comments.doc 21

LRC QAPP Response to Comments June 27, 2008 Page 22 of 39
Response: To select the six samples for method development, the CPG will use the laboratory screening level PCB analysis conducted prior to conducting high resolution GC/MS quantification of PCB congeners along with the physical description. The CPG will revise the information provided in the QAPP/ FSP Addendum to provide clarification of the screening level PCB analysis being conducted and the specific physical description that will used for sample selection.
79. Worksheet 18, pages 107 to 118. Define the terms “NGVD” and “MLW” in the table and
also add these to the list of acronyms.
Response: Comment will be incorporated in the revised plan. 80. Worksheet 18, pages 107 to 119. The “Target Core Length/Analyses” includes “Estimated
Lengths” for each core that are all below 30 feet. Experience obtained during the 2005-2006 coring efforts indicate that it may be necessary to advance cores to the limits of the vibracoring equipment (about 28-29 feet) to reach the underlying sand/clay at some locations in the lower 8 miles. Please make it clear in a footnote or text that the field team will be equipped to advance the individual cores to a deep of at least 30 feet to reach the red-brown clay layer or refusal, where necessary.
Response: See comment response #19. As discussed with the EPA on June 18, 2008 the field team will be equipped to advance cores to the limits of the vibracoring equipment.
81. Worksheet 19. This worksheet should to be clearly organized in a way that will allow for
easy recognition by the field crew of common sample containers and what sample splits need to go where. Shipping “representative samples” is one of the most critical responsibilities of any field effort. These samples will need to be handled, processed, and shipped to multiple laboratory facilities within 24 hours of collection. SOP LPR-S-04 also does not provide sufficient guidance for the field crew. Perhaps the Project Chemist can work with the labs to combine appropriate tests and list the total sample size required for all tests that will be performed in each facility to minimize the glassware and provide more representative split samples for related analyses (e.g., SVOCs, PAHs, OC Pesticides and PCBs may all be analyzed from common 8 oz wide-mouth jars). Similar information should be added to the Core Processing SOP (LPR-S-04).
Response: Per discussion with EPA on June 18, 2008, no text changes are needed.
82. Worksheet 19. The table footnotes should include some reference to the additional sample
volumes required for the site-specific QC (MS/MSD).
Response: Comment will be incorporated in the revised plan. 83. Worksheet 19. Clarify temperature requirements for thermal preservation. The final 2003
NELAC guidance (Section 5.5.8.3.1) considers arrival temperature acceptable when the representative sample container is either within 2oC of the required temperature or the
20080627 LRC Response to Comments.doc 22

LRC QAPP Response to Comments June 27, 2008 Page 23 of 39
method-specified range. Samples with temperatures ranging from just above the freezing temperature of water to 6oC shall be acceptable. The table recognizes the low end a 0oC but should be extended to 6oC.
Response: Comment will be incorporated in the revised plan.
84. Worksheet 19. Method 5035A preservation should be reviewed to confirm that a 48-hour
delay is allowable prior to “field preservation.” Method 5035A assumes immediate in-field transfer and the maximum refrigerated 48-hour hold is in an air tight coring device or container.
Response: Comment will be incorporated in the revised plan. Revised Response: In accordance with method 5035A, VOCs will be collected with sodium bisulfate preservation option, which includes cooling at 0-6oC in the field and at the laboratory for up to 14 days before analysis. If samples effervesce, the samples will be collected using the DI water option of method 5035A. This allows cooling (0-6oC) for 48 hour before freezing (-7oC) at the laboratory (and analysis within 14 days of collection).
85. Worksheet 19. Clarify holding times. For those analyses with 14/40, this represents 14
calendar days from field collection to extraction and 40 calendar days from extraction (not from collection) to analysis.
Response: Comment will be incorporated in the revised plan.
86. Worksheet 19. Frozen storage of PCB sediments and waters needs to be confirmed.
Typically sediment can be held at around -20oC. The QAPP should specify who will decide when samples will be stored frozen, whether samples will be processed prior to freezing, or whether sample analyses will be expedited so that samples can be frozen before the primary holding time expires.
Response: QAPP will be updated to specify the requested information on freezing.
87. Worksheet 19. TPH-Extractables must be extracted within seven days of collection.
Response: Section 9.2.3 of the 2/25/2008 version of the NJDEP TPH extractables method states 14 days to extraction. No change is needed.
88. Worksheet 19. Hexavalent Chromium must be analyzed within seven days of extraction.
Response: Comment will be incorporated in the revised plan. 89. Worksheet 20, page 125. Provide the EPA with a list of the Performance Test samples, the
components or analytes that they will contain and acceptance criteria which will be used to evaluate them.
20080627 LRC Response to Comments.doc 23

LRC QAPP Response to Comments June 27, 2008 Page 24 of 39
Response: See response to comment #45. This cannot be included in the QAPP because it is sent to the labs. It will be provided separately to EPA.
90. Worksheet 20. The trip blank including field preservation for low level VOC sediments by
Method 5035A is different than the representative TPH trip blank. Also, these analyses are scheduled for different laboratories. One set of representative trip blanks for each of the above analyses must be provided from the associated laboratories for return sample transport to each facility.
Response: Comment noted. The CPG is aware that each lab will have to provide trip blanks.
91. Worksheet 20. A footnote references two potential sources of PTs but it does not specify if
the contractor will be providing PTs. The only information regarding PT samples references supplier certified limits as a measurement of performance. There is no information on when or how the PTs will be introduced to the laboratories. There should be clarification between PTs and certified reference materials that are typically analyzed along with the sediment lab batches.
Response: Performance samples have been sent to the labs ahead of the field samples. Results of the performance samples will be submitted to EPA in a separate memorandum.
92. Worksheet 20. It is unclear whether Method 1669 is being used as guidance for field
sampling of the low level mercury. Special sample handling and field blank requirements may be necessary.
Response: The CPG will review with lab and field staff. Our understanding is that mercury levels in the sediment are expected to be above the levels for which the “clean/dirty hands” method is required; however, the CPG will revisit this issue and revise if necessary.
93. Worksheet 20. No rinsate blanks are included for any of the wet chemistry parameters.
Response: Comment will be incorporated in the revised plan. We will include rinsate blanks for the wet chemistry parameters.
94. Worksheet 21. Project Sampling SOP References Table, page 127 – The referenced SOP for
the Operation and Calibration of a Photoionization Detector was not included in Appendix B, as indicated.
Response: Comment will be incorporated in the revised plan.
20080627 LRC Response to Comments.doc 24

LRC QAPP Response to Comments June 27, 2008 Page 25 of 39 95. Worksheet 23. This worksheet is not consistent with Table 2 (included in Attachment 1). For
example, this worksheet references SOP L-4 for organochlorine pesticides by Method 8081A while Table 2 references Method 8081 (the SOP provided is for Method 8081A), the worksheet references SOP L-5 for PCBs by Method 8082 while Table 2 references PCB Aroclors by Method 8082A, etc. The two tables must be consistent.
Response: Comment will be incorporated in the revised plan.
96. Worksheet 23. Neither this worksheet nor Table 2 include all SOPs for sediment extraction
and extract clean-up steps. Only some of the method SOPs (e.g., L-6 for PAHs) include specific extraction procedures (soxhlet) and optional cleanups. Other SOPs (e.g., L-2) include multiple options and the project-preferred extraction procedure is not identified. Both tables must clearly identify all preparation and analytical methods. Response: As discussed with EPA on June 18, 2008, it may not be possible to specify the exact procedures that will be used until the samples are submitted for analysis to the lab. EPA agreed that no change was necessary.
97. Worksheet 23. SOP L-2 in the Appendix is from the Test America Pittsburg lab. Please
supply the actual SOP referenced instead.
Response: Comment will be incorporated in the revised plan. 98. Worksheet 23. Modifications to the Project Work listed for L-15 are incorrect (L-43 is
percent moisture and L-2 is not from West Sacramento).
Response: Comment will be incorporated in the revised plan. CPG will correct as needed.
99. Worksheet 23. L-44 is now Appendix D.
Response: Comment will be incorporated in the revised plan. 100. Worksheet 23. L-38 and L-39 do not appear to have reference to sediment samples .
Response: There are two additional, one-page attachments that detail the modifications used for analyzing sediment. Those will be provided.
101. Worksheet 28. The listed QC samples do not include field blanks or rinsate/equipment
blanks. Please revise as appropriate.
Response: Comment will be incorporated in the revised plan. Revised Response: Changed field blank to Equipment rinsate blank and trip blanks in Worksheet 12. Same change to Worksheet 28. Deleted equipment rinsate blank for AVS/SEM for consistency with attachments to grab and core SOPs. Added equipment rinsate blanks for wet chemistry.
20080627 LRC Response to Comments.doc 25

LRC QAPP Response to Comments June 27, 2008 Page 26 of 39 102. Worksheet 28. Indicate in the tables when the performance samples will be analyzed by the
lab. Will they be evaluated as a pre-qualification before samples from the site are analyzed? The corrective action for Performance Samples should include investigation and correction of the problem before samples are analyzed and data are reported.
Response: Comment will be incorporated in the revised plan. Worksheets 31 and 32 will be revised to include performance samples.
103. Worksheet 28. “Performance Samples” are listed in the Worksheet 28 tables. In the
Worksheet 12 tables, “Performance Evaluation Samples” are listed instead, while in Worksheet 19 the numbers of “PT” or “Performance Test” samples are given. Clarify if these terms are intended to be the same and if so, revise them to be consistent throughout the document.
Response: Comment will be incorporated in the revised plan. CPG will revise for consistency where needed.
104. Worksheet 28. In some cases method spike duplicates are listed in Worksheet 12 but are
not included as a QC sample in the corresponding Worksheet 28. Investigate and revise these to be consistent.
Response: Comment will be incorporated in the revised plan.
105. Worksheet 28. Check the QC acceptance criteria and measurement performance criteria
(MPC) and evaluate and revise to make sure they are consistent and reflect the criteria in the applicable EPA methods or lab SOPs.
Response: Comment will be incorporated in the revised plan.
106. Worksheet 28, pages 151-152. The worksheet does not list a field blank for VOCs.
Reconcile this with Worksheet 12 on page 30, which lists a field blank. Please evaluate and revise the field blanks in the other Worksheet 28 and 12 tables for consistency.
Response: Comment will be incorporated in the revised plan.
107. Worksheet 28, page 155. Add the applicable SOP number, table number and or page
number to the references made to the “Laboratory % Recovery Control Limits (Appendix C).
Response: Comment will be incorporated in the revised plan. Revised Response: All lab recovery limits are now referenced and listed in Appendix C-2.
20080627 LRC Response to Comments.doc 26

LRC QAPP Response to Comments June 27, 2008 Page 27 of 39 108. Worksheet 28, page 162. PCB Aroclors are not listed as a field duplicate parameter, while
Worksheet 12 does include these field duplicates. Please reconcile all the Worksheet 28 and 12 tables to resolve this inconsistency.
Response: Comment will be incorporated in the revised plan.
109. Worksheet 28 (and 12). PCB Congener limits should be evaluated and revised to be
consistent with the QA method performance criteria in USEPA Method 1668A. For example, the Ongoing Precision and Recovery criteria should include precision criteria in addition to accuracy/bias criteria.
Response: This will be reviewed with the laboratory and revised as needed.
110. Worksheet 28. In many cases, the tables reference laboratory control limits in Appendix C
but this appendix only includes control limits from Test America Knoxville.
Response: Laboratory limits are included in SOPs for many analyses; TestAmerica Knoxville was the only lab that provided a separate table. All labs were provided an opportunity to review and correct limits listed in the worksheets.
111. Worksheet 28. Tables similar to those provided by Test America Knoxville should be
included from all participating laboratories.
Response: Same as Comment #110. 112. Worksheet 28. This table would be more complete if expressions like “compound specific”
and in-house “laboratory control limits” were added where applicable.
Response: Comment will be incorporated in the revised plan. 113. Worksheet 28. This worksheet is not consistent with QAPP Worksheet #12 which, for
example, includes laboratory control sample limits from 70-130% and compound specific 60-140%. It would be best to create one series of tables that contain the measurement performance criteria for each of the methods for clarification. At a minimum, the two worksheets should be revised to be consistent with one another.
Response: Worksheets will be reviewed for consistency. A separate table will be included as an appendix. Revised Response: Appendix C-2 tables were referenced.
114. Worksheet 28. The relationship between the Method/SOP QC Acceptance Limits and the
Measurement Performance Criteria should be provided.
Response: As discussed with EPA on June 18, 2008, the table headings came from the UFP QAPP format; no change is necessary.
20080627 LRC Response to Comments.doc 27

LRC QAPP Response to Comments June 27, 2008 Page 28 of 39 115. Worksheet 28. For biological, the corrective action presented is to reanalyze the samples
but this does not appear realistic. The environmental sample will most likely be past the recognized holding time (from collection) before contamination is recognized. Clarify whether the requiring resampling is really necessary.
Response: If this occurs, a decision will be made whether resampling is required or whether a result obtained after the expiration of holding time will be reported as qualified data.
116. Worksheet 29, page 188. Please complete the last two entries in the table that are
incomplete.
Response: The table information will be corrected. Revised Response: Additional information was added. Note that Table is read by column not by row.
117. Worksheet 29, Data Storage and Retrieval. Add a statement that data transfer to USEPA
will include a Multi-media Electronic Data Deliverable (MEDD) that conforms to the 2007 EPA Region 2 MEDD format. Also note that the MEDD will include all qualified and rejected data (including the reported, numerical value for rejected data).
Response: Comment will be incorporated in the revised plan.
118. Worksheet 30. Footnote “a” is not included for reference.
Response: Will add footnote a. 119. Worksheet 30. The analytical services information associated with the Group C analytes
was not provided with the worksheet.
Response: This information is included in Appendix D. 120. Worksheet 31. Many of the specified methods and/or program-specific requirements may
not be addressed in a routine external audit
Response: Will revise to state that audits will be project-specific.
121. Worksheet 33. The CPG is proposing that non-conformance with the QAPP and subsequent corrective actions will be documented and addressed by the Project Quality Assurance Manager. The CPG should also communicate non-conformance and corrective actions to the EPA.
Response: Comment will be incorporated in the revised plan.
20080627 LRC Response to Comments.doc 28

LRC QAPP Response to Comments June 27, 2008 Page 29 of 39 122. Worksheet 35 indicates a full data validation on polychloro-dibenzodioxins/furans
(PCDD/F) and polychlorinated biphenyl (PCB) compounds. A full data validation should also be conducted for pesticides since these compounds are most likely to be impacted by matrix interferences, potentially resulting in data that are biased low or not detected.
Response: Per discussion with EPA on June 18, 2008, as the pesticides are being analyzed using both HR/MS and 8081A, the requested 100% full validation will not be required. However, note that 10% will receive full data validation (which will include 10% of the data for each pesticide method) as part of the proposed approach and a 100% completeness check will be done on all data to ensure that future validation could be completed if necessary.
123. Worksheet 35, page 206. The rationale behind performing a limited data validation of
certain analytes (outside of the dioxin/furan and PCB homologs/congeners) should be provided. In addition, what will be the action required if significant issues (high frequency of not meeting the measurement performance criteria) were found during the limited validation? The process of addressing the issues should be provided. This should include any corrective actions that will be required.
Response: As discussed with EPA on June 18, 2008 the proposed approach is consistent with MPI QAPP 2005 requirements. EPA agreed this would be acceptable. Worksheet 35 will be revised to address EPA’s concern regarding significant issues.
124. Worksheet 36, page 208, Validation Criteria. Confirm the SOP referenced for the
validation of the PAH data. Region 2 SOP HW-25, which is referenced, is for the validation of dioxin data. Correct as necessary.
Response: Comment will be incorporated in the revised plan. Revised Response: Worksheet 36 has been revised to reference the most applicable validation guidance, where specific guidance is not provided by USEPA Region 2.
125. Worksheet 36. Include a brief summary of the modifications made to the validation SOPs
referenced. The worksheet indicates that the validation criteria referenced will be modified for some analytical methods. Modifications to the SOPs employed to validate the data must be documented in the data validation reports. When applicable, the QA acceptance criteria in the applicable EPA method should also be referenced.
Response: Comment will be incorporated in the revised plan.
126. Worksheet 37, paragraph 2. It is an incorrect statement that DQO noncompliance will be
noted in the database. This is not practical since a given datum can have numerous usability levels, i.e., a datum can satisfy usability for one DQO while also failing usability for a second DQO. The validation annotation should be revised to read “Data that do not meet the quality acceptance limits of worksheet 28, or quality levels of worksheet 15, or
20080627 LRC Response to Comments.doc 29

LRC QAPP Response to Comments June 27, 2008 Page 30 of 39
analytical performance criteria specified in worksheet 12 will be clearly identified in the database so data users are aware of any limitations associated with data usability.”
Response: Comment will be incorporated in the revised plan.
127. Attachment 1, pages 216 to 240. The DQOs should present the overall objectives, questions
to be answered and the data needs, but should not include all the details regarding each task. The details of the proposed tasks to be performed to meet the DQOs should be presented separately in the QAPP Worksheets. The DQOs currently include specific details describing the task which will be performed to meet the objectives such as an exact number of samples to be collected and the type of grab sampler which will be employed. If the details of each task are included in the DQOs, it should be made clear that proposed number of samples and analyses described may not be sufficient to entirely answer the questions posed in the DQOs and that additional sampling and analyses may be necessary.
Response: It was agreed with EPA that the DQOs would be reviewed to ensure that the language does not infer this sampling is the only sampling necessary for fulfillment of the DQO and LRC program.
128. Attachment 1, DQOs. It appears that the DQOs from the 2005 QAPP have been
reformatted and included in their entirety. This is not entirely appropriate, since the planned sampling activities in the Low Resolution Coring QAPP do not address the majority of these DQOs. The DQOs from the 2005 QAPP should probably be removed from the document.
Response: Comment will be incorporated in the revised plan.
129. Attachment 1, DQOs. There are missing articles/words in a number of the phrases, for
example the fifth bullet under DQO 1, Step 2. Re-check the attachment for editorial errors and revise as necessary in final document.
Response: Comment will be incorporated in the revised plan.
130. Attachment 1 – DQO 1, Step 2, Principal Study Questions, 6th bullet. Exposure pathways
themselves can not be at risk. Risk occurs because of complete exposure pathways. A more appropriate question would be, “How does the relative stability or instability of sediments in the various geomorphologic segments of the Lower Passaic affect exposure concentrations, pathways and routes for human and ecological receptors of concern?”
Response: Comment will be incorporated in the revised plan.
131. Attachment 1 – DQO 1, Step 2, Principal Study Questions , 4th bullet. Please revise
“…natural recovery of the contaminated sediments…” to “…natural attenuation of the contaminated sediments…”
20080627 LRC Response to Comments.doc 30

LRC QAPP Response to Comments June 27, 2008 Page 31 of 39
Response: Comment will be incorporated in the revised plan. 132. Attachment 1 – DQO 1, Step 2, Decision 1. Reword to clarify use of term ‘sufficient’. “If
the sediment transport model can be successfully calibrated and validated with the new data plus select historical data, then there is no need to evaluate the utility of collecting additional physical characteristics data.”
Response: Comment will be incorporated in the revised plan.
133. Attachment 1 – DQO 1, Step 2, Decision 4: Given the absence of defined decision
tolerance limits, it is impractical to condition this proposed rule by the term “sufficient.” A rule may not be warranted because geochemical evaluation will be conducted as part of this work. The need for future sampling will automatically be considered based on variability observed.
Response: Comment will be incorporated in the revised plan.
134. Attachment 1 – DQO 1, Step 7, 2nd bullet of sampling program. Indicate number of days
anticipated for the single sampling event. Also, completing sampling in a single sampling event only minimizes temporal variability, not spatial variability. Spatial variability can only be minimized by the sample collection method/technique, and should be limited by completing sampling at a location once it has begun and minimizing drift during the collection of consecutive samples.
Response: Comment will be incorporated in the revised plan.
135. Attachment 1 – DQO 2, Step 1. Change “…main stem of river (RM0 to RM17), its major
tributaries…” to “…main stem of the river (RM0 to RM17); the thalweg, shoals, and nearshore areas; its major tributaries; and above Dundee dam…”
Response: Comment will be incorporated in the revised plan.
136. Attachment 1 – DQO 2, Step 1. Change “…provide characterization of LPRSA
background conditions…” to “…provide characterization of LPRSA baseline conditions…”
Response: Comment will be incorporated in the revised plan.
137. Attachment 1 – DQO 2, Step 1 - State the problem, last sentence - The results of the
analyses of the limited suite of Non Hazardous Substance stressors including pathogens will not be used to support the risk assessment portions of the RI/FS. Please revise this sentence.
Response: Comment will be incorporated in the revised plan as discussed with EPA all collected data will be reported in the RI.
20080627 LRC Response to Comments.doc 31

LRC QAPP Response to Comments June 27, 2008 Page 32 of 39
138. Attachment 1 – DQO 2, Step 2. Add question 1.5 “Is the nature of the contamination
different between the main stem of the river and the shallow shoreline habitats?”
Response: See response to Comment #40. 139. Attachment 1 – DQO 2, Step 2. Program Goals, 3rd bullet. Assessment of human and
ecological health should be in accordance with EPA risk assessment guidance, rather than RI/FS guidance. Also, this bullet should not limit the assessment of potential impacts to human health and ecological receptors to just the top 6 inches of sediment.
Response: Comment will be incorporated in the revised plan.
140. Attachment 1 – DQO 2, Step 2, Program Goals, analyses. EPA recommends that, 25% of
the stations should have the additional analyses rather than 10% or less. Specifically, 30 stations are recommended to be analyzed for purgeable TPHs, methyl mercury, hexavalent chromium, AVS and SEM, instead of only 12 stations, and 30 stations should be analyzed for PCB sediment-water partitioning instead of only 6 stations.
Response: As discussed with EPA on June 18, 2008, the stated purposes of analyses of Group B is to determine relevance for future investigations and for Group C is to allow for evaluation of the analytical technique for future investigations. The CPG proposed, and EPA agreed, that the planned sample size is adequate for these purposes.
141. Attachment 1, Data Quality Objectives, Data Quality Objective 2, Step 2, Identify the goals
of the study, Program Goals, Fourth Bullet, Page 226 of 240. The Non Hazardous Substance stressors including pathogens will not be used for background risk characterization. Please revise this bullet to indicate that this information will not be used for the human or ecological risk assessments.
Response: See comment response #137.
142. Attachment 1 – DQO 2, Step 2, Decision Statements, 3rd bullet. This statement does not
make sense. Please, reword as a complete “if” “then” statement.
Response: Comment will be incorporated in the revised plan. 143. Attachment 1 –DQO, Step 2, Decision Statements, 4th bullet – In addition to presenting the
results of the proposed geostatistical evaluations, the CPG should present all validated data from the low resolution coring effort (for each sample, core segment and parameter)in tabular and/or database form for review. In addition, numerical concentrations are to be reported for all sample results, including data that was rejected by the validators.
Response: Agreed.
20080627 LRC Response to Comments.doc 32

LRC QAPP Response to Comments June 27, 2008 Page 33 of 39 144. Attachment 1, DQO 2, Step 2, Decision Statements. In several instances (e.g., bottom of
page 227 of 240), the QAPP states that “If multiple lines of evidence…suggest a stable sediment bed…then no further coring will be conducted.” More detail will be required on the criteria that will be used to assess the collected data for this decision process, alternately, this statement can be deleted and this decision revisited in the future data evaluation report for the low resolution coring program. This comment also applies to the corollary (first bullet at top of page 228 of 240).
Response: Following discussion with EPA on June 20, 2008, all agreed that the text does not require revision. However, it is important to note that the need for further sampling (or not) will be presented and discussed with EPA.
145. Attachment 1 – DQO 2, Step 2, Decision 5. Given the absence of defined decision
tolerance limits, it is impractical to condition this proposed rule by the term “sufficient.” A rule may not be warranted because geochemical evaluation will be conducted during this work. The need for future sampling will automatically be considered based on variability observed.
Response: Comment will be incorporated in the revised plan.
146. Attachment 1 – DQO 2, Step 5, Anticipated Data Evaluation 5. Reword “recovery of
detected chemicals” to “attenuation of detected chemicals.”
Response: Comment will be incorporated in the revised plan. 147. Attachment 1 – DQO 2, Step 5, Anticipated Data Evaluation 6. Reword “…inform the
sediment transport and chemical fate and transport models.” to “…calibrate and validate the sediment transport and chemical fate and transport models.”
Response: Comment will be incorporated in the revised plan.
148. Attachment 1 – DQO 2, Step 7, 2nd bullet of sampling program. As for DQO 1, please
indicate number of days anticipated for the single sampling event. Also, completing sampling in a single sampling event only minimizes temporal variability. Spatial variability should be limited by completing sampling at a location on any given day.
Response: Comment noted.
149. Attachment 1 – DQO 2, Step 2. The PCB partitioning study may provide useful
information for the current and future site investigations. More than six samples should be collected to provide sufficient data for the study, especially in consideration of the range of environmental/sediment quality parameters encountered on-site. The number of samples should be increased to 30, cover a range of water and sediment quality parameters and a range of PCB concentrations, since all of these factors will affect partitioning. Because this study is independent of the site characterization work on many levels, a separate set of QC
20080627 LRC Response to Comments.doc 33

LRC QAPP Response to Comments June 27, 2008 Page 34 of 39
Response: The PCB partitioning study may provide useful information for the current and future site investigations. The current study is designed to evaluate the feasibility of using a new project-specific testing protocol to measure sample sediment-water partitioning coefficients for PCBs (and potentially other highly hydrophobic organic contaminants). It is premature to commit resources to characterization of a large number of sediment samples for the RI until the testing protocol for PCBs is further developed, the analytical sensitivity is assessed and evaluated against DQOs, a method SOP is prepared, and QA/QC procedures are established . The CPG agrees that a large range of environmental/sediment quality parameters may be encountered on the LPR and that a number of sediment samples may be ultimately required in order to characterize (1) the sediment-water partitioning of PCBs over a range of water quality (i.e., mesohaline, oligohaline fresh), (2) sediment quality conditions (nature and type of sediment organic carbon), and (3) a range of PCB concentrations. However, the number and characteristics of the sediment samples to be analyzed and the number of field duplicate QC samples should not be pre determined until the basic information on the method is developed (e.g., accuracy, precision, and sensitivity) and the value of the data to the RI and RA is assessed. The CPG understands that the results will be most useful for estimating the dissolved concentration of PCBs in sediment porewater, as well as the water column and corresponding exposure and uptake via ventilation; not necessarily most useful for estimating exposure via ingestion by potential receptors. The CPG anticipates that, if the measured aqueous partitioning is substantially different than the assumed partitioning reported in the literature, these data will provide useful information for evaluating different remedial options and such information could be confirmed in field pilot studies. The CPG discussed this comment with EPA on June 18, 2008. It was agreed that no change is necessary.
150. Attachment A, Core Processing (SOP Number S4, Step 5.3.7). The CPG is proposing to
process their cores in a longitudinal fashion (e.g., cores will be cut lengthwise and separated into two core halves). The SOP should be revised to state that sediments from both core halves (extending the entire length of the segment) will be combined into each collected sample (with the exception of VOCs).
Response: Comment will be incorporated in the revised plan.
20080627 LRC Response to Comments.doc 34

LRC QAPP Response to Comments June 27, 2008 Page 35 of 39
Revised Response: EPA comment reference to Attachment A. Assuming this and following comments are specific to field SOPs in Appendix B.
151. Attachment A, Coring Attempts. The CPG is proposing to make three attempts at
collecting a low resolution core at each sampling location. If a core cannot be retrieved with adequate recovery (defined as greater than 80 percent of the actual penetration depth), the location will be abandoned. Two alternate locations will then be provided (one upriver and one downriver of the original sampling location). The CPG will make one attempt at collecting a low resolution core at each alternative location. If a core cannot be recovered, the CPG will abandon the location (refer to FSP Attachment A and elsewhere in the document). The document should to be revised to include a more robust effort to select alternate locations. Above RM8, zones of varying sediment texture will need to be considered carefully so that relocated cores have the greatest possible opportunity to achieve target recovery.
Response: See comment response #8. The SOP will be edited appropriately.
152. Attachment A (SOP LPR-S-01). The QAPP does not indicate the use of a petite ponar or
box core sampler, as indicated in this site-specific SOP. If the other pieces of equipment may be used, they need to be mentioned in the QAPP and FSP, along with the decision points and objectives for their use. Otherwise, there is no need to mention them, since this SOP is specific to the planned sampling. Also, please include a statement that sediment samples will be collected either down-current or after water quality data and water sampling have been completed for each location to avoid possible affects from potential sediment loss as the grab is retrieved.
Response: Comment will be incorporated in the revised plan. Revised Response: No statement was added regarding water quality data collection as this task is not part of the proposed scope.
153. Appendix B, SOP LPR-S-01. Some Van Veen grab samplers have rubber flaps and screens
that cover the top of the sampling device to prevent loss of collected sediment during retrieval. Please expand the SOP to confirm that the surficial sample for Be-7 will be removed from the retrieved Van Veen sampler through its top (by removing flaps and screens, if necessary), without opening the bottom scoops. Whether recovered using a small dredge or box core, the subsample for Be-7 must be removed from the surface of the collected sample without releasing the collected sediment from the sampling device for other potential processing and subsampling.
Response: Comment will be incorporated in the revised plan.
20080627 LRC Response to Comments.doc 35

LRC QAPP Response to Comments June 27, 2008 Page 36 of 39 154. Appendix B, SOP LPR-S-01, Attachment 4. Procedure for VOC sampling attached to grab
sampling SOP refers to “cores” and “decanting” water (as opposed to siphoning, as required by the SOP. Please correct.
Response: Comment will be incorporated in the revised plan.
155. Appendix B, SOP LPR-S-04, Section 5.0. Please add a discussion regarding the planned
management of cores that have a high water content, should they be encountered. The management of these cores would be expected to include separation of segments while the core is kept vertical, for example.
Response: Comment will be incorporated in the revised plan. SOPs will be updated to include the method of collection of samples which have high water content.
156. Appendix B, SOP LPR-S-03, Section 5.1.3, Item 10. The vibracore should not be allowed
to penetrate the sediment under its own weight before the motor is turned on. The motor should be turned on immediately after the core tube penetrates the most surficial sediment (upper inch or two), so that sediment in contact with the tube walls remains liquefied during nearly the entire process of advancing the tube to the target depth. Doing otherwise may result in discontinuous retrieval of sediment during the process of advancing the tube (some deeper strata may be simply ‘pushed out of the way’ as the friction between the initial amount of recovered sediment and the tube is overcome).
Response: Comment will be incorporated in the revised plan.
157. Appendix B, SOP LPR-S-03, Section 5.1.3, Item 12. The CPG states in the QAPP that low resolution cores will penetrate to the red-brown clay, sand, or refusal. Consequently, the intent of the “target depths” is unclear. Several “target depths” appear shallow compared to available data. There is concern that the field crew may not achieve the desired coring penetration to the sand layer or clay that underlies the recent sediments by merely following the target depth recommendation for each core. Please add text that describes how the field crew is to make additional attempts to fully penetrate the fine-grained sediments, even if they meet recovery criteria, but do not obtain underlying sand or clay in the core tube. It is recommended that probing be conducted at each location to investigate the thickness of the fine-grained sediment layer and revise the target coring depth accordingly.
Response: Comment will be incorporated in the revised plan.
158. Appendix B, SOP LPR-S-03, Section 5.1.3, Item 21. The core should be allowed to settle
overnight with overlying water maintained in the tube and the water drained through a small hole on the following day, immediately prior to processing.
20080627 LRC Response to Comments.doc 36

LRC QAPP Response to Comments June 27, 2008 Page 37 of 39
Response: Per agreement with EPA on June 18, 2008, the core will be allowed to settle, however overnight is not required. The water will be drained, as will be discussed in the updated SOP.
159. Appendix B, SOP LPR-S-02, Section 5.3, Item no. 21. The core should be allowed to
settle overnight with overlying water maintained in the tube and the water drained through a small hole on the following day, immediately prior to processing.
Response: See response to comment# 158.
160. Appendix C. This appendix containing the lab SOPs is nearly 1,500 pages long, therefore
an index or table of contents would be useful so to assist the reader when locating the applicable SOPs and acceptance criteria. Please revise to include bookmarks in the .pdf document.
Response: Comment will be incorporated in the revised plan.
161. Appendix C, SOP No. WS-ID-0014, Rev. 3, Analysis of Organochlorine Pesticides by
High Resolution Gas Chromatography/High Resolution Mass Spectrometry [EPA Methods 1699 and NYSDEC HRMS]. The SOP includes a number of optional cleanup procedures. Please note that for Passaic sediment samples experience has shown that samples for pesticides will require sulfur cleanup (mercury cleanup), Florisil cleanup, and Gel Permeation Chromatography cleanup.
Response: Comment noted; all appropriate cleanup procedures will be used.
162. Appendix D. The proposed plan neglects to describe a quality control/quality assurance program for the bioavailability-partitioning experiments. For example, Test America Laboratories should be required to run a black carbon standard reference material, such as the National Institute of Standards and Technology (NIST) standard reference material 1650 or 2975.
Response: Additional quality control information will be provided for laboratory methods for which SOPs have been prepared (e.g., soot carbon analysis).
163. Appendix D, Sample Screening. The CPG is unclear on the “screening level analysis”
proposed to identify appropriate sediment samples for the partitioning experiments. On PDF page 6, under the section called “Sample Selection,” the CPG states that “Screening level analysis of PCB concentrations, as measured in each of the bulk surface sediment samples, will be used to select a subset of samples with moderate to high concentrations of PCB for additional testing.” Please provide more detail on the screening level analysis.
Response: As described in CPG’s response to comment 78, above, screening level PCB analysis is conducted by the laboratory prior to high resolution GC/MS quantification of
20080627 LRC Response to Comments.doc 37

LRC QAPP Response to Comments June 27, 2008 Page 38 of 39
PCB congeners. This qualitative analysis will be used to select six samples that have moderate to high relative concentrations of PCBs for method develop.
164. Appendix D, Partitioning Experiments. The CPG is proposing to conduct partitioning
experiments in 1-liter bottles containing 200 milliliters (mL) of wet sediment and 800 mL of site water or de-ionized water. Recent water column experiments conducted by Malcolm Pirnie, Inc. for the EPA have demonstrated that large volumes of water are necessary to analyze for dissolved-phase PCB congeners. Similar results were reported by the United States Geological Survey (USGS) during the water column program conducted in conjunction with the Environmental Dredging Pilot Study. EPA also cautions against the use of de-ionized water in these experiments. The CPG should be required to compare their results from the 1-liter partitioning experiments with the large volume partitioning experiments conducted by Malcolm Pirnie, Inc. and the USGS.
Response: The proposed analytical approach for characterizing sediment water partitioning includes the use of equilibrium passive samplers constructed of polyoxymethylene (POM). This approach had been developed and published in the scientific peer-reviewed literature by Ghosh et al (2003), McDonough (2007) and Cornelissen et al (2007). These sampling devices are being evaluated as promising analytical tools to determine freely dissolved aqueous concentrations (CW,free) of hydrophobic organic compounds. The approach proposed for evaluation is designed to address the inherent limitations and confounding factors associated with the analytical methods used by Malcolm Pirnie, Inc. and USGS. The proposed POM method is expected to provide a significant reduction in field sampling costs and provide many orders of magnitude greater sensitivity. The experimental approach described for characterizing the aqueous partitioning will enable the detection of most dissolved PCB congeners using the POM method and will enable detection of the congeners having the concentrations using conventional water extraction and analysis. It is neither necessary nor feasible to compare all congeners using large volume partitioning experiments due to the confounding analytical problems associated with the presence of micro-particulates and colloidal materials following ultra filtration techniques.
Ghosh, U., J.R. Zimmerman, and R.G. Luthy. 2003. PCB and PAH speciation among particle types in contaminated harbor sediments and effects on PAH bioavailability. Environ. Sci. Technol. 37:2209-2217. McDonough, K. M., J. L. Fairey, G. V. Lowry, Adsorption of polychlorinated biphenyls to activated carbon: Equilibrium isotherms and a preliminary assessment of the effect of dissolved organic matter and biofilm loadings. Water Research, 2007. Cornelissen G, Pettersen A, Broman D, Mayer P, Breedveld GD. 2008. Field testing of Equilibrium Passive Samplers to Determine Freely Dissolved Native Polycyclic Aromatic Hydrocarbon Concentrations. Environmental Toxicology and Chemistry. 27: 499-508.
20080627 LRC Response to Comments.doc 38

LRC QAPP Response to Comments June 27, 2008 Page 39 of 39
20080627 LRC Response to Comments.doc 39
165. It is unclear why the scope of work presented in this appendix is limited to PCBs. Preliminary information on pore water chemistry for the purposes of evaluating exposure to ecological receptors should include, at a minimum, hydrogen sulfide, ammonia, pH, temperature, and select metals.
Response: As described above in CPG’s response to comment #149, the current scope of work is designed to evaluate the feasibility of using a new project-specific testing protocol to measure sample sediment-water partitioning coefficients for PCBs (and potentially other highly hydrophobic organic contaminants).

Quality Assurance Project Plan RI Low Resolution Coring/Sediment Sampling Lower Passaic River Restoration Project Newark, New Jersey
J:\Water\ProjectFiles\P120\12182_Passaic\QAPP\Rev 1_July 2008\2008_Low Res Core QAPP_2008 July 18_Rev1_worksheet1-19.doc
RI Low Resolution Coring / Sediment Sampling
July 2008
Revision 2
Approved By:
Date: July 24, 2008
Debra L. Simmons, Project QA Manager Approved By:
Date: July 24, 2008
Jenny Phillips, RI Task Manager Approved By:
Date: July 24, 2008
David Nakles, ENSR RI/FS PM

Section: Contents Revision: 1
Date: July 2008
Quality Assurance Project Plan RI Low Resolution Coring/Sediment Sampling Lower Passaic River Restoration Project Newark, New Jersey Page i of ii
J:\Water\ProjectFiles\P120\12182_Passaic\QAPP\Rev 1_July 2008\2008_Low Res Core QAPP_2008 July 18_Rev1_worksheet1-19.doc
Contents List of Acronyms
Introduction
QAPP Worksheet #1. Title and Approval Page
QAPP Worksheet #2. QAPP Identifying Information
QAPP Worksheet #3. Distribution List
QAPP Worksheet #4. Project Personnel Sign-Off Sheet
QAPP Worksheet #5. Project Organizational Chart
QAPP Worksheet #6. Communication Pathways
QAPP Worksheet #7. Personnel Responsibilities and Qualifications Table
QAPP Worksheet #8. Special Personnel Training Requirements Table
QAPP Worksheet #9. Project Scoping Session Participants Sheet
QAPP Worksheet #10. Problem Definition
QAPP Worksheet #11. Project Quality Objectives/Systematic Planning Process Statements
QAPP Worksheet #12. Measurement Performance Criteria Table
QAPP Worksheet #13. Secondary Data Criteria and Limitations Table
QAPP Worksheet #14. Summary of Project Tasks
QAPP Worksheet #15. Reference Limits and Evaluation Table
QAPP Worksheet #16. Project Schedule/Timeline Table
QAPP Worksheet #17. Sampling Design and Rationale
QAPP Worksheet #18. Sampling Locations and Methods/SOP Requirements Table
QAPP Worksheet #19. Analytical SOP Requirements Table
QAPP Worksheet #20. Field Quality Control Sample Summary Table
QAPP Worksheet #21. Project Sampling SOP Reference Table
QAPP Worksheet #22. Field Equipment Calibration, Maintenance, Testing, and Inspection Table
QAPP Worksheet #23. Analytical SOP Reference Table
QAPP Worksheet #24. Analytical Instrument Calibration Table
QAPP Worksheet #25. Analytical Instrument and Equipment Maintenance, Testing, and Inspection Table
QAPP Worksheet #26 Sample Handling System
QAPP Worksheet #27. Sample Custody Requirements
QAPP Worksheet #28. QC Samples Table
QAPP Worksheet #29. Project Documents and Records Table

Section: Contents Revision: 1
Date: July 2008
Quality Assurance Project Plan RI Low Resolution Coring/Sediment Sampling Lower Passaic River Restoration Project Newark, New Jersey Page ii of ii
J:\Water\ProjectFiles\P120\12182_Passaic\QAPP\Rev 1_July 2008\2008_Low Res Core QAPP_2008 July 18_Rev1_worksheet1-19.doc
QAPP Worksheet #30. Analytical Services Table
QAPP Worksheet #31. Planned Project Assessment Table
QAPP Worksheet #32. Assessment Findings and Response Actions
QAPP Worksheet #33. QA Management Reports Table
QAPP Worksheet #34. Sampling and Analysis Verification (Step I) Process Table
QAPP Worksheet #35. Sampling and Analysis Validation (Steps IIa and IIb) Process Table
QAPP Worksheet #36. Sampling and Analysis Validation (Steps IIa and IIb) Summary Table
QAPP Worksheet #37. Data Usability Assessment
Attachment 1 Data Quality Objectives
Appendix A Field Sampling Plan Addendum
Appendix B Field Standard Operating Procedures
Appendix C Laboratory Standard Operating Procedures
Appendix D Bioavailability Protocols

Section: List of Acronyms Revision: 1
Date: July 2008
Quality Assurance Project Plan RI Low Resolution Coring/Sediment Sampling Lower Passaic River Restoration Project Newark, New Jersey Page 1 of 5
J:\Water\ProjectFiles\P120\12182_Passaic\QAPP\Rev 1_July 2008\2008_Low Res Core QAPP_2008 July 18_Rev1_worksheet1-19.doc
List of Acronyms
Acronym Definition 63NI Nickel AET Apparent Effects Threshold ASTM American Society for Testing and Materials AVS/SEM Acid Volatile Sulfides/Simultaneously Extracted Metals BAZ Biological Active Zone Be-7 Beryllium 7 BFB Bromofluorobenzene BHC Benzene hexachloride BrCl Bromide Chloride C Celsius CAS Columbia Analytical Services CAS Number Chemical Abstracts Services CERCLA Comprehensive Environmental Response, Compensation, and Liability
Act CCC Calibration Check Compounds CCV Continuing Calibration Verification CLRC CPG Low Resolution Core cm centimeter(s) COC Chain of Custody COPC Chemical of Potential Concern CPG Cooperating Parties Group CRM Certified Reference Material CSM Conceptual Site Model CSO Combined Sewer Overflow Cs-137 Cesium 137 Cu/Mn Copper/Manganese CVAAS Cold Vapor Atomic Absorption Spectrometry CVAFS Cold Vapor Atomic Fluorescence Spectrometry dGPS Differential Global Positioning System DDD Dichlordiphenyldichloroethane DDE Dichlordiphenyldichloroethylene DDT Dichlordiphenyltrichloroethane DFTPP Decafluorotriphenylphosphine DoD Department of Defense DQI Data Quality Indicators

Section: List of Acronyms Revision: 1
Date: July 2008
Quality Assurance Project Plan Phase I RI Low Resolution Coring/Sediment Sampling Lower Passaic River Restoration Project Newark, New Jersey Page 2 of 5
List of Acronyms (Continued)
J:\Water\ProjectFiles\P120\12182_Passaic\QAPP\Rev 1_July 2008\2008_Low Res Core QAPP_2008 July 18_Rev1_worksheet1-19.doc
Acronym Definition DQL Data Quality Level DQO Data Quality Objectives ECD Electron Capture Detector EDD Electronic Data Deliverable EDL Estimated Detection Limit EHS Environmental Health and Safety EML Environmental Measurements Laboratory ER-L Effects Range-Low F Farenheit FID flame ionization detector Ft feet FS Feasibility Study FSP Field Sampling Plan g gram GC Gas Chromatography GC/ECD Gas Chromatography/Electron Capture Detector GC/FID Gas Chromatography/Flame Ionization Detector GC/FPD Gas Chromatography/ Flame Photoionization Detector GC/MS Gas Chromatography/Mass Spectrometry GEL General Engineering Laboratatories, LLC GPC Gel Permeation Chromatography HASP Health and Safety Plan HAZWOPER Hazardous Waste Operations and Emergency Response HHRA Human Health Risk Assessment HRC high resolution core HRGC/HRMS High Resolution Gas Chromatography-High Resolution Mass
Spectrometry HRGC/LRMS High Resolution Gas Chromatography-Low Resolution Mass
Spectrometry HR/MS High Resolution/Mass Spectrometry H&S Health and Safety ICAL Initial Calibration ICS A Interference Check Sample ICP/AES Inductively Coupled Plasma-Atomic Emission Spectrometry ICP/MS Inductively Coupled Plasma-Mass Spectrometry ICV Initial Calibration Verification IDL Instrument Detection Limit IEC Interelement Correction

Section: List of Acronyms Revision: 1
Date: July 2008
Quality Assurance Project Plan Phase I RI Low Resolution Coring/Sediment Sampling Lower Passaic River Restoration Project Newark, New Jersey Page 3 of 5
List of Acronyms (Continued)
J:\Water\ProjectFiles\P120\12182_Passaic\QAPP\Rev 1_July 2008\2008_Low Res Core QAPP_2008 July 18_Rev1_worksheet1-19.doc
Acronym Definition K & L Gates Kirkpatrick and Lockhart Preston Gates Ellis LLP K-40 Potassium 40 LCS Laboratory Control Sample LCS/LCSD Laboratory Control Sample/Laboratory Control Sample Duplicate LIMS Laboratory Information Management System LPR Lower Passaic River LPR/NB Lower Passaic River/Newark Bay LPRRP Lower Passaic River Restoration Project LPRSA Lower Passaic River Study Area MARLAP Multi-Agency Radiological Laboratory Analytical Protocols MB Method Blank MDL Method Detection Limit MEED multi-media electronic data deliverable mg/kg milligrams/kilogram MLW mean low water MPI Malcolm Pirnie, Inc MS Matrix Spike MSD Matrix Spike Duplicate NA Not Available N/A Not Applicable ND Not Determined ng/L Nanograms per Liter NGVD National Geodetic Vertical Datum NIST National Institute of Standards and Technology NJDEP New Jersey Department of Environmental Protection NOAA National Oceanic and Atmospheric Administration NOAEL No Observable Adverse Effects Level NYSDEC New York State Department of Environmental Conservation OPR On-going Precision and Recovery OSHA Occupational Safety and Health Administration OU Operable Unit oz ounce PAH Polycyclic Aromatic Hydrocarbons Pb-210 Lead Isotope 210 pCi/g Picocuries/gram PCB polychlorinated biphenyl PCDD Polychlorinated Dibenzodioxins PCDF Polychlorinated Dibenzofurans

Section: List of Acronyms Revision: 1
Date: July 2008
Quality Assurance Project Plan Phase I RI Low Resolution Coring/Sediment Sampling Lower Passaic River Restoration Project Newark, New Jersey Page 4 of 5
List of Acronyms (Continued)
J:\Water\ProjectFiles\P120\12182_Passaic\QAPP\Rev 1_July 2008\2008_Low Res Core QAPP_2008 July 18_Rev1_worksheet1-19.doc
Acronym Definition PE Performance Evaluation PFK Perfluorokerosene PID Photoionization Detector PM Project Manager PQO Project Quality Objectives PREmis Passaic River Estuary Management Information System PRG Preliminary Remediation Goals PRSA Passaic River Study Area QA Quality Assurance QAPP Quality Assurance Project Plan QC Quality Control QL Quantitation Limit QMP Quality Management Plan % R Percent Recovery RCL Recovery Control Limits RF Response factor RI Remedial Investigation RI/FS Remedial Investigation/Feasibility Study RI FTM RI Field Task Manager RL Reporting Limit RM River Mile RRF Relative Response Factor RPD Relative Percent Difference RPM Remedial Project Manager RSD Relative Standard Deviation SDG sample delivery group S/N Serial Number SIM Selective Ion Monitoring SOP Standard Operating Procedure SOW Statement of Work SPCC System Performance Check Compounds SRM Standard Reference Material SSO Site Safety Officer SVOC Semivolatile Organic Compounds SWO Stormwater Outfall TBD To be determined TEL Threshold Effects Level TKN Total Kjeldahl Nitrogen

Section: List of Acronyms Revision: 1
Date: July 2008
Quality Assurance Project Plan Phase I RI Low Resolution Coring/Sediment Sampling Lower Passaic River Restoration Project Newark, New Jersey Page 5 of 5
List of Acronyms (Continued)
J:\Water\ProjectFiles\P120\12182_Passaic\QAPP\Rev 1_July 2008\2008_Low Res Core QAPP_2008 July 18_Rev1_worksheet1-19.doc
Acronym Definition TOC Total Organic Carbon TPH total petroleum hydrocarbons TRV Toxicity Reference Value UFP Uniform Federal Policy µg micrograms umoles/g micro moles per gram USACE United States Army Corps of Engineers USCG United States Coast Guard USDOE United States Department of Energy USEPA United States Environmental Protection Agency USGS United States Geological Service USFWS United States Fish and Wildlife Service UV-VIS Ultraviolet-Visible Spectroscopy VOC Volatile Organic Compounds

Section: Introduction Revision: 0
Date: May 2008
Quality Assurance Project Plan RI Low Resolution Coring/Sediment Sampling Lower Passaic River Restoration Project Newark, New Jersey Page 1 of 6
J:\Water\ProjectFiles\P120\12182_Passaic\QAPP\Rev 1_July 2008\2008_Low Res Core QAPP_2008 July 18_Rev1_worksheet1-19.doc
Introduction
This Quality Assurance Project Plan and Field Sampling Plan (QAPP/FSP) Addendum is an addendum to the August 2005 Lower Passaic River Restoration Project (herein referred to as the LPRRP) QAPP and January 2006 FSP Volume 1. This QAPP/FSP Addendum details the planning and sampling processes for collecting low resolution sediment core samples to determine nature and extent of sediment impacts, including identification of potential source areas, and to characterize physical characteristics of the sediment, as required by the Settlement Agreement and Order on Consent (Settlement Agreement) and Statement of Work (SOW) of May 2007. This plan describes the implementation of the sampling, analysis, and associated Quality Assurance (QA) and Quality Control (QC) activities developed for this program.
This document adopts United States Environmental Protection Agency (USEPA) applicable Uniform Federal Policy (UFP) QAPP Worksheets [Publication Numbers: USEPA: EPA-505-B-04-900A; Department of Defense (DoD): DTIC ADA 427785] (USEPA 2005) and Standard Operating Procedures (SOPs) for the field activities. Note, the USEPA-approved Newark Bay Study Area Remedial Investigation Work Plan Sediment Sampling and Source Identification Program Phase II (Tierra Solutions, Inc. 2007) QAPP Worksheets and SOPs along with the approved QAPP/FSP Addendum for Lower Passaic River Restoration Project Empirical Mass Balance Evaluation (Malcolm Pirnie Inc. [MPI] 2007) were utilized for compilation of the QAPP/FSP Addendum format and content as they were reviewed and previously approved by USEPA.
This document includes the following components: the QAPP, the FSP Addendum (included as Appendix A of the QAPP), the field SOPs (Appendix B of the QAPP), the laboratory SOPs (Appendix C of the QAPP), and Appendix D, which includes the proposed bioavailability protocols for the polychlorinated biphenyls (PCB) partitioning study.
Background Information
The Lower Passaic River Study Area (LPRSA) encompasses the 17-mile tidal reach of the Passaic River below the Dundee Dam, its tributaries, and the surrounding watershed that hydrologically drains below the Dundee Dam (Figure 1 of the FSP Addendum, included as Appendix A to this QAPP). Overall goals of the Remedial Investigation/Feasibility Study (RI/FS) and a description of the associated investigations have been presented in the Work Plan (MPI 2005a), three Field Sampling Plans (FSP1 [MPI 2006a], FSP2 [MPI 2006b], and FSP3 [MPI 2005b]), and a QAPP (MPI 2005c).
The Cooperating Parties Group (CPG) agreed, in May 2007, to conduct an RI/FS that includes scopes of work identified in FSP1, FSP2, and FSP3. The purpose of this QAPP/ FSP Addendum is to provide field and analytical details for the initiation of FSP1 task – Low Resolution Sediment Coring (Section 5.0 of FSP1 [MPI, 2006a]). The CPG has met with USEPA on two occasions and had multiple conference calls to discuss details of the upcoming field program. USEPA’s recommendations, to which the CPG agreed, are included in this QAPP/FSP Addendum.

Section: Introduction Revision: 0
Date: May 2008
Quality Assurance Project Plan RI Low Resolution Coring/Sediment Sampling Lower Passaic River Restoration Project Newark, New Jersey Page 2 of 6
J:\Water\ProjectFiles\P120\12182_Passaic\QAPP\Rev 1_July 2008\2008_Low Res Core QAPP_2008 July 18_Rev1_worksheet1-19.doc
Low Resolution Sediment Coring and Sampling, Lower Passaic River, River Mile (RM) 0-17, Tributaries and Dundee Dam
The field sampling activities for this project include the following work elements:
• Sampling locations: A total of 115 sampling locations are proposed for this investigation, including 98 stations along the Lower Passaic River; 7 stations above Dundee Dam; 3 stations on each of the Second, Third, and Saddle Rivers, and one station on the unnamed creek (Figures 2A through 2I of the FSP Addendum). Sampling locations were chosen to provide representative nature and extent coverage, identify potential source areas, and gather physical characteristics data to understand sediment stability over the study area. Selection was based on the following considerations:
• Transect spacing of 0.25 in RM 0 to 1 where previous sampling has not been conducted • General coverage with minimum approximate 0.5-mile spacing between transects of cores
above RM 7 • One-mile transect spacing minimum coverage within River Mile (RM) 1.5 to 6.5, with the goal
to:
1) Refresh surface sediment concentrations; the Passaic River Study Area (PRSA) sediment data were obtained in 1995.
2) Characterize cores that are considered “incomplete” (i.e., cores with elevated concentrations in the deepest segment analyzed). Note that the goals for the two studies differ. The goal for sampling the PRSA (i.e., RM1 to RM7) was to define the 1940 horizon. The RI/FS goal is to characterize sediment to the red-brown clay, sand, or refusal. However, where PRSA cores are “complete” (i.e., low concentrations were detected at depth), the CPG will sample from the 2008 sediment-water interface to the sediment-water interface sampled in 1995, including a 0 to 6-inch biological active zone (BAZ) sample, with the agreed upon segment sampling from -6 inches to the 1995 elevation.
3) Complete RI/FS requirements for determining nature and extent.
• Geomorphic region (channel, mudflat, bend, etc.) • Previously characterized sediment type • Previous characterization as erosional/depositional • Proximity to previous sampling locations • Proximity to potential contamination sources • Dundee Dam and tributary samples are intended to characterize potential upgradient sources
to the LPRSA
A summary of how these selection criteria apply to each proposed location is presented in Table 1 of the FSP Addendum (Appendix A) and in QAPP Worksheet #18, along with target station coordinates. The ”target coordinate area” will be checked for obstructions by probing, where necessary. In addition, in hard bottom areas where gravel is found, probing will be conducted to determine if vibracoring can be performed at the target coordinate. Where not amenable to coring, probing will check for other suitable areas within the 25-foot radius defined as a sample location. If no locations within the target radius appear amenable to coring, then the probing will move out (up- and down-stream), along a transect parallel to shore through the target location, to find the closest suitable

Section: Introduction Revision: 0
Date: May 2008
Quality Assurance Project Plan RI Low Resolution Coring/Sediment Sampling Lower Passaic River Restoration Project Newark, New Jersey Page 3 of 6
J:\Water\ProjectFiles\P120\12182_Passaic\QAPP\Rev 1_July 2008\2008_Low Res Core QAPP_2008 July 18_Rev1_worksheet1-19.doc
location for attempting a core(s). If no locations are found within 300 feet up- or down-stream, the cores will be attempted within original target zone. To obtain data representative of sediment conditions within the transect, geomorphology data, including bathymetry and surface sediment type, was reviewed to locate proposed samples. In the lower river, the data suggested that three samples per transect were required; whereas, in the upper river, above RM 8, two samples per transect could meet the objective.
Target coring depths for each station were developed based on a review of available geotechnical boring, core, and probe data from the LPRSA and Newark Bay, and are utilized for estimation of the total number of samples in Worksheet #20. Target depths were selected to fully characterize the potential thickness of sediment deposited since the initiation of dredging along the LPRSA. Target coring depths for each station are presented in QAPP Worksheet #18 and Table 1 of the FSP Addendum. To verify the depth of contamination, low resolution cores are intended to penetrate to the red-brown clay, sand, or refusal.
In addition, per agreement with USEPA, to address a component of FSP1 Task 5.3.3, which includes the collection of fine segmentation of “core top” samples from a subset of the cores (to address sediment transport modeling and risk assessment data needs), eight of the planned locations will complete this additional analysis. The proposed core(s) segmentation and grab sampling will be completed at all locations as well. A box core will be utilized for collection of surface sediment to be split into five segments, per USEPA required segments:
• 0 to 2 centimeters (cm) • 2 to 5 cm • 5 to 10 cm • 10 to 30 cm • 30 cm to 2 feet
One box core will be collected at each of the eight locations, shown in Table 1 of the FSP Addendum as the Group D analyte group. The segments will be analyzed utilizing the sample prioritization scheme found in Table 3 in the FSP Addendum. The analytes will be collected in the order requested by USEPA on March 28, 2008. One box core will be collected from each location. The analytes not available from the box core finer segmentation will be available from the core and grab samples collected at the same location.
• The investigation proposed in this QAPP/FSP Addendum is considered a single event and the first phase of the Remedial Investigation (RI), which may require additional low resolution coring in select areas of the river. The sampling is estimated to have a duration of approximately three months.
• The sample collection approach includes the combination of both sediment grabs and vibracores. An initial grab sample will be collected at each station using a modified Van Veen grab. The goal of the grab sampling is to collect a relatively undisturbed, representative surficial sample, from 0 to 1 inch below the sediment-water interface for beryllium-7 and from 0 to 0.5 feet (ft) below the sediment-water interface for additional analytes.

Section: Introduction Revision: 0
Date: May 2008
Quality Assurance Project Plan RI Low Resolution Coring/Sediment Sampling Lower Passaic River Restoration Project Newark, New Jersey Page 4 of 6
J:\Water\ProjectFiles\P120\12182_Passaic\QAPP\Rev 1_July 2008\2008_Low Res Core QAPP_2008 July 18_Rev1_worksheet1-19.doc
A vibracore system will be used to collect sediment samples from the sediment surface to the target depth estimated for each station in QAPP Worksheet #18 and Table 1 of the FSP Addendum. The surface segment of the core will be used prior to the grab samples, following the prioritization presented in Tables 3 and 4 of the FSP Addendum. Low resolution cores are intended to penetrate to the red-brown clay, sand, or refusal, to verify the depth of contamination.
Longer cores will be sectioned as needed on the sampling vessel, to facilitate handling and to ensure that the cores are maintained upright during transport and storage. Sample processing and transfer to sample containers will be performed at the field facility. The field facility, located at the Kelways Industrial Park in East Rutherford (at approximately RM 13.5), will be the base for the sediment coring effort. Indoor space at the facility will be used for staging operations and for processing the cores prior to transmitting the samples to the laboratories for analysis. The floating dock located at the field facility will be used for vessel mobilization for stations located in the middle and upper sections of the study area. Samples will be collected according to the following segmentation scheme:
Depth below sediment water interface
0 to 0.5 ft surface sediment (in conjunction with grab sampling of this layer)
0.5 to 1.5 ft 1-foot segment
1.5 to 2.5 ft 1-foot segment
2.5 to 3.5 ft 1-foot segment
3.5 to 5.5 ft 2-foot segment
5.5 + ft 2-foot segments continue to the to the red-brown clay layer, sand, or refusal
Where sand is encountered as a layer that completely underlies the recent, fine-grained sediments (rather than as a shallow sand lens), it will be sampled for a subset of analytes, as agreed to with USEPA. Limited analyses that include polycyclic aromatic hydrocarbons (PAHs), metals, cyanide, semivolatile organic compounds (SVOCs), total petroleum hydrocarbons (TPH) extractables, total organic carbon (TOC), grain size, and volatile organic compounds (VOCs) will be performed where sand is found at the bottom of the core. The analytes will be taken out of the primary core only, so all analytes may not be achievable in all samples.
Under certain conditions, the segmentation scheme may be altered. With the agreement of the RI Field Task Manager (RI FTM), where a stratigraphic change in the sediment sequence (e.g., change in sediment size, obvious depositional boundary or unconformity) occurs within a segment, the sampling of that segment may be altered. This will prevent different material types, with possibly different depositional ages, from being mixed together in the same sample. Segments will be reduced below 1 foot only where it appears that the sediment density is such that sufficient solids are present to satisfy the laboratory sample volume requirement.
• As the initial phase of the overall RI/Feasibility Study (FS) sediment characterization, this investigation will include a wide range of sediment analyses. Four groups of analyses are proposed:
Group A - A comprehensive list of physical and inorganic and organic chemical analyses is proposed for the full set of stations and depths. The list of chemical analyses includes VOCs, SVOCs, PAHs,

Section: Introduction Revision: 0
Date: May 2008
Quality Assurance Project Plan RI Low Resolution Coring/Sediment Sampling Lower Passaic River Restoration Project Newark, New Jersey Page 5 of 6
J:\Water\ProjectFiles\P120\12182_Passaic\QAPP\Rev 1_July 2008\2008_Low Res Core QAPP_2008 July 18_Rev1_worksheet1-19.doc
organochlorine pesticides, PCBs, herbicides, polychlorinated dibenzodioxins/polychlorinated dibenzofurans (PCDDs/PCDFs), TPH extractables, metals, butyltins, radionuclides, TOC, and total sulfide (surficial sample only).
Toxaphene is proposed to be analyzed by two methods − high resolution gas chromatography/high resolution mass spectrometry (HRGS/HRMS) and gas chromatography/mass spectrometry (GC/MS) (refer to Worksheet #23 and Appendix C). Toxaphene results and the associated QC data will be reviewed throughout the program. If toxaphene is not detected after an adequate number of analyses, the CPG may petition to drop the analysis of this parameter by HRGC/HRMS.
Group B - Additional organic, nutrient, and pathogen analyses are proposed for samples from 13 stations over the length of the study area to determine their relevance in future investigation phases. The 13 stations, shown in Worksheet #18, were selected by reviewing the sample maps to ensure coverage within the full length of the river, with a focus on areas of finer-grained sediments, and review of station details in terms of depths and expected sediment type. These analyses include TPH (purgeable), hexavalent chromium, methyl mercury, acid volatile sulfide/simultaneously extracted metals (AVS/SEM), total phosphorus, ammonia (as N), total Kjeldahl nitrogen (TKN), E. Coli, and Giardia.
Group C - Additional particle size-density classification, microscopy, petrography, and PCB sediment-water partitioning analysis is proposed for up to seven stations to allow for evaluation of this analytical technique for use in future investigation phases. To select the locations for the seven samples for method development, for five or six of the locations, the CPG will use the laboratory screening level PCB analysis conducted prior to conducting HRGC/HRMS quantification of PCB congeners, along with the physical description. In addition, location 2008 CLRC-007 was specifically requested for analysis by USEPA (Note: CLRC = CPG Low Resolution Core). If this sample meets the screening criteria, five other locations will be selected. If the sample does not meet the screening criteria, it will still be analyzed and six other locations will be analyzed as well. Appendix D provides the details of this sampling effort.
Group D - For this analysis, the top segment of core will be divided into five layers (i.e., 0 to 2 cm, 2 to 5 cm, 5 to 10 cm, 10 to 30 cm, 30 cm to 2 feet) to provide the resolution required to define the sediment bed in the sediment transport model. For these five sediment core segments, HydroQual indicated that the following analyses would be required:
• Grain size • Bulk density • Concentration of any contaminant to be modeled via the future Contaminant Fate and Transport model
The chemical contaminants will be collected in the hierarchy presented in FSP Addendum Table 3.
HydroQual requested that the grain size analyses include the specific sieve sizes listed below

Section: Introduction Revision: 0
Date: May 2008
Quality Assurance Project Plan RI Low Resolution Coring/Sediment Sampling Lower Passaic River Restoration Project Newark, New Jersey Page 6 of 6
J:\Water\ProjectFiles\P120\12182_Passaic\QAPP\Rev 1_July 2008\2008_Low Res Core QAPP_2008 July 18_Rev1_worksheet1-19.doc
Particle Size Classes Required for Sediment Grain Size Analysis Sieve Number Size (μm) NA Fine Fraction1 230 63 140 106 100 150 60 250 40 425 30 600 16 1140 8 2360 4 4750
For sieve sizes smaller than 63 micrograms (μm), the hydrometer technique will be used. The recommended sizes for the hydrometer analysis are 63 to 31 μm, 31 to 16 μm, 16 to 8 μm, 8 to 4 μm, and less than 4 μm.
A summary of the analyses and methods for each group noted above is presented in Table 2 of the FSP Addendum. Specific stations designated for the additional Group B and D analyses are noted in QAPP Worksheet #18 and Table 1 of the FSP Addendum. The specific analytes associated with each analytical group are listed in QAPP Worksheet #15.

Section: Worksheet #1 Revision: 1
Date: July 2008
Quality Assurance Project Plan Phase I RI Low Resolution Coring/Sediment Sampling Lower Passaic River Restoration Project Newark, New Jersey Page 1 of 1
J:\Water\ProjectFiles\P120\12182_Passaic\QAPP\Rev 1_July 2008\2008_Low Res Core QAPP_2008 July 18_Rev1_worksheet1-19.doc
QAPP Worksheet #1 (UFP-QAPP Manual Section 2.1) Title and Approval Page
Document Title: QAPP/ FSP Addendum for Lower Passaic River Restoration Project: Low Resolution Sediment Coring Lead Organization: Cooperating Parties Group and de maximis, inc. Preparer’s Name and Organizational Affiliation: Debra Simmons, ENSR Preparer’s Address, Telephone Number, and E-mail Address:
2 Technology Park Drive, Westford, MA 01886-3140
978-589-3000
Preparation Date (Day/Month/Year): May, 2008 Investigative Organization’s Project Manager David Nakles/ ENSR/ July 2008 Investigative Organization’s Project QA Manager
Debra Simmons/ ENSR/ July 2008 Lead Organization’s Project Manager
Bill Potter/ Robert Law/ de maximis, inc / July 2008

Section: Worksheet #2 Revision: 1
Date: July 2008
Quality Assurance Project Plan Phase I RI Low Resolution Coring/Sediment Sampling Lower Passaic River Restoration Project Newark, New Jersey Page 1 of 5
QAPP Worksheet #2 (UFP-QAPP Manual Section 2.2.4) QAPP Identifying Information
J:\Water\ProjectFiles\P120\12182_Passaic\QAPP\Rev 1_July 2008\2008_Low Res Core QAPP_2008 July 18_Rev1_worksheet1-19.doc
Site Name/Project Name: Diamond Alkali Operable Unit (OU 2) - LPRRP RI/FS
Site Location: Lower Passaic River Study Area (LPRSA), New Jersey Site Number/Code: CERCLA Document No. 02-2007-2009 Operable Unit: OU 2 Contractor Name: ENSR Contractor Number: Not Applicable (N/A) Contract Title: N/A Work Assignment Number: N/A
1. Identify guidance used to prepare QAPP:
Uniform Federal Policy for Quality Assurance Project Plans. Evaluating, Assessing, and Documenting Environmental Data Collection and Use Programs. Part 1: UFP-QAPP Manual. Final Version 1. March 2005. Intergovernmental Data Quality Task Force (US Environmental Protection Agency, US Department of Defense, US Department of Energy). USEPA 505-B-04-900A.
2. Identify regulatory program: Comprehensive Environmental Response Compensation, and Liability Act. (CERCLA)
3. Identify approval entity: USEPA Region 2
4. Indicate whether the QAPP is a generic or a project-specific QAPP. (circle one)
5. List dates of scoping sessions that were held:
February 6, 2008; February 27, 2008
6. List dates and titles of QAPP and FSP documents written for previous site work, if applicable:
Title MPI, 2007. QAPP/FSP Addendum for Lower Passaic River Restoration Project Empirical Mass Balance Evaluation. December Tierra Solutions, Inc., 2007. Newark Bay Study Area Remedial Investigation Work Plan Sediment Sampling and Source Identification Program Newark Bay, New Jersey Phase II. Revision 2 October. MPI. 2005. Lower Passaic River Restoration Project. Quality Assurance Project Plan. Prepared for US Environmental Protection Agency and US Army Corps of Engineers. Malcolm Pirnie, Inc., White Plains, NY. MPI. 2006. Lower Passaic River Restoration Project. Field Sampling Plan. Volume 1. Prepared for US Environmental Protection Agency, US Army Corps of Engineers. Malcolm Pirnie, Inc., White Plains, NY.

Section: Worksheet #2 Revision: 1
Date: July 2008
Quality Assurance Project Plan Phase I RI Low Resolution Coring/Sediment Sampling Lower Passaic River Restoration Project Newark, New Jersey Page 2 of 5
QAPP Worksheet #2 (UFP-QAPP Manual Section 2.2.4) QAPP Identifying Information
J:\Water\ProjectFiles\P120\12182_Passaic\QAPP\Rev 1_July 2008\2008_Low Res Core QAPP_2008 July 18_Rev1_worksheet1-19.doc
7. List organizational partners (stakeholders) and connection with lead organization:
This work will be performed under the requirements of the Settlement Agreement and SOW with oversight conducted by USEPA and its government partners. de maximis, inc. (acting as Project Coordinator for the CPG), ENSR, and its subcontractors, are conducting the work on behalf of the CPG.
8. List data users:__See item #7 above.__
9. If any required QAPP elements and required information are not applicable to the project, then circle the omitted QAPP elements and required information on the attached table. Provide an explanation for their exclusion below: N/A

Section: Worksheet #2 Revision: 1
Date: July 2008
Quality Assurance Project Plan Phase I RI Low Resolution Coring/Sediment Sampling Lower Passaic River Restoration Project Newark, New Jersey Page 3 of 5
QAPP Worksheet #2 (UFP-QAPP Manual Section 2.2.4) QAPP Identifying Information
J:\Water\ProjectFiles\P120\12182_Passaic\QAPP\Rev 1_July 2008\2008_Low Res Core QAPP_2008 July 18_Rev1_worksheet1-19.doc
Required QAPP Element(s) and Corresponding QAPP Section(s) Required Information
Crosswalk to QAPP Worksheet No. or
Related Documents
Project Management and Objectives
2.1 Title and Approval Page - Title and Approval Page 1
2.2 Document Format and Table of Contents 2.2.1 Document Control Format 2.2.2 Document Control Numbering
System 2.2.3 Table of Contents 2.2.4 QAPP Identifying Information
- Table of Contents - QAPP Identifying Information
2
2.3 Distribution List and Project Personnel Sign-Off Sheet
2.3.1 Distribution List 2.3.2 Project Personnel Sign-Off Sheet
- Distribution List - Project Personnel Sign-Off Sheet
3 4
2.4 Project Organization 2.4.1 Project Organizational Chart 2.4.2 Communication Pathways 2.4.3 Personnel Responsibilities and
Qualifications 2.4.4 Special Training Requirements and Certification
- Project Organizational Chart - Communication Pathways - Personnel Responsibilities and
Qualifications Table - Special Personnel Training Requirements
Table
5 6 7 8
2.5 Project Planning/Problem Definition 2.5.1 Project Planning (Scoping) 2.5.2 Problem Definition, Site History, and
Background
- Project Planning Session Documentation (including Data Needs tables)
- Project Scoping Session Participants Sheet - Problem Definition, Site History, and
Background - Site Maps (historical and present)
9 9 10 and Introduction FSP Addendum
2.6 Project Quality Objectives (PQOs) and Measurement Performance Criteria
2.6.1 Development of PQOs Using the Systematic Planning Process
2.6.2 Measurement Performance Criteria
- Site-Specific PQOs
- Measurement Performance Criteria Table
11 – Attachment 1 contains the Data Quality Objectives (DQOs) 12
2.7 Secondary Data Evaluation - Sources of Secondary Data and Information
- Secondary Data Criteria and Limitations Table
13
2.8 Project Overview and Schedule 2.8.1 Project Overview 2.8.2 Project Schedule
- Summary of Project Tasks - Reference Limits and Evaluation Table - Project Schedule/Timeline Table
14 15 16

Section: Worksheet #2 Revision: 1
Date: July 2008
Quality Assurance Project Plan Phase I RI Low Resolution Coring/Sediment Sampling Lower Passaic River Restoration Project Newark, New Jersey Page 4 of 5
QAPP Worksheet #2 (UFP-QAPP Manual Section 2.2.4) QAPP Identifying Information
J:\Water\ProjectFiles\P120\12182_Passaic\QAPP\Rev 1_July 2008\2008_Low Res Core QAPP_2008 July 18_Rev1_worksheet1-19.doc
Required QAPP Element(s) and Corresponding QAPP Section(s) Required Information
Crosswalk to QAPP Worksheet No. or
Related Documents
Measurement/Data Acquisition
3.1 Sampling Tasks 3.1.1 Sampling Process Design and
Rationale 3.1.2 Sampling Procedures and
Requirements 3.1.2.1 Sampling Collection
Procedures 3.1.2.2 Sample Containers, Volume,
and Preservation 3.1.2.3 Equipment/Sample Containers
Cleaning and Decontamination Procedures
3.1.2.4 Field Equipment Calibration, Maintenance, Testing, and Inspection Procedures
3.1.2.5 Supply Inspection and Acceptance Procedures
3.1.2.6 Field Documentation Procedures
- Sampling Design and Rationale - Sample Location Map - Sampling Locations and Methods/ SOP
Requirements Table - Analytical Methods/SOP Requirements
Table - Field QC Sample Summary Table - Sampling SOPs - Project Sampling SOP References Table - Field Equipment Calibration, Maintenance,
Testing, and Inspection Table
17 FSP Addendum 18 19 20 Appendix B 21 22
3.2 Analytical Tasks 3.2.1 Analytical SOPs 3.2.2 Analytical Instrument Calibration
Procedures 3.2.3 Analytical Instrument and
Equipment Maintenance, Testing, and Inspection Procedures
3.2.4 Analytical Supply Inspection and Acceptance Procedures
- Analytical SOPs - Analytical SOP References Table - Analytical Instrument Calibration Table - Analytical Instrument and Equipment
Maintenance, Testing, and Inspection Table
Appendix C 23 24 25
3.3 Sample Collection Documentation, Handling, Tracking, and Custody Procedures
3.3.1 Sample Collection Documentation 3.3.2 Sample Handling and Tracking
System 3.3.3 Sample Custody
- Sample Collection Documentation - Handling, Tracking, and Custody SOPs - Sample Container Identification - Sample Handling Flow - Example Chain-of-Custody Form and Seal
26 Appendix B 27 27 Appendix B
3.4 QC Samples 3.4.1 Sampling QC Samples 3.4.2 Analytical QC Samples
- QC Samples Table
28

Section: Worksheet #2 Revision: 1
Date: July 2008
Quality Assurance Project Plan Phase I RI Low Resolution Coring/Sediment Sampling Lower Passaic River Restoration Project Newark, New Jersey Page 5 of 5
QAPP Worksheet #2 (UFP-QAPP Manual Section 2.2.4) QAPP Identifying Information
J:\Water\ProjectFiles\P120\12182_Passaic\QAPP\Rev 1_July 2008\2008_Low Res Core QAPP_2008 July 18_Rev1_worksheet1-19.doc
Required QAPP Element(s) and Corresponding QAPP Section(s) Required Information
Crosswalk to QAPP Worksheet No. or
Related Documents 3.5 Data Management Tasks 3.5.1 Project Documentation and Records 3.5.2 Data Package Deliverables 3.5.3 Data Reporting Formats 3.5.4 Data Handling and Management 3.5.5 Data Tracking and Control
- Project Documents and Records Table - Analytical Services Table - Data Management Procedures
29 30 Data Management Plan (ENSR 2007)
Assessment/Oversight
4.1 Assessments and Response Actions 4.1.1 Planned Assessments 4.1.2 Assessment Findings and
Corrective Action Responses
- Planned Project Assessments Table - Assessment Findings and Corrective
Action Responses Table
31 32
4.2 QA Management Reports - QA Management Reports Table 33
4.3 Final Project Report To be completed following data collection Not Available (NA)
Data Review
5.1 Overview 5.2 Data Review Steps 5.2.1 Step I: Verification 5.2.2 Step II: Validation 5.2.2.1 Step IIa Validation Activities 5.2.2.2 Step IIb Validation Activities 5.2.3 Step III: Usability Assessment 5.2.3.1 Data Limitations and Actions
from Usability Assessment 5.2.3.2 Activities
- Verification (Step I) Process Table - Validation (Steps IIa and IIb) Process Table - Validation (Steps IIa and IIb) Summary
Table - Usability Assessment
34 35 36 37
5.3 Streamlining Data Review 5.3.1 Data Review Steps To Be
Streamlined 5.3.2 Criteria for Streamlining Data
Review 5.3.3 Amounts and Types of Data
Appropriate for Streamlining
To be completed following data evaluation NA

Section: Worksheet #3 Revision: 1
Date: July 2008
Quality Assurance Project Plan Phase I RI Low Resolution Coring/Sediment Sampling Lower Passaic River Restoration Project Newark, New Jersey Page 1 of 3
J:\Water\ProjectFiles\P120\12182_Passaic\QAPP\Rev 1_July 2008\2008_Low Res Core QAPP_2008 July 18_Rev1_worksheet1-19.doc
QAPP Worksheet #3 (UFP-QAPP Manual Section 2.3.1) Distribution List
The following persons will receive a copy of the approved Final QAPP, subsequent QAPP revisions, addenda, and amendments:
QAPP Recipients Title Organization Telephone
Number E-mail Address
Document Control Number
Alice Yeh
Tom Taccone Remedial Project Manager (RPM)
USEPA Region 2 212.637.4427
212.637.4281
William Sy Project QA Officer USEPA Region 2 732.632.4766 [email protected]
Lisa Baron Project Manager (PM)
United States Army Corps of Engineers (USACE)-NY District
917.790.8306 [email protected]
Janine MacGregor Project Coordinator
New Jersey Department of Environmental Protection (NJDEP)
609.633.0784 [email protected]
Tim Kubiak Assistant Supervisor of Environmental Contaminants
United States Fish and Wildlife Service (USFWS)
609.646.9310
(ext. 26) [email protected]
Reyhan Mehran Coastal Resource Coordinator
National Oceanographic and Atmospheric Administration (NOAA)
212.637.3257 [email protected]

Section: Worksheet #3 Revision: 1
Date: May 2008
Quality Assurance Project Plan Phase I RI Low Resolution Coring/Sediment Sampling Lower Passaic River Restoration Project Newark, New Jersey Page 2 of 3
QAPP Worksheet #3 (UFP-QAPP Manual Section 2.3.1) Distribution List
J:\Water\ProjectFiles\P120\12182_Passaic\QAPP\Rev 1_July 2008\2008_Low Res Core QAPP_2008 July 18_Rev1_worksheet1-19.doc
QAPP Recipients Title Organization Telephone
Number E-mail Address
Document Control Number
Bill Potter
Robert Law CPG Project Coordinator de maximis, inc. 908.735.9315
William Hyatt Coordinating Counsel
Kirkpatrick and Lockhart Preston Gates Ellis LLP (K&L Gates)
973.848.4045 [email protected]
Polly Newbold CPG QA Coordinator ddmis, inc 908.479.1975 [email protected]
Dave Nakles ENSR RI/FS PM ENSR 412.380.0140 [email protected]
Kris Carbonneau Deputy RI/FS PM ENSR 978.589.3377 [email protected]
Kathy Harvey ENSR Regional Environmental Health and Safety (EHS) Manager
ENSR 978.589.3325 [email protected]
Jenny Phillips RI Task Manager ENSR 970.493.8878 [email protected]
Don Boyé RI FTM ENSR 978.589.3177 [email protected]
Bruce Coulombe RI FTM ENSR 607.277.5716 [email protected]
Alek Modjeski Onsite Field Coordinator/ Site Safety Officer (SSO)
ENSR 732.981.0200 [email protected]
Debra Simmons Project QA Manager ENSR 978.589.3358 [email protected]
Mary Kozik Project Chemist ENSR 978.589.3338 [email protected]
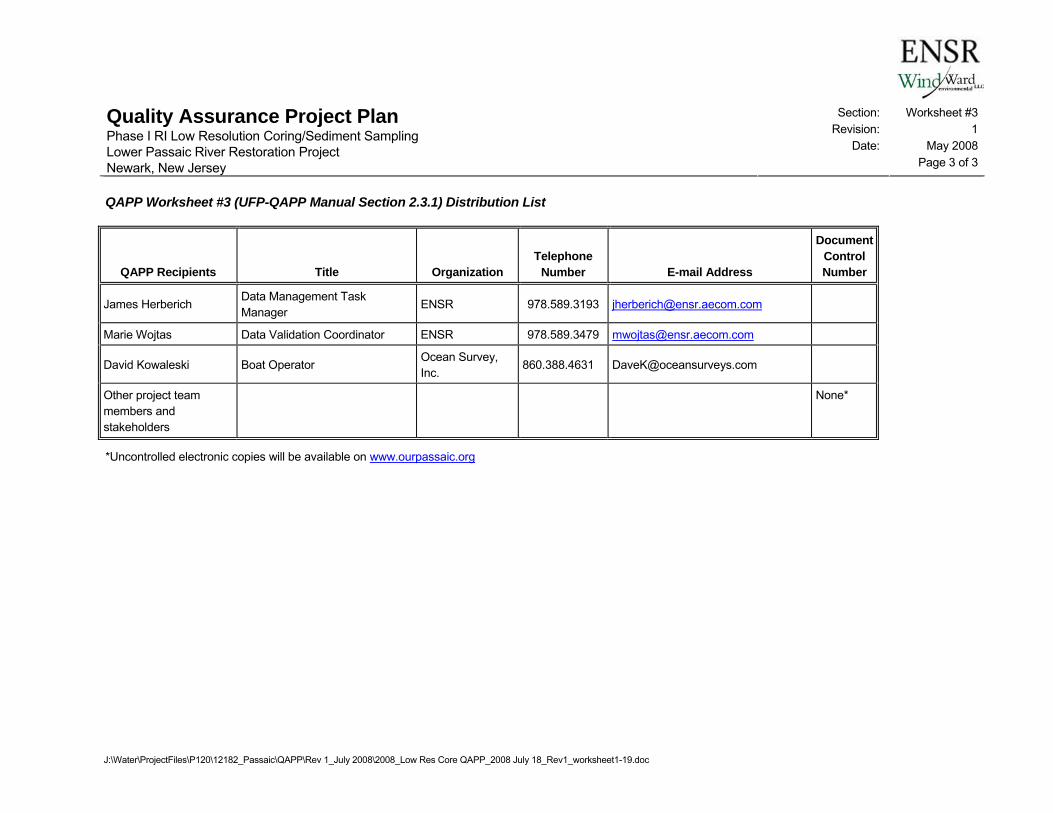
Section: Worksheet #3 Revision: 1
Date: May 2008
Quality Assurance Project Plan Phase I RI Low Resolution Coring/Sediment Sampling Lower Passaic River Restoration Project Newark, New Jersey Page 3 of 3
QAPP Worksheet #3 (UFP-QAPP Manual Section 2.3.1) Distribution List
J:\Water\ProjectFiles\P120\12182_Passaic\QAPP\Rev 1_July 2008\2008_Low Res Core QAPP_2008 July 18_Rev1_worksheet1-19.doc
QAPP Recipients Title Organization Telephone
Number E-mail Address
Document Control Number
James Herberich Data Management Task Manager
ENSR 978.589.3193 [email protected]
Marie Wojtas Data Validation Coordinator ENSR 978.589.3479 [email protected]
David Kowaleski Boat Operator Ocean Survey, Inc.
860.388.4631 [email protected]
Other project team members and stakeholders
None*
*Uncontrolled electronic copies will be available on www.ourpassaic.org

Section: Worksheet #4 Revision: 1
Date: July 2008
Quality Assurance Project Plan Phase I RI Low Resolution Coring/Sediment Sampling Lower Passaic River Restoration Project Newark, New Jersey Page 1 of 2
J:\Water\ProjectFiles\P120\12182_Passaic\QAPP\Rev 1_July 2008\2008_Low Res Core QAPP_2008 July 18_Rev1_worksheet1-19.doc
QAPP Worksheet #4 (UFP-QAPP Manual Section 2.3.2) Project Personnel Sign-Off Sheet
Organization: A completed sign-off sheet will be maintained in the files for each organization represented below.
Project Personnel Title Telephone Number Signature* Date QAPP Read
Bill Potter/Robert Law CPG Project Coordinator 908.735.9315
Polly Newbold CPG QA Coordinator 908.479.1975
Dave Nakles ENSR RI/FS PM 412.380.0140
Kris Carbonneau ENSR Deputy RI/FS PM 978.589.3377
Jenny Phillips ENSR RI Task Manager 970.493.8878
Don Boyé ENSR RI FTM 978.589.3177
Bruce Coulombe ENSR RI FTM 607.277.5716
Alek Modjeski Onsite Field Coordinator/SSO 732.981.0200
Debra Simmons ENSR Project QA Manager 978.589.3358
Mary Kozik ENSR Project Chemist 978.589.3338
James Herberich ENSR Data Management Task Manager 978.589.3193
Marie Wojtas ENSR Data Validation Coordinator 978.589.3479
David Kowaleski Boat Operator 860.388.4631
See Worksheet #30 Laboratory PM See Worksheet #30
*Signature indicates that personnel have read the applicable QAPP sections and will perform the tasks as described.

Section: Worksheet #4 Revision: 1
Date: July 2008
Quality Assurance Project Plan Phase I RI Low Resolution Coring/Sediment Sampling Lower Passaic River Restoration Project Newark, New Jersey Page 2 of 2
QAPP Worksheet #4 (UFP-QAPP Manual Section 2.3.2) Project Personnel Sign-Off Sheet
J:\Water\ProjectFiles\P120\12182_Passaic\QAPP\Rev 1_July 2008\2008_Low Res Core QAPP_2008 July 18_Rev1_worksheet1-19.doc
Organization:
Project Personnel Title Telephone Number Signature* Date QAPP Read
*Signature indicates that personnel have read the applicable QAPP sections and will perform the tasks as described.

Section: Worksheet #5 Revision: 1
Date: July 2008
Quality Assurance Project Plan Phase I RI Low Resolution Coring/Sediment Sampling Lower Passaic River Restoration Project Newark, New Jersey Page 1 of 1
J:\Water\ProjectFiles\P120\12182_Passaic\QAPP\Rev 1_July 2008\2008_Low Res Core QAPP_2008 July 18_Rev1_worksheet1-19.doc
QAPP Worksheet #5 (UFP-QAPP Manual Section 2.4.1) Project Organizational Chart

Section: Worksheet #6 Revision: 1
Date: July 2008
Quality Assurance Project Plan Phase I RI Low Resolution Coring/Sediment Sampling Lower Passaic River Restoration Project Newark, New Jersey Page 1 of 3
J:\Water\ProjectFiles\P120\12182_Passaic\QAPP\Rev 1_July 2008\2008_Low Res Core QAPP_2008 July 18_Rev1_worksheet1-19.doc
QAPP Worksheet #6 (UFP-QAPP Manual Section 2.4.2) Communication Pathways
Communication Drivers Responsible Entity Name Phone Number Procedure
(timing, pathways, etc.)
Field activities status and issues
ENSR RI FTM Don Boyé Bruce Coulombe
978.589.3177 607.277.5716 607.351.9545 (cell)
Communicate daily, or as needed, with ENSR field personnel, subcontractors, and ENSR RI Task Manager directly, or via e-mail or phone. Minor work plan deviations and/or proposed revisions will be documented and communicated in writing, with a copy sent to USEPA.
Sampling progress/laboratory coordination
ENSR On-site Field Coordinator
Alek Modjeski 732.981.0200 Cell 732.589.5116
Communicate daily, or as needed, with ENSR RI FTM and Project Chemist via e-mail or phone.
Health and safety briefings and updates
ENSR SSO Alek Modjeski 732.981.0200 Cell 732.589.5116
Communicate daily, or as needed, with field personnel and boat operators directly, or via e-mail or phone.
Significant health and safety concerns or incidents
ENSR SSO Alek Modjeski 732.981.0200 Cell 732.589.5116
Communicate immediately with ENSR Regional EHS Manager and ENSR RI/FS PM.
Sampling vessel operations Sampling Vessel Captain David Kowaleski Ocean Surveys, Inc.
860.388.4631 Communicate daily, or as needed, with ENSR On-Site Coordinator or ENSR RI FTM directly. The sampling vessel captain has the ultimate authority for stopping work while working on water. The vessel captain, in consultation with the SSO, will follow guidelines documented in the site-specific Health and Safety Plan (HASP). In addition, standard safe boating practices related to weather conditions and vessel operations will also apply, even if not specifically addressed in the HASP.

Section: Worksheet #6 Revision: 1
Date: July 2008
Quality Assurance Project Plan Phase I RI Low Resolution Coring/Sediment Sampling Lower Passaic River Restoration Project Newark, New Jersey Page 2 of 3
QAPP Worksheet #6 (UFP-QAPP Manual Section 2.4.2) Communication Pathways
J:\Water\ProjectFiles\P120\12182_Passaic\QAPP\Rev 1_July 2008\2008_Low Res Core QAPP_2008 July 18_Rev1_worksheet1-19.doc
Communication Drivers Responsible Entity Name Phone Number Procedure
(timing, pathways, etc.)
Analytical laboratory issues, including coordination with field, schedule, and technical issues
ENSR Project Chemist
Mary Kozik
978.589.3338
Communicate with ENSR On-Site Coordinator and Laboratory PM as needed via phone or e-mail.
Analytical data validation issues ENSR Data Validation Coordinator
Marie Wojtas 978.589.3479 Communicate with Laboratory PM as needed via phone or email.
Audit findings (field and/or laboratory)
ENSR Project QA Manager Debra Simmons 978.589.3358 Communicate findings to ENSR RI FTM or Laboratory PM (as appropriate); transmit final audit reports, including corrective actions, to ENSR RI/FS PM, ENSR RI Task Manager, and CPG QA Coordinator.
ENSR RI FTM Bruce Coulombe Don Boyé
607.277.5716 607.351.9545 (cell) 978.589.3177
ENSR Project Chemist Mary Kozik 978.589.3338
Issues potentially affecting DQOs
ENSR Data Validation Coordinator
Marie Wojtas 978.589.3479
Communicate as needed with ENSR QA Manager and ENSR RI Task Manager via e-mail or phone. Notification of the CPG QA Coordinator as appropriate.
ENSR RI Task Manager Jenny Phillips 970.493.8878 Communicate with ENSR RI/FS PM as needed, via e-mail or phone. Significant work plan modifications will be reported to USEPA in writing prior to implementation.
Sediment coring task implementation, including sampling, analysis, and reporting
ENSR RI Task Manager Jenny Phillips 970.493.8878 Communicate with ENSR RI/FS PM as needed, via e-mail or phone.
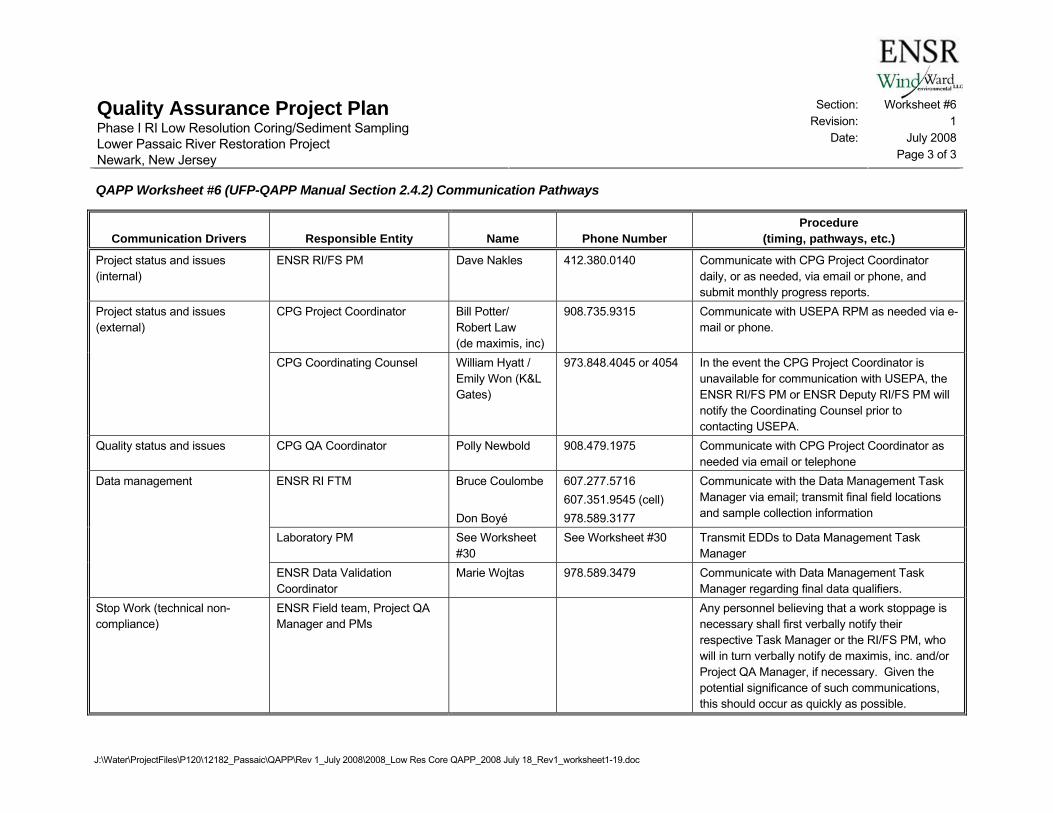
Section: Worksheet #6 Revision: 1
Date: July 2008
Quality Assurance Project Plan Phase I RI Low Resolution Coring/Sediment Sampling Lower Passaic River Restoration Project Newark, New Jersey Page 3 of 3
QAPP Worksheet #6 (UFP-QAPP Manual Section 2.4.2) Communication Pathways
J:\Water\ProjectFiles\P120\12182_Passaic\QAPP\Rev 1_July 2008\2008_Low Res Core QAPP_2008 July 18_Rev1_worksheet1-19.doc
Communication Drivers Responsible Entity Name Phone Number Procedure
(timing, pathways, etc.)
Project status and issues (internal)
ENSR RI/FS PM Dave Nakles 412.380.0140 Communicate with CPG Project Coordinator daily, or as needed, via email or phone, and submit monthly progress reports.
CPG Project Coordinator Bill Potter/ Robert Law (de maximis, inc)
908.735.9315 Communicate with USEPA RPM as needed via e-mail or phone.
Project status and issues (external)
CPG Coordinating Counsel William Hyatt / Emily Won (K&L Gates)
973.848.4045 or 4054 In the event the CPG Project Coordinator is unavailable for communication with USEPA, the ENSR RI/FS PM or ENSR Deputy RI/FS PM will notify the Coordinating Counsel prior to contacting USEPA.
Quality status and issues CPG QA Coordinator Polly Newbold 908.479.1975 Communicate with CPG Project Coordinator as needed via email or telephone
Data management ENSR RI FTM Bruce Coulombe Don Boyé
607.277.5716 607.351.9545 (cell) 978.589.3177
Communicate with the Data Management Task Manager via email; transmit final field locations and sample collection information
Laboratory PM See Worksheet #30
See Worksheet #30 Transmit EDDs to Data Management Task Manager
ENSR Data Validation Coordinator
Marie Wojtas 978.589.3479 Communicate with Data Management Task Manager regarding final data qualifiers.
Stop Work (technical non-compliance)
ENSR Field team, Project QA Manager and PMs
Any personnel believing that a work stoppage is necessary shall first verbally notify their respective Task Manager or the RI/FS PM, who will in turn verbally notify de maximis, inc. and/or Project QA Manager, if necessary. Given the potential significance of such communications, this should occur as quickly as possible.

Section: Worksheet #7 Revision: 1
Date: July 2008
Quality Assurance Project Plan Phase I RI Low Resolution Coring/Sediment Sampling Lower Passaic River Restoration Project Newark, New Jersey Page 1 of 5
J:\Water\ProjectFiles\P120\12182_Passaic\QAPP\Rev 1_July 2008\2008_Low Res Core QAPP_2008 July 18_Rev1_worksheet1-19.doc
QAPP Worksheet #7 (UFP-QAPP Manual Section 2.4.3) Personnel Responsibilities and Qualification Table
Name Title Organizational
Affiliation Responsibilities Education and Experience
Qualifications1
Robert Law CPG Project Coordinator
de maximis, inc. Overall responsibility for the safe and proper execution of task. Be available to discuss and review technical and other issues that may arise during work. Periodically review and audit work to ensure that work plan, project QA/QC, Health and Safety including both boating and hazardous materials worker safety procedures are being followed. All deviations from approved project plans will be discussed with and approved by the CPG Project Coordinator. Primary point of contact with the USEPA, its oversight contractor and the LPRSA Partner Agencies.
PhD, Geology, 26 years experience
Willard Potter CPG Project Coordinator
de maximis, inc. Overall responsibility for the safe and proper execution of task. Be available to discuss and review technical and other issues that may arise during work. Periodically review and audit work to ensure that work plan, project QA/QC, Health and Safety including both boating and hazardous materials worker safety procedures are being followed. All deviations from approved project plans will be discussed with and approved by the CPG Project Coordinator. Primary point of contact with the USEPA, its oversight contractor and the LPRSA Partner Agencies.
BS, Chemical Engineering, 36 years experience.

Section: Worksheet #7 Revision: 1
Date: July 2008
Quality Assurance Project Plan Phase I RI Low Resolution Coring/Sediment Sampling Lower Passaic River Restoration Project Newark, New Jersey Page 2 of 5
QAPP Worksheet #7 (UFP-QAPP Manual Section 2.4.3) Personnel Responsibilities and Qualification Table
J:\Water\ProjectFiles\P120\12182_Passaic\QAPP\Rev 1_July 2008\2008_Low Res Core QAPP_2008 July 18_Rev1_worksheet1-19.doc
Name Title Organizational
Affiliation Responsibilities Education and Experience
Qualifications1
David Nakles ENSR RI/FS PM ENSR Overall responsibility for completion of RI/ FS in accordance with and SOW requirements including technical, financial, and scheduling. Primary point of contact with CPG Project Coordinator.
PhD, Chemical Engineering and Engineering and Public Policy. 34 years experience.
Kristine Carbonneau Deputy RI/FS PM ENSR Technical assistance. Alternate point of contact if PM not available. FS lead.
MS, Civil Engineering. 23 years experience.
Jenny Phillips RI Task Manager ENSR Responsible for the execution and completion of the RI, including procurement of subcontractors, review of task deliverables, and serving as the focus for coordination of all field and laboratory tasks. The RI Task Manager will keep the ENSR RI/FS PM apprised of the status of the task, as well communicate any issues with the schedule, budget, or achievement of the task objectives.
MS, Environmental Toxicology. 20 years experience.
Bruce Coulombe RI FTM ENSR Responsible for implementing field sampling activities in accordance with the approved plans (FSP, QAPP, HASP), pertinent SOPs, and this Addendum. Primary responsibilities will include directing activities on site, monitoring subcontractor performance in the field, reviewing field records, and communicating daily with the ENSR RI Task Manager regarding status, quality issues, or delays.
MS, Marine Geology. 19 years experience

Section: Worksheet #7 Revision: 1
Date: July 2008
Quality Assurance Project Plan Phase I RI Low Resolution Coring/Sediment Sampling Lower Passaic River Restoration Project Newark, New Jersey Page 3 of 5
QAPP Worksheet #7 (UFP-QAPP Manual Section 2.4.3) Personnel Responsibilities and Qualification Table
J:\Water\ProjectFiles\P120\12182_Passaic\QAPP\Rev 1_July 2008\2008_Low Res Core QAPP_2008 July 18_Rev1_worksheet1-19.doc
Name Title Organizational
Affiliation Responsibilities Education and Experience
Qualifications1
Debra Simmons Project QA Manager ENSR Responsible for reviewing and approving QA procedures, ensuring that planned QA assessments (e.g., technical surveillance audits, data validation) are conducted according to the QAPP/FSP Addendum and the ENSR Quality Management Plan (QMP), and reporting on the adequacy of the QA Program to the ENSR RI/FS PM.
BS, Biology. 28 years experience
Kathleen Harvey Regional EHS Manager
ENSR Responsible for ensuring that the objectives of ENSR’s Health and Safety Program are met and for monitoring task activities for conformance to the HASP.
MPH, Environmental Health. 24 years experience.
Donald Boyé RI FTM ENSR Responsible for implementing field sampling activities in accordance with the approved plans (FSP, QAPP, HASP), pertinent SOPs, and this Addendum. Primary responsibilities will include directing activities on site, monitoring subcontractor performance in the field, reviewing field records, and communicating daily with the ENSR RI Task Manager regarding status, quality issues, or delays.
MS, Environmental Engineering. 29 years experience.
Alek Modjeski On Site Field Coordinator/ SSO
ENSR Responsible for implementing field effort in accordance with approved FSP, QAPP, HASP, and SOPs. Primary responsibilities will include coordinating activities on site. Will also monitor subcontractor/field team performance in the field and communicate daily with the ENSR RI FTMs regarding status, quality issues, sub-contractors, and health and safety, etc. Will ensure that the objectives of the project's Health and Safety Program are met.
BS, Marine Biology. 14 years experience.

Section: Worksheet #7 Revision: 1
Date: July 2008
Quality Assurance Project Plan Phase I RI Low Resolution Coring/Sediment Sampling Lower Passaic River Restoration Project Newark, New Jersey Page 4 of 5
QAPP Worksheet #7 (UFP-QAPP Manual Section 2.4.3) Personnel Responsibilities and Qualification Table
J:\Water\ProjectFiles\P120\12182_Passaic\QAPP\Rev 1_July 2008\2008_Low Res Core QAPP_2008 July 18_Rev1_worksheet1-19.doc
Name Title Organizational
Affiliation Responsibilities Education and Experience
Qualifications1
Mary Kozik Project Chemist ENSR Responsible for laboratory procurement and monitoring of progress and will be the primary point of contact with the laboratory(ies). The Project Chemist will also be responsible for communicating any issues that could affect achievement of the DQOs to ENSR project management and the ENSR Project QA Manager.
MS, Chemistry. 32 years experience.
Marie Wojtas Data Validation Coordinator
ENSR Reporting to the Project QA Manager, the Data Validation Coordinator will be responsible for managing the validation task, including ensuring that validation is conducted and documented according to the requirements of this QAPP, and interacting with the laboratories to resolve any issues.
MS, Analytical Chemistry. 24 years experience.
James Herberich Data Management Task Manager
ENSR Data management for project. Including overall responsibility for database quality and structure, including graphical representation of data for completion of RI, Conceptual Site Model (CSM) and FS.
BA, Engineering Sciences. 22 years experience.

Section: Worksheet #7 Revision: 1
Date: July 2008
Quality Assurance Project Plan Phase I RI Low Resolution Coring/Sediment Sampling Lower Passaic River Restoration Project Newark, New Jersey Page 5 of 5
QAPP Worksheet #7 (UFP-QAPP Manual Section 2.4.3) Personnel Responsibilities and Qualification Table
J:\Water\ProjectFiles\P120\12182_Passaic\QAPP\Rev 1_July 2008\2008_Low Res Core QAPP_2008 July 18_Rev1_worksheet1-19.doc
Name Title Organizational
Affiliation Responsibilities Education and Experience
Qualifications1
Polly Newbold CPG QA Coordinator ddms, inc. Oversight of project QA/QC. Periodically review and audit operations to ensure that QAPP/FSP Addendum QA/QC procedures are being followed.
BS, Textile Science, 26 years experience.
John Reynolds Laboratory PM TestAmerica Acts as the primary point of contact at TestAmerica facilities for the ENSR Project Chemist to communicate and resolve sampling, receipt, analysis, and storage issues.
BS, Biology, 16 years experience.
Ed Wallace Laboratory PM Columbia Analytical Services (CAS)
Acts as the primary point of contact at CAS facilities for the ENSR Project Chemist to communicate and resolve sampling, receipt, analysis, and storage issues.
MS, Chemistry. 34 years experience.
Jennifer Holmes Laboratory PM Brooks Rand, LLC Acts as the primary point of contact at Brooks Rand, LLC for the ENSR Project Chemist to communicate and resolve sampling, receipt, analysis, and storage issues.
PhD, Chemistry. 12 years experience.
Edith Kent Laboratory PM General Engineering Laboratories, LLC (GEL)
Acts as the primary point of contact at GEL Laboratories, LLC for the ENSR Project Chemist to communicate and resolve sampling, receipt, analysis, and storage issues.
MPA, Public Administration. 22 years experience.
Paul Warden Laboratory PM Analytical Services, Inc. Acts as the primary point of contact at Analytical Services, Inc. for the ENSR Project Chemist to communicate and resolve sampling, receipt, analysis, and storage issues.
BS, Wildlife Biology. 18 years experience
1 Resumes of all individuals are available upon request.

Section: Worksheet #8 Revision: 1
Date: July 2008
Quality Assurance Project Plan Phase I RI Low Resolution Coring/Sediment Sampling Lower Passaic River Restoration Project Newark, New Jersey Page 1 of 3
J:\Water\ProjectFiles\P120\12182_Passaic\QAPP\Rev 1_July 2008\2008_Low Res Core QAPP_2008 July 18_Rev1_worksheet1-19.doc
QAPP Worksheet #8 (UFP-QAPP Manual Section 2.4.4) Special Personnel Training Requirements Table
Project Function
Specialized Training by Title or
Description of Course Training Provider Training
Date Personnel/Groups Receiving Training
Personnel Titles/ Organizational
Affiliation Location of Training Records/Certificates
40 hour HAZWOPER a UMass Lowell Dec 97
HAZWOPER 8-hr Refresher
ENSR Jul 07
Occupational Safety and Health Administration (OSHA) 8-hr Training for Supervisorsb
ENSR Mar 00
Hazmat awareness ENSR Oct 06
Hazmat shipping ENSR Apr 06
RI FTM
First Aid ARC Dec 06
Don Boyé RI FTM /ENSR ENSR
40 hour HAZWOPER Empire Soils Investigations, Michael Grasso, CIH
Feb 90
HAZWOPER 8-hr Refresher
ENSR Sep 07
HAZWOPER Training for Supervisors
ENSR Apr 96
HAZWOPER 1st responder
ENSR Dec 06
RI FTM
First Aid/CPR ARC May 06/Jun 07
Bruce Coulombe RI FTM /ENSR ENSR

Section: Worksheet #8 Revision: 1
Date: July 2008
Quality Assurance Project Plan Phase I RI Low Resolution Coring/Sediment Sampling Lower Passaic River Restoration Project Newark, New Jersey Page 2 of 3
QAPP Worksheet #8 (UFP-QAPP Manual Section 2.4.4) Special Personnel Training Requirements Table
J:\Water\ProjectFiles\P120\12182_Passaic\QAPP\Rev 1_July 2008\2008_Low Res Core QAPP_2008 July 18_Rev1_worksheet1-19.doc
Project Function
Specialized Training by Title or
Description of Course Training Provider Training
Date Personnel/Groups Receiving Training
Personnel Titles/ Organizational
Affiliation Location of Training Records/Certificates
40 hour HAZWOPER Compliance Solutions Dec 2007
OUPV Captain’s License
United States Coast Guard (USCG)
Feb 2005
Smith System Advanced On-Road Defensive Driving Certificate
Smith System Jul 2008
On-Site Field Coordinator/ SSO
First Aid/CPR American Red Cross of Central NJ
Jan 2007
Aleksandr Modjeski On-Site Field Coordinator/ENSR
ENSR
40 hour HAZWOPER University of Massachusetts (Umass) Lowell
Various
HAZWOPER 8-hr Refresher
ENSR w/in 12 mo
Field Personnel
Hazmat awareness ENSR Various
Various Various/ENSR ENSR

Section: Worksheet #8 Revision: 1
Date: July 2008
Quality Assurance Project Plan Phase I RI Low Resolution Coring/Sediment Sampling Lower Passaic River Restoration Project Newark, New Jersey Page 3 of 3
QAPP Worksheet #8 (UFP-QAPP Manual Section 2.4.4) Special Personnel Training Requirements Table
J:\Water\ProjectFiles\P120\12182_Passaic\QAPP\Rev 1_July 2008\2008_Low Res Core QAPP_2008 July 18_Rev1_worksheet1-19.doc
Project Function
Specialized Training by Title or
Description of Course Training Provider Training
Date Personnel/Groups Receiving Training
Personnel Titles/ Organizational
Affiliation Location of Training Records/Certificates
40 hour HAZWOPER Steve Gadomski November 1992
CT Safe Boaters Certificate
State of Connecticut May 1996
Sampling Vessel Captain
First Aid/CPR To Be Determined Jul 08
David Kowaleski Ocean Surveys Inc. Ocean Surveys, Inc.
a Hazardous Waste Operations and Emergency Response b Occupational Safety and Health Administration
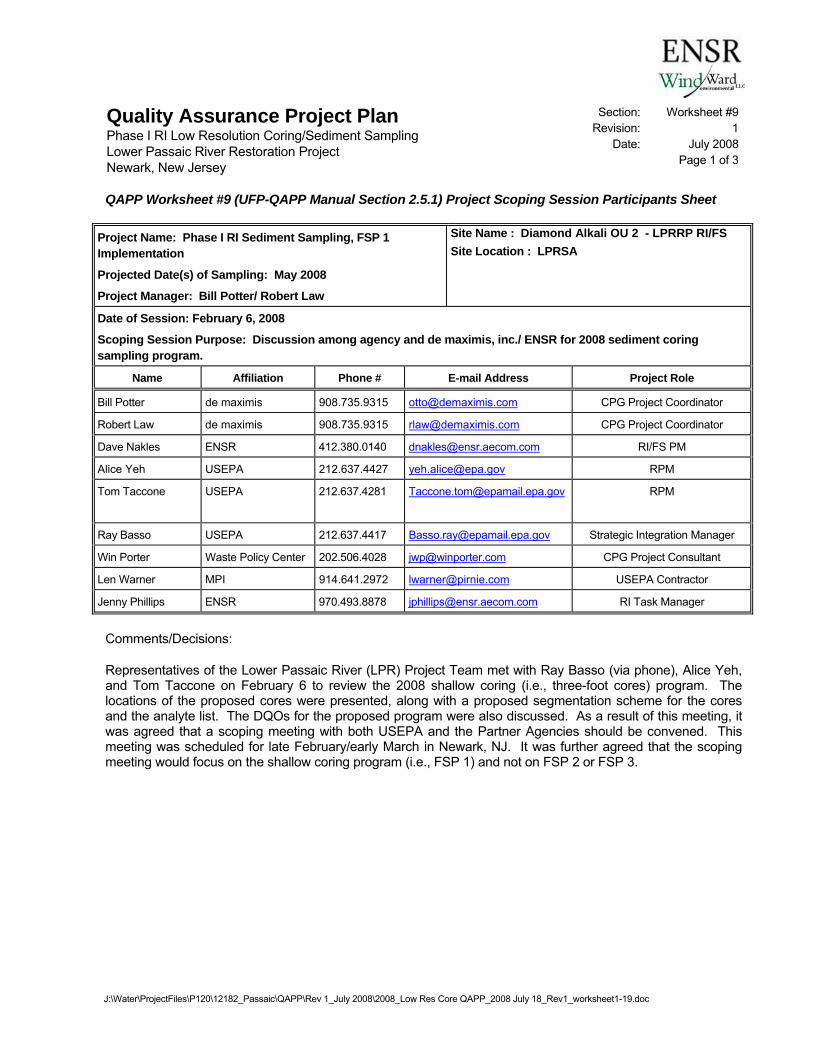
Section: Worksheet #9 Revision: 1
Date: July 2008
Quality Assurance Project Plan Phase I RI Low Resolution Coring/Sediment Sampling Lower Passaic River Restoration Project Newark, New Jersey Page 1 of 3
J:\Water\ProjectFiles\P120\12182_Passaic\QAPP\Rev 1_July 2008\2008_Low Res Core QAPP_2008 July 18_Rev1_worksheet1-19.doc
QAPP Worksheet #9 (UFP-QAPP Manual Section 2.5.1) Project Scoping Session Participants Sheet
Project Name: Phase I RI Sediment Sampling, FSP 1 Implementation
Projected Date(s) of Sampling: May 2008
Project Manager: Bill Potter/ Robert Law
Site Name : Diamond Alkali OU 2 - LPRRP RI/FS Site Location : LPRSA
Date of Session: February 6, 2008
Scoping Session Purpose: Discussion among agency and de maximis, inc./ ENSR for 2008 sediment coring sampling program.
Name Affiliation Phone # E-mail Address Project Role
Bill Potter de maximis 908.735.9315 [email protected] CPG Project Coordinator
Robert Law de maximis 908.735.9315 [email protected] CPG Project Coordinator
Dave Nakles ENSR 412.380.0140 [email protected] RI/FS PM
Alice Yeh USEPA 212.637.4427 [email protected] RPM
Tom Taccone USEPA 212.637.4281 [email protected]
RPM
Ray Basso USEPA 212.637.4417 [email protected] Strategic Integration Manager
Win Porter Waste Policy Center 202.506.4028 [email protected] CPG Project Consultant
Len Warner MPI 914.641.2972 [email protected] USEPA Contractor
Jenny Phillips ENSR 970.493.8878 [email protected] RI Task Manager
Comments/Decisions:
Representatives of the Lower Passaic River (LPR) Project Team met with Ray Basso (via phone), Alice Yeh, and Tom Taccone on February 6 to review the 2008 shallow coring (i.e., three-foot cores) program. The locations of the proposed cores were presented, along with a proposed segmentation scheme for the cores and the analyte list. The DQOs for the proposed program were also discussed. As a result of this meeting, it was agreed that a scoping meeting with both USEPA and the Partner Agencies should be convened. This meeting was scheduled for late February/early March in Newark, NJ. It was further agreed that the scoping meeting would focus on the shallow coring program (i.e., FSP 1) and not on FSP 2 or FSP 3.

Section: Worksheet #9 Revision: 1
Date: July 2008
Quality Assurance Project Plan Phase I RI Low Resolution Coring/Sediment Sampling Lower Passaic River Restoration Project Newark, New Jersey Page 2 of 3
QAPP Worksheet #9 (UFP-QAPP Manual Section 2.5.1) Project Scoping Session Participants Sheet
J:\Water\ProjectFiles\P120\12182_Passaic\QAPP\Rev 1_July 2008\2008_Low Res Core QAPP_2008 July 18_Rev1_worksheet1-19.doc
Project Name: Phase I RI Sediment Sampling, FSP 1 Implementation
Projected Date(s) of Sampling: May 2008
Project Manager: Bill Potter/ Robert Law
Site Name : Diamond Alkali OU 2 - LPRRP RI/FS
Site Location : LPRSA
Date of Session: February 27, 2008
Scoping Session Purpose: Discussion among agency and de maximis, inc./ ENSR for 2008 sediment coring sampling program.
Name Affiliation Phone # E-mail Address Project Role
Bill Potter de maximis 908.735.9315 [email protected] CPG Project Coordinator
Robert Law de maximis 908.735.9315 [email protected] CPG Project Coordinator
Dave Nakles ENSR 412.380.0140 [email protected] RI/FS PM
Alice Yeh USEPA 212.637.4427 [email protected] RPM
Tom Taccone USEPA 212.637.4281 [email protected] RPM
Reyhan Mehran NOAA 212.637.3257 [email protected] Partner agency lead
Janine MacGregor NJDEP 609.633.0784 [email protected] Partner agency lead
Michael Barbara ENSR/mab 973.543.5608 [email protected] Technical Consultant
Cliff Firstenberg Tierra Solutions, Inc. 757.258.7720 [email protected] CPG member
Marcia Greenblatt ENSR 978.589.3024 [email protected] Modeling Task Manager
Betsy Ruffle ENSR 978.589.3071 [email protected]
Human Health Risk Assessment (HHRA) Task
Manager
Lisa Saban Windward 206.577.1288 [email protected]
Windward Ecological Risk Assessment Task Manager
Douglas Reid-Green
BASF 908.507.8820 [email protected]
CPG member
Hank Martin BASF 973.263.5820 [email protected] Consultant for CPG member
Kris Carbonneau ENSR 978.589.3377 [email protected] Deputy RI/FS PM
Bill Sy USEPA 732.632.4766 [email protected] QA Officer
Linda Mauel USEPA 732.321.6766 [email protected] USEPA participant
Ed Garvey MPI 201.398.4326 [email protected] USEPA contractor
Marion Olsen USEPA 212.637.4313 [email protected] USEPA participant
Charles Nace USEPA 212.637.4164 [email protected] USEPA participant
Kate Mulvay USACE-PLE 917.790.8216 [email protected] Partner agency participant

Section: Worksheet #9 Revision: 1
Date: July 2008
Quality Assurance Project Plan Phase I RI Low Resolution Coring/Sediment Sampling Lower Passaic River Restoration Project Newark, New Jersey Page 3 of 3
QAPP Worksheet #9 (UFP-QAPP Manual Section 2.5.1) Project Scoping Session Participants Sheet
J:\Water\ProjectFiles\P120\12182_Passaic\QAPP\Rev 1_July 2008\2008_Low Res Core QAPP_2008 July 18_Rev1_worksheet1-19.doc
Name Affiliation Phone # E-mail Address Project Role
Tricia Aspinwall USACE-PLE 917.790.8734 [email protected] Partner agency participant
Peter Weppler USACE-PLE 917.790.8634 [email protected] Partner agency participant
Tom Gulbransen Batelle 631.941.3211 [email protected] USEPA contractor
Robin Miller Hydro Qual 201.529.5151 [email protected] USEPA contractor
Betsy Barrows Batelle 631.941.3213 [email protected] USEPA contractor
Len Warner MPI 914.641.2972 [email protected] USEPA contractor
Jenny Phillips ENSR 970.493.8878 [email protected] RI Task Manager
Comments/Decisions: The above parties discussed the development of the proposed field sampling plans during this meeting. In addition, review of field sampling tasks for the RI was conducted and MPI provided an update on the status of ongoing field efforts and how they fit into the CSM. MPI indicated that the CSM is undergoing revision.
Action Items: USEPA/Partner Agencies
• MPI to provide background notes on purposes of fine segmentation of sediment column and suggested analyses, originally developed for FSP1.
• MPI (with USEPA) to provide broader context of the scope of Draft FSP1 program, rather than the specific 10-core program currently summarized in FSP1.
• USEPA/CPG to work collaboratively using work groups to resolve DQO Step 6 in FSP1 (establishing data sufficiency for nature and extent).
• USEPA to supply field notes from 2008 MPI probing and coring programs. • MPI to provide data from 2008 sampling program (once validation is complete). CPG
• USEPA/CPG to work collaboratively through work groups to decide on DQO Step 6 in FSP1 for establishing data sufficiency for nature and extent
• Send suggestions for approach on deep coring locations (within the next week), including: o CPG to consider moving short core sediment sample locations on tributaries downstream from
head of tide. o CPG will re-evaluate analyzing all 3 segments from short cores concurrently or archiving some
segments. o CPG will re-evaluate approach to use multiple lines of evidence for evaluating short core data and
making determination on need to go deeper.

Section: Worksheet #10 Revision: 1
Date: July 2008
Quality Assurance Project Plan Phase I RI Low Resolution Coring/Sediment Sampling Lower Passaic River Restoration Project Newark, New Jersey Page 1 of 1
J:\Water\ProjectFiles\P120\12182_Passaic\QAPP\Rev 1_July 2008\2008_Low Res Core QAPP_2008 July 18_Rev1_worksheet1-19.doc
QAPP Worksheet #10 (UFP-QAPP Manual Section 2.5.2) Problem Definition
The problem to be addressed by the project:
The proposed sampling consists of the collection of low resolution sediment cores to support the characterization of the nature and extent of contamination in the sediment and to understand the physical characteristics of the sediment in the main stem of the LPR (extending from RM 0 to just above the Dundee Dam) and in the tributaries to the LPR (Saddle River, Second River, Third River and the unnamed creek). Low resolution coring is a required element of FSP1 for completion of an RI/FS per Settlement Agreement and SOW requirements. The majority of cores within the LPR will be distributed along transects consisting of up to three cores each, that will span the width of the river with the goal of characterizing nature and extent of contamination, potential sources and the physical and contaminant characteristics of the sediment located in both erosional and depositional areas, as determined from previous radiodating, side scan sonar, and sediment probing studies.
The field and laboratory data collected during this program will be utilized in completion of the RI/ FS to:
• Provide a comprehensive characterization of the nature and extent of sediment contamination along the entire LPRSA (an extension of existing work in some areas and a first look at some areas);
• Aid in the characterization of potential internal and external sources of contaminants;
• Provide a comprehensive physical characterization of sediment along the entire LPRSA; and
• Aid in refinement of the characterization of erosional and depositional zones.
The introduction to the QAPP provides background site information. The DQOs provided in Attachment 1 include more detail for each sampling objective.

Section: Worksheet #11 Revision: 1
Date: July 2008
Quality Assurance Project Plan Phase I RI Low Resolution Coring/Sediment Sampling Lower Passaic River Restoration Project Newark, New Jersey Page 1 of 1
J:\Water\ProjectFiles\P120\12182_Passaic\QAPP\Rev 1_July 2008\2008_Low Res Core QAPP_2008 July 18_Rev1_worksheet1-19.doc
QAPP Worksheet #11 (UFP-QAPP Manual Section 2.6.1) Project Quality Objectives/Systematic Planning Process Statements
DQOs are fully described in Attachment 1 as 1.1 and 1.2.

Section: Worksheet #12 Revision: 1
Date: July 2008
Quality Assurance Project Plan Phase I RI Low Resolution Coring/Sediment Sampling Lower Passaic River Restoration Project Newark, New Jersey Page 1 of 29
J:\Water\ProjectFiles\P120\12182_Passaic\QAPP\Rev 1_July 2008\2008_Low Res Core QAPP_2008 July 18_Rev1_worksheet1-19.doc
QAPP Worksheet #12 (UFP-QAPP Manual Section 2.6.2) Measurement Performance Criteria Table
Matrix Sediment Analytical Groupa VOCs Concentration Level Low
Sampling Procedureb Analytical
Method/SOPc Data Quality
Indicators (DQIs) Measurement
Performance Criteriad
QC Sample and/or Activity Used to Assess
Measurement Performance
QC Sample Assesses Error for Sampling (S), Analytical (A) or both
(S&A)
LPR-S-01, LPR-S-02, LPR-S-03, LPR-S-04 L-1 Accuracy/Bias-
Contamination
No target compound >Quantitation Limit (QL), no common lab contaminants >5x QL
Method Blank (MB)/Instrument Blanks A
L-1 Accuracy/Bias-Contamination
No target compound >QL, no common lab contaminants >5x QL
Trip Blanks/Equipment Rinsate Blanks S & A
L-1 Accuracy/Bias Compound-specific, see Appendix C-2
Laboratory Control Sample (LCS) A
L-1 Accuracy/Bias Compound-specific, see Appendiix C-2 Matrix Spike (MS) S & A
L-1 Accuracy/Bias Compound-specific, see Appendix C-2 Surrogates A
L-1 Accuracy/Bias Supplier Certified Limits Performance Evaluation (PE) Sample A
L-1 Precision Compound-specific, see Appendiix C-2
Matrix Spike Duplicate (MSD) S & A
L-1 Precision Relative Percent Difference (RPD) ≤ 50% if both samples are >5x QL
Field Duplicate S & A
L-1 Completeness ≥ 90% Data Completeness Check S & A
a Refer to QAPP Worksheet #15 for a complete list of analytes for each analytical group b Refer to QAPP Worksheet #21 c Refer to QAPP Worksheet #23 d Analyte specific limits may be found in Appendix C-2

Section: Worksheet #12 Revision: 1
Date: July 2008
Quality Assurance Project Plan Phase I RI Low Resolution Coring/Sediment Sampling Lower Passaic River Restoration Project Newark, New Jersey Page 2 of 29
QAPP Worksheet #12 (UFP-QAPP Manual Section 2.6.2) Measurement Performance Criteria Table
J:\Water\ProjectFiles\P120\12182_Passaic\QAPP\Rev 1_July 2008\2008_Low Res Core QAPP_2008 July 18_Rev1_worksheet1-19.doc
Matrix Sediment Analytical Groupa SVOCs Concentration Level Low
Sampling Procedureb Analytical
Method/SOPc DQIs Measurement
Performance Criteriad
QC Sample and/or Activity Used to Assess
Measurement Performance
QC Sample Assesses Error for Sampling (S), Analytical (A) or both
(S&A)
LPR-S-01, LPR-S-02, LPR-S-03, LPR-S-04 L-2, L-3 Accuracy/Bias-
Contamination
No target compound >QL, no common lab contaminants >5x QL
Method Blank/Instrument Blank A
L-2, L-3 Accuracy/Bias- Contamination
No target compound >QL, no common lab contaminants >5x QL
Equipment Rinsate Blanks S & A
L-2, L-3 Accuracy/Bias Compound-specific, see Appendix C-2 LCS A
L-2, L-3 Accuracy/Bias Compound-specific, see Appendix C-2 MS S & A
L-2, L-3 Accuracy/Bias Compound-specific, see Appendix C-2 Surrogates A
L-2, L-3 Accuracy/Bias Supplier Certified Limits PE Sample A
L-2, L-3 Precision Compound-specific, see Appendix C-2 MSD S & A
L-2, L-3 Precision RPD ≤ 50% if both samples are > 5x QL Field Duplicate S & A
L-2, L-3 Completeness ≥ 90% Data Completeness Check S & A
a Refer to QAPP Worksheet #15 for a complete list of analytes for each analytical group b Refer to QAPP Worksheet #21 c Refer to QAPP Worksheet #23 d Analyte specific limits may be found in Appendix C-2

Section: Worksheet #12 Revision: 1
Date: July 2008
Quality Assurance Project Plan Phase I RI Low Resolution Coring/Sediment Sampling Lower Passaic River Restoration Project Newark, New Jersey Page 3 of 29
QAPP Worksheet #12 (UFP-QAPP Manual Section 2.6.2) Measurement Performance Criteria Table
J:\Water\ProjectFiles\P120\12182_Passaic\QAPP\Rev 1_July 2008\2008_Low Res Core QAPP_2008 July 18_Rev1_worksheet1-19.doc
Matrix Sediment Analytical Groupa PAHs and Alkyl PAHs (HRGC/LRMS – SIM)e Concentration Level Low
Sampling Procedureb Analytical
Method/SOPc DQIs Measurement
Performance Criteriad
QC Sample and/or Activity Used to Assess
Measurement Performance
QC Sample Assesses Error for Sampling (S), Analytical (A) or both
(S&A)
LPR-S-01, LPR-S-02, LPR-S-03, LPR-S-04 L-6 Accuracy/Bias-
Contamination
No target compound >Environmental Measurements Laboratory (EML)
Method Blank/Instrument Blank A
L-6 Accuracy/Bias-Contamination
No target compound >EML
Equipment Rinsate Blanks S & A
L-6 Accuracy/Bias 60 -140% (see Appendix C-2) LCS A
L-6 Accuracy/Bias 60 -140% (see Appendix C-2) MS S & A
L-6 Accuracy/Bias Compound-specific, see Appendix C-2
Pre-extraction Internal Standards A
L-6 Accuracy/Bias Supplier Certified Limits PE Sample A
L-6 Precision RPD ≤ 30% (see Appendix C-2) MSD S & A
L-6 Precision RPD ≤ 50% if both samples are > 5x QL Field Duplicate S & A
L-6 Completeness ≥ 90% Data Completeness Check S & A
a Refer to QAPP Worksheet #15 for a complete list of analytes for each analytical group b Refer to QAPP Worksheet #21 c Refer to QAPP Worksheet #23 d Analyte specific limits may be found in Appendix C-2 e HHRGC/LRMS: High Resolution Gas Chromatography/Low Resolution Mass Spectrometry – Selective Ion Monitoring

Section: Worksheet #12 Revision: 1
Date: July 2008
Quality Assurance Project Plan Phase I RI Low Resolution Coring/Sediment Sampling Lower Passaic River Restoration Project Newark, New Jersey Page 4 of 29
QAPP Worksheet #12 (UFP-QAPP Manual Section 2.6.2) Measurement Performance Criteria Table
J:\Water\ProjectFiles\P120\12182_Passaic\QAPP\Rev 1_July 2008\2008_Low Res Core QAPP_2008 July 18_Rev1_worksheet1-19.doc
Matrix Sediment Analytical Groupa Organochlorine Pesticides (GC/ECDe) Concentration Level Low
Sampling Procedureb Analytical
Method/SOPc DQIs Measurement
Performance Criteriad
QC Sample and/or Activity Used to Assess
Measurement Performance
QC Sample Assesses Error for Sampling (S), Analytical (A) or both
(S&A) LPR-S-01, LPR-S-02, LPR-S-03, LPR-S-04 L-2, L-4, L-56 Accuracy/Bias -
Contamination No target compound >QL Method Blank/Instrument Blank A
L-2, L-4, L-56 Accuracy/Bias-Contamination No target compound >QL Equipment Rinsate
Blanks S & A
L-2, L-4, L-56 Accuracy/Bias Compound-specific, see Appendix C-2 LCS A
L-2, L-4, L-56 Accuracy/Bias Compound-specific, see Appendix C-2 MS S & A
L-2, L-4. L-56 Accuracy/Bias Supplier Certified Limits PE Sample A
L-2, L-4, L-56 Accuracy/Bias Compound-specific, see Appendix C-2 Surrogates A
L-2, L-4, L-56 Precision 30% (see Appendix C-2) MSD S & A
L-2, L-4, L-56 Precision RPD ≤ 50% if both samples are > 5x QL Field Duplicate S & A
L-2, L-4, L-56 Completeness ≥ 90% Data Completeness Check S & A
a Refer to QAPP Worksheet #15 for a complete list of analytes for each analytical group b Refer to QAPP Worksheet #21 c Refer to QAPP Worksheet #23 d Analyte specific limits may be found in Appendix C-2 e GC/ECD: Gas Chromatography/Electron Capture Detector

Section: Worksheet #12 Revision: 1
Date: July 2008
Quality Assurance Project Plan Phase I RI Low Resolution Coring/Sediment Sampling Lower Passaic River Restoration Project Newark, New Jersey Page 5 of 29
QAPP Worksheet #12 (UFP-QAPP Manual Section 2.6.2) Measurement Performance Criteria Table
J:\Water\ProjectFiles\P120\12182_Passaic\QAPP\Rev 1_July 2008\2008_Low Res Core QAPP_2008 July 18_Rev1_worksheet1-19.doc
Matrix Sediment Analytical Groupa Organochlorine Pesticides (HRGC/HRMS) Concentration Level Low
Sampling Procedureb Analytical
Method/SOPcb DQIs Measurement
Performance Criteriad
QC Sample and/or Activity Used to Assess
Measurement Performance
QC Sample Assesses Error for Sampling (S), Analytical (A) or both
(S&A) LPR-S-01, LPR-S-02, LPR-S-03, LPR-S-04 L-15 Accuracy/Bias -
Contamination No target compound >QL Method Blank/Instrument Blank A
L-15 Accuracy/Bias-Contamination No target compound >QL Equipment Rinsate
Blanks S & A
L-15 Accuracy/Bias Compound-specific, see Appendix C-2
On-going Precision and Recovery (OPR) sample (or LCS)
A
L-15 Accuracy/Bias Compound-specific, see Appendix C-2 MS S & A
L-15 Accuracy/Bias Compound-specific, see Appendix C-2 Surrogates A
L-15 Accuracy/Bias Supplier Certified Limits PE Sample A L-15 Precision RPD ≤ 30% MSD S & A
L-15 Precision RPD ≤ 50% if both samples are >5x QL Field Duplicate S & A
L-15 Completeness ≥ 90% Data Completeness Check S & A
a Refer to QAPP Worksheet #15 for a complete list of analytes for each analytical group b Refer to QAPP Worksheet #21 c Refer to QAPP Worksheet #23 d Analyte specific limits may be found in Appendix C-2

Section: Worksheet #12 Revision: 1
Date: July 2008
Quality Assurance Project Plan Phase I RI Low Resolution Coring/Sediment Sampling Lower Passaic River Restoration Project Newark, New Jersey Page 6 of 29
QAPP Worksheet #12 (UFP-QAPP Manual Section 2.6.2) Measurement Performance Criteria Table
J:\Water\ProjectFiles\P120\12182_Passaic\QAPP\Rev 1_July 2008\2008_Low Res Core QAPP_2008 July 18_Rev1_worksheet1-19.doc
Matrix Sediment Analytical Groupa PCBs Aroclors (GC/ECD) Concentration Level Low
Sampling Procedureb Analytical
Method/SOPc DQIs Measurement
Performance Criteriad
QC Sample and/or Activity Used to Assess
Measurement Performance
QC Sample Assesses Error for Sampling (S), Analytical (A) or both
(S&A) LPR-S-01, LPR-S-02, LPR-S-03, LPR-S-04 L-12 Accuracy/Bias-
Contamination No target compound >QL Method Blank/Instrument Blank A
L-12 Accuracy/Bias-Contamination No target compound >QL Equipment Rinsate
Blanks S & A
L-12 Accuracy/BIas Compound-specific, see Appendix C-2 LCS A
L-12 Accuracy/Bias Compound-specific, see Appendix C-2 MS S & A
L-12 Accuracy/Bias Supplier Certified Limits PE Sample A
L-12 Precision Compound-specific, see Appendix C-2 MSD S & A
L-12 Precision RPD ≤ 50% if both samples are > 5x QL Field Duplicate S & A
L-12 Completeness ≥ 90% Data Completeness Check S & A
a Refer to QAPP Worksheet #15 for a complete list of analytes for each analytical group b Refer to QAPP Worksheet #21 c Refer to QAPP Worksheet #23 d Analyte specific limits may be found in Appendix C-2

Section: Worksheet #12 Revision: 1
Date: July 2008
Quality Assurance Project Plan Phase I RI Low Resolution Coring/Sediment Sampling Lower Passaic River Restoration Project Newark, New Jersey Page 7 of 29
QAPP Worksheet #12 (UFP-QAPP Manual Section 2.6.2) Measurement Performance Criteria Table
J:\Water\ProjectFiles\P120\12182_Passaic\QAPP\Rev 1_July 2008\2008_Low Res Core QAPP_2008 July 18_Rev1_worksheet1-19.doc
Matrix Sediment Analytical Groupa PCBs – Congeners (HRGC/HRMS) Concentration Level Low
Sampling Procedureb Analytical
Method/SOPc DQIs Measurement
Performance Criteriad
QC Sample and/or Activity Used to Assess
Measurement Performance
QC Sample Assesses Error for Sampling (S), Analytical (A) or both
(S&A) LPR-S-01, LPR-S-02, LPR-S-03, LPR-S-04 L-7 Accuracy/Bias-
Contamination No target compound >EML
Method Blank/Instrument Blank A
L-7 Accuracy/Bias-Contamination
No target compound >EML
Equipment Rinsate Blanks S & A
L-7 Accuracy/Bias
Toxic Congeners: 50 -150%; Non-toxic Congeners: 40 -160% (see Appendix C-2)
LCS A
L-7 Accuracy/BIas
Toxic Congeners: 50 -150%; Non-toxic Congeners: 40 -160% (see Appendix C-2)
MS S & A
L-7 Accuracy/Bias 30 -140% (see Appendix C-2)
Pre-extraction Internal Standards A
L-7 Accuracy/Bias Supplier Certified Limits PE Sample A
L-7 Precision RPD ≤ 50% (see Appendix C-2) MSD S & A
L-7 Precision RPD ≤ 50% if both samples are > 5x EML Field Duplicate S & A
L-7 Completeness ≥ 90% Data Completeness Check S & A
a Refer to QAPP Worksheet #15 for a complete list of analytes for each analytical group b Refer to QAPP Worksheet #21 c Refer to QAPP Worksheet #23 d Analyte specific limits may be found in Appendix C-2

Section: Worksheet #12 Revision: 1
Date: July 2008
Quality Assurance Project Plan Phase I RI Low Resolution Coring/Sediment Sampling Lower Passaic River Restoration Project Newark, New Jersey Page 8 of 29
QAPP Worksheet #12 (UFP-QAPP Manual Section 2.6.2) Measurement Performance Criteria Table
J:\Water\ProjectFiles\P120\12182_Passaic\QAPP\Rev 1_July 2008\2008_Low Res Core QAPP_2008 July 18_Rev1_worksheet1-19.doc
Matrix Sediment Analytical Groupa Herbicides (GC/ECD) Concentration Level Low
Sampling Procedureb Analytical
Method/SOPc DQIs Measurement
Performance Criteriad
QC Sample and/or Activity Used to Assess
Measurement Performance
QC Sample Assesses Error for Sampling (S), Analytical (A) or both
(S&A) LPR-S-01, LPR-S-02, LPR-S-03, LPR-S-04 L-12 Accuracy/Bias-
Contamination No target compound >QL Method Blank/Instrument Blank A
L-12 Accuracy/Bias-Contamination No target compound >QL Equipment Rinsate
Blanks S & A
L-12 Accuracy/Bias Compound-specific, see Appendix C-2 LCS A
L-12 Accuracy/Bias Compound-specific, see Appendix C-2 MS S & A
L-12 Accuracy/Bias Supplier Certified Limits PE Sample A
L-12 Precision Compound-specific, see Appendix C-2 MSD S & A
L-12 Precision RPD ≤ 50% if both samples are >5x QL Field Duplicate S & A
L-12 Completeness ≥ 90% Data Completeness Check S & A
a Refer to QAPP Worksheet #15 for a complete list of analytes for each analytical group b Refer to QAPP Worksheet #21 c Refer to QAPP Worksheet #23 d Analyte specific limits may be found in Appendix C-2

Section: Worksheet #12 Revision: 1
Date: July 2008
Quality Assurance Project Plan Phase I RI Low Resolution Coring/Sediment Sampling Lower Passaic River Restoration Project Newark, New Jersey Page 9 of 29
QAPP Worksheet #12 (UFP-QAPP Manual Section 2.6.2) Measurement Performance Criteria Table
J:\Water\ProjectFiles\P120\12182_Passaic\QAPP\Rev 1_July 2008\2008_Low Res Core QAPP_2008 July 18_Rev1_worksheet1-19.doc
Matrix Sediment Analytical Groupa TPH, Extractables and Purgeables (Gas
Chromatography [GC}/FID)
Concentration Level Low
Sampling Procedureb Analytical
Method/SOPc DQIs Measurement
Performance Criteriad
QC Sample and/or Activity Used to Assess
Measurement Performance
QC Sample Assesses Error for Sampling (S), Analytical (A) or both
(S&A) LPR-S-01, LPR-S-02, LPR-S-03, LPR-S-04 L-13, L-14 Accuracy/Bias-
Contamination No target compound >QL Method Blank/Instrument Blank A
L-13, L-14 Accuracy/Bias-Contamination No target compound >QL
Trip Blanks (for TPH-purgeables)/Equipment Rinsate Blanks
S & A
L-13, L-14 Accuracy/Bias Compound-specific, see Appendix C-2 LCS A
L-13, L-14 Accuracy/Bias Compound-specific, see Appendix C-2 Surrogates A
L-13, L-14 Accuracy/Bias Compound-specific, see Appendix C-2 MS S & A
L-13, L-14 Accuracy/Bias Supplier Certified Limits PE Sample A L-13, L-14 Precision RPD ≤30% MSD S & A
L-13, L-14 Precision RPD ≤ 50% if both samples are >5x QL Field Duplicate S & A
L-13, L-14 Completeness ≥ 90% Data Completeness Check S & A
a Refer to QAPP Worksheet #15 for a complete list of analytes for each analytical group b Refer to QAPP Worksheet #21 c Refer to QAPP Worksheet #23 d Analyte specific limits may be found in Appendix C-2

Section: Worksheet #12 Revision: 1
Date: July 2008
Quality Assurance Project Plan Phase I RI Low Resolution Coring/Sediment Sampling Lower Passaic River Restoration Project Newark, New Jersey Page 10 of 29
QAPP Worksheet #12 (UFP-QAPP Manual Section 2.6.2) Measurement Performance Criteria Table
J:\Water\ProjectFiles\P120\12182_Passaic\QAPP\Rev 1_July 2008\2008_Low Res Core QAPP_2008 July 18_Rev1_worksheet1-19.doc
Matrix Sediment Analytical Groupa PCDDs/PCDFs (Isotope Dilution Mass Spectrometry) Concentration Level Low
Sampling Procedureb Analytical
Method/SOPc DQIs
Measurement Performance
Criteriad
QC Sample and/or Activity Used to Assess
Measurement Performance
QC Sample Assesses Error for Sampling (S), Analytical
(A) or both (S&A) LPR-S-01, LPR-S-02, LPR-S-03, LPR-S-04 L-35 Accuracy/Bias-
Contamination No target compound >QL Method Blank/Instrument Blank A
L-35 Accuracy/Bias-Contamination
No target compound >QL Equipment Rinsate Blanks S & A
L-35 Accuracy/Bias Compound-specific, see Appendix C-2
LCS A
L-35 Accuracy/Bias Compound-specific, see Appendix C-2
MS S & A
L-35 Accuracy/Bias Compound-specific, see Appendix C-2
Surrogates A
L-35 Accuracy/Bias Supplier Certified Limits PE Sample A
L-35 Precision RPD ≤50% (see Appendix C-2) MSD S & A
L-35 Precision RPD ≤ 50% if both samples are > 5x QL
Field Duplicate S & A
L-35 Completeness ≥ 90% Data Completeness Check S & A
a Refer to QAPP Worksheet #15 for a complete list of analytes for each analytical group b Refer to QAPP Worksheet #21 c Refer to QAPP Worksheet #23 d Analyte specific limits may be found in Appendix C-2

Section: Worksheet #12 Revision: 1
Date: July 2008
Quality Assurance Project Plan Phase I RI Low Resolution Coring/Sediment Sampling Lower Passaic River Restoration Project Newark, New Jersey Page 11 of 29
QAPP Worksheet #12 (UFP-QAPP Manual Section 2.6.2) Measurement Performance Criteria Table
J:\Water\ProjectFiles\P120\12182_Passaic\QAPP\Rev 1_July 2008\2008_Low Res Core QAPP_2008 July 18_Rev1_worksheet1-19.doc
Matrix Sediment Analytical Groupa Radiochemistry Beryllium 7(Be-7), Cesium
137 (Cs -137), Lead 210 (Pb-210)g, Potassium 40 (K-40)
Concentration Level Low
Sampling Procedureb Analytical
Method/SOPc DQIs Measurement
Performance Criteriad
QC Sample and/or Activity Used to Assess
Measurement Performance
QC Sample Assesses Error for Sampling (S), Analytical (A) or both
(S&A) LPR-S-01, LPR-S-02, LPR-S-03, LPR-S-04
L-9, L-10, L-45, L-46
Accuracy/Bias-Contamination No target analyte > QL Method Blank A
L-9, L-10, L-45, L-46
Accuracy/Bias 75 - 125% LCS A
L-9, L-10, L-45, L-46
Precision RPD ≤ 20% if both samples are 5x QL Laboratory Duplicate A
L-10, L-46 Accuracy/Bias 75-125% MSe S & A
L-9, L-10, L-45, L-46
Accuracy/Bias ≤30% Combined Standard Uncertaintyf A
L-9, L-10, L-45, L-46
Precision RPD ≤ 50% if both samples are 10x QL Field Duplicate S & A
L-9, L-10, L-45, L-46
Completeness ≥ 90% Data Completeness Check S & A
L-10, L-46 Accuracy/Bias 50 – 120% Tracere A
a Refer to QAPP Worksheet #15 for a complete list of analytes for each analytical group b Refer to QAPP Worksheet #21 c Refer to QAPP Worksheet #23 d Analyte specific limits may be found in Appendix C-2 e Applicable to alpha spectrometry analysis only f Sample results will be reported with associated combined standard uncertainty (2 sigma expanded measurement uncertainty) g Lead 210 will be determined as polonium-210 and radium-226.

Section: Worksheet #12 Revision: 1
Date: July 2008
Quality Assurance Project Plan Phase I RI Low Resolution Coring/Sediment Sampling Lower Passaic River Restoration Project Newark, New Jersey Page 12 of 29
QAPP Worksheet #12 (UFP-QAPP Manual Section 2.6.2) Measurement Performance Criteria Table
J:\Water\ProjectFiles\P120\12182_Passaic\QAPP\Rev 1_July 2008\2008_Low Res Core QAPP_2008 July 18_Rev1_worksheet1-19.doc
Matrix Sediment Analytical Groupa Inductively Coupled Plasma – Atomic
Emission Spectrometry (ICP/AES) Metals
Concentration Level Low
Sampling Procedureb Analytical
Method/SOPc DQIs Measurement
Performance Criteriad
QC Sample and/or Activity Used to Assess
Measurement Performance
QC Sample Assesses Error for Sampling (S), Analytical (A) or both
(S&A) LPR-S-01, LPR-S-02, LPR-S-03, LPR-S-04 L-18 Accuracy/Bias-
Contamination No target compound >QL Method Blank A
L-18 Accuracy/Bias-Contamination No target compound >QL Equipment Rinsate
Blanks S & A
L-18 Accuracy/Bias Compound-specific, see Appendix C-2 LCS A
L-18 Accuracy/Bias Compound-specific, see Appendix C-2 MS S & A
L-18 Accuracy/Bias Supplier Certified Limits PE Sample A L-18 Precision RPD ≤ 30% Laboratory Duplicate A
L-18 Precision RPD ≤ 35% if both samples are >5x QL Field Duplicate S & A
L-18 Completeness ≥ 90% Data Completeness Check S & A
a Refer to QAPP Worksheet #15 for a complete list of analytes for each analytical group b Refer to QAPP Worksheet #21 c Refer to QAPP Worksheet #23 d Analyte specific limits may be found in Appendix C-2

Section: Worksheet #12 Revision: 1
Date: July 2008
Quality Assurance Project Plan Phase I RI Low Resolution Coring/Sediment Sampling Lower Passaic River Restoration Project Newark, New Jersey Page 13 of 29
QAPP Worksheet #12 (UFP-QAPP Manual Section 2.6.2) Measurement Performance Criteria Table
J:\Water\ProjectFiles\P120\12182_Passaic\QAPP\Rev 1_July 2008\2008_Low Res Core QAPP_2008 July 18_Rev1_worksheet1-19.doc
Matrix Sediment Analytical Groupa Inductively Coupled Plasma – Mass
Spectrometry (ICP/MS) Metals
Concentration Level Low
Sampling Procedureb Analytical
Method/SOPc DQIs Measurement
Performance Criteriad
QC Sample and/or Activity Used to Assess
Measurement Performance
QC Sample Assesses Error for Sampling (S), Analytical (A) or both
(S&A) LPR-S-01, LPR-S-02, LPR-S-03, LPR-S-04 L-19 Accuracy/Bias-
Contamination No target compound >QL Method Blank A
L-19 Accuracy/Bias-Contamination No target compound >QL Equipment Rinsate
Blanks S & A
L-19 Accuracy/Bias Compound-specific, see Appendix C-2 LCS A
L-19 Accuracy/Bias Compound-specific, see Appendix C-2 MS S & A
L-19 Accuracy/Bias Supplier Certified Limits PE Sample A L-19 Precision RPD ≤ 20% Laboratory Duplicate A
L-19 Precision RPD ≤ 35% if both samples are > 5x QL Field Duplicate S & A
L-19 Completeness ≥ 90% Data Completeness Check S & A
a Refer to QAPP Worksheet #15 for a complete list of analytes for each analytical group b Refer to QAPP Worksheet #21 c Refer to QAPP Worksheet #23 d Analyte specific limits may be found in Appendix C-2

Section: Worksheet #12 Revision: 1
Date: July 2008
Quality Assurance Project Plan Phase I RI Low Resolution Coring/Sediment Sampling Lower Passaic River Restoration Project Newark, New Jersey Page 14 of 29
QAPP Worksheet #12 (UFP-QAPP Manual Section 2.6.2) Measurement Performance Criteria Table
J:\Water\ProjectFiles\P120\12182_Passaic\QAPP\Rev 1_July 2008\2008_Low Res Core QAPP_2008 July 18_Rev1_worksheet1-19.doc
Matrix Sediment Analytical Groupa Mercury (Low Level) Concentration Level Low
Sampling Procedureb Analytical
Method/SOPc DQIs Measurement
Performance Criteriad
QC Sample and/or Activity Used to Assess
Measurement Performance
QC Sample Assesses Error for Sampling (S), Analytical (A) or both
(S&A)
LPR-S-01, LPR-S-02, LPR-S-03, LPR-S-04 L-36 Accuracy/Bias-
Contamination
Average MB <2x Method Detection Limit (MDL) and standard deviation <0.67x MDL or <0.1x the concentration of project samples
Method Blank A
L-36 Accuracy/Bias-Contamination No target compound >QL Equipment Rinsate
Blanks S & A
L-36 Accuracy/Bias 80 -120% LCS A L-36 Accuracy/Bias 70 -130% MS S & A L-36 Accuracy/Bias Supplier Certified Limits PE Sample A L-36 Precision RPD ≤ 30% MSD S & A L-36 Precision RPD ≤ 30% Laboratory Duplicate A
L-36 Precision RPD ≤ 50% if both samples are >5x QL Field Duplicate S & A
L-36 Completeness ≥ 90% Data Completeness Check S & A
a Refer to QAPP Worksheet #15 for a complete list of analytes for each analytical group b Refer to QAPP Worksheet #21 c Refer to QAPP Worksheet #23 d Analyte specific limits may be found in Appendix C-2

Section: Worksheet #12 Revision: 1
Date: July 2008
Quality Assurance Project Plan Phase I RI Low Resolution Coring/Sediment Sampling Lower Passaic River Restoration Project Newark, New Jersey Page 15 of 29
QAPP Worksheet #12 (UFP-QAPP Manual Section 2.6.2) Measurement Performance Criteria Table
J:\Water\ProjectFiles\P120\12182_Passaic\QAPP\Rev 1_July 2008\2008_Low Res Core QAPP_2008 July 18_Rev1_worksheet1-19.doc
Matrix Sediment Analytical Groupa Methyl Mercury Concentration Level Low
Sampling Procedureb Analytical
Method/SOPc DQIs Measurement
Performance Criteriad
QC Sample and/or Activity Used to Assess
Measurement Performance
QC Sample Assesses Error for Sampling (S), Analytical (A) or both
(S&A)
LPR-S-01, LPR-S-02, LPR-S-03, LPR-S-04 L-37 Accuracy/Bias-
Contamination
Average MB <0.45 nanograms per liter (ng/L) and standard deviation <0.15 ng/L or <0.1x the concentration of project samples
Method Blank A
L-37 Accuracy/Bias-Contamination No target compound >QL Equipment Rinsate
Blanks S & A
L-37 Accuracy/Bias Within 35% of certified value
Certified Reference Material (CRM) A
L-37 Accuracy/Bias 65-135% MS S & A L-37 Accuracy/Bias Supplier Certified Limits PE Sample A L-37 Precision RPD ≤ 35% MSD S & A L-37 Precision RPD ≤ 35% Laboratory Duplicate A
L-37 Precision RPD ≤ 50% if both samples are >5x QL Field Duplicate S & A
L-37 Completeness ≥ 90% Data Completeness Check S & A
a Refer to QAPP Worksheet #15 for a complete list of analytes for each analytical group b Refer to QAPP Worksheet #21 c Refer to QAPP Worksheet #23 d Analyte specific limits may be found in Appendix C-2

Section: Worksheet #12 Revision: 1
Date: July 2008
Quality Assurance Project Plan Phase I RI Low Resolution Coring/Sediment Sampling Lower Passaic River Restoration Project Newark, New Jersey Page 16 of 29
QAPP Worksheet #12 (UFP-QAPP Manual Section 2.6.2) Measurement Performance Criteria Table
J:\Water\ProjectFiles\P120\12182_Passaic\QAPP\Rev 1_July 2008\2008_Low Res Core QAPP_2008 July 18_Rev1_worksheet1-19.doc
Matrix Sediment Analytical Groupa Hexavalent Chromium (Ion Chromatography) Concentration Level Low
Sampling Procedureb Analytical
Method/SOPc DQIs Measurement
Performance Criteria
QC Sample and/or Activity Used to Assess
Measurement Performance
QC Sample Assesses Error for Sampling (S), Analytical (A) or both
(S&A)
LPR-S-01 L-34 Accuracy/Bias-Contamination <QL Method Blank A
L-34 Accuracy/Bias-Contamination <QL Equipment Rinsate
Blanks S & A
L-34 Accuracy/Bias 80-120% LCS A L-34 Accuracy/Bias 75-125% MS S & A
L-34 Accuracy/Bias Supplier Certified Limits PE Sample A
L-34 Precision RPD ≤20% MSD S & A L-34 Precision RPD ≤ 20% Laboratory Duplicate A
L-34 Precision RPD ≤ 50% if both samples are > 5x QL Field Duplicate S & A
L-34 Completeness ≥ 90% Data Completeness Check S & A
a Refer to QAPP Worksheet #15 for a complete list of analytes for each analytical group b Refer to QAPP Worksheet #21 c Refer to QAPP Worksheet #2

Section: Worksheet #12 Revision: 1
Date: July 2008
Quality Assurance Project Plan Phase I RI Low Resolution Coring/Sediment Sampling Lower Passaic River Restoration Project Newark, New Jersey Page 17 of 29
QAPP Worksheet #12 (UFP-QAPP Manual Section 2.6.2) Measurement Performance Criteria Table
J:\Water\ProjectFiles\P120\12182_Passaic\QAPP\Rev 1_July 2008\2008_Low Res Core QAPP_2008 July 18_Rev1_worksheet1-19.doc
Matrix Sediment Analytical Groupa Butyltins Concentration Level Low
Sampling Procedureb Analytical
Method/SOPc DQIs Measurement
Performance Criteriad
QC Sample and/or Activity Used to Assess
Measurement Performance
QC Sample Assesses Error for Sampling (S), Analytical (A) or both
(S&A) LPR-S-01, LPR-S-02, LPR-S-03, LPR-S-04 L-21 Accuracy/Bias-
Contamination No target compound >QL Method Blank A
L-21 Accuracy/Bias-Contamination No target compound >QL Equipment Rinsate
Blanks S & A
L-21 Accuracy/Bias Compound-specific, see Appendix C-2 LCS A
L-21 Accuracy/Bias Compound-specific, see Appendix C-2 MS S & A
L-21 Accuracy/Bias Supplier Certified Limits PE Sample A
L-21 Precision RPD ≤ 40% (see Appendix C-2) MSD S & A
L-21 Precision RPD ≤ 50% if both samples are >5xQL Field Duplicate S & A
L-21 Completeness ≥ 90% Data Completeness Check S & A
a Refer to QAPP Worksheet #15 for a complete list of analytes for each analytical group b Refer to QAPP Worksheet #21 c Refer to QAPP Worksheet #23 d Analyte specific limits may be found in Appendix C

Section: Worksheet #12 Revision: 1
Date: July 2008
Quality Assurance Project Plan Phase I RI Low Resolution Coring/Sediment Sampling Lower Passaic River Restoration Project Newark, New Jersey Page 18 of 29
QAPP Worksheet #12 (UFP-QAPP Manual Section 2.6.2) Measurement Performance Criteria Table
J:\Water\ProjectFiles\P120\12182_Passaic\QAPP\Rev 1_July 2008\2008_Low Res Core QAPP_2008 July 18_Rev1_worksheet1-19.doc
Matrix Sediment Analytical Groupa General Chemistry - Sulfides Concentration Level Low
Sampling Procedureb Analytical
Method/SOPc DQIs Measurement
Performance Criteria
QC Sample and/or Activity Used to Assess
Measurement Performance
QC Sample Assesses Error for Sampling (S), Analytical (A) or both
(S&A) LPR-S-01, LPR-S-02, LPR-S-03, LPR-S-04 L-30 Accuracy/Bias-
Contamination < QL Method Blank A
L-30 Accuracy/Bias-Contamination <QL Equipment Rinsate
Blanks S & A
L-30 Accuracy/Bias 51-125% (see Appendix C-2) LCS A
L-30 Accuracy/Bias 46-144% (see Appendix C-2) MS S & A
L-30 Accuracy/Bias Supplier Certified Limits PE Sample A
L-30 Precision RPD ≤ 43% (see Appendix C-2) Laboratory Duplicate A
L-30 Precision RPD ≤ 50% if both samples are > 5x QL Field Duplicate S & A
L-30 Completeness ≥ 90% Data Completeness Check S & A
a Refer to QAPP Worksheet #15 for a complete list of analytes for each analytical group b Refer to QAPP Worksheet #21 c Refer to QAPP Worksheet #23

Section: Worksheet #12 Revision: 1
Date: July 2008
Quality Assurance Project Plan Phase I RI Low Resolution Coring/Sediment Sampling Lower Passaic River Restoration Project Newark, New Jersey Page 19 of 29
QAPP Worksheet #12 (UFP-QAPP Manual Section 2.6.2) Measurement Performance Criteria Table
J:\Water\ProjectFiles\P120\12182_Passaic\QAPP\Rev 1_July 2008\2008_Low Res Core QAPP_2008 July 18_Rev1_worksheet1-19.doc
Matrix Sediment Analytical Groupa General Chemistry – AVS/SEM Concentration Level Low
Sampling Procedureb Analytical
Method/SOPc DQIs Measurement
Performance Criteriad
QC Sample and/or Activity Used to Assess
Measurement Performance
QC Sample Assesses Error for Sampling (S), Analytical (A) or both
(S&A) LPR-S-01, LPR-S-02, LPR-S-03, LPR-S-04 L-22 Accuracy/Bias-
Contamination No target compound >QL Method Blank A
L-22 Accuracy/Bias 62-109% for AVS; Compound-specific, see Appendix C-2 for metals
LCS A
L-22 Accuracy/Bias 66-117% for AVS; Compound-specific, see Appendix C-2 for metals
MS S & A
L-22 Accuracy/Bias Supplier Certified Limits PE Sample A L-22 Precision RPD ≤ 45% Laboratory Duplicate A
L-22 Precision RPD ≤ 50% if both samples are >5x QL Field Duplicate S & A
L-22 Completeness ≥ 90% Data Completeness Check S & A
a Refer to QAPP Worksheet #15 for a complete list of analytes for each analytical group b Refer to QAPP Worksheet #21 c Refer to QAPP Worksheet #23 d Analyte specific limits may be found in Appendix

Section: Worksheet #12 Revision: 1
Date: July 2008
Quality Assurance Project Plan Phase I RI Low Resolution Coring/Sediment Sampling Lower Passaic River Restoration Project Newark, New Jersey Page 20 of 29
QAPP Worksheet #12 (UFP-QAPP Manual Section 2.6.2) Measurement Performance Criteria Table
J:\Water\ProjectFiles\P120\12182_Passaic\QAPP\Rev 1_July 2008\2008_Low Res Core QAPP_2008 July 18_Rev1_worksheet1-19.doc
Matrix Sediment Analytical Groupa General Chemistry – Ammonia Concentration Level Low
Sampling Procedureb Analytical
Method/SOPc DQIs Measurement
Performance Criteria
QC Sample and/or Activity Used to Assess
Measurement Performance
QC Sample Assesses Error for Sampling (S), Analytical (A) or both
(S&A) LPR-S-01, LPR-S-02, LPR-S-03, LPR-S-04 L-23 Accuracy/Bias-
Contamination < QL Method Blank A
L-23 Accuracy/Bias-Contamination <QL Equipment Rinsate
Blanks S & A
L-23 Accuracy/Bias 58-131% (see Appendix C-2) LCS A
L-23 Accuracy/Bias 66-127% (see Appendix C-2) MS S & A
L-23 Accuracy/Bias Supplier Certified Limits PE Sample A
L-23 Precision RPD ≤ 32% (see Appendix C-2) Laboratory Duplicate A
L-23 Precision RPD ≤ 50% if both samples are >5x QL Field Duplicate S & A
L-23 Completeness ≥ 90% Data Completeness Check S & A
a Refer to QAPP Worksheet #15 for a complete list of analytes for each analytical group b Refer to QAPP Worksheet #21 c Refer to QAPP Worksheet #23

Section: Worksheet #12 Revision: 1
Date: July 2008
Quality Assurance Project Plan Phase I RI Low Resolution Coring/Sediment Sampling Lower Passaic River Restoration Project Newark, New Jersey Page 21 of 29
QAPP Worksheet #12 (UFP-QAPP Manual Section 2.6.2) Measurement Performance Criteria Table
J:\Water\ProjectFiles\P120\12182_Passaic\QAPP\Rev 1_July 2008\2008_Low Res Core QAPP_2008 July 18_Rev1_worksheet1-19.doc
Matrix Sediment Analytical Groupa General Chemistry – Cyanide Concentration Level Low
Sampling Procedureb Analytical
Method/SOPc DQIs Measurement
Performance Criteria
QC Sample and/or Activity Used to Assess
Measurement Performance
QC Sample Assesses Error for Sampling (S), Analytical (A) or both
(S&A) LPR-S-01, LPR-S-02, LPR-S-03, LPR-S-04 L-25 Accuracy/Bias-
Contamination < QL Method Blank A
L-25 Accuracy/Bias-Contamination <QL Equipment Rinsate
Blanks S & A
L-25 Accuracy/Bias 85-115% (see Appendix C-2) LCS A
L-25 Accuracy/Bias 75 -125% (see Appendix C-2) MS S & A
L-25 Accuracy/Bias Supplier Certified Limits PE Sample A
L-25 Precision RPD ≤ 20%(see Appendix C-2) Laboratory Duplicate A
L-25 Precision RPD ≤ 50% if both samples are >5x QL Field Duplicate S & A
L-25 Completeness ≥ 90% Data Completeness Check S & A
a Refer to QAPP Worksheet #15 for a complete list of analytes for each analytical group b Refer to QAPP Worksheet #21 c Refer to QAPP Worksheet #23

Section: Worksheet #12 Revision: 1
Date: July 2008
Quality Assurance Project Plan Phase I RI Low Resolution Coring/Sediment Sampling Lower Passaic River Restoration Project Newark, New Jersey Page 22 of 29
QAPP Worksheet #12 (UFP-QAPP Manual Section 2.6.2) Measurement Performance Criteria Table
J:\Water\ProjectFiles\P120\12182_Passaic\QAPP\Rev 1_July 2008\2008_Low Res Core QAPP_2008 July 18_Rev1_worksheet1-19.doc
Matrix Sediment Analytical Groupa General Chemistry – TKN Concentration Level Low
Sampling Procedureb Analytical
Method/SOPc DQIs Measurement
Performance Criteria
QC Sample and/or Activity Used to Assess
Measurement Performance
QC Sample Assesses Error for Sampling (S), Analytical (A) or both
(S&A) LPR-S-01, LPR-S-02, LPR-S-03, LPR-S-04 L-27 Accuracy/Bias-
Contamination < QL Method Blank A
L-27 Accuracy/Bias-Contamination <QL Equipment Rinsate
Blanks S & A
L-27 Accuracy/Bias 70-108% (see Appendix C-2) LCS A
L-27 Accuracy/Bias 38-138% (see Appendix C-2) MS S & A
L-27 Accuracy/Bias Supplier Certified Limits PE Sample A
L-27 Precision RPD ≤ 20% (see Appendix C-2) Laboratory Duplicate A
L-27 Precision RPD ≤ 50% if both samples are >5x QL Field Duplicate S & A
L-27 Completeness ≥ 90% Data Completeness Check S & A
a Refer to QAPP Worksheet #15 for a complete list of analytes for each analytical group b Refer to QAPP Worksheet #21 c Refer to QAPP Worksheet #23

Section: Worksheet #12 Revision: 1
Date: July 2008
Quality Assurance Project Plan Phase I RI Low Resolution Coring/Sediment Sampling Lower Passaic River Restoration Project Newark, New Jersey Page 23 of 29
QAPP Worksheet #12 (UFP-QAPP Manual Section 2.6.2) Measurement Performance Criteria Table
J:\Water\ProjectFiles\P120\12182_Passaic\QAPP\Rev 1_July 2008\2008_Low Res Core QAPP_2008 July 18_Rev1_worksheet1-19.doc
Matrix Sediment Analytical Groupa General Chemistry – Phosphorus Concentration Level Low
Sampling Procedureb Analytical
Method/SOPc DQIs Measurement
Performance Criteriad
QC Sample and/or Activity Used to Assess
Measurement Performance
QC Sample Assesses Error for Sampling (S), Analytical (A) or both
(S&A) LPR-S-01, LPR-S-02, LPR-S-03, LPR-S-04 L-26 Accuracy/Bias-
Contamination < QL Method Blank A
L-26 Accuracy/Bias-Contamination <QL Equipment Rinsate
Blanks S & A
L-26 Accuracy/Bias 85- 115% (see Appendix C-2) LCS A
L-26 Accuracy/Bias 75 -125% (see Appendix C-2) MS S & A
L-26 Accuracy/Bias Supplier Certified Limits PE Sample A
L-26 Precision RPD ≤ 20% (see Appendix C-2) Laboratory Duplicate A
L-26 Precision ≤ 50% if both samples are >5x QL Field Duplicate S & A
L-26 Completeness ≥ 90% Data Completeness Check S & A
a Refer to QAPP Worksheet #15 for a complete list of analytes for each analytical group b Refer to QAPP Worksheet #21 c Refer to QAPP Worksheet #23 d Analyte specific limits may be found in Appendix C
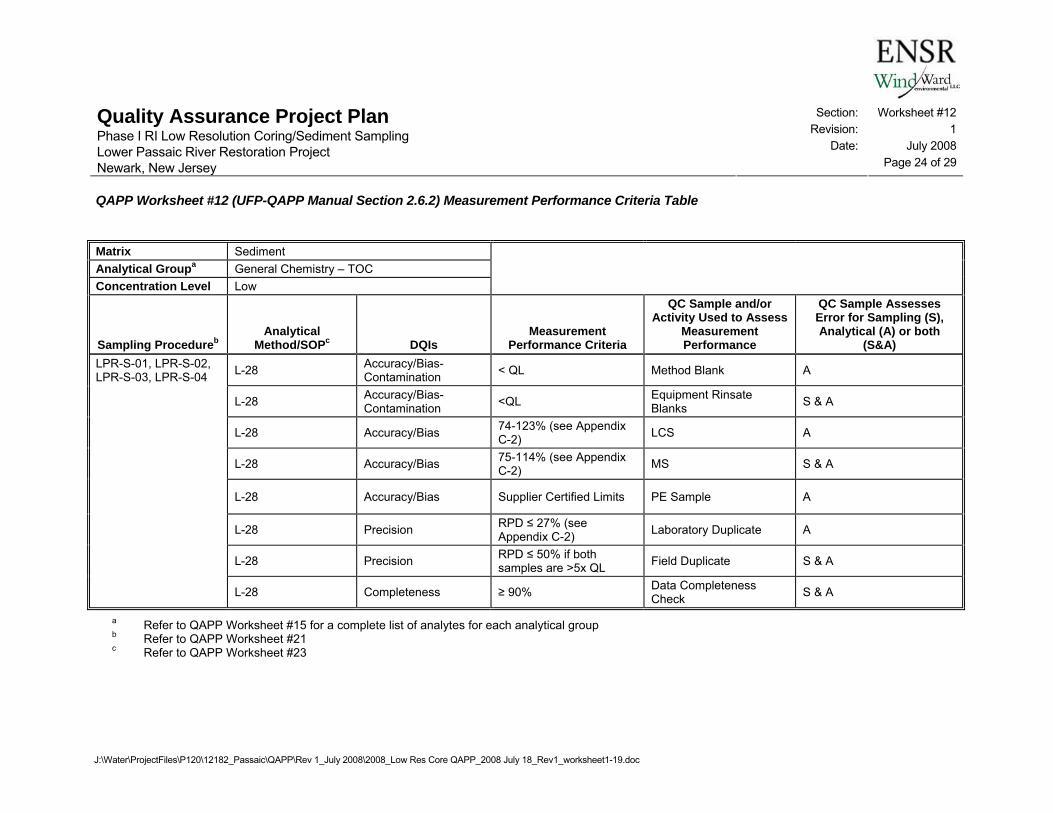
Section: Worksheet #12 Revision: 1
Date: July 2008
Quality Assurance Project Plan Phase I RI Low Resolution Coring/Sediment Sampling Lower Passaic River Restoration Project Newark, New Jersey Page 24 of 29
QAPP Worksheet #12 (UFP-QAPP Manual Section 2.6.2) Measurement Performance Criteria Table
J:\Water\ProjectFiles\P120\12182_Passaic\QAPP\Rev 1_July 2008\2008_Low Res Core QAPP_2008 July 18_Rev1_worksheet1-19.doc
Matrix Sediment Analytical Groupa General Chemistry – TOC Concentration Level Low
Sampling Procedureb Analytical
Method/SOPc DQIs Measurement
Performance Criteria
QC Sample and/or Activity Used to Assess
Measurement Performance
QC Sample Assesses Error for Sampling (S), Analytical (A) or both
(S&A) LPR-S-01, LPR-S-02, LPR-S-03, LPR-S-04 L-28 Accuracy/Bias-
Contamination < QL Method Blank A
L-28 Accuracy/Bias-Contamination <QL Equipment Rinsate
Blanks S & A
L-28 Accuracy/Bias 74-123% (see Appendix C-2) LCS A
L-28 Accuracy/Bias 75-114% (see Appendix C-2) MS S & A
L-28 Accuracy/Bias Supplier Certified Limits PE Sample A
L-28 Precision RPD ≤ 27% (see Appendix C-2) Laboratory Duplicate A
L-28 Precision RPD ≤ 50% if both samples are >5x QL Field Duplicate S & A
L-28 Completeness ≥ 90% Data Completeness Check S & A
a Refer to QAPP Worksheet #15 for a complete list of analytes for each analytical group b Refer to QAPP Worksheet #21 c Refer to QAPP Worksheet #23

Section: Worksheet #12 Revision: 1
Date: July 2008
Quality Assurance Project Plan Phase I RI Low Resolution Coring/Sediment Sampling Lower Passaic River Restoration Project Newark, New Jersey Page 25 of 29
QAPP Worksheet #12 (UFP-QAPP Manual Section 2.6.2) Measurement Performance Criteria Table
J:\Water\ProjectFiles\P120\12182_Passaic\QAPP\Rev 1_July 2008\2008_Low Res Core QAPP_2008 July 18_Rev1_worksheet1-19.doc
Matrix Sediment Analytical Groupa Physical Testing – Grain Size Analysis Concentration Level Low
Sampling Procedureb Analytical
Method/SOPc DQIs Measurement
Performance Criteria
QC Sample and/or Activity Used to Assess
Measurement Performance
QC Sample Assesses Error for Sampling (S), Analytical (A) or both
(S&A) LPR-S-01, LPR-S-02, LPR-S-03, LPR-S-04 L-31 Precision RPD ≤ 20% Laboratory Duplicates S & A
L-31 Accuracy/Bias Supplier Certified Limits Performance Sample A
L-31 Completeness >90% Data Completeness Check S & A
a Refer to QAPP Worksheet #15 for a complete list of analytes for each analytical group b Refer to QAPP Worksheet #21 c Refer to QAPP Worksheet #23

Section: Worksheet #12 Revision: 1
Date: July 2008
Quality Assurance Project Plan Phase I RI Low Resolution Coring/Sediment Sampling Lower Passaic River Restoration Project Newark, New Jersey Page 26 of 29
QAPP Worksheet #12 (UFP-QAPP Manual Section 2.6.2) Measurement Performance Criteria Table
J:\Water\ProjectFiles\P120\12182_Passaic\QAPP\Rev 1_July 2008\2008_Low Res Core QAPP_2008 July 18_Rev1_worksheet1-19.doc
Matrix Sediment Analytical Groupa General Chemistry – Atterberg Limits Concentration Level Low
Sampling Procedureb Analytical
Method/SOPc DQIs Measurement
Performance Criteria
QC Sample and/or Activity Used to Assess
Measurement Performance
QC Sample Assesses Error for Sampling (S), Analytical (A) or both
(S&A) LPR-S-01, LPR-S-02, LPR-S-03, LPR-S-04 L-32 Precision 1% Absolute Laboratory Duplicates A
L-32 Completeness >90% Data Completeness Check S & A
a Refer to QAPP Worksheet #15 for a complete list of analytes for each analytical group b Refer to QAPP Worksheet #21 c Refer to QAPP Worksheet #23

Section: Worksheet #12 Revision: 1
Date: July 2008
Quality Assurance Project Plan Phase I RI Low Resolution Coring/Sediment Sampling Lower Passaic River Restoration Project Newark, New Jersey Page 27 of 29
QAPP Worksheet #12 (UFP-QAPP Manual Section 2.6.2) Measurement Performance Criteria Table
J:\Water\ProjectFiles\P120\12182_Passaic\QAPP\Rev 1_July 2008\2008_Low Res Core QAPP_2008 July 18_Rev1_worksheet1-19.doc
Matrix Sediment Analytical Groupa General Chemistry – Specific Gravity Concentration Level Low
Sampling Procedureb Analytical
Method/SOPc DQIs Measurement
Performance Criteria
QC Sample and/or Activity Used to Assess
Measurement Performance Analytical Method/SOPc
LPR-S-01, LPR-S-02, LPR-S-03, LPR-S-04 L-33 Precision RPD ≤ 20% Laboratory Duplicates A
L-33 Completeness >90% Data Completeness Check S & A
a Refer to QAPP Worksheet #15 for a complete list of analytes for each analytical group b Refer to QAPP Worksheet #21 c Refer to QAPP Worksheet #23

Section: Worksheet #12 Revision: 1
Date: July 2008
Quality Assurance Project Plan Phase I RI Low Resolution Coring/Sediment Sampling Lower Passaic River Restoration Project Newark, New Jersey Page 28 of 29
QAPP Worksheet #12 (UFP-QAPP Manual Section 2.6.2) Measurement Performance Criteria Table
J:\Water\ProjectFiles\P120\12182_Passaic\QAPP\Rev 1_July 2008\2008_Low Res Core QAPP_2008 July 18_Rev1_worksheet1-19.doc
Matrix Sediment
Analytical Groupa Biological – E. Coli
Concentration Level Low
Sampling Procedureb Analytical
Method/SOPc DQIs Measurement
Performance Criteriad
QC Sample and/or Activity Used to Assess
Measurement Performance Analytical Method/SOPc
LPR-S-01 L-38, L-38a Accuracy/Bias Yellow color with fluorescence Control Sample A
L-38, L-38a Accuracy/Bias-Contamination No color, no fluorescence Method Blank A
L-38, L-38a Completeness >90% Data Completeness Check S & A
a Refer to QAPP Worksheet #15 for a complete list of analytes for each analytical group b Refer to QAPP Worksheet #21 c Refer to QAPP Worksheet #23 d Analyte specific limits may be found in Appendix C

Section: Worksheet #12 Revision: 1
Date: July 2008
Quality Assurance Project Plan Phase I RI Low Resolution Coring/Sediment Sampling Lower Passaic River Restoration Project Newark, New Jersey Page 29 of 29
QAPP Worksheet #12 (UFP-QAPP Manual Section 2.6.2) Measurement Performance Criteria Table
J:\Water\ProjectFiles\P120\12182_Passaic\QAPP\Rev 1_July 2008\2008_Low Res Core QAPP_2008 July 18_Rev1_worksheet1-19.doc
Matrix Sediment Analytical Groupa Biological – Giardia Concentration Level Low
Sampling Procedureb Analytical
Method/SOPc DQIs Measurement
Performance Criteria
QC Sample and/or Activity Used to Assess
Measurement Performance Analytical Method/SOPc
LPR-S-01 L-39. L-39a Precision ±30% Laboratory Duplicates A L-39, L-39a Accuracy/Bias 14 -100% Control Sample A
L-39, L-39a Accuracy/Bias-Contamination Negative Method Blank A
L-39, L-39a Completeness >90% Data Completeness Check S & A
a Refer to QAPP Worksheet #15 for a complete list of analytes for each analytical group b Refer to QAPP Worksheet #21 c Refer to QAPP Worksheet #23

Section: Worksheet #13 Revision: 1
Date: July 2008
Quality Assurance Project Plan Phase I RI Low Resolution Coring/Sediment Sampling Lower Passaic River Restoration Project Newark, New Jersey Page 1 of 5
J:\Water\ProjectFiles\P120\12182_Passaic\QAPP\Rev 1_July 2008\2008_Low Res Core QAPP_2008 July 18_Rev1_worksheet1-19.doc
QAPP Worksheet #13 (UFP-QAPP Manual Section 2.7) Secondary Data Criteria and Limitations Table
Secondary Data
Data Source (Originating Organization,
Report Title, and Date)
Data Generator(s) (Originating Org., Data Types,
Data Generation/Collection Dates) How Data Will Be Used Limitations on Data Use
Work Performed by USEPA/MPI or other agencies on the Passaic
Probing and core data from pre-coring reconnaissance work
USEPA sampling program conducted by MPI in 2007-08
USEPA. Inference on sediment type and thickness (probing) as well as sediment description (cores)
Recent surficial sediment conditions.
Subjective delineation and identification method subject to different interpretations. Comparison of core logs and these data required to verify results.
Analytical data from the LPR high resolution core program
USEPA sampling program conducted by MPI in 2005
USEPA. Sediment dating (Cs-137, Be-7) and contaminant concentrations (PCDD/PCDF, PCBs, PAHs, pesticides, metals). Cores collected Sept. 19 to Oct. 12, 2005.
Map aerial and vertical chemical distribution
Only 5 sediment cores were analyzed for limited and selected chemical parameters. 14 analyzed for Cs-137 over a 10 mile interval. Not all segments from all cores were analyzed. Core in erosional areas were either not utilized or not fully analyzed. Several cores did not produce recovery called for in SOPs. Summary narrative provided. Characterization report not produced to document field or analytical activities. Use data with the recognition that laboratory and/or validation qualifiers may impose limitations on specific datasets and/or data points.

Section: Worksheet #13 Revision: 1
Date: july 2008
Quality Assurance Project Plan Phase I RI Low Resolution Coring/Sediment Sampling Lower Passaic River Restoration Project Newark, New Jersey Page 2 of 5
QAPP Worksheet #13 (UFP-QAPP Manual Section 2.7) Secondary Data Criteria and Limitations Table
J:\Water\ProjectFiles\P120\12182_Passaic\QAPP\Rev 1_July 2008\2008_Low Res Core QAPP_2008 July 18_Rev1_worksheet1-19.doc
Secondary Data
Data Source (Originating Organization,
Report Title, and Date)
Data Generator(s) (Originating Org., Data Types,
Data Generation/Collection Dates) How Data Will Be Used Limitations on Data Use Analytical data from the LPR low resolution core program
USEPA sampling program conducted by MPI in 2006
USEPA (performed by MPI) 2006 - 10 cores - Sediment dating (Cs-137, Be-7) and contaminant concentrations (PCDD/PCDF, PCBs, PAHs, pesticides, metals) - in the MPI database: Passaic River Estuary Management Information System (PREmis)
Map aerial and vertical chemical distribution
10 sediment cores were supposed to be collected in close proximity to Tierra location requirements of the SOPS were not met for several cores Several cores did not meet recovery requirements. USEPA/MPI have utilized these data in limited extent if at all. Summary narrative provided. Characterization report not produced to document field or analytical activities. Use data with the recognition that laboratory and/or validation qualifiers may impose limitations on specific datasets and/or data points.
Analytical data from the grab samples collected for sediment dating
USEPA sampling program conducted by MPI in 2005
USEPA (collected by MPI) - Aug 2005 - 45 locations - Be-7
Provide insight into potential deposition areas
Characterization report not produced to document field or analytical activities. Use data with the recognition that laboratory and/or validation qualifiers may impose limitations on specific datasets and/or data points.

Section: Worksheet #13 Revision: 1
Date: july 2008
Quality Assurance Project Plan Phase I RI Low Resolution Coring/Sediment Sampling Lower Passaic River Restoration Project Newark, New Jersey Page 3 of 5
QAPP Worksheet #13 (UFP-QAPP Manual Section 2.7) Secondary Data Criteria and Limitations Table
J:\Water\ProjectFiles\P120\12182_Passaic\QAPP\Rev 1_July 2008\2008_Low Res Core QAPP_2008 July 18_Rev1_worksheet1-19.doc
Secondary Data
Data Source (Originating Organization,
Report Title, and Date)
Data Generator(s) (Originating Org., Data Types,
Data Generation/Collection Dates) How Data Will Be Used Limitations on Data Use Analytical data from short cores collected above Dundee Dam
USEPA sampling program conducted by MPI Jan. 11, 2007
USEPA. Sediment cores dated and analyzed for organic and inorganic contaminants
Characterize the Upper Passaic River source
Data from only two cores were completely analyzed. Summary narrative provided. Characterization report not produced to document field or analytical activities. Use data with the recognition that laboratory and/or validation qualifiers may impose limitations on specific datasets and/or data points.
Work Performed by Tierra Solutions, Inc. on the Passaic
Analytical data from the LPR coring program
Tierra Solutions, Inc. Newark Bay Study Area RI WP
Tierra Solutions Inc. Sediment chemistry collected form 93 sediment core locations (658 samples) for chemical, radiological and geotechnical analysis.
Evaluation of various organic and inorganic chemicals.
Samples collected using vibracoring should be interpreted noting individual core recovery and the uncertainty of vertical placement of the recovered samples. Use data with the recognition that laboratory and/or validation qualifiers may impose limitations on specific datasets and/or data points.

Section: Worksheet #13 Revision: 1
Date: july 2008
Quality Assurance Project Plan Phase I RI Low Resolution Coring/Sediment Sampling Lower Passaic River Restoration Project Newark, New Jersey Page 4 of 5
QAPP Worksheet #13 (UFP-QAPP Manual Section 2.7) Secondary Data Criteria and Limitations Table
J:\Water\ProjectFiles\P120\12182_Passaic\QAPP\Rev 1_July 2008\2008_Low Res Core QAPP_2008 July 18_Rev1_worksheet1-19.doc
Secondary Data
Data Source (Originating Organization,
Report Title, and Date)
Data Generator(s) (Originating Org., Data Types,
Data Generation/Collection Dates) How Data Will Be Used Limitations on Data Use Analytical data from the LPR sediment grab program
Tierra Solutions, Inc. Newark Bay Study Area RI WP
Tierra Solutions Inc. Surface sediment composite sampling of 45 samples, collected from lower 6miles of river for chemical analysis.
Evaluation of various organic and inorganic chemicals.
Tierra Solutions, Inc. collected 10 discrete samples that were composited into one sample that was intended to characterize a single mudflat. Use data with the recognition that laboratory and/or validation qualifiers may impose limitations on specific datasets and/or data points.
Work Performed by CPG/ENSR on the Passaic
Aerial Photography and Digital Orthophotos, photogrammetric mapping and topography
CPG, LPRSA. Produced by GEOD Corp on behalf of CPG. Data sent to EPA in November and December 2007.
In completion of RI/FS Orthophotos - Valid for accuracy and map scales as explained in the metadata. Current only as of the date of photography, 3/12/2007 Photogrammetric Mapping Products - Valid for accuracy and map scales as explained in the metadata. Current only as of the date of photography, 4/11/2007.

Section: Worksheet #13 Revision: 1
Date: july 2008
Quality Assurance Project Plan Phase I RI Low Resolution Coring/Sediment Sampling Lower Passaic River Restoration Project Newark, New Jersey Page 5 of 5
QAPP Worksheet #13 (UFP-QAPP Manual Section 2.7) Secondary Data Criteria and Limitations Table
J:\Water\ProjectFiles\P120\12182_Passaic\QAPP\Rev 1_July 2008\2008_Low Res Core QAPP_2008 July 18_Rev1_worksheet1-19.doc
Secondary Data
Data Source (Originating Organization,
Report Title, and Date)
Data Generator(s) (Originating Org., Data Types,
Data Generation/Collection Dates) How Data Will Be Used Limitations on Data Use Bathymetric survey No report to date - data
delivered to USEPA CPG. Multi-beam and single beam survey performed by Gahagan and Bryant (subcontractor to ENSR) in Aug-Sept 2007
Characterize existing bathymetry, compare with previous surveys to assess sediment stability
Single beam - Coverage limited to project river miles 0.5 - 8.2 and 14.3 - 16.5. Current only as of the date of survey, August 2007. Multi-beam Coverage limited to project river miles 0 - 14.4, and to channel area in project river miles 0 - 0.9. Current only as of the date of survey, August 2007
Work Performed by Tierra Solutions Inc. on Newark Bay
Analytical data from the Newark Bay Phase 1 Sampling Program
Tierra Solutions, Inc. Tierra Solutions Inc. Sediment chemistry collected as part of the Newark Bay Study Area Phase 1 RI from Oct.-Dec. 2005
Characterize the Newark Bay source signature
Use data with the recognition that laboratory and/or validation qualifiers may impose limitations on specific datasets and/or data points.

Section: Worksheet #14 Revision: 1
Date: July 2008
Quality Assurance Project Plan Phase I RI Low Resolution Coring/Sediment Sampling Lower Passaic River Restoration Project Newark, New Jersey Page 1 of 5
J:\Water\ProjectFiles\P120\12182_Passaic\QAPP\Rev 1_July 2008\2008_Low Res Core QAPP_2008 July 18_Rev1_worksheet1-19.doc
QAPP Worksheet #14 (UFP-QAPP Manual Section 2.8.1) Summary of Project Tasks
Sampling Tasks: The low resolution core sediment survey includes the combination of both sediment grabs and vibracores. An initial grab sample will be collected at each station using a modified Van Veen grab. The goal of the grab sampling is to collect a representative surficial sediment sample, from the interval 0 to 1” below the sediment-water interface for Be-7 and 0 to 0.5 ft below the sediment-water interface (for all additional surficial analytes; refer to Table 2 of the FSP Addendum).
A vibracore system will be used to collect sediment samples between the sediment surface and the target depth or refusal at each station in Worksheet #18 and Table 1of the FSP Addendum (Appendix A). Target coring depths are utilized for estimation of the total number of samples in Worksheet #20. Longer cores will be sectioned as needed on the sampling vessel, to facilitate handling and to ensure that the cores are maintained upright during transport and storage. Sample processing and transfer to sample containers will be performed at the field facility. Additionally, piston coring or push coring may be used if more appropriate based on sediment depths encountered. Samples will be collected according to the following segmentation scheme:
Depth below sediment water interface
0 to 0.5 ft surface sediment (in conjunction with grab sampling)
0.5 to 1.5 ft 1-foot segment
1.5 to 2.5 ft 1-foot segment
2.5 to 3.5 ft 1-foot segment
3.5 to 5.5 ft 2-foot segment
5.5 + ft 2-foot segments continue to the red-brown clay layer, sand, or refusal
Where sand is encountered as a layer that completely underlies the recent, fine-grained sediments (rather than as a shallow sand lens), it will be sampled for a subset of analytes, as agreed to with USEPA. Limited analyses to include analysis of PAHs, metals, cyanide, SVOCs, TPH Extractables, TOC, grain size and VOCs will be performed where sand is found at the bottom of the core. The analytes will be taken out of the primary core only, so all analytes may not be achievable in all samples.
Under certain conditions, the segmentation scheme may be altered. With the agreement of the RI FTM, where a stratigraphic change in the sediment sequence (e.g., change in sediment size, obvious depositional boundary or unconformity) occurs within a segment, the sampling of that segment may be altered. This will prevent different material types, with possibly different depositional ages, from being mixed together in the same sample.

Section: Worksheet #14 Revision: 1
Date: July 2008
Quality Assurance Project Plan Phase I RI Low Resolution Coring/Sediment Sampling Lower Passaic River Restoration Project Newark, New Jersey Page 2 of 5
QAPP Worksheet #14 (UFP-QAPP Manual Section 2.8.1) Summary of Project Tasks
J:\Water\ProjectFiles\P120\12182_Passaic\QAPP\Rev 1_July 2008\2008_Low Res Core QAPP_2008 July 18_Rev1_worksheet1-19.doc
Segments will be reduced below 1-foot only where it appears that the sediment density is such that sufficient solids are present to satisfy the laboratory sample volume requirement.
In addition, per agreement with USEPA, to address a component of FSP1 Task 5.3.3, which includes the collection of fine segmentation of “core top” samples from a subset of the cores, (to address sediment transport modeling and risk assessment data needs), eight of the planned locations will be sampled to complete this additional analysis. The proposed core(s) segmentation and grab sampling will be completed at all locations as well. A box core will be utilized for collection of surface sediment to be split into five segments, per USEPA required segments:
• 0 to 2 cm • 2 to 5 cm • 5 to 10 cm • 10 to 30 cm • 30 cm to 2 feet
One box core will be collected at each of the eight locations, shown in Table 1 of the FSP Addendum as the Group D analyte group. The segments will be analyzed utilizing the sample prioritization scheme found in Table 3 of the FSP Addendum, which is based on the order requested by USEPA on March 28, 2008. One box core will be collected from each location. The analytes not available from the box core finer segmentation will be available from the core and grab samples collected at the same location.
Analysis Tasks: As the initial phase of the overall RI/FS sediment characterization, this investigation will include a wide range of sediment analyses. Four groups of analyses are proposed:
Group A - A comprehensive list of physical and inorganic and organic chemical analyses is proposed for the full set of stations and depths (refer to Worksheet #15). Toxaphene is proposed to be analyzed by two methods − HRGC/HRMS and GC/EDC (refer to Worksheet #23 and Appendix C). Toxaphene results and the associated QC data will be reviewed throughout the program. If toxaphene is not detected after an adequate number of analyses, the CPG may petition to drop the analysis of this parameter by HRGC/HRMS.
Group B - Additional organic, nutrient, and pathogen analyses are proposed for surficial samples from 13 stations over the length of the study area to determine their relevance in future investigation phases. The 13 stations, shown in Worksheet #18, were selected by reviewing the

Section: Worksheet #14 Revision: 1
Date: July 2008
Quality Assurance Project Plan Phase I RI Low Resolution Coring/Sediment Sampling Lower Passaic River Restoration Project Newark, New Jersey Page 3 of 5
QAPP Worksheet #14 (UFP-QAPP Manual Section 2.8.1) Summary of Project Tasks
J:\Water\ProjectFiles\P120\12182_Passaic\QAPP\Rev 1_July 2008\2008_Low Res Core QAPP_2008 July 18_Rev1_worksheet1-19.doc
sample maps to ensure coverage within the full length of the river, with a focus on areas of finer-grained sediments, and review of station details in terms of depths and expected sediment type.
Group C - Additional particle size-density classification, microscopy, petrography and PCB sediment-water partitioning analysis is proposed for up to seven stations to allow for evaluation of these analytical techniques for use in future investigation phases. To select the locations for the seven samples for method development, for five or six of the locations, the CPG will use the laboratory screening level PCB analysis conducted prior to conducting HRGC/HRMS quantification of PCB congeners, along with the physical description. In addition, location 2008 CLRC-007 was specifically requested for analysis by USEPA. If this sample meets the screening criteria, five other locations will be selected. If the sample does not meet the screening criteria, it will still be analyzed and six other locations will be analyzed as well. Appendix D contains details for these analytes.
Group D - For this analysis, the top segment of a core will be divided into five layers (i.e., 0 to 2 cm, 2 to 5 cm, 5 to 10 cm, 10 to 30 cm, 30 cm to 2 feet) to provide the resolution required to define the sediment bed in the sediment transport model. For these five sediment core segments, HydroQual indicated that the following analyses would be required:
• Grain size • Bulk density • Concentration of any contaminant to be modeled via the future Contaminant Fate and Transport model
The chemical contaminants will be collected in the hierarchy presented in FSP Addendum Tables 3 and 4.
HydroQual requested that the grain size analyses utilize specific sieve sizes listed below
Particle Size Classes Required for Sediment Grain Size Analysis Sieve Number Size (μm) NA Fine Fraction1 230 63 140 106 100 150

Section: Worksheet #14 Revision: 1
Date: July 2008
Quality Assurance Project Plan Phase I RI Low Resolution Coring/Sediment Sampling Lower Passaic River Restoration Project Newark, New Jersey Page 4 of 5
QAPP Worksheet #14 (UFP-QAPP Manual Section 2.8.1) Summary of Project Tasks
J:\Water\ProjectFiles\P120\12182_Passaic\QAPP\Rev 1_July 2008\2008_Low Res Core QAPP_2008 July 18_Rev1_worksheet1-19.doc
60 250 40 425 30 600 16 1140 8 2360 4 4750
1For sieve sizes smaller than 63 μm, hydrometer techniques will be used. The recommended sizes for the hydrometer analysis are 63 to 31 μm, 31 to 16 μm, 16 to 8 μm, 8 to 4 μm, and less than 4 μm.
A summary of the specific analyses and methods for each group noted above is presented in Table 2 of the FSP Addendum (Appendix A). Specific stations designated for the additional Group B and D analyses are noted in Worksheet #18 and FSP Addendum Tables 3 and 4. Tables 3 and 4 also present the prioritization of analytes from sediment at a given station.
Field measurements will include screening of select core intervals with a photoionization detector (PID) for sample selection purposes. Physical, chemical, radiochemical, and biological/pathogen tests will be performed on the sediment samples at fixed laboratories according to methods listed in Worksheet 23.
Quality Control Tasks: QC samples have been defined for the field and laboratory efforts. Field QC samples are summarized on Worksheet 20; laboratory QC samples are summarized on Worksheet 28.
Secondary Data: All relevant secondary/historical data are summarized on Worksheet 13.
Data Management Tasks: ENSR’s Data Management Plan (ENSR 2007) covers all field-collected and laboratory-generated records/data. The handling of records and data are summarized on Worksheet #29.
Documentation and Records: Project related records (field, sample transfer/chain of custody, laboratory) are summarized on Worksheet #29.
Assessment/Audit Tasks: Field and laboratory audits are scheduled in accordance with Worksheet #31.

Section: Worksheet #14 Revision: 1
Date: July 2008
Quality Assurance Project Plan Phase I RI Low Resolution Coring/Sediment Sampling Lower Passaic River Restoration Project Newark, New Jersey Page 5 of 5
QAPP Worksheet #14 (UFP-QAPP Manual Section 2.8.1) Summary of Project Tasks
J:\Water\ProjectFiles\P120\12182_Passaic\QAPP\Rev 1_July 2008\2008_Low Res Core QAPP_2008 July 18_Rev1_worksheet1-19.doc
Data Review Tasks: Field data will be reviewed as described in Worksheet 34. Laboratories are contractually required to verify all laboratory data including electronic data deliverables (EDDs) as summarized in Worksheet 34. Data validation and usability assessments will be conducted as detailed in Worksheets #35, 36, and 37.

Section: Worksheet #15 Revision: 1
Date: Julyy 2008
Quality Assurance Project Plan Phase I RI Low Resolution Coring/Sediment Sampling Lower Passaic River Restoration Project Newark, New Jersey Page 1 of 41
J:\Water\ProjectFiles\P120\12182_Passaic\QAPP\Rev 1_July 2008\2008_Low Res Core QAPP_2008 July 18_Rev1_worksheet1-19.doc
QAPP Worksheet #15 (UFP-QAPP Manual Section 2.8.1) Data Quality Levels and Analytical Method Evaluation
Note that all values have been changed from scientific notation to general numbers Any changes in values from previous QAPP are shown in red font Matrix: Sediment Analytical Group: PCBs, Aroclors; Method 8082; Test America, Pittsburgh, PA Concentration Level: Low
Analytical Methodd Achievable Laboratory
Limitse
Analyte CAS
Number DQL
(mg/kg)a
Sediment RL from 2005 QAPP
(mg/kg)b Project QL Goal
(mg/kg)c, f MDLs
(mg/kg)
Method QLs
(mg/kg) MDLs
(mg/kg) QLs
(mg/kg) Aroclor 1016 12674-11-2 NA 0.0033 0.0033 NA NA 0.000124 0.000833 Aroclor 1221 11104-28-2 NA 0.0033 0.0033 NA NA 0.000159 0.000833 Aroclor 1232 11141-16-5 NA 0.0033 0.0033 NA NA 0.000143 0.000833 Aroclor 1242 53469-21-9 NA 0.0033 0.0033 NA NA 0.000136 0.000833 Aroclor 1248 12672-29-6 NA 0.0033 0.0033 NA NA 0.000079 0.000833 Aroclor 1254 11097-69-1 NA 0.0033 0.0033 NA NA 0.000119 0.000833 Aroclor 1260 11096-82-5 NA 0.0033 0.0033 NA NA 0.000118 0.000833 Aroclor 1262 37324-23-5 NA 0.0033 0.0033 NA NA 0.000183 0.000833 Aroclor 1268 11100-14-4 NA 0.0033 0.0033 NA NA 0.000107 0.000833 a Data Quality Levels (DQLs) based on the lower of : 1) NJDEP Residential Direct Contact Cleanup Criteria, May 1999, 2) USEPA Region 9 Preliminary
Remediation Goals (PRGs) for Residential Soil, October 2004, and 3) applicable ecological thresholds based on No observable adverse effects level (NOAELs), Toxicity reference value (TRVs), Apparent effects threshold (AETs), Effects range-low (ER-Ls) and Threshold effects level (TELs). DQLs are analytical goals listed solely for the purpose of evaluating laboratory analytical methods and achievable laboratory limits; these are not project-specific screening levels or PRGs and are not approved by the USEPA as the appropriate risk assessment criteria for this project. These values will be developed in subsequent phases of the project.
b RLs were taken from Tables 2-1 through 2-21 (MPI QAPP, Lower Passaic River Restoration Project, August 2005) c The project QL goal is selected as the lower of the DQL and the Sediment RL. d Analytical MDLs and QLs are those documented in validated methods.

Section: Worksheet #15 Revision: 1
Date: July 2008
Quality Assurance Project Plan Phase I RI Low Resolution Coring/Sediment Sampling Lower Passaic River Restoration Project Newark, New Jersey Page 2 of 41
QAPP Worksheet #15 (UFP-QAPP Manual Section 2.8.1) Data Quality Levels and Analytical Method Evaluation
J:\Water\ProjectFiles\P120\12182_Passaic\QAPP\Rev 1_July 2008\2008_Low Res Core QAPP_2008 July 18_Rev1_worksheet1-19.doc
e Achievable MDLs and QLs are limits that an individual laboratory can achieve when performing a specific analytical method and are typically based on wet weight. Actual MDLs and QLs will vary based on percent moisture and other sample-specific factors. Where possible, the laboratory will increase sample weight to adjust for sample-specific moisture content, thereby, attaining the MDLs and QLs listed in Worksheet #15.
f mg/kg - milligrams per kilogram

Section: Worksheet #15 Revision: 1
Date: July 2008
Quality Assurance Project Plan Phase I RI Low Resolution Coring/Sediment Sampling Lower Passaic River Restoration Project Newark, New Jersey Page 3 of 41
QAPP Worksheet #15 (UFP-QAPP Manual Section 2.8.1) Data Quality Levels and Analytical Method Evaluation
J:\Water\ProjectFiles\P120\12182_Passaic\QAPP\Rev 1_July 2008\2008_Low Res Core QAPP_2008 July 18_Rev1_worksheet1-19.doc
Matrix: Sediment Analytical Group: PCBs – Homologs and Congeners; Method 1668A; Test America, Knoxville, TN Concentration Level: Low
Analytical Methodd Achievable Laboratory
Limitse
Analyte CAS Number DQL
(mg/kg)a
Sediment RL from 2005
QAPP (mg/kg)b
Project QL Goal
(mg/kg)c MDLs
(mg/kg)
Method QLs
(mg/kg) EDLsg
(mg/kg) QLs
(mg/kg) Monochlorobiphenyl 27323-18-8 0.0227 NA 0.0030 NA NA NA 0.000010 Dichlorobiphenyl 25512-42-9 0.0227 NA 0.0030 NA NA NA 0.000020 Trichlorobiphenyl 25323-68-6 0.0227 NA 0.0030 NA NA NA 0.000020 Tetrachlorobiphenyl 26914-33-0 0.0227 NA 0.0030 NA NA NA 0.000010 Pentachlorobiphenyl 25429-29-2 0.0227 NA 0.0030 NA NA NA 0.000010 Hexachlorobiphenyl 26601-64-9 0.0227 NA 0.0030 NA NA NA 0.000010 Heptachlorobiphenyl 28655-71-2 0.0227 NA 0.0030 NA NA NA 0.000010 Octachlorobiphenyl 55722-26-4 0.0227 NA 0.0030 NA NA NA 0.000010 Nonachlorobiphenyl 53742-07-7 0.0227 NA 0.0030 NA NA NA 0.000010 Decachlorobiphenyl 2051-24-3 0.0227 NA 0.0030 NA NA NA 0.000010
Congeners, Individual - PCB-1 through PCB-209 See below 0.0227
0.0000002 through
0.000002
0.0000002 through
0.000002 0.00000050 0.0000010
0.00000028 through
0.00000223 (see below)
0.000010 through
0.000020 (see below)
PCB 1 2051-60-7 0.0227 See abovef See abovef 0.0000080 0.000020 0.00000028 0.000010 PCB 2 2051-61-8 0.0227 See abovef See abovef 0.00000040 0.0000010 0.000000310 0.000010 PCB 3 2051-62-9 0.0227 See abovef See abovef 0.0000090 0.000020 0.000000310 0.000010 PCB 4 13029-08-8 0.0227 See abovef See abovef 0.000017 0.000050 0.00000223 0.000020 PCB 5 16605-91-7 0.0227 See abovef See abovef 0.0000010 0.0000050 0.00000170 0.000010 PCB 6 25569-80-6 0.0227 See abovef See abovef 0.0000010 0.0000050 0.00000162 0.000010 PCB 7 33284-50-3 0.0227 See abovef See abovef 0.0000020 0.0000050 0.00000164 0.000010 PCB 8 34883-43-7 0.0227 See abovef See abovef 0.000012 0.000050 0.00000159 0.000020

Section: Worksheet #15 Revision: 1
Date: July 2008
Quality Assurance Project Plan Phase I RI Low Resolution Coring/Sediment Sampling Lower Passaic River Restoration Project Newark, New Jersey Page 4 of 41
QAPP Worksheet #15 (UFP-QAPP Manual Section 2.8.1) Data Quality Levels and Analytical Method Evaluation
J:\Water\ProjectFiles\P120\12182_Passaic\QAPP\Rev 1_July 2008\2008_Low Res Core QAPP_2008 July 18_Rev1_worksheet1-19.doc
Analytical Methodd Achievable Laboratory
Limitse
Analyte CAS Number DQL
(mg/kg)a
Sediment RL from 2005
QAPP (mg/kg)b
Project QL Goal
(mg/kg)c MDLs
(mg/kg)
Method QLs
(mg/kg) EDLsg
(mg/kg) QLs
(mg/kg) PCB 9 34883-39-1 0.0227 See abovef See abovef 0.0000080 0.0000050 0.00000163 0.000010 PCB 10 33146-45-1 0.0227 See abovef See abovef 0.0000020 0.0000050 0.00000177 0.000010 PCB 11 2050-67-1 0.0227 See abovef See abovef 0.000010 0.000020 0.00000163 0.000020
PCB 12/PCB 13 2974-92-7/ 2974-90-5 0.0227 See abovef See abovef
0.0000030 0.000010 0.00000162 0.000010
PCB 14 34883-41-5 0.0227 See abovef See abovef 0.0000030 0.000010 0.00000140 0.000010 PCB 15 2050-68-2 0.0227 See abovef See abovef 0.000018 0.000050 0.00000170 0.000010 PCB 16 38444-78-9 0.0227 See abovef See abovef 0.0000040 0.000010 0.00000130 0.000010 PCB 17 37680-66-3 0.0227 See abovef See abovef 0.0000090 0.000020 0.00000113 0.000010
PCB 18/PCB 30 37680-65-2/ 35693-92-6 0.0227 See abovef See abovef
0.000017 0.000050 0.00000118 0.000020
PCB 19 38444-73-4 0.0227 See abovef See abovef 0.0000040 0.000010 0.00000127 0.000010
PCB 20/PCB 28 38444-84-7/ 7012-37-5 0.0227 See abovef See abovef
0.000019 0.000050 0.000000530 0.000020
PCB 21/PCB 33 55702-46-0/ 38444-86-9 0.0227
See abovef See abovef 0.0000050 0.000020 0.000000520 0.000010
PCB 22 38444-85-8 0.0227 See abovef See abovef 0.0000090 0.000020 0.000000540 0.000010 PCB 23 55720-44-0 0.0227 See abovef See abovef 0.0000050 0.000020 0.000000550 0.000010 PCB 24 55702-45-9 0.0227 See abovef See abovef 0.0000050 0.000020 0.000000840 0.000010 PCB 25 55712-37-3 0.0227 See abovef See abovef 0.0000050 0.000020 0.000000480 0.000010
PCB 26/PCB 29 38444-81-4/ 15862-07-4 0.0227 See abovef See abovef
0.0000080 0.000020 0.000000520 0.000010
PCB 27 38444-76-7 0.0227 See abovef See abovef 0.0000060 0.000020 0.000000770 0.000010 PCB 31 16606-02-3 0.0227 See abovef See abovef 0.000015 0.000050 0.000000530 0.000020 PCB 32 38444-77-8 0.0227 See abovef See abovef 0.0000080 0.000020 0.000000760 0.000010

Section: Worksheet #15 Revision: 1
Date: July 2008
Quality Assurance Project Plan Phase I RI Low Resolution Coring/Sediment Sampling Lower Passaic River Restoration Project Newark, New Jersey Page 5 of 41
QAPP Worksheet #15 (UFP-QAPP Manual Section 2.8.1) Data Quality Levels and Analytical Method Evaluation
J:\Water\ProjectFiles\P120\12182_Passaic\QAPP\Rev 1_July 2008\2008_Low Res Core QAPP_2008 July 18_Rev1_worksheet1-19.doc
Analytical Methodd Achievable Laboratory
Limitse
Analyte CAS Number DQL
(mg/kg)a
Sediment RL from 2005
QAPP (mg/kg)b
Project QL Goal
(mg/kg)c MDLs
(mg/kg)
Method QLs
(mg/kg) EDLsg
(mg/kg) QLs
(mg/kg) PCB 34 37680-68-5 0.0227 See abovef See abovef 0.0000070 0.000020 0.000000540 0.000010 PCB 35 37680-69-6 0.0227 See abovef See abovef 0.0000080 0.000020 0.000000550 0.000010 PCB 36 38444-87-0 0.0227 See abovef See abovef 0.0000080 0.000020 0.000000520 0.000010 PCB 37 38444-90-5 0.0227 See abovef See abovef 0.000013 0.000050 0.000000540 0.000010 PCB 38 53555-66-1 0.0227 See abovef See abovef 0.0000080 0.000020 0.000000530 0.000010 PCB 39 38444-88-1 0.0227 See abovef See abovef 0.0000090 0.000020 0.000000500 0.000010
PCB 40/PC B41/PCB 71
38444-93-8/ 52663-59-9/ 41464-46-4 0.0227 See abovef See abovef
0.000012 0.000050 0.00000104 0.000010
PCB 42 36559-22-5 0.0227 See abovef See abovef 0.0000060 0.000020 0.000000880 0.000010
PCB 43/PCB 73 70362-46-8/ 74338-23-1 0.0227 See abovef See abovef
0.0000090/ 0.000016
0.000020/ 0.000050
0.000000790 0.000010
PCB 44/PCB 47/PCB 65
41464-39-5/ 2437-79-8/ 33284-54-7 0.0227 See abovef See abovef
0.000019 0.000050 0.000000740 0.000010
PCB 45/PCB 51 70362-45-7/ 68194-04-7 0.0227 See abovef See abovef
0.0000050 0.000020 0.000000890 0.000010
PCB 46 41464-47-5 0.0227 See abovef See abovef 0.000010 0.000020 0.00000108 0.000010 PCB 48 70362-47-9 0.0227 See abovef See abovef 0.0000080 0.000020 0.000000860 0.000010
PCB 49/PCB 69 41464-40-8/ 60233-24-1 0.0227 See abovef See abovef
0.000011 0.000050 0.000000750 0.000010
PCB 50/PCB 53 62796-65-0/ 41464-41-9 0.0227 See abovef See abovef
0.0000060 0.000020 0.000000820 0.000010
PCB 52 35693-99-3 0.0227 See abovef See abovef 0.000019 0.000050 0.000000820 0.000010 PCB 54 15968-05-5 0.0227 See abovef See abovef 0.000012 0.000050 0.000000980 0.000010 PCB 55 74338-24-2 0.0227 See abovef See abovef 0.000012 0.000050 0.000000650 0.000010

Section: Worksheet #15 Revision: 1
Date: July 2008
Quality Assurance Project Plan Phase I RI Low Resolution Coring/Sediment Sampling Lower Passaic River Restoration Project Newark, New Jersey Page 6 of 41
QAPP Worksheet #15 (UFP-QAPP Manual Section 2.8.1) Data Quality Levels and Analytical Method Evaluation
J:\Water\ProjectFiles\P120\12182_Passaic\QAPP\Rev 1_July 2008\2008_Low Res Core QAPP_2008 July 18_Rev1_worksheet1-19.doc
Analytical Methodd Achievable Laboratory
Limitse
Analyte CAS Number DQL
(mg/kg)a
Sediment RL from 2005
QAPP (mg/kg)b
Project QL Goal
(mg/kg)c MDLs
(mg/kg)
Method QLs
(mg/kg) EDLsg
(mg/kg) QLs
(mg/kg) PCB 56 41464-43-1 0.0227 See abovef See abovef 0.000010 0.000020 0.000000620 0.000010 PCB 57 70424-67-8 0.0227 See abovef See abovef 0.000012 0.000050 0.000000640 0.000010 PCB 58 41464-49-7 0.0227 See abovef See abovef 0.000013 0.000050 0.000000600 0.000010
PCB 59/PCB 62/PCB 75
74472-33-6/ 54230-22-7/ 32598-12-2 0.0227 See abovef See abovef
0.0000060 0.000020 0.000000590 0.000010
PCB 60 33025-41-1 0.0227 See abovef See abovef 0.000013 0.000050 0.00000108 0.000010
PCB 61/PCB 70/PCB 74/ PCB 76
33284-53-6/ 32598-11-1/ 32690-93-0/ 70362-48-0 0.0227 See abovef See abovef
0.000017 0.000050 0.000000636 0.000020
PCB 63 74472-34-7 0.0227 See abovef See abovef 0.000014 0.000050 0.000000567 0.000010 PCB 64 52663-58-8 0.0227 See abovef See abovef 0.0000070 0.000020 0.000000578 0.000010 PCB 66 32598-10-0 0.0227 See abovef See abovef 0.000016 0.000050 0.000000589 0.000010 PCB 67 73575-53-8 0.0227 See abovef See abovef 0.000015 0.000050 0.000000588 0.000010 PCB 68 73575-52-7 0.0227 See abovef See abovef 0.000015 0.000050 0.000000572 0.000010 PCB 72 41464-42-0 0.0227 See abovef See abovef 0.000016 0.000050 0.000000605 0.000010 PCB 77 32598-13-3 0.0227 See abovef See abovef 0.000017 0.000050 0.000000628 0.000010 PCB 78 70362-49-1 0.0227 See abovef See abovef 0.000017 0.000050 0.000000644 0.000010 PCB 79 41464-48-6 0.0227 See abovef See abovef 0.000017 0.000050 0.000000552 0.000010 PCB 80 33284-52-5 0.0227 See abovef See abovef 0.000018 0.000050 0.000000538 0.000010 PCB 81 70362-50-4 0.0227 See abovef See abovef 0.000018 0.000050 0.000000582 0.000010 PCB 82 52663-62-4 0.0227 See abovef See abovef 0.000013 0.000050 0.00000132 0.000010 PCB 83 60145-20-2 0.0227 See abovef See abovef 0.000022 0.000050 0.00000103 0.000010 PCB 84 52663-60-2 0.0227 See abovef See abovef 0.000012 0.000050 0.00000118 0.000010

Section: Worksheet #15 Revision: 1
Date: July 2008
Quality Assurance Project Plan Phase I RI Low Resolution Coring/Sediment Sampling Lower Passaic River Restoration Project Newark, New Jersey Page 7 of 41
QAPP Worksheet #15 (UFP-QAPP Manual Section 2.8.1) Data Quality Levels and Analytical Method Evaluation
J:\Water\ProjectFiles\P120\12182_Passaic\QAPP\Rev 1_July 2008\2008_Low Res Core QAPP_2008 July 18_Rev1_worksheet1-19.doc
Analytical Methodd Achievable Laboratory
Limitse
Analyte CAS Number DQL
(mg/kg)a
Sediment RL from 2005
QAPP (mg/kg)b
Project QL Goal
(mg/kg)c MDLs
(mg/kg)
Method QLs
(mg/kg) EDLsg
(mg/kg) QLs
(mg/kg)
PCB 85/PCB 116/PCB 117
65510-45-4/ 18259-05-7/ 68194-11-6 0.0227 See abovef See abovef
0.000010 0.000020 0.000000817 0.000010
PCB 86/PCB 87/PCB 97/PCB 109/PCB 119/PCB 125
55312-69-1/ 38380-02-8/ 41464-51-1/ 74472-35-8/ 56558-17-9/ 74472-39-2 0.0227 See abovef See abovef
0.000015 0.000050 0.000000827 0.000010
PCB 88/PCB 91 55215-17-3/ 68194-05-8
0.0227 See abovef See abovef
0.000012 0.000050 0.00000110 0.000010
PCB 89 73575-57-2 0.0227 See abovef See abovef 0.000019 0.000050 0.00000112 0.000010
PCB 90/PCB 101/PCB 113
68194-07-0/ 37680-73-2/ 68194-10-5
0.0227
See abovef See abovef
0.000024 0.000100 0.000000809 0.000010
PCB 92 52663-61-3 0.0227 See abovef See abovef 0.000012 0.000050 0.00000103 0.000010
PCB 93/PCB 100 73575-56-1/ 39485-83-1 0.0227 See abovef See abovef
0.000022 0.000050 0.00000113 0.000010
PCB 94 73575-55-0 0.0227 See abovef See abovef 0.000012 0.000050 0.00000114 0.000010 PCB 95 38379-99-6 0.0227 See abovef See abovef 0.000022 0.000050 0.000000934 0.000010 PCB 96 73575-54-9 0.0227 See abovef See abovef 0.000021 0.000050 0.000000788 0.000010
PCB 98/PCB 102 60233-25-2/ 68194-06-9 0.0227 See abovef See abovef
0.000022 0.000050 0.000000972 0.000010
PCB 99/PCB 112 38380-01-7/ 74472-36-9 0.0227 See abovef See abovef
0.000022 0.000050 0.00000103 0.000010
PCB 103 60145-21-3 0.0227 See abovef See abovef 0.000023 0.000050 0.000000924 0.000010 PCB 104 56558-16-8 0.0227 See abovef See abovef 0.000023 0.000050 0.000000696 0.000010

Section: Worksheet #15 Revision: 1
Date: July 2008
Quality Assurance Project Plan Phase I RI Low Resolution Coring/Sediment Sampling Lower Passaic River Restoration Project Newark, New Jersey Page 8 of 41
QAPP Worksheet #15 (UFP-QAPP Manual Section 2.8.1) Data Quality Levels and Analytical Method Evaluation
J:\Water\ProjectFiles\P120\12182_Passaic\QAPP\Rev 1_July 2008\2008_Low Res Core QAPP_2008 July 18_Rev1_worksheet1-19.doc
Analytical Methodd Achievable Laboratory
Limitse
Analyte CAS Number DQL
(mg/kg)a
Sediment RL from 2005
QAPP (mg/kg)b
Project QL Goal
(mg/kg)c MDLs
(mg/kg)
Method QLs
(mg/kg) EDLsg
(mg/kg) QLs
(mg/kg) PCB 105 32598-14-4 0.0227 See abovef See abovef 0.000011 0.000002 0.000000495 0.000010 PCB 106 70424-69-0 0.0227 See abovef See abovef 0.000014 0.000050 0.000000562 0.000010 PCB 107 70424-68-9 0.0227 See abovef See abovef 0.000027 0.00010 0.000000547 0.000010
PCB 108/PCB 124 70362-41-3/ 70424-70-3 0.0227 See abovef See abovef
0.000015 0.000050 0.000000524 0.000010
PCB 110/PCB 115 38380-03-9/ 74472-38-1 0.0227 See abovef See abovef
0.000024 0.00010 0.000000703 0.000010
PCB 111 39635-32-0 0.0227 See abovef See abovef 0.000024 0.00010 0.000000707 0.000010 PCB 114 74472-37-0 0.0227 See abovef See abovef 0.000012 0.000050 0.000000498 0.000010 PCB 118 31508-00-6 0.0227 See abovef See abovef 0.000019 0.000050 0.000000498 0.000010 PCB 120 68194-12-7 0.0227 See abovef See abovef 0.000015 0.000050 0.000000672 0.000010 PCB 121 56558-18-0 0.0227 See abovef See abovef 0.000021 0.000050 0.000000723 0.000010 PCB 122 76842-07-4 0.0227 See abovef See abovef 0.000012 0.000050 0.000000561 0.000010 PCB 123 65510-44-3 0.0227 See abovef See abovef 0.000015 0.000050 0.000000515 0.000010 PCB 126 57465-28-8 0.0227 See abovef See abovef 0.000014 0.000050 0.000000553 0.000010 PCB 127 39635-33-1 0.0227 See abovef See abovef 0.000028 0.00010 0.000000519 0.000010
PCB 128/PCB 166 38380-07-3/ 41411-63-6 0.0227 See abovef See abovef
0.000012 0.000050 0.00000112 0.000010
PCB 129/PCB 138/PCB 163
55215-18-4/ 35065-28-2/ 74472-44-9
0.0227 See abovef See abovef
0.000021 0.000050 0.000000939 0.000010
PCB 130 52663-66-8 0.0227 See abovef See abovef 0.000014 0.000050 0.00000122 0.000010 PCB 131 61798-70-7 0.0227 See abovef See abovef 0.000012 0.000050 0.00000122 0.000010 PCB 132 38380-05-1 0.0227 See abovef See abovef 0.000012 0.000050 0.00000122 0.000010 PCB 133 35694-04-3 0.0227 See abovef See abovef 0.000017 0.000050 0.00000113 0.000010

Section: Worksheet #15 Revision: 1
Date: July 2008
Quality Assurance Project Plan Phase I RI Low Resolution Coring/Sediment Sampling Lower Passaic River Restoration Project Newark, New Jersey Page 9 of 41
QAPP Worksheet #15 (UFP-QAPP Manual Section 2.8.1) Data Quality Levels and Analytical Method Evaluation
J:\Water\ProjectFiles\P120\12182_Passaic\QAPP\Rev 1_July 2008\2008_Low Res Core QAPP_2008 July 18_Rev1_worksheet1-19.doc
Analytical Methodd Achievable Laboratory
Limitse
Analyte CAS Number DQL
(mg/kg)a
Sediment RL from 2005
QAPP (mg/kg)b
Project QL Goal
(mg/kg)c MDLs
(mg/kg)
Method QLs
(mg/kg) EDLsg
(mg/kg) QLs
(mg/kg)
PCB 134/PCB 143 52704-70-8/ 68194-15-0 0.0227 See abovef See abovef
0.000013 0.000050 0.00000122 0.000010
PCB 135/PCB 151 52744-13-5/ 52663-63-5 0.0227 See abovef See abovef
0.000011 0.000050 0.00000114 0.000010
PCB 136 38411-22-2 0.0227 See abovef See abovef 0.0000090 0.000020 0.000000917 0.000010
PCB 137/PCB 164 35694-06-5/ 74472-45-0 0.0227 See abovef See abovef
0.000030/ 0.000014
0.00010/ 0.000050
0.00000103 0.000010
PCB 139/PCB 140 56030-56-9/ 59291-64-4 0.0227 See abovef See abovef
0.000020 0.000050 0.00000101 0.000010
PCB 141 52712-04-6 0.0227 See abovef See abovef 0.0000090 0.000020 0.00000115 0.000010 PCB 142 41411-61-4 0.0227 See abovef See abovef 0.000031 0.00010 0.00000118 0.000010 PCB 144 68194-14-9 0.0227 See abovef See abovef 0.000017 0.000050 0.00000117 0.000010 PCB 145 74472-40-5 0.0227 See abovef See abovef 0.000032 0.00010 0.000000871 0.000010 PCB 146 51908-16-8 0.0227 See abovef See abovef 0.000018 0.000050 0.000000992 0.000010
PCB 147/PCB 149 68194-13-8/ 38380-04-0 0.0227 See abovef See abovef
0.000018 0.000050 0.00000101 0.000010
PCB 148 74472-41-6 0.0227 See abovef See abovef 0.000032 0.00010 0.00000119 0.000010 PCB 150 68194-08-1 0.0227 See abovef See abovef 0.000033 0.00010 0.000000860 0.000010 PCB 152 68194-09-2 0.0227 See abovef See abovef 0.0000240 0.00010 0.000000866 0.000010
PCB 153/PCB 168 35065-27-1/ 59291-65-5 0.0227 See abovef See abovef
0.000013 0.000050 0.000000811 0.000010
PCB 154 60145-22-4 0.0227 See abovef See abovef 0.000011 0.000050 0.00000113 0.000010 PCB 155 33979-03-2 0.0227 See abovef See abovef 0.000034 0.00010 0.000000795 0.000010
PCB 156/PCB 157 38380-08-4/ 69782-90-7 0.0227 See abovef See abovef
0.000013 0.000050 0.00000101 0.000010
PCB 158 74472-42-7 0.0227 See abovef See abovef 0.000011 0.000020 0.000000727 0.000010

Section: Worksheet #15 Revision: 1
Date: July 2008
Quality Assurance Project Plan Phase I RI Low Resolution Coring/Sediment Sampling Lower Passaic River Restoration Project Newark, New Jersey Page 10 of 41
QAPP Worksheet #15 (UFP-QAPP Manual Section 2.8.1) Data Quality Levels and Analytical Method Evaluation
J:\Water\ProjectFiles\P120\12182_Passaic\QAPP\Rev 1_July 2008\2008_Low Res Core QAPP_2008 July 18_Rev1_worksheet1-19.doc
Analytical Methodd Achievable Laboratory
Limitse
Analyte CAS Number DQL
(mg/kg)a
Sediment RL from 2005
QAPP (mg/kg)b
Project QL Goal
(mg/kg)c MDLs
(mg/kg)
Method QLs
(mg/kg) EDLsg
(mg/kg) QLs
(mg/kg) PCB 159 39635-35-3 0.0227 See abovef See abovef 0.000035 0.00010 0.000000802 0.000010 PCB 160 41411-62-5 0.0227 See abovef See abovef 0.000021 0.000050 0.000000939 0.000010 PCB 161 74472-43-8 0.0227 See abovef See abovef 0.000035 0.00010 0.000000794 0.000010 PCB 162 39635-34-2 0.0227 See abovef See abovef 0.000035 0.00010 0.000000802 0.000010 PCB 165 74472-46-1 0.0227 See abovef See abovef 0.000036 0.00010 0.000000872 0.000010 PCB 167 52663-72-6 0.0227 See abovef See abovef 0.000011 0.000050 0.000000539 0.000010 PCB 169 32774-16-6 0.0227 See abovef See abovef 0.000016 0.000050 0.000000589 0.000010 PCB 170 35065-30-6 0.0227 See abovef See abovef 0.000016 0.000050 0.000000930 0.000010
PCB 171/PCB 173 52663-71-5/ 68194-16-1 0.0227 See abovef See abovef
0.000037 0.00010 0.000000945 0.000010
PCB 172 52663-74-8 0.0227 See abovef See abovef 0.000038 0.00010 0.000000941 0.000010 PCB 174 38411-25-5 0.0227 See abovef See abovef 0.000019 0.000050 0.000000854 0.000010 PCB 175 40186-70-7 0.0227 See abovef See abovef 0.000038 0.00010 0.000000856 0.000010 PCB 176 52663-65-7 0.0227 See abovef See abovef 0.000039 0.00010 0.000000630 0.000010 PCB 177 52663-70-4 0.0227 See abovef See abovef 0.000014 0.000050 0.000000897 0.000010 PCB 178 52663-67-9 0.0227 See abovef See abovef 0.000022 0.000050 0.000000888 0.000010 PCB 179 52663-64-6 0.0227 See abovef See abovef 0.000023 0.000050 0.000000657 0.000010
PCB 180/PCB 193 35065-29-3/ 69782-91-8 0.0227 See abovef See abovef
0.000014 0.000050 0.000000696 0.000010
PCB 181 74472-47-2 0.0227 See abovef See abovef 0.000040 0.00010 0.000000809 0.000010 PCB 182 60145-23-5 0.0227 See abovef See abovef 0.000040 0.00010 0.000000811 0.000010
PCB 183/PCB 185 52663-69-1/ 52712-05-7 0.0227 See abovef See abovef
0.000040 0.00010 0.000000834 0.000010
PCB 184 74472-48-3 0.0227 See abovef See abovef 0.000040 0.00010 0.000000669 0.000010 PCB 186 74472-49-4 0.0227 See abovef See abovef 0.000041 0.00010 0.00000125 0.000010

Section: Worksheet #15 Revision: 1
Date: July 2008
Quality Assurance Project Plan Phase I RI Low Resolution Coring/Sediment Sampling Lower Passaic River Restoration Project Newark, New Jersey Page 11 of 41
QAPP Worksheet #15 (UFP-QAPP Manual Section 2.8.1) Data Quality Levels and Analytical Method Evaluation
J:\Water\ProjectFiles\P120\12182_Passaic\QAPP\Rev 1_July 2008\2008_Low Res Core QAPP_2008 July 18_Rev1_worksheet1-19.doc
Analytical Methodd Achievable Laboratory
Limitse
Analyte CAS Number DQL
(mg/kg)a
Sediment RL from 2005
QAPP (mg/kg)b
Project QL Goal
(mg/kg)c MDLs
(mg/kg)
Method QLs
(mg/kg) EDLsg
(mg/kg) QLs
(mg/kg) PCB 187 52663-68-0 0.0227 See abovef See abovef 0.000019 0.000050 0.000000650 0.000010 PCB 188 74487-85-7 0.0227 See abovef See abovef 0.000023 0.000050 0.000000616 0.000010 PCB 189 39635-31-9 0.0227 See abovef See abovef 0.000018 0.000050 0.000000503 0.000010 PCB 190 41411-64-7 0.0227 See abovef See abovef 0.000023 0.000050 0.000000630 0.000010 PCB 191 74472-50-7 0.0227 See abovef See abovef 0.000042 0.00010 0.000000641 0.000010 PCB 192 74472-51-8 0.0227 See abovef See abovef 0.000042 0.00010 0.000000688 0.000010 PCB 194 35694-08-7 0.0227 See abovef See abovef 0.000017 0.000050 0.000000797 0.000010 PCB 195 52663-78-2 0.0227 See abovef See abovef 0.000043 0.000100 0.000000876 0.000010 PCB 196 42740-50-1 0.0227 See abovef See abovef 0.000043 0.000100 0.00000101 0.000010
PCB 197/PCB 200 33091-17-7/ 52663-73-7 0.0227 See abovef See abovef
0.000025 0.00010 0.000000712 0.000010
PCB 198/PCB 199 68194-17-2/ 52663-75-9 0.0227 See abovef See abovef
0.000025 0.00010 0.00000100 0.000010
PCB 201 40186-71-8 0.0227 See abovef See abovef 0.000044 0.00010 0.00000100 0.000010 PCB 202 2136-99-4 0.0227 See abovef See abovef 0.000044 0.00010 0.000000762 0.000010 PCB 203 52663-76-0 0.0227 See abovef See abovef 0.000044 0.00010 0.000000885 0.000010 PCB 204 74472-52-9 0.0227 See abovef See abovef 0.000045 0.00010 0.000000731 0.000010 PCB 205 74472-53-0 0.0227 See abovef See abovef 0.000045 0.00010 0.000000643 0.000010 PCB 206 40186-72-9 0.0227 See abovef See abovef 0.000045 0.00010 0.00000103 0.000010 PCB 207 52663-79-3 0.0227 See abovef See abovef 0.000045 0.00010 0.000000698 0.000010 PCB 208 52663-77-1 0.0227 See abovef See abovef 0.000046 0.00010 0.000000707 0.000010 PCB 209 2051-24-3 0.0227 See abovef See abovef 0.000015 0.000050 0.00000104 0.000010

Section: Worksheet #15 Revision: 1
Date: July 2008
Quality Assurance Project Plan Phase I RI Low Resolution Coring/Sediment Sampling Lower Passaic River Restoration Project Newark, New Jersey Page 12 of 41
QAPP Worksheet #15 (UFP-QAPP Manual Section 2.8.1) Data Quality Levels and Analytical Method Evaluation
J:\Water\ProjectFiles\P120\12182_Passaic\QAPP\Rev 1_July 2008\2008_Low Res Core QAPP_2008 July 18_Rev1_worksheet1-19.doc
Note: Bold indicates chemicals for which the achievable laboratory limits exceed the project QL goal. a DQLs based on the lower of : 1) NJDEP Residential Direct Contact Cleanup Criteria, May 1999, 2) USEPA Region 9 Preliminary Remediation Goals (PRGs) for
Residential Soil, October 2004, and 3) applicable ecological thresholds based on No observable adverse effects level (NOAELs), Toxicity reference value (TRVs), Apparent effects threshold (AETs), Effects range-low (ER-Ls) and Threshold effects level (TELs). DQLs are analytical goals listed solely for the purpose of evaluating laboratory analytical methods and achievable laboratory limits; these are not project-specific screening levels or PRGs and are not approved by the USEPA as the appropriate risk assessment criteria for this project. These values will be developed in subsequent phases of the project.
b RLs were taken from Tables 2-1 through 2-21 (MPI QAPP, Lower Passaic River Restoration Project, August 2005). c The project QL goal is selected as the lower of the DQL and the Sediment RL. d Analytical MDLs and QLs are those documented in validated methods. e Achievable estimated detection limits (EDLs) (derived from average method blank EDLs) and QLs are limits that an individual laboratory can achieve when
performing a specific analytical method and are typically based on wet weight. Actual EDLs and QLs will vary based on percent moisture and other sample-specific factors. Individual congener reporting limits will be based on sample specific estimated detection limits (EDLs) rather than QLs. Where possible, the laboratory will increase sample weight to adjust for sample-specific moisture content, thereby, attaining the EDLs and QLs listed in Worksheet #15.
f Sediment RL from 2005 QAPP is listed as 2.00E-07 to 2.00-E06 for individual congeners PCB-1 through PCB-209. Note that the reference value of 2.00E-06 was used for comparing achievable laboratory limits to the project quantitation limit goal.

Section: Worksheet #15 Revision: 1
Date: July 2008
Quality Assurance Project Plan Phase I RI Low Resolution Coring/Sediment Sampling Lower Passaic River Restoration Project Newark, New Jersey Page 13 of 41
QAPP Worksheet #15 (UFP-QAPP Manual Section 2.8.1) Data Quality Levels and Analytical Method Evaluation
J:\Water\ProjectFiles\P120\12182_Passaic\QAPP\Rev 1_July 2008\2008_Low Res Core QAPP_2008 July 18_Rev1_worksheet1-19.doc
Matrix: Sediment Analytical Group: Dioxin/Furan; Method 1613B; Columbia Analytical Services, Houston Concentration Level: Low
Analytical Methodd Achievable Laboratory
Limitse
Analyte CAS
Number DQL
(mg/kg)a
Sediment RL from 2005
QAPPb
Project QL Goal
(mg/kg)c MDLs
(mg/kg) Method QLs
(mg/kg) EDLs
(mg/kg) QLs
(mg/kg) 1,2,3,4,6,7,8-HPCDD 35822-46-9 0.00039 0.0000025 0.0000025 NA 0.0000050 0.00000026 0.0000025 1,2,3,4,6,7,8-HPCDF 67562-39-4 0.00039 0.0000025 0.0000025 NA 0.0000050 0.00000022 0.0000025 1,2,3,4,7,8-HxCDD 39227-28-6 0.000039 0.0000025 0.0000025 NA 0.0000050 0.00000019 0.0000025 1,2,3,4,7,8-HXCDF 70648-26-9 0.000039 0.0000025 0.0000025 NA 0.0000050 0.000000090 0.0000025 1,2,3,4,7,8,9-HPCDF 55673-89-7 0.00039 0.0000025 0.0000025 NA 0.0000050 0.00000035 0.0000025 1,2,3,6,7,8-HxCDD 57653-85-7 0.000039 0.0000025 0.0000025 NA 0.0000050 0.00000019 0.0000025 1,2,3,6,7,8-HXCDF 57117-44-9 0.000039 0.0000025 0.0000025 NA 0.0000050 0.00000010 0.0000025 1,2,3,7,8,9-HxCDD 19408-74-3 0.000039 0.0000025 0.0000025 NA 0.0000050 0.00000019 0.0000025 1,2,3,7,8,9-HXCDF 72918-21-9 0.000039 0.0000025 0.0000025 NA 0.0000050 0.00000015 0.0000025 1,2,3,7,8-PeCDD 40321-76-4 0.0000039 0.0000025 0.0000025 NA 0.0000050 0.00000015 0.0000025 1,2,3,7,8-PECDF 57117-41-6 0.00013 0.0000025 0.0000025 NA 0.0000050 0.00000014 0.0000025 2,3,4,6,7,8-HXCDF 60851-34-5 0.000039 0.0000025 0.0000025 NA 0.0000050 0.00000011 0.0000025 2,3,4,7,8-PECDF 57117-31-4 0.000013 0.0000025 0.0000025 NA 0.0000050 0.00000016 0.0000025 2,3,7,8-TCDD 1746-01-6 0.0000036 0.00000050 0.00000050 NA 0.0000010 0.00000017 0.0000010 2,3,7,8-TCDF 51207-31-9 0.000039 0.00000050 0.00000050 NA 0.0000010 0.00000012 0.0000010 OCDD 3268-87-9 0.013 0.0000050 0.0000050 NA 0.000010 0.00000059 0.0000050 OCDF 39001-02-0 0.013 0.0000050 0.0000050 NA 0.000010 0.00000057 0.0000050

Section: Worksheet #15 Revision: 1
Date: July 2008
Quality Assurance Project Plan Phase I RI Low Resolution Coring/Sediment Sampling Lower Passaic River Restoration Project Newark, New Jersey Page 14 of 41
QAPP Worksheet #15 (UFP-QAPP Manual Section 2.8.1) Data Quality Levels and Analytical Method Evaluation
J:\Water\ProjectFiles\P120\12182_Passaic\QAPP\Rev 1_July 2008\2008_Low Res Core QAPP_2008 July 18_Rev1_worksheet1-19.doc
Note: Bold indicates chemicals for which the achievable laboratory limits exceed the project QL goal. a DQLs based on the lower of : 1) NJDEP Residential Direct Contact Cleanup Criteria, May 1999, 2) USEPA Region 9 Preliminary Remediation Goals (PRGs) for
Residential Soil, October 2004, and 3) applicable ecological thresholds based on No observable adverse effects level (NOAELs), Toxicity reference value (TRVs), Apparent effects threshold (AETs), Effects range-low (ER-Ls) and Threshold effects level (TELs). DQLs are analytical goals listed solely for the purpose of evaluating laboratory analytical methods and achievable laboratory limits; these are not project-specific screening levels or PRGs and are not approved by the USEPA as the appropriate risk assessment criteria for this project. These values will be developed in subsequent phases of the project.
b RLs were taken from Tables 2-1 through 2-21 (MPI QAPP, Lower Passaic River Restoration Project, August 2005). c The project QL goal is selected as the lower of the DQL and the Sediment RL. d Analytical MDLs and QLs are those documented in validated methods. e Achievable EDLs ( based on averaged clean matrix EDLs) and QLs are limits that an individual laboratory can achieve when performing a specific analytical
method. Actual EDLs and QLs will vary based on percent moisture and other sample-specific factors. For dioxins/furans, the EDL and QL are based on extraction of 10 grams/sample. The laboratory reporting limit will be based on the sample specific EDL. Matrix interference can increase EDLs by as much as a factor of 10x.

Section: Worksheet #15 Revision: 1
Date: July 2008
Quality Assurance Project Plan Phase I RI Low Resolution Coring/Sediment Sampling Lower Passaic River Restoration Project Newark, New Jersey Page 15 of 41
QAPP Worksheet #15 (UFP-QAPP Manual Section 2.8.1) Data Quality Levels and Analytical Method Evaluation
J:\Water\ProjectFiles\P120\12182_Passaic\QAPP\Rev 1_July 2008\2008_Low Res Core QAPP_2008 July 18_Rev1_worksheet1-19.doc
Matrix: Sediment Analytical Group: Organochlorine Pesticides; Method 8081A; Test America, Knoxville, TN Concentration Level: Low
Analytical Methodd Achievable Laboratory
Limitse
Analyte CAS Number DQL
(mg/kg)a
Sediment RL from 2005
QAPP (mg/kg)b
Project QL Goal
(mg/kg)c MDLs
(mg/kg) Method QLs
(mg/kg) MDLs
(mg/kg) QLs
(mg/kg) 2,4'-DDDf 53-19-0 0.00200 0.00020 0.00020 NA NA 0.000027 0.00020 2,4'-DDEf 3424-82-6 0.00142 0.00020 0.00020 NA NA 0.000029 0.00020 2,4'-DDTf 789-02-6 0.00100 0.00020 0.00020 NA NA 0.0000301 0.00020 4,4'-DDD 72-54-8 0.00200 0.00020 0.00020 NA NA 0.000025 0.00020 4,4'-DDE 72-55-9 0.00142 0.00020 0.00020 NA NA 0.000026 0.00020 4,4'-DDT 50-29-3 0.00100 0.00020 0.00020 NA NA 0.000026 0.00020 Aldrin 309-00-2 0.00200 0.00020 0.00020 NA NA 0.000037 0.00020 alpha-Benzene hexachloride (BHC) 319-84-6
0.000940 0.00020 0.00020 NA NA 0.000026 0.00020
beta-BHC 319-85-7 0.000940 0.00020 0.00020 NA NA 0.000027 0.00020
cis-Chlordane 5103-71-9 0.0000200 0.00020 0.000020 NA NA 0.000022 0.00020
cis-Nonachlor 5103-73-1 0.0000200 NA 0.000020 NA NA 0.000029 0.00020 delta-BHC 319-86-8 0.000940 0.00020 0.00020 NA NA 0.000041 0.00020 Dieldrin 60-57-1 0.0000200 0.00020 0.000020 NA NA 0.000028 0.00020 Endosulfan I 959-98-8 0.0000400 0.00020 0.000040 NA NA 0.000027 0.00020 Endosufan II 33213-65-9 0.0000400 0.00020 0.000040 NA NA 0.000025 0.00020 Endosulfan sulfate 1031-07-8 36.7 0.00020 0.00020 NA NA 0.000027 0.00020 Endrin 72-20-8 0.00267 0.00020 0.00020 NA NA 0.000034 0.00020 Endrin aldehyde 7421-93-4 0.00267 0.00020 0.00020 NA NA 0.000025 0.00020 Endrin ketone 53494-70-5 0.00267 0.00020 0.00020 NA NA 0.000023 0.00020 gamma-BHC (Lindane) 58-89-9 0.000940 0.00020 0.00020 NA NA 0.000050 0.00020

Section: Worksheet #15 Revision: 1
Date: July 2008
Quality Assurance Project Plan Phase I RI Low Resolution Coring/Sediment Sampling Lower Passaic River Restoration Project Newark, New Jersey Page 16 of 41
QAPP Worksheet #15 (UFP-QAPP Manual Section 2.8.1) Data Quality Levels and Analytical Method Evaluation
J:\Water\ProjectFiles\P120\12182_Passaic\QAPP\Rev 1_July 2008\2008_Low Res Core QAPP_2008 July 18_Rev1_worksheet1-19.doc
Analytical Methodd Achievable Laboratory
Limitse
Analyte CAS Number DQL
(mg/kg)a
Sediment RL from 2005
QAPP (mg/kg)b
Project QL Goal
(mg/kg)c MDLs
(mg/kg) Method QLs
(mg/kg) MDLs
(mg/kg) QLs
(mg/kg)
Hexachlorobenzene 118-74-1 0.00200 0.0020 0.0020 NA NA 0.000030 0.00020 Heptachlor 76-44-8 0.00060 2.00E-04 0.00020 NA NA 0.000028 0.00020 Heptachlor epoxide 1024-57-3 0.00060 2.00E-04 0.00020 NA NA 0.000029 0.00020 Methoxychlor 72-43-5 0.0060 3.00E-04 0.00030 NA NA 0.000030 0.00020 Oxychlordane 27304-13-8 0.000020 NA 0.000020 NA NA 0.000028 0.00020 Toxaphene 8001-35-2 0.00010 1.70E-02 0.00010 NA NA 0.0050 0.0050 trans-Chlordane 5103-74-2 0.000020 NA 0.000020 NA NA 0.000050 0.00020 trans-Nonachlor 3734-49-4 0.000020 NA 0.000020 NA NA 0.000025 0.00020 Note: Bold indicates chemicals for which the achievable laboratory limits exceed the project QL goal. a DQLs based on the lower of : 1) NJDEP Residential Direct Contact Cleanup Criteria, May 1999, 2) USEPA Region 9 Preliminary Remediation Goals (PRGs) for
Residential Soil, October 2004, and 3) applicable ecological thresholds based on No observable adverse effects level (NOAELs), Toxicity reference value (TRVs), Apparent effects threshold (AETs), Effects range-low (ER-Ls) and Threshold effects level (TELs). DQLs are analytical goals listed solely for the purpose of evaluating laboratory analytical methods and achievable laboratory limits; these are not project-specific screening levels or PRGs and are not approved by the USEPA as the appropriate risk assessment criteria for this project. These values will be developed in subsequent phases of the project.
b RLs were taken from Tables 2-1 through 2-21 (MPI QAPP, Lower Passaic River Restoration Project, August 2005). c The project QL goal is selected as the lower of the DQL and the Sediment RL. d Analytical MDLs and QLs are those documented in validated methods. e Achievable MDLs and QLs are limits that an individual laboratory can achieve when performing a specific analytical method and are typically based on wet
weight. Actual MDLs and QLs will vary based on percent moisture and other sample-specific factors. Where possible, the laboratory will increase sample weight to adjust for sample-specific moisture content, thereby, attaining the MDLs and QLs listed in Worksheet #15.
f Dichlordiphenyldichloroethane Dichlordiphenyldichloroethylene Dichlordiphenyltrichloroethane

Section: Worksheet #15 Revision: 1
Date: July 2008
Quality Assurance Project Plan Phase I RI Low Resolution Coring/Sediment Sampling Lower Passaic River Restoration Project Newark, New Jersey Page 17 of 41
QAPP Worksheet #15 (UFP-QAPP Manual Section 2.8.1) Data Quality Levels and Analytical Method Evaluation
J:\Water\ProjectFiles\P120\12182_Passaic\QAPP\Rev 1_July 2008\2008_Low Res Core QAPP_2008 July 18_Rev1_worksheet1-19.doc
Matrix: Sediment Analytical Group: Organochlorine Pesticides; HRGC/HRMS Method (based on USEPA Methods 1613B, 1668, 8081A and New York State Department of Environmental Conservation [NYSDEC] HRMS-2) TestAmerica, West Sacramento, CA Concentration Level: Low
Analytical Methodd Achievable Laboratory
Limitse
Analyte CAS Number DQL
(mg/kg)a
Sediment RL from 2005
QAPP (mg/kg)b
Project QL Goal
(mg/kg)c MDLs
(mg/kg) Method QLs
(mg/kg) MDLs
(mg/kg) QLs
(mg/kg) 2,4'-DDD 53-19-0 0.00200 0.00020 0.00020 NA NA 0.00000272 0.000040 2,4'-DDE 3424-82-6 0.00142 0.00020 0.00020 NA NA 0.00000397 0.000040 2,4'-DDT 789-02-6 0.00100 0.00020 0.00020 NA NA 0.00000364 0.000040 4,4'-DDD 72-54-8 0.00200 0.00020 0.00020 NA NA 0.000000472 0.000040 4,4'-DDE 72-55-9 0.00142 0.00020 0.00020 NA NA 0.00000419 0.000040 4,4'-DDT 50-29-3 0.00100 0.00020 0.00020 NA NA 0.0000110 0.000040 Aldrin 309-00-2 0.00200 0.00020 0.00020 NA NA 0.00000207 0.000040 alpha-BHC 319-84-6 0.000940 0.00020 0.00020 NA NA 0.00000610 0.000040 beta-BHC 319-85-7 0.000940 0.00020 0.00020 NA NA 0.00003373 0.000040 cis-Chlordane 5103-71-9 0.0000200 0.00020 0.000020 NA NA 0.00000358 0.000040 cis-Nonachlor 5103-73-1 0.0000200 NA 0.000020 NA NA 0.00000547 0.000040 delta-BHC 319-86-8 0.000940 0.00020 0.00020 NA NA 0.0000127 0.000040 Dieldrin 60-57-1 0.0000200 0.00020 0.000020 NA NA 0.00000706 0.000040 Endosulfan I 959-98-8 0.0000400 0.00020 0.000040 NA NA 0.0000257 0.000040 Endosufan II 33213-65-9 0.0000400 0.00020 0.000040 NA NA 0.00000823 0.000040 Endosulfan sulfate 1031-07-8 36.7 0.00020 0.00020 NA NA 0.00000350 0.000040 Endrin 72-20-8 0.00267 0.00020 0.00020 NA NA 0.00000380 0.000040 Endrin aldehyde 7421-93-4 0.00267 0.00020 0.00020 NA NA 0.00000858 0.000040 Endrin ketone 53494-70-5 0.00267 0.00020 0.00020 NA NA 0.00000795 0.000040 gamma-BHC (Lindane) 58-89-9 0.000940 0.00020 0.00020 NA NA 0.00000366 0.000040 Hexachlorobenzene 118-74-1 0.00200 0.0020 0.0020 NA NA 0.00000299 0.000040

Section: Worksheet #15 Revision: 1
Date: July 2008
Quality Assurance Project Plan Phase I RI Low Resolution Coring/Sediment Sampling Lower Passaic River Restoration Project Newark, New Jersey Page 18 of 41
QAPP Worksheet #15 (UFP-QAPP Manual Section 2.8.1) Data Quality Levels and Analytical Method Evaluation
J:\Water\ProjectFiles\P120\12182_Passaic\QAPP\Rev 1_July 2008\2008_Low Res Core QAPP_2008 July 18_Rev1_worksheet1-19.doc
Analytical Methodd Achievable Laboratory
Limitse
Analyte CAS Number DQL
(mg/kg)a
Sediment RL from 2005
QAPP (mg/kg)b
Project QL Goal
(mg/kg)c MDLs
(mg/kg) Method QLs
(mg/kg) MDLs
(mg/kg) QLs
(mg/kg) Heptachlor 76-44-8 0.000600 0.00020 0.00020 NA NA 0.00000198 0.000040 Heptachlor epoxide 1024-57-3 0.000600 0.00020 0.00020 NA NA 0.00000465 0.000040 Methoxychlor 72-43-5 0.00600 0.00030 0.00030 NA NA 0.00000341 0.000040 Oxychlordane 27304-13-8 0.0000200 NA 0.000020 NA NA 0.00000926 0.000040 Toxaphene 8001-35-2 0.000100 0.017 0.00010 NA NA 0.00250 0.010 trans-Chlordane 5103-74-2 0.0000200 NA 0.000020 NA NA 0.00000544 0.000040 trans-Nonachlor 3734-49-4 0.0000200 NA 0.000020 NA NA 0.00000379 0.000040 a DQLs based on the lower of : 1) NJDEP Residential Direct Contact Cleanup Criteria, May 1999, 2) USEPA Region 9 Preliminary Remediation Goals (PRGs) for
Residential Soil, October 2004, and 3) applicable ecological thresholds based on No observable adverse effects level (NOAELs), Toxicity reference value (TRVs), Apparent effects threshold (AETs), Effects range-low (ER-Ls) and Threshold effects level (TELs). DQLs are analytical goals listed solely for the purpose of evaluating laboratory analytical methods and achievable laboratory limits; these are not project-specific screening levels or PRGs and are not approved by the USEPA as the appropriate risk assessment criteria for this project. These values will be developed in subsequent phases of the project.
b RLs were taken from Tables 2-1 through 2-21 (MPI QAPP, Lower Passaic River Restoration Project, August 2005). c The project QL goal is selected as the lower of the DQL and the Sediment RL. d Analytical MDLs and QLs are those documented in validated methods. e Achievable MDLs and QLs are limits that an individual laboratory can achieve when performing a specific analytical method and are typically based on wet
weight. Actual MDLs and QLs will vary based on percent moisture and other sample-specific factors. The actual reporting limit will be theEDL rather than the QL. Where possible, the laboratory will increase sample weight to adjust for sample-specific moisture content, thereby, attaining the MDLs and QLs listed in Worksheet #15.

Section: Worksheet #15 Revision: 1
Date: July 2008
Quality Assurance Project Plan Phase I RI Low Resolution Coring/Sediment Sampling Lower Passaic River Restoration Project Newark, New Jersey Page 19 of 41
QAPP Worksheet #15 (UFP-QAPP Manual Section 2.8.1) Data Quality Levels and Analytical Method Evaluation
J:\Water\ProjectFiles\P120\12182_Passaic\QAPP\Rev 1_July 2008\2008_Low Res Core QAPP_2008 July 18_Rev1_worksheet1-19.doc
Matrix: Sediment Analytical Group: PAHs and Alkyl PAHs, Method KNOX-ID-0016, HRGC/LRMS-SIM, TestAmerica, Knoxville TN Concentration Level: Low
Analytical Methodd Achievable Laboratory
Limitse
Analyte CAS Number DQL
(mg/kg)a
Sediment RL from 2005
QAPP (mg/kg)b
Project QL Goal
(mg/kg)c MDLs
(mg/kg) Method QLs
(mg/kg) EDLs
(mg/kg) QLs
(mg/kg) 1-Methylnaphthalene 90-12-0 5.59 NA 5.59 NA NA 0.0000160 0.0050 1-Methylphenanthrene 832-69-9 2190 0.0033 0.0033 NA NA 0.0000321 0.0010 2,3,5-Trimethylnaphthalene 2245-38-7 NA 0.0033 0.0033 NA NA 0.0000288 0.0020 2,6-Dimethylnaphthalene 581-42-0 NA 0.0033 0.0033 NA NA 0.0000731 0.0020 2-Methylnaphthalene 91-57-6 0.0202 0.0033 0.0033 NA NA 0.0000101 0.010 Acenaphthene 83-32-9 0.00671 0.0033 0.0033 NA NA 0.0000462 0.0010 Acenaphthylene 208-96-8 0.00587 0.0033 0.0033 NA NA 0.0000161 0.0010 Anthracene 120-12-7 0.0469 0.0033 0.0033 NA NA 0.0000278 0.0010 Fluorene 86-73-7 0.0190 0.0033 0.0033 NA NA 0.0000303 0.0010 Naphthalene 91-20-3 0.0346 0.0033 0.0033 NA NA 0.0000119 0.020 Phenanthrene 85-01-8 0.0419 0.0033 0.0033 NA NA 0.0000247 0.0010 Benzo[a]anthracene 56-55-3 0.0317 0.0033 0.0033 NA NA 0.0000134 0.0010 Benzo[a]pyrene 50-32-8 0.0319 0.0033 0.0033 NA NA 0.0000466 0.0010 Benzo[b]fluoranthene 205-99-2 0.621 0.0033 0.0033 NA NA 0.0000285 0.0010 Benzo[e]pyrene 192-97-2 232 0.0033 0.0033 NA NA 0.0000552 0.0010 Benzo[g,h,i]perylene 191-24-2 0.170 0.0033 0.0033 NA NA 0.0000213 0.0010 Benzo[j and k]fluoranthene 207-08-9 0.240 0.0033 0.0033 NA NA 0.0000337 0.0010 Chrysene 218-01-9 0.0571 0.0033 0.0033 NA NA 0.0000099 0.0010 Dibenzo[a,h]anthracene 53-70-3 0.00622 0.0033 0.0033 NA NA 0.0000216 0.0010 Dibenzothiophene 132-65-0 NA 0.0033 0.0033 NA NA NA 0.0010 Fluoranthene 206-44-0 0.111 0.0033 0.0033 NA NA 0.0000262 0.0010 Indeno[1,2,3-c,d]-pyrene 193-39-5 0.200 0.0033 0.0033 NA NA 0.0000209 0.0010

Section: Worksheet #15 Revision: 1
Date: July 2008
Quality Assurance Project Plan Phase I RI Low Resolution Coring/Sediment Sampling Lower Passaic River Restoration Project Newark, New Jersey Page 20 of 41
QAPP Worksheet #15 (UFP-QAPP Manual Section 2.8.1) Data Quality Levels and Analytical Method Evaluation
J:\Water\ProjectFiles\P120\12182_Passaic\QAPP\Rev 1_July 2008\2008_Low Res Core QAPP_2008 July 18_Rev1_worksheet1-19.doc
Analytical Methodd Achievable Laboratory
Limitse
Analyte CAS Number DQL
(mg/kg)a
Sediment RL from 2005
QAPP (mg/kg)b
Project QL Goal
(mg/kg)c MDLs
(mg/kg) Method QLs
(mg/kg) EDLs
(mg/kg) QLs
(mg/kg) Perylene 198-55-0 232 0.0033 0.0033 NA NA 0.000122 0.0010 Pyrene 129-00-0 0.0530 0.0033 0.0033 NA NA 0.0000262 0.0010 C2-Alkylnaphthalenes NA NA NA NA NA NA NA NA C3-Alkylnaphthalenes NA NA NA NA NA NA NA NA C1-Benzanthracene/chrysenes NA NA NA NA NA NA NA NA C1-Dibenzothiophenes NA NA NA NA NA NA NA NA C1-Fluorenes NA NA NA NA NA NA NA NA C1-Phenanthrene/anthracenes NA NA NA NA NA NA NA NA C1-Pyrene/fluoranthenes NA NA NA NA NA NA NA NA C2-Benzanthracene/chrysenes NA NA NA NA NA NA NA NA C2-Dibenzothiophenes NA NA NA NA NA NA NA NA C2-Fluorenes NA NA NA NA NA NA NA NA C2-Naphthalenes NA NA NA NA NA NA NA NA C2-Phenanthrene/anthracenes NA NA NA NA NA NA NA NA C3-Benzanthracene/chrysenes NA NA NA NA NA NA NA NA C3-Dibenzothiophenes NA NA NA NA NA NA NA NA C3-Fluorenes NA NA NA NA NA NA NA NA C3-Naphthalenes NA NA NA NA NA NA NA NA C3-Phenanthrene/anthracenes NA NA NA NA NA NA NA NA C4-Benzanthracene/chrysenes NA NA NA NA NA NA NA NA C4-Dibenzothiophenes NA NA NA NA NA NA NA NA C4-Naphthalenes NA NA NA NA NA NA NA NA C4-Phenanthrenes/anthracenes NA NA NA NA NA NA NA NA

Section: Worksheet #15 Revision: 1
Date: July 2008
Quality Assurance Project Plan Phase I RI Low Resolution Coring/Sediment Sampling Lower Passaic River Restoration Project Newark, New Jersey Page 21 of 41
QAPP Worksheet #15 (UFP-QAPP Manual Section 2.8.1) Data Quality Levels and Analytical Method Evaluation
J:\Water\ProjectFiles\P120\12182_Passaic\QAPP\Rev 1_July 2008\2008_Low Res Core QAPP_2008 July 18_Rev1_worksheet1-19.doc
Note: Bold indicates chemicals for which the achievable laboratory limits exceed the project QL goal.
a DQLs based on the lower of : 1) NJDEP Residential Direct Contact Cleanup Criteria, May 1999, 2) USEPA Region 9 Preliminary Remediation Goals (PRGs) for Residential Soil, October 2004, and 3) applicable ecological thresholds based on No observable adverse effects level (NOAELs), Toxicity reference value (TRVs), Apparent effects threshold (AETs), Effects range-low (ER-Ls) and Threshold effects level (TELs). DQLs are analytical goals listed solely for the purpose of evaluating laboratory analytical methods and achievable laboratory limits; these are not project-specific screening levels or PRGs and are not approved by the USEPA as the appropriate risk assessment criteria for this project. These values will be developed in subsequent phases of the project.
b RLs were taken from Tables 2-1 through 2-21 (MPI QAPP, Lower Passaic River Restoration Project, August 2005). c The project QL goal is selected as the lower of the DQL and the Sediment RL. d Analytical MDLs and QLs are those documented in validated reference methods. e Achievable EDLs (based on average blank EDL results) and QLs are limits that an individual laboratory can achieve when performing a specific analytical
method. Actual EDLs and QLs will vary based on percent moisture and other sample-specific factors. The actual reporting limit will be the EDL rather than the QL.
f Benzo[jkflouranthene will be reported by the laboratory with a “C” qualifier, indicating that it co-elutes with benzo[j]fluoranthere.

Section: Worksheet #15 Revision: 1
Date: July 2008
Quality Assurance Project Plan Phase I RI Low Resolution Coring/Sediment Sampling Lower Passaic River Restoration Project Newark, New Jersey Page 22 of 41
QAPP Worksheet #15 (UFP-QAPP Manual Section 2.8.1) Data Quality Levels and Analytical Method Evaluation
J:\Water\ProjectFiles\P120\12182_Passaic\QAPP\Rev 1_July 2008\2008_Low Res Core QAPP_2008 July 18_Rev1_worksheet1-19.doc
Matrix: Sediment Analytical Group: SVOCs; Method 8270C; Test America, Knoxville, TN Concentration Level: Low
Analytical Methodd Achievable Laboratory
Limitse
Analyte CAS
Number DQL
(mg/kg)a Sediment RL from 2005
QAPP (mg/kg)b
Project QL Goal
(mg/kg)c MDLs
(mg/kg) Method QLs
(mg/kg) MDLs
(mg/kg) QLs
(mg/kg) 1,1'-Biphenyl 4603-00-3 301 0.0033 0.0033 NA NA 0.0260 0.17 1,2,4,5-Tetrachlorobenzene 95-94-3
1.83 0.17 0.17 NA NA 0.0330 0.17
1,4-Dioxane 123-91-1 44.2 0.10 0.10 NA NA 0.0230 0.17 1-Methylnaphthalenef 90-12-0 5.59 0.17 0.17 NA NA 0.00380 0.0067 1-Methyl-phenanthrenef 832-69-9 2190 0.0033 0.0033 NA NA 0.00360 0.0067 2,2'-Oxybis (1-Chloropropane) 540-54-5
NA 0.17 0.17 NA 0.66 0.0350 0.17
2,3,4,6-Tetrachlorophenol 58-90-2 183 0.17 0.17 NA NA 0.152 0.33 2,3,5-Trimethylnaphthalenef 2245-38-7
NA 0.0033 0.0033 NA NA 0.00360 0.0067
2,4,5-Trichlorophenol 120-83-2 611 0.17 0.17 NA 0.66 0.0280 0.17 2,4,6-Trichlorophenol 105-67-9 0.610 0.17 0.17 NA 0.66 0.0260 0.17 2,4-Dichlorophenol 51-28-5 18.3 0.17 0.17 NA 0.66 0.0320 0.17 2,4-Dimethylphenol 121-14-2 122 0.17 0.17 NA 0.66 0.260 0.33 2,4-Dinitrophenol 4603-00-3 12.2 0.17 0.17 NA 3.3 0.330 0.83 2,4-Dinitrotoluene 95-94-3 1.00 0.17 0.17 NA 0.66 0.0340 0.17 2,6-Dimethylnaphthalenef 581-42-0 NA 0.0033 0.0033 NA NA 0.00320 0.0067 2,6-Dinitrotoluene 606-20-2 1.00 0.17 0.17 NA 0.66 0.0400 0.17 2-Chloronaphthalene 91-58-7 494 0.17 0.17 NA 0.66 0.0410 0.17 2-Chlorophenol 95-57-8 6.34 0.17 0.17 NA 0.66 0.0340 0.17 2-Methylnaphthalenef 91-57-6 0.0202 0.0033 0.0033 NA 0.66 0.0330 0.17 2-Methylphenol 95-48-7 306 0.17 0.17 NA 0.66 0.0370 0.17 2-Nitroaniline 88-74-4 18.30 0.17 0.17 NA 3.3 0.100 0.17

Section: Worksheet #15 Revision: 1
Date: July 2008
Quality Assurance Project Plan Phase I RI Low Resolution Coring/Sediment Sampling Lower Passaic River Restoration Project Newark, New Jersey Page 23 of 41
QAPP Worksheet #15 (UFP-QAPP Manual Section 2.8.1) Data Quality Levels and Analytical Method Evaluation
J:\Water\ProjectFiles\P120\12182_Passaic\QAPP\Rev 1_July 2008\2008_Low Res Core QAPP_2008 July 18_Rev1_worksheet1-19.doc
Analytical Methodd Achievable Laboratory
Limitse
Analyte CAS
Number DQL
(mg/kg)a Sediment RL from 2005
QAPP (mg/kg)b
Project QL Goal
(mg/kg)c MDLs
(mg/kg) Method QLs
(mg/kg) MDLs
(mg/kg) QLs
(mg/kg) 2-Nitrophenol 88-75-5 1830 0.17 0.17 NA 0.66 0.100 0.17 3,3',-Dichlorobenzidine 91-94-1 1.08 0.17 0.17 NA 1.3 0.200 0.33 3-Nitroaniline 99-09-2 1.83 0.33 0.33 NA 3.3 0.190 0.33 4,6-Dinitro-2-methylphenol 534-52-1 0.611 0.33 0.33 NA 3.3 0.330 0.33 4-Bromophenyl-phenylether 101-55-3
NA 0.17 0.17 NA 0.66 0.0470 0.17
4-Chloro-3-methylphenol 59-50-7 10000.00 0.17 0.17 NA 1.3 0.0350 0.17 4-Chloroaniline 106-47-8 24.4 0.17 0.17 NA 1.3 0.170 0.17 4-Chlorophenyl- phenyl ether 7005-72-3
NA 0.17 0.17 NA 0.66 0.0420 0.17
4-Methylphenol 106-44-5 30.6 0.17 0.17 NA 0.66 0.0720 0.17 4-Nitroaniline 100-01-6 23.2 0.33 0.33 NA NA 0.160 0.33 4-Nitrophenol 100-02-7 1830 0.17 0.17 NA 3.3 0.160 0.33 Acenaphthenef 98-86-2 0.0067 0.0033 0.0033 NA 0.66 0.0370 0.17 Acenaphthylenef 83-32-9 0.0059 0.0033 0.0033 NA 0.66 0.0380 0.17 Acetophenone 208-96-8 NA 0.17 0.17 NA NA 0.0410 0.17 Anthracenef 120-12-7 0.0469 0.003 0.0033 NA 0.66 0.0380 0.17 Atrazine 1912-24-9 2.19 0.17 0.17 NA NA 0.0300 0.17 Benzaldehyde 100-52-7 611 0.17 0.17 NA NA 0.0220 0.17 Benzo(a)anthracenef 56-55-3 0.0317 0.0033 0.0033 NA 0.66 0.0410 0.17 Benzo(a)pyrenef 50-32-8 0.0319 0.0033 0.0033 NA 0.66 0.0320 0.17 Benzo(b)fluoranthenef 205-99-2 0.621 0.0033 0.0033 NA 0.66 0.0450 0.17 Benzo(e)pyrenef 192-97-2 232 0.0033 0.0033 NA NA 0.0036 0.0067
Benzo(g,h,i)perylenef 191-24-2 0.170 0.0033 0.0033 NA 0.66 0.0390 0.17
Benzo(k)fluoranthenef, h 207-08-9 0.240 0.0033 0.0033 NA 0.66 0.0500 0.17
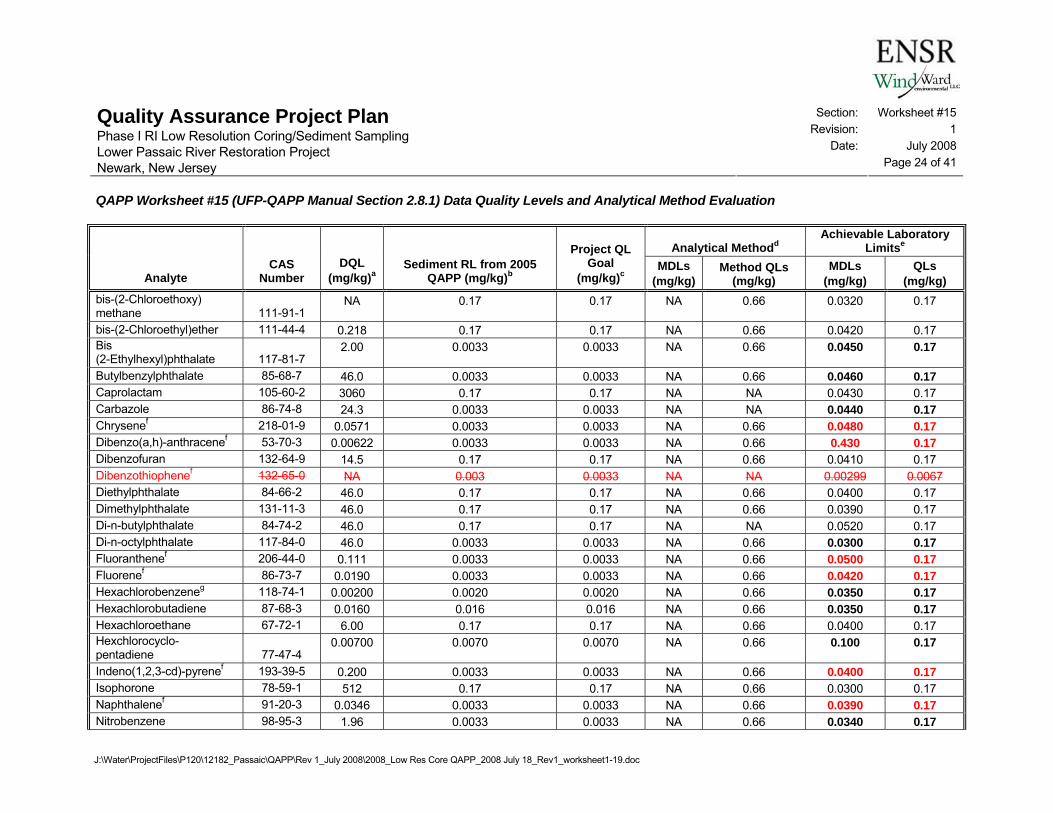
Section: Worksheet #15 Revision: 1
Date: July 2008
Quality Assurance Project Plan Phase I RI Low Resolution Coring/Sediment Sampling Lower Passaic River Restoration Project Newark, New Jersey Page 24 of 41
QAPP Worksheet #15 (UFP-QAPP Manual Section 2.8.1) Data Quality Levels and Analytical Method Evaluation
J:\Water\ProjectFiles\P120\12182_Passaic\QAPP\Rev 1_July 2008\2008_Low Res Core QAPP_2008 July 18_Rev1_worksheet1-19.doc
Analytical Methodd Achievable Laboratory
Limitse
Analyte CAS
Number DQL
(mg/kg)a Sediment RL from 2005
QAPP (mg/kg)b
Project QL Goal
(mg/kg)c MDLs
(mg/kg) Method QLs
(mg/kg) MDLs
(mg/kg) QLs
(mg/kg) bis-(2-Chloroethoxy) methane 111-91-1
NA 0.17 0.17 NA 0.66 0.0320 0.17
bis-(2-Chloroethyl)ether 111-44-4 0.218 0.17 0.17 NA 0.66 0.0420 0.17 Bis (2-Ethylhexyl)phthalate 117-81-7
2.00 0.0033 0.0033 NA 0.66 0.0450 0.17
Butylbenzylphthalate 85-68-7 46.0 0.0033 0.0033 NA 0.66 0.0460 0.17 Caprolactam 105-60-2 3060 0.17 0.17 NA NA 0.0430 0.17 Carbazole 86-74-8 24.3 0.0033 0.0033 NA NA 0.0440 0.17 Chrysenef 218-01-9 0.0571 0.0033 0.0033 NA 0.66 0.0480 0.17 Dibenzo(a,h)-anthracenef 53-70-3 0.00622 0.0033 0.0033 NA 0.66 0.430 0.17 Dibenzofuran 132-64-9 14.5 0.17 0.17 NA 0.66 0.0410 0.17 Dibenzothiophenef 132-65-0 NA 0.003 0.0033 NA NA 0.00299 0.0067 Diethylphthalate 84-66-2 46.0 0.17 0.17 NA 0.66 0.0400 0.17 Dimethylphthalate 131-11-3 46.0 0.17 0.17 NA 0.66 0.0390 0.17 Di-n-butylphthalate 84-74-2 46.0 0.17 0.17 NA NA 0.0520 0.17 Di-n-octylphthalate 117-84-0 46.0 0.0033 0.0033 NA 0.66 0.0300 0.17 Fluoranthenef 206-44-0 0.111 0.0033 0.0033 NA 0.66 0.0500 0.17 Fluorenef 86-73-7 0.0190 0.0033 0.0033 NA 0.66 0.0420 0.17 Hexachlorobenzeneg 118-74-1 0.00200 0.0020 0.0020 NA 0.66 0.0350 0.17 Hexachlorobutadiene 87-68-3 0.0160 0.016 0.016 NA 0.66 0.0350 0.17 Hexachloroethane 67-72-1 6.00 0.17 0.17 NA 0.66 0.0400 0.17 Hexchlorocyclo-pentadiene 77-47-4
0.00700 0.0070 0.0070 NA 0.66 0.100 0.17
Indeno(1,2,3-cd)-pyrenef 193-39-5 0.200 0.0033 0.0033 NA 0.66 0.0400 0.17 Isophorone 78-59-1 512 0.17 0.17 NA 0.66 0.0300 0.17 Naphthalenef 91-20-3 0.0346 0.0033 0.0033 NA 0.66 0.0390 0.17 Nitrobenzene 98-95-3 1.96 0.0033 0.0033 NA 0.66 0.0340 0.17

Section: Worksheet #15 Revision: 1
Date: July 2008
Quality Assurance Project Plan Phase I RI Low Resolution Coring/Sediment Sampling Lower Passaic River Restoration Project Newark, New Jersey Page 25 of 41
QAPP Worksheet #15 (UFP-QAPP Manual Section 2.8.1) Data Quality Levels and Analytical Method Evaluation
J:\Water\ProjectFiles\P120\12182_Passaic\QAPP\Rev 1_July 2008\2008_Low Res Core QAPP_2008 July 18_Rev1_worksheet1-19.doc
Analytical Methodd Achievable Laboratory
Limitse
Analyte CAS
Number DQL
(mg/kg)a Sediment RL from 2005
QAPP (mg/kg)b
Project QL Goal
(mg/kg)c MDLs
(mg/kg) Method QLs
(mg/kg) MDLs
(mg/kg) QLs
(mg/kg) N-Nitroso-di-n-propylamine 621-64-7
0.0695 0.070 0.070 NA 0.66 0.0360 0.17
N-Nitrosodiphenylamine 86-30-6 99.3 0.0033 0.0033 NA 0.66 0.0360 0.17 Pentachlorophenol 87-86-5 0.400 0.0033 0.0033 NA 3.30 0.120 0.33 Perylenef 198-55-0 232 0.003 0.00 NA NA 0.00359 0.0067 Phenanthrenef 85-01-8 0.0419 0.0033 0.0033 NA 0.66 0.0430 0.17 Phenol 108-95-2 1830 0.17 0.17 NA 0.66 0.0390 0.17 Pyrenef 129-00-0 0.0530 0.0033 0.0033 NA 0.66 0.0460 0.17 Note: Bold indicates chemicals for which the achievable laboratory limits exceed the project QL goal.
Values shown with strike through will not be reported by the lab by this method (see PAH HRGC/LRMS method) a DQLs based on the lower of : 1) NJDEP Residential Direct Contact Cleanup Criteria, May 1999, 2) USEPA Region 9 Preliminary Remediation Goals (PRGs) for
Residential Soil, October 2004, and 3) applicable ecological thresholds based on No observable adverse effects level (NOAELs), Toxicity reference value (TRVs), Apparent effects threshold (AETs), Effects range-low (ER-Ls) and Threshold effects level (TELs). DQLs are analytical goals listed solely for the purpose of evaluating laboratory analytical methods and achievable laboratory limits; these are not project-specific screening levels or PRGs and are not approved by the USEPA as the appropriate risk assessment critieria for this project. These values will be developed in subsequent phases of the project.
b RLs were taken from Tables 2-1 through 2-21 (MPI QAPP, Lower Passaic River Restoration Project, August 2005). c The project QL goal is selected as the lower of the DQL and the Sediment RL. d Analytical MDLs and QLs are those documented in validated methods. e Achievable MDLs and QLs are limits that an individual laboratory can achieve when performing a specific analytical method and are typically based on wet
weight. Actual MDLs and QLs will vary based on percent moisture and other sample-specific factors. Where possible, the laboratory will increase sample weight to adjust for sample-specific moisture content, thereby, attaining the MDLs and QLs listed in Worksheet #15..
f Analyte will also be reported from PAH HRGC/LRMS method. g Analyte will also be reported from pesticide analysis. h Benzo[k]flouranthene will be reported by the laboratory with a “C” qualifier, indicating that it co-elutes with benzo[j]fluoranthene.

Section: Worksheet #15 Revision: 1
Date: July 2008
Quality Assurance Project Plan Phase I RI Low Resolution Coring/Sediment Sampling Lower Passaic River Restoration Project Newark, New Jersey Page 26 of 41
QAPP Worksheet #15 (UFP-QAPP Manual Section 2.8.1) Data Quality Levels and Analytical Method Evaluation
J:\Water\ProjectFiles\P120\12182_Passaic\QAPP\Rev 1_July 2008\2008_Low Res Core QAPP_2008 July 18_Rev1_worksheet1-19.doc
Matrix: Sediment Analytical Group: VOCs; Method 5035A/8260B; Test America, Knoxville, TN Concentration Level: Low
Analytical Methode Achievable Laboratory
Limitse
Analyte CAS
Number DQL
(mg/kg)a Sediment RL from
2005 QAPP (mg/kg)b
Project QL Goal
(mg/kg)c MDLs
(mg/kg)
Method QLs
(mg/kg) MDLs
(mg/kg) QLs
(mg/kg) 1,1,1-Trichloroethane 71-55-6 210 0.0050 0.0050 NA 0.0050 0.000160 0.0050 1,1,2,2-Tetrachloroethane 75-34-3 0.408 0.0050 0.0050 NA 0.0050 0.000290 0.0050 1,1,2-Trichloro- 1,2,2-trifluoroethane 75-35-4
5600 0.0050 0.0050 NA 0.0050 0.000780 0.0050
1,1,2-Trichloroethane 79-34-5 1,1-Dichloroethane 76-13-1 0.729 0.0050 0.0050 NA 0.0050 0.000270 0.0050 1,1-Dichloroethene 79-00-5 50.6 0.0050 0.0050 NA 0.0050 0.000260 0.0050 1,2,3-Trichlorobenzene 96-12-8 8.00 0.0050 0.0050 NA 0.0050 0.000230 0.0050 1,2,4-Trichlorobenzene 106-93-4 6.22 0.0050 0.0050 NA 0.0050 0.000740 0.0050 1,2-Dibromo- 3-chloropropane 95-50-1
0.460 0.0050 0.0050 NA 0.0050 0.000960 0.010
1,2-Dibromoethane 107-06-2 0.0320 0.0050 0.0050 NA 0.0050 0.000270 0.0050 1,2-Dichlorobenzene 78-87-5 0.120 0.0050 0.0050 NA 0.0050 0.000500 0.0050 1,2-Dichloroethane 87-61-6 0.278 0.0050 0.0050 NA 0.0050 0.000300 0.0050 1,2-Dichloropropane 120-82-1 0.342 0.0050 0.0050 NA 0.0050 0.000150 0.0050 1,3-Dichlorobenzene 541-73-1 0.120 0.0050 0.0050 NA 0.0050 0.000330 0.0050 1,4-Dichlorobenzene 106-46-7 0.120 0.0050 0.0050 NA 0.0050 0.000410 0.0050 1,4-Dioxane f 123-91-1 44.2 0.10 0.10 NA 0.0050 0.0230 0.10 2-Butanone 78-93-3 1000 0.010 0.010 NA 0.0050 0.000850 0.020 2-Hexanone 591-78-6 NA 0.0050 0.005 NA 0.0050 0.00140 0.020 4-Methyl-2-pentanone 108-10-1 528 0.010 0.010 NA 0.0050 0.000750 0.020 Acetone 67-64-1 1000 0.010 0.010 NA 0.0050 0.0110 0.020

Section: Worksheet #15 Revision: 1
Date: July 2008
Quality Assurance Project Plan Phase I RI Low Resolution Coring/Sediment Sampling Lower Passaic River Restoration Project Newark, New Jersey Page 27 of 41
QAPP Worksheet #15 (UFP-QAPP Manual Section 2.8.1) Data Quality Levels and Analytical Method Evaluation
J:\Water\ProjectFiles\P120\12182_Passaic\QAPP\Rev 1_July 2008\2008_Low Res Core QAPP_2008 July 18_Rev1_worksheet1-19.doc
Analytical Methode Achievable Laboratory
Limitse
Analyte CAS
Number DQL
(mg/kg)a Sediment RL from
2005 QAPP (mg/kg)b
Project QL Goal
(mg/kg)c MDLs
(mg/kg)
Method QLs
(mg/kg) MDLs
(mg/kg) QLs
(mg/kg) Benzene 71-43-2 0.260 0.0050 0.0050 NA 0.0050 0.000150 0.0050 Bromochloromethane 74-97-5 0.824 0.0050 0.0050 NA 0.0050 0.000370 0.0050 Bromodichloromethane 75-27-4 0.824 0.0050 0.0050 NA 0.0050 0.000170 0.0050 Bromoform 75-25-2 61.6 0.0050 0.0050 NA 0.0050 0.000710 0.0050 Bromomethane 74-83-9 0.390 0.0050 0.0050 NA 0.0050 0.00170 0.010 Carbon Disulfide 75-15-0 35.5 0.0050 0.0050 NA 0.0050 0.000190 0.0050 Carbon Tetrachloride 56-23-5 0.251 0.0050 0.0050 NA 0.0050 0.000300 0.0050 Chlorobenzene 75-00-3 0.0350 0.0050 0.0050 NA 0.0050 0.000150 0.0050 Chloroethane 74-87-3 3.03 0.0050 0.0050 NA 0.0050 0.00150 0.0050 Chloroform 156-59-2 0.221 0.0050 0.0050 NA 0.0050 0.000220 0.0050 Chloromethane 10061-01-5 4.69 0.0050 0.0050 NA 0.0050 0.000550 0.0050 cis-1,2-Dichloroethene 108-90-7 4.29 0.0050 0.0050 NA 0.0050 0.000200 0.0050 cis-1,3-Dichloropropene 67-66-3 0.777 0.0050 0.0050 NA 0.0050 0.000160 0.0050 Cyclohexane 110-82-7 140 0.0050 0.0050 NA 0.0050 0.000150 0.0050 Dibromochloromethane 124-48-1 1.11 0.0050 0.0050 NA 0.0050 0.000320 0.0050 Dichorodifluoromethane 75-71-8 9.39 0.0050 0.0050 NA 0.0050 0.000240 0.0050 Ethylbenzene 100-41-4 0.0640 0.0050 0.0050 NA 0.0050 0.000220 0.0050 Isopropylbenzene 98-82-8 57.2 0.0050 0.0050 NA 0.0050 0.000280 0.0050 m, p-Xylene 79-20-9 0.120 0.0050 0.0050 NA 0.0050 0.000710 0.0050 Methyl Acetate 108-87-2 2210 0.0050 0.0050 NA 0.0050 0.000500 0.0050 Methyl tert-Butyl Ether 75-09-2 16.7 0.0050 0.0050 NA 0.0050 0.000170 0.0050 Methylcyclohexane 1634-04-4 259 0.0050 0.0050 NA 0.0050 0.000280 0.0050 Methylene Chloride 100-42-5 9.11 0.0050 0.0050 NA 0.0050 0.000280 0.0050 o-Xylene 127-18-4 0.120 0.0050 0.0050 NA 0.0050 0.00100 0.0050

Section: Worksheet #15 Revision: 1
Date: July 2008
Quality Assurance Project Plan Phase I RI Low Resolution Coring/Sediment Sampling Lower Passaic River Restoration Project Newark, New Jersey Page 28 of 41
QAPP Worksheet #15 (UFP-QAPP Manual Section 2.8.1) Data Quality Levels and Analytical Method Evaluation
J:\Water\ProjectFiles\P120\12182_Passaic\QAPP\Rev 1_July 2008\2008_Low Res Core QAPP_2008 July 18_Rev1_worksheet1-19.doc
Analytical Methode Achievable Laboratory
Limitse
Analyte CAS
Number DQL
(mg/kg)a Sediment RL from
2005 QAPP (mg/kg)b
Project QL Goal
(mg/kg)c MDLs
(mg/kg)
Method QLs
(mg/kg) MDLs
(mg/kg) QLs
(mg/kg) Styrene 108-88-3 23.0 0.0050 0.0050 NA 0.0050 0.000250 0.0050 Tetrachloroethene 156-60-5 0.484 0.0050 0.0050 NA 0.0050 0.000190 0.0050 Toluene 10061-02-6 0.450 0.0050 0.0050 NA 0.0050 0.000150 0.0050 Trans-1,2-Dichloroethene 79-01-6 6.95 0.0050 0.0050 NA 0.0050 0.000150 0.0050 Trans-1,3-Dichloropropene 75-69-4
0.777 0.0050 0.0050 NA 0.0050 0.000260 0.0050
Trichloroethene 179601-23-1 0.0530 0.0050 0.0050 NA 0.0050 0.000190 0.0050 Trichlorofluoromethane 95-47-6 38.6 0.0050 0.0050 NA 0.0050 0.000240 0.0050 Vinyl Chloride 75-01-4 0.0791 0.0050 0.0050 NA 0.0050 0.000230 0.0050 Note: Bold indicates chemicals for which the achievable laboratory limits exceed the project QL goal. a DQLs based on the lower of : 1) NJDEP Residential Direct Contact Cleanup Criteria, May 1999, 2) USEPA Region 9 Preliminary Remediation Goals (PRGs) for
Residential Soil, October 2004, and 3) applicable ecological thresholds based on No observable adverse effects level (NOAELs), Toxicity reference value (TRVs), Apparent effects threshold (AETs), Effects range-low (ER-Ls) and Threshold effects level (TELs). DQLs are analytical goals listed solely for the purpose of evaluating laboratory analytical methods and achievable laboratory limits; these are not project-specific screening levels or PRGs and are not approved by the USEPA as the appropriate risk assessment critieria for this project. These values will be developed in subsequent phases of the project.
b RLs were taken from Tables 2-1 through 2-21 (MPI QAPP, Lower Passaic River Restoration Project, August 2005). c The project QL goal is selected as the lower of the DQL and the Sediment RL. d Analytical MDLs and QLs are those documented in validated methods. e Achievable MDLs and QLs are limits that an individual laboratory can achieve when performing a specific analytical method and are typically based on wet
weight. Actual MDLs and QLs will vary based on percent moisture and other sample-specific factors. Where possible, the laboratory will increase sample weight to adjust for sample-specific moisture content, thereby, attaining the MDLs and QLs listed in Worksheet #15.
f 1,4-Dioxane in sediments will be analyzed by SVOC method 8270C.

Section: Worksheet #15 Revision: 1
Date: July 2008
Quality Assurance Project Plan Phase I RI Low Resolution Coring/Sediment Sampling Lower Passaic River Restoration Project Newark, New Jersey Page 29 of 41
QAPP Worksheet #15 (UFP-QAPP Manual Section 2.8.1) Data Quality Levels and Analytical Method Evaluation
J:\Water\ProjectFiles\P120\12182_Passaic\QAPP\Rev 1_July 2008\2008_Low Res Core QAPP_2008 July 18_Rev1_worksheet1-19.doc
Matrix: Sediment Analytical Group: Total Petroleum Hydrocarbons, NJ Method OQA-QAM-025-10/91 (for extractable TPH), method 5035A/8015B (for purgeable TPH); TestAmerica, Edison, NJ Concentration Level: Low
Analytical Methodd Achievable Laboratory
Limitse
Analyte CAS Number DQL
(mg/kg)a Sediment RL from
2005 QAPP (mg/kg)b Project QL Goal
(mg/kg)c MDLs
(mg/kg)
Method QLs
(mg/kg) MDLs
(mg/kg) QLs
(mg/kg)
Total Petroleum Hydrocarbons (Extractable)
NA NA 20 20 10 30 1.8 6.7
Total Petroleum Hydrocarbons (Purgeable)
NA NA 20 20 NA NA 0.25f 2.5 f
a DQLs based on the lower of : 1) NJDEP Residential Direct Contact Cleanup Criteria, May 1999, 2) USEPA Region 9 Preliminary Remediation Goals (PRGs) for Residential Soil, October 2004, and 3) applicable ecological thresholds based on No observable adverse effects level (NOAELs), Toxicity reference value (TRVs), Apparent effects threshold (AETs), Effects range-low (ER-Ls) and Threshold effects level (TELs). DQLs are analytical goals listed solely for the purpose of evaluating laboratory analytical methods and achievable laboratory limits; these are not project-specific screening levels or PRGs and are not approved by the USEPA as the appropriate risk assessment critieria for this project. These values will be developed in subsequent phases of the project.
b RLs were taken from Tables 2-1 through 2-21 (MPI QAPP, Lower Passaic River Restoration Project, August 2005). c The project QL goal is selected as the lower of the DQL and the Sediment RL. d Analytical MDLs and QLs are those documented in validated methods. e
Achievable MDLs and QLs are limits that an individual laboratory can achieve when performing a specific analytical method and are typically based on wet weight. Actual MDLs and QLs will vary based on percent moisture and other sample-specific factors. Where possible, the laboratory will increase sample weight to adjust for sample-specific moisture content, thereby, attaining the MDLs and QLs listed in Worksheet #15.
f Based on methanol preservation.
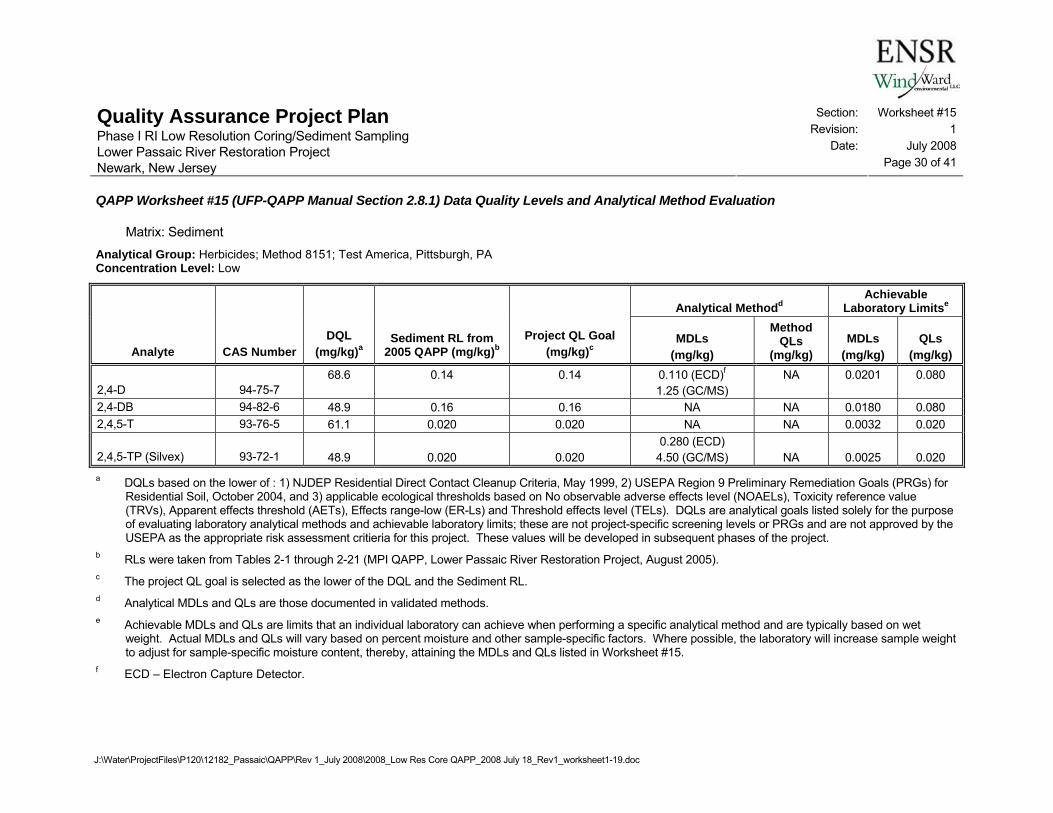
Section: Worksheet #15 Revision: 1
Date: July 2008
Quality Assurance Project Plan Phase I RI Low Resolution Coring/Sediment Sampling Lower Passaic River Restoration Project Newark, New Jersey Page 30 of 41
QAPP Worksheet #15 (UFP-QAPP Manual Section 2.8.1) Data Quality Levels and Analytical Method Evaluation
J:\Water\ProjectFiles\P120\12182_Passaic\QAPP\Rev 1_July 2008\2008_Low Res Core QAPP_2008 July 18_Rev1_worksheet1-19.doc
Matrix: Sediment Analytical Group: Herbicides; Method 8151; Test America, Pittsburgh, PA Concentration Level: Low
Analytical Methodd Achievable
Laboratory Limitse
Analyte CAS Number DQL
(mg/kg)a Sediment RL from
2005 QAPP (mg/kg)b Project QL Goal
(mg/kg)c MDLs
(mg/kg)
Method QLs
(mg/kg) MDLs
(mg/kg) QLs
(mg/kg)
2,4-D 94-75-7 68.6 0.14 0.14 0.110 (ECD)f
1.25 (GC/MS) NA 0.0201 0.080
2,4-DB 94-82-6 48.9 0.16 0.16 NA NA 0.0180 0.080 2,4,5-T 93-76-5 61.1 0.020 0.020 NA NA 0.0032 0.020
2,4,5-TP (Silvex) 93-72-1 48.9 0.020 0.020 0.280 (ECD)
4.50 (GC/MS) NA 0.0025 0.020 a DQLs based on the lower of : 1) NJDEP Residential Direct Contact Cleanup Criteria, May 1999, 2) USEPA Region 9 Preliminary Remediation Goals (PRGs) for
Residential Soil, October 2004, and 3) applicable ecological thresholds based on No observable adverse effects level (NOAELs), Toxicity reference value (TRVs), Apparent effects threshold (AETs), Effects range-low (ER-Ls) and Threshold effects level (TELs). DQLs are analytical goals listed solely for the purpose of evaluating laboratory analytical methods and achievable laboratory limits; these are not project-specific screening levels or PRGs and are not approved by the USEPA as the appropriate risk assessment critieria for this project. These values will be developed in subsequent phases of the project.
b RLs were taken from Tables 2-1 through 2-21 (MPI QAPP, Lower Passaic River Restoration Project, August 2005). c The project QL goal is selected as the lower of the DQL and the Sediment RL. d Analytical MDLs and QLs are those documented in validated methods. e Achievable MDLs and QLs are limits that an individual laboratory can achieve when performing a specific analytical method and are typically based on wet
weight. Actual MDLs and QLs will vary based on percent moisture and other sample-specific factors. Where possible, the laboratory will increase sample weight to adjust for sample-specific moisture content, thereby, attaining the MDLs and QLs listed in Worksheet #15.
f ECD – Electron Capture Detector.

Section: Worksheet #15 Revision: 1
Date: July 2008
Quality Assurance Project Plan Phase I RI Low Resolution Coring/Sediment Sampling Lower Passaic River Restoration Project Newark, New Jersey Page 31 of 41
QAPP Worksheet #15 (UFP-QAPP Manual Section 2.8.1) Data Quality Levels and Analytical Method Evaluation
J:\Water\ProjectFiles\P120\12182_Passaic\QAPP\Rev 1_July 2008\2008_Low Res Core QAPP_2008 July 18_Rev1_worksheet1-19.doc
Matrix: Sediment Analytical Group: Butyltins, 8000B, NOAA 130 (modified), Columbia Analytical Services, Kelso, WA Concentration Level: Low
Analytical Methodd Achievable Laboratory
Limitse
Analyte CAS
Number DQL
(mg/kg)a
Sediment RL from 2005
QAPP (mg/kg)b
Project QL Goal
(mg/kg)c MDLs
(mg/kg) Method QLs
(mg/kg) MDLs
(mg/kg) QLs
(mg/kg) Dibutyl tin 14488-53-0 1.83 0.0013 0.0013 NA NA 0.000028 0.0010 Monobuyltin 78763-54-9 1.83 0.0010 0.0010 NA NA 0.000030 0.0010 Tetrabutyltin 1461-25-2 1.83 0.0017 0.0017 NA NA 0.000070 0.0010 Tributyltin 36643-28-4 1.83 0.0015 0.0015 NA NA 0.000056 0.0010 a DQLs based on the lower of : 1) NJDEP Residential Direct Contact Cleanup Criteria, May 1999, 2) USEPA Region 9 Preliminary Remediation Goals (PRGs) for
Residential Soil, October 2004, and 3) applicable ecological thresholds based on No observable adverse effects level (NOAELs), Toxicity reference value (TRVs), Apparent effects threshold (AETs), Effects range-low (ER-Ls) and Threshold effects level (TELs). DQLs are analytical goals listed solely for the purpose of evaluating laboratory analytical methods and achievable laboratory limits; these are not project-specific screening levels or PRGs and are not approved by the USEPA as the appropriate risk assessment critieria for this project. These values will be developed in subsequent phases of the project.
b RLs were taken from Tables 2-1 through 2-21 (MPI QAPP, Lower Passaic River Restoration Project, August 2005). c The project QL goal is selected as the lower of the DQL and the Sediment RL. d Analytical MDLs and QLs are those documented in validated methods. e Achievable MDLs and QLs are limits that an individual laboratory can achieve when performing a specific analytical method and are typically based on wet
weight. Actual MDLs and QLs will vary based on percent moisture and other sample-specific factors. Where possible, the laboratory will increase sample weight to adjust for sample-specific moisture content, thereby, attaining the MDLs and QLs listed in Worksheet #15.

Section: Worksheet #15 Revision: 1
Date: July 2008
Quality Assurance Project Plan Phase I RI Low Resolution Coring/Sediment Sampling Lower Passaic River Restoration Project Newark, New Jersey Page 32 of 41
QAPP Worksheet #15 (UFP-QAPP Manual Section 2.8.1) Data Quality Levels and Analytical Method Evaluation
J:\Water\ProjectFiles\P120\12182_Passaic\QAPP\Rev 1_July 2008\2008_Low Res Core QAPP_2008 July 18_Rev1_worksheet1-19.doc
Matrix: Sediment Analytical Group: Metals; see methods below, Columbia Analytical Services, Kelso, WA Concentration Level: Low
Analytical Methodd Achievable Laboratory
Limitse
Analyte CAS
Number Method DQL
(mg/kg)a
Sediment RL from 2005
QAPP (mg/kg)b
Project QL Goal
(mg/kg)c IDLs
(mg/kg)
Method QLs
(mg/kg) MDLs
(mg/kg) QLs
(mg/kg)
Aluminum 7429-90-5 USEPA
6010/6020 7610 20 20 3.0 NA 0.50 2.0
Antimony 7440-36-0 USEPA 6020 2.00 1.0 1.0 2.1 NA 0.030 0.050 Arsenic 7440-38-2 USEPA 6020 0.390 0.25 0.25 3.5 NA 0.10 0.50 Arsenic 7440-38-2 USEPA 7062 0.390 0.25 0.25 NA 0.30 0.030 0.10
Barium 7440-39-3 USEPA
6010/6020 537 5.0 5.0 0.087 NA 0.030 0.050
Beryllium 7440-41-7 USEPA 6020 2.00 0.25 0.25 0.018 NA 0.020 0.020 Cadmium 7440-43-9 USEPA 6020 0.596 0.25 0.25 0.23 NA 0.0080 0.020 Calcium 7440-70-2 USEPA 6010B NA 500 500 0.67 NA 2.0 10 Chromium (total) 7440-47-3 USEPA 6020 32.0 1.0 1.0 0.47 NA 0.040 0.20
Chromium (hexavalent) 18540-29-9 USEPA
7199/3060A 30.1 0.010 0.010 NA NA 0.101 0.40
Cobalt 7440-48-4 USEPA 6020 73.0 0.50 0.50 0.47 NA 0.0030 0.020 Copper 7440-50-8 USEPA 6020 34.0 1.0 1.0 0.36 NA 0.10 0.10 Iron 57-12-5 USEPA 6010B 2350 10 10 0.41 NA 0.60 4.0 Lead 7439-89-6 USEPA 6020 35.0 0.50 0.50 2.8 NA 0.020 0.050 Magnesium 7439-92-1 USEPA 6010B NA 500 500 2.0 NA 2.0 4.0
Manganese 7439-95-4 USEPA
6010/6020 176 0.50 0.50 0.093 NA 0.040 0.050
Nickel 7440-02-0 USEPA 6020 18.0 0.50 0.50 1.0 NA 0.050 0.20 Potassium 7440-09-7 USEPA 6010B NA 500 500 Variable NA 200 200

Section: Worksheet #15 Revision: 1
Date: July 2008
Quality Assurance Project Plan Phase I RI Low Resolution Coring/Sediment Sampling Lower Passaic River Restoration Project Newark, New Jersey Page 33 of 41
QAPP Worksheet #15 (UFP-QAPP Manual Section 2.8.1) Data Quality Levels and Analytical Method Evaluation
J:\Water\ProjectFiles\P120\12182_Passaic\QAPP\Rev 1_July 2008\2008_Low Res Core QAPP_2008 July 18_Rev1_worksheet1-19.doc
Analytical Methodd Achievable Laboratory
Limitse
Analyte CAS
Number Method DQL
(mg/kg)a
Sediment RL from 2005
QAPP (mg/kg)b
Project QL Goal
(mg/kg)c IDLs
(mg/kg)
Method QLs
(mg/kg) MDLs
(mg/kg) QLs
(mg/kg) Selenium 7782-49-2 USEPA 6020 13.0 0.50 0.50 5.0 NA 0.40 1.0 Silver 7440-22-4 USEPA 6020 1.00 0.25 0.25 0.47 NA 0.020 0.020 Sodium 7440-23-5 USEPA 6010B NA 500 500 1.9 NA 20 20 Thallium 7440-28-0 USEPA 6020 0.516 0.50 0.50 2.7 NA 0.0030 0.020 Titanium 7440-32-6 USEPA 6010B 100000.00 100 100 0.50 NA 0.50 2.0 Vanadium 7440-62-2 USEPA 6020 7.82 0.50 0.50 0.50 NA 0.040 0.20 Zinc 7440-66-6 USEPA 6020 123 1.0 1.0 1.2 NA 0.20 0.50 Note: Bold indicates chemicals for which the achievable laboratory limits exceed the project QL goal. a DQLs based on the lower of : 1) NJDEP Residential Direct Contact Cleanup Criteria, May 1999, 2) USEPA Region 9 Preliminary Remediation Goals (PRGs) for
Residential Soil, October 2004, and 3) applicable ecological thresholds based on No observable adverse effects level (NOAELs), Toxicity reference value (TRVs), Apparent effects threshold (AETs), Effects range-low (ER-Ls) and Threshold effects level (TELs). DQLs are analytical goals listed solely for the purpose of evaluating laboratory analytical methods and achievable laboratory limits; these are not project-specific screening levels or PRGs and are not approved by the USEPA as the appropriate risk assessment critieria for this project. These values will be developed in subsequent phases of the project.
b RLs were taken from Tables 2-1 through 2-21 (MPI QAPP, Lower Passaic River Restoration Project, August 2005). c The project QL goal is selected as the lower of the DQL and the Sediment RL. d Analytical MDLs and QLs are those documented in validated methods. Values listed are estimated instrument detection limits (IDLs) from method 6010B
(assuming 100x DF for sediment matrix). Method 6020A does not list MDLs or IDLs. e Achievable MDLs and QLs are limits that an individual laboratory can achieve when performing a specific analytical method and are typically based on wet
weight. Actual MDLs and QLs will vary based on percent moisture and other sample-specific factors. Where possible, the laboratory will increase sample weight to adjust for sample-specific moisture content, thereby, attaining the MDLs and QLs listed in Worksheet #15. The MDLs and QLs shown are for the associated method referenced in the “Method” column.

Section: Worksheet #15 Revision: 1
Date: July 2008
Quality Assurance Project Plan Phase I RI Low Resolution Coring/Sediment Sampling Lower Passaic River Restoration Project Newark, New Jersey Page 34 of 41
QAPP Worksheet #15 (UFP-QAPP Manual Section 2.8.1) Data Quality Levels and Analytical Method Evaluation
J:\Water\ProjectFiles\P120\12182_Passaic\QAPP\Rev 1_July 2008\2008_Low Res Core QAPP_2008 July 18_Rev1_worksheet1-19.doc
Matrix: Sediment Analytical Group: Mercury; see methods below, Brooks Rand LLC, Seattle, WA Concentration Level: Low
Analytical Methodd Achievable Laboratory
Limitse
Analyte CAS
Number Method DQL
(mg/kg)a
Sediment RL from 2005 QAPP
(mg/kg)b Project QL Goal
(mg/kg)c MDLs
(mg/kg)
Method QLs
(mg/kg) MDLs
(mg/kg) QLs
(mg/kg) Mercury, low level 7439-97-6 USEPA 1631 0.150 0.030 0.030 NA NA 0.000030 NA
Methyl Mercury 22967-92-6 USEPA 1630
modified 0.611 0.00020 0.00020 NA NA 0.0000080 NA
a DQLs based on the lower of : 1) NJDEP Residential Direct Contact Cleanup Criteria, May 1999, 2) USEPA Region 9 Preliminary Remediation Goals (PRGs) for Residential Soil, October 2004, and 3) applicable ecological thresholds based on No observable adverse effects level (NOAELs), Toxicity reference value (TRVs), Apparent effects threshold (AETs), Effects range-low (ER-Ls) and Threshold effects level (TELs). DQLs are analytical goals listed solely for the purpose of evaluating laboratory analytical methods and achievable laboratory limits; these are not project-specific screening levels or PRGs and are not approved by the USEPA as the appropriate risk assessment critieria for this project. These values will be developed in subsequent phases of the project.
b RLs were taken from Tables 2-1 through 2-21 (MPI QAPP, Lower Passaic River Restoration Project, August 2005). c The project QL goal is selected as the lower of the DQL and the Sediment RL. d Analytical MDLs and QLs are those documented in validated methods. e Achievable MDLs and QLs are limits that an individual laboratory can achieve when performing a specific analytical method and are typically based on wet
weight. Actual MDLs and QLs will vary based on percent moisture and other sample-specific factors. Where possible, the laboratory will increase sample weight to adjust for sample-specific moisture content, thereby, attaining the MDLs and QLs listed in Worksheet #15.

Section: Worksheet #15 Revision: 1
Date: July 2008
Quality Assurance Project Plan Phase I RI Low Resolution Coring/Sediment Sampling Lower Passaic River Restoration Project Newark, New Jersey Page 35 of 41
QAPP Worksheet #15 (UFP-QAPP Manual Section 2.8.1) Data Quality Levels and Analytical Method Evaluation
J:\Water\ProjectFiles\P120\12182_Passaic\QAPP\Rev 1_July 2008\2008_Low Res Core QAPP_2008 July 18_Rev1_worksheet1-19.doc
Matrix: Sediment Analytical Group: AVS/SEM USEPA Methods 821R91100, 6010C/6020, Columbia Analytical Services, Kelso, WA Concentration Level: Low
Analytical Methodd Achievable Laboratory
Limitse
Analyte CAS
Number Method DQL
(umoles/g)a
Sediment RL from 2005 QAPP
micro moles per gram
(umoles/g)b Project QL Goal
(umoles/g)c MDLs Method
QLs MDLs QLs
(umoles/g)
AVS/SEM 18496-25-8 USEPA Method
821R91100 NA 0.01 0.01 NA NA NA 0.016
SEM-cadmium 7440-43-9
USEPA Method 821R91100/ 6010C/6020 NA 1f 1 f NA NA NA 0.0018
SEM-copper 7440-50-8
USEPA Method 821R91100/ 6010C/6020 NA 1f 1 f NA NA NA 0.0063
SEM-lead 7439-89-6
USEPA Method 821R91100/ 6010C/6020 NA 0.5f 0.5 f NA NA NA 0.0145
SEM-mercury 7439-97-6
USEPA Method 821R91100/ 6010C/6020 NA 0.02f 0.02 f NA NA NA 0.00005
SEM-nickel 7440-02-0
USEPA Method 821R91100/ 6010C/6020 NA 0.5f 0.5 f NA NA NA 0.0085
SEM-zinc 7440-66-6
USEPA Method 821R91100/ 6010C/6020 NA 1f 1 f NA NA NA 0.0061

Section: Worksheet #15 Revision: 1
Date: July 2008
Quality Assurance Project Plan Phase I RI Low Resolution Coring/Sediment Sampling Lower Passaic River Restoration Project Newark, New Jersey Page 36 of 41
QAPP Worksheet #15 (UFP-QAPP Manual Section 2.8.1) Data Quality Levels and Analytical Method Evaluation
J:\Water\ProjectFiles\P120\12182_Passaic\QAPP\Rev 1_July 2008\2008_Low Res Core QAPP_2008 July 18_Rev1_worksheet1-19.doc
a DQLs based on the lower of : 1) NJDEP Residential Direct Contact Cleanup Criteria, May 1999, 2) USEPA Region 9 Preliminary Remediation Goals (PRGs) for Residential Soil, October 2004, and 3) applicable ecological thresholds based on No observable adverse effects level (NOAELs), Toxicity reference value (TRVs), Apparent effects threshold (AETs), Effects range-low (ER-Ls) and Threshold effects level (TELs). DQLs are analytical goals listed solely for the purpose of evaluating laboratory analytical methods and achievable laboratory limits; these are not project-specific screening levels or PRGs and are not approved by the USEPA as the appropriate risk assessment critieria for this project. These values will be developed in subsequent phases of the project.
b RLs were taken from Tables 2-1 through 2-21 (MPI QAPP, Lower Passaic River Restoration Project, August 2005). c The project QL goal is selected as the lower of the DQL and the Sediment RL. d Analytical MDLs and QLs are those documented in validated methods. e Achievable MDLs and QLs are limits that an individual laboratory can achieve when performing a specific analytical method. Actual MDLs and QLs will vary
based on sample-specific factors. f In extract.

Section: Worksheet #15 Revision: 1
Date: July 2008
Quality Assurance Project Plan Phase I RI Low Resolution Coring/Sediment Sampling Lower Passaic River Restoration Project Newark, New Jersey Page 37 of 41
QAPP Worksheet #15 (UFP-QAPP Manual Section 2.8.1) Data Quality Levels and Analytical Method Evaluation
J:\Water\ProjectFiles\P120\12182_Passaic\QAPP\Rev 1_July 2008\2008_Low Res Core QAPP_2008 July 18_Rev1_worksheet1-19.doc
Matrix: Sediment Analytical Group: Wet Chemistry (see methods below), Columbia Analytical Services, Kelso, WA Concentration Level: Low
Analytical Methodd Achievable Laboratory Limitse
Analyte CAS
Number Method DQL
(mg/kg)a
Sediment RL from 2005
QAPP (mg/kg, except as noted
below)b
Project QL Goal
(mg/kg, except as noted below)c MDLs
Method QLs
(mg/kg)
MDLs (mg/kg, except as
noted below)
QLs (mg/kg,
except as noted below)
Ammonia as N 7664-41-7 USEPA 350.1 NA 0.020 mg/Lf,g
0.20 mg/kgg 0.020 mg/Lf,g
0.20 mg/kgg NA NA 0.0080 mg/Lg
0.04 mg/kg 0.050 mg/Lg
0.50 mg/kg
Cyanide 57-12-5 USEPA
9010C/9014 122 2.5 2.5 NA NA 0.10 0.20
Total Phosphorus 14265-44-2 USEPA 365.3 NA 0.010 mg/Lf,g
0.10 mg/kgg 0.010 mg/Lf,g
0.10 mg/kgg NA NA 0.0040 mg/Lg
NA 0.010 mg/Lg
0.10 mg/kg
TKN 7727-37-9 ASTMh
D3590-89-02 NA 150 150 NA NA 5.0 20
TOC 7440-44-0 Lloyd Kahn
Method NA 100 100 NA NA 0.040 0.50
Total Sulfide 18496-25-8 SW846 9030
modified NA 0.20 0.20 NA 0.20 0.050 0.50
Note: Bold indicates chemicals for which the achievable laboratory limits exceed the project QL goal. a DQLs based on the lower of : 1) NJDEP Residential Direct Contact Cleanup Criteria, May 1999, 2) USEPA Region 9 Preliminary Remediation Goals (PRGs) for
Residential Soil, October 2004, and 3) applicable ecological thresholds based on No observable adverse effects level (NOAELs), Toxicity reference value (TRVs), Apparent effects threshold (AETs), Effects range-low (ER-Ls) and Threshold effects level (TELs). DQLs are analytical goals listed solely for the purpose of evaluating laboratory analytical methods and achievable laboratory limits; these are not project-specific screening levels or PRGs and are not approved by the USEPA as the appropriate risk assessment critieria for this project. These values will be developed in subsequent phases of the project.
b RLs were taken from Tables 2-1 through 2-21 (MPI QAPP Lower Passaic River Restoration Project, August 2005). c The project QL goal is selected as the lower of the DQL and the Sediment RL. d Analytical MDLs and QLs are those documented in validated methods.

Section: Worksheet #15 Revision: 1
Date: July 2008
Quality Assurance Project Plan Phase I RI Low Resolution Coring/Sediment Sampling Lower Passaic River Restoration Project Newark, New Jersey Page 38 of 41
QAPP Worksheet #15 (UFP-QAPP Manual Section 2.8.1) Data Quality Levels and Analytical Method Evaluation
J:\Water\ProjectFiles\P120\12182_Passaic\QAPP\Rev 1_July 2008\2008_Low Res Core QAPP_2008 July 18_Rev1_worksheet1-19.doc
e Achievable MDLs and QLs are limits that an individual laboratory can achieve when performing a specific analytical method and are typically based on wet weight. Actual MDLs and QLs will vary based on percent moisture and other sample-specific factors. Where possible, the laboratory will increase sample weight to adjust for sample-specific moisture content, thereby, attaining the MDLs and QLs listed in Worksheet #15.
f RLs provided in the 2005 MPI QAPP were in aqueous units (mg/L). The values were converted to solid uints (mg/kg) by ENSR using a 10x dilution factor... g milligrams per liter. h ASTM – American society for Testing and Materials.

Section: Worksheet #15 Revision: 1
Date: July 2008
Quality Assurance Project Plan Phase I RI Low Resolution Coring/Sediment Sampling Lower Passaic River Restoration Project Newark, New Jersey Page 39 of 41
QAPP Worksheet #15 (UFP-QAPP Manual Section 2.8.1) Data Quality Levels and Analytical Method Evaluation
J:\Water\ProjectFiles\P120\12182_Passaic\QAPP\Rev 1_July 2008\2008_Low Res Core QAPP_2008 July 18_Rev1_worksheet1-19.doc
Matrix: Sediment Analytical Group: Radionuclides, United States Department of Energy (DOE) EML HASL-300/USEPA 900, GEL, Charleston, SC Concentration Level:
Analytical Methodd Achievable Laboratory Limitse
Analyte CAS
Number
DQL (Picocuries/
gram [pCi/g])a
Sediment RL from 2005
QAPP (pCi/g)b Project QL Goal
(pCi/g)c MDLs Method
QLs MDLs QLs
(pCi/g) Beryllium-7 13966-02-4 NA 0.30 0.30 NA NA NA 0.30 Cesium-137 10045-97-3 NA 0.050 0.050 NA NA NA 0.050 Lead -210f 14255-04-0 NA 0.10 0.10 NA NA NA 0.10 Potassium -40 13966-00-2 NA NA NA NA NA NA 1.0
a DQLs based on the lower of : 1) NJDEP Residential Direct Contact Cleanup Criteria, May 1999, 2) USEPA Region 9 Preliminary Remediation Goals (PRGs) for Residential Soil, October 2004, and 3) applicable ecological thresholds based on No observable adverse effects level (NOAELs), Toxicity reference value (TRVs), Apparent effects threshold (AETs), Effects range-low (ER-Ls) and Threshold effects level (TELs). DQLs are analytical goals listed solely for the purpose of evaluating laboratory analytical methods and achievable laboratory limits; these are not project-specific screening levels or PRGs and are not approved by the USEPA as the appropriate risk assessment critieria for this project. These values will be developed in subsequent phases of the project.
b RLs were taken from Tables 2-1 through 2-21 (MPI QAPP, Lower Passaic River Restoration Project, August 2005). c The project QL goal is selected as the lower of the DQL and the Sediment RL. d Analytical MDLs and QLs are those documented in validated methods. e Achievable MDLs and QLs are limits that an individual laboratory can achieve when performing a specific analytical method and are typically based on wet
weight. Actual MDLs and QLs will vary based on percent moisture and other sample-specific factors. Where possible, the laboratory will increase sample weight to adjust for sample-specific moisture content, thereby, attaining the MDLs and QLs listed in Worksheet #15.
f Lead-210 will be determined as polonium-210 and radium-226.

Section: Worksheet #15 Revision: 1
Date: July 2008
Quality Assurance Project Plan Phase I RI Low Resolution Coring/Sediment Sampling Lower Passaic River Restoration Project Newark, New Jersey Page 40 of 41
QAPP Worksheet #15 (UFP-QAPP Manual Section 2.8.1) Data Quality Levels and Analytical Method Evaluation
J:\Water\ProjectFiles\P120\12182_Passaic\QAPP\Rev 1_July 2008\2008_Low Res Core QAPP_2008 July 18_Rev1_worksheet1-19.doc
Matrix: Sediment Analytical Group: Physical Testing, ASTM Methods D2974-07A (Moisture), D422 or D4464 (Grain Size), ASTM D854 (Specific Gravity), ASTM D4318 (Atterberg Limits), Columbia Analytical Services, Kelso, WA Concentration Level: NA
Analytical Methodd Achievable Laboratory Limitse
Analyte CAS
Number DQL
Sediment RL from 2005
QAPPb Project QL Goal MDLs Method
QLs MDLs QLs
Percent Moisture NA NA NA NA NA NA NA NA Grain Size NA NA NA NA NA NA NA NA Specific Gravity NA NA NA NA NA NA NA NA Atterberg Limits NA NA NA NA NA NA NA NA
a DQLs based on the lower of : 1) NJDEP Residential Direct Contact Cleanup Criteria, May 1999, 2) USEPA Region 9 Preliminary Remediation Goals (PRGs) for Residential Soil, October 2004, and 3) applicable ecological thresholds based on No observable adverse effects level (NOAELs), Toxicity reference value (TRVs), Apparent effects threshold (AETs), Effects range-low (ER-Ls) and Threshold effects level (TELs). DQLs are analytical goals listed solely for the purpose of evaluating laboratory analytical methods and achievable laboratory limits; these are not project-specific screening levels or PRGs and are not approved by the USEPA as the appropriate risk assessment critieria for this project. These values will be developed in subsequent phases of the project.
b RLs were taken from Tables 2-1 through 2-21 (MPI QAPP, Lower Passaic River Restoration Project, August 2005). c The project QL goal is selected as the lower of the DQL and the Sediment RL. d Analytical MDLs and QLs are those documented in validated methods. e Achievable MDLs and QLs are limits that an individual laboratory can achieve when performing a specific analytical method. Actual MDLs and QLs will vary
based on sample-specific factors.

Section: Worksheet #15 Revision: 1
Date: July 2008
Quality Assurance Project Plan Phase I RI Low Resolution Coring/Sediment Sampling Lower Passaic River Restoration Project Newark, New Jersey Page 41 of 41
QAPP Worksheet #15 (UFP-QAPP Manual Section 2.8.1) Data Quality Levels and Analytical Method Evaluation
J:\Water\ProjectFiles\P120\12182_Passaic\QAPP\Rev 1_July 2008\2008_Low Res Core QAPP_2008 July 18_Rev1_worksheet1-19.doc
Matrix: Sediment Analytical Group: Biological Testing, Standard Methods 9223B, Modified (E. Coli), USEPA Method 1623, Modified (Giardia), Analytical Services, Inc. Williston, VT Concentration Level: Low-High
Analytical Methodd Achievable Laboratory Limitse
Analyte CAS
Number DQL
Sediment RL from 2005
QAPPb Project QL Goal MDLs Method
QLs MDLs QLs E. Coli NA NA NA NA NA NA NA NA Giardia NA NA NA NA NA NA NA NA
a DQLs based on the lower of : 1) NJDEP Residential Direct Contact Cleanup Criteria, May 1999, 2) USEPA Region 9 Preliminary Remediation Goals (PRGs) for Residential Soil, October 2004, and 3) applicable ecological thresholds based on No observable adverse effects level (NOAELs), Toxicity reference value (TRVs), Apparent effects threshold (AETs), Effects range-low (ER-Ls) and Threshold effects level (TELs). DQLs are analytical goals listed solely for the purpose of evaluating laboratory analytical methods and achievable laboratory limits; these are not project-specific screening levels or PRGs and are not approved by the USEPA as the appropriate risk assessment critieria for this project. These values will be developed in subsequent phases of the project.
b RLs were taken from Tables 2-1 through 2-21 (MPI QAPP, Lower Passaic River Restoration Project, August 2005). c The project QL goal is selected as the lower of the DQL and the Sediment RL. d Analytical MDLs and QLs are those documented in validated methods. e Achievable MDLs and QLs are limits that an individual laboratory can achieve when performing a specific analytical method. Actual MDLs and QLs will vary
based on sample-specific factors.

Section: Worksheet #16 Revision: 1
Date: July 2008
Quality Assurance Project Plan Phase I RI Low Resolution Coring/Sediment Sampling Lower Passaic River Restoration Project Newark, New Jersey Page 1 of 1
J:\Water\ProjectFiles\P120\12182_Passaic\QAPP\Rev 1_July 2008\2008_Low Res Core QAPP_2008 July 18_Rev1_worksheet1-19.doc
QAPP Worksheet #16 (UFP-QAPP Manual Section 2.8.2) Project Schedule/Timeline Table
Dates (MM/DD/YY)
Activities Organization Anticipated Date(s)
of Initiation Anticipated Date of
Completion Deliverable Deliverable Due Date
Project Status de maximis/ ENSR Monthly Monthly Progress report 15th of each month Planning and Development of Study Objectives de maximis/ ENSR Completed Completed QAPP/ FSP Addendum
Submitted May 2, 2008 Revision 1 July 18, 2008
Collection of Samples and Submission for Analysis ENSR July 2008 October 2008 Sample submission to
laboratories At time of collection per SOP
Laboratory Analysis ENSR July 2008 December 2008 Analytical data to CPG
Beginning at 30 days after collection. See Worksheet #30 for turnaround times.
Data Validation and Verification of Sediment Data ENSR September 2008 January 2008 Validated data with
progress report When completed.
Evaluation of Sample Data de maximis/ ENSR September 2008 May 8, 2009 Included in Draft Site Characterization Report May 8, 2009
Preparation and Delivery of Characterization Summary to USEPA
de maximis/ ENSR October 2008 May 8, 2009 Draft Site Characterization Report May 8, 2009

Section: Worksheet #17 Revision: 1
Date: July 2008
Quality Assurance Project Plan Lower Passaic River Restoration Project Newark, New New Jersey Page 1 of 4
J:\Water\ProjectFiles\P120\12182_Passaic\QAPP\Rev 1_July 2008\2008_Low Res Core QAPP_2008 July 18_Rev1_worksheet1-19.doc
QAPP Worksheet #17 (UFP-QAPP Manual Section 3.1.1) Sampling Design and Rationale
Describe and provide a rationale for choosing the sampling approach (e.g., grid system, biased statistical approach): The proposed sampling locations are presented in Figures 2-A through 2-I of the FSP Addendum (Appendix A) for this work. Sampling locations were chosen to provide representative nature and extent coverage, determine potential source areas and gather data on physical characteristics to further the understanding of sediment stability over the study area. Selection was based on the following specific considerations:
• Transect spacing of 0.25 in RM 0 to 1 where previous sampling has not been conducted • General coverage with minimum approximate 0.5 mile spacing between transects of cores above RM 7 • One-mile transect spacing minimum coverage within RM 1.5 to 6.5, with the goal to:
1) Refresh surface sediment concentrations, the PRSA sediment data were obtained in 1995.
2) Characterize cores that are considered “incomplete” (i.e., cores with elevated concentrations in the deepest segment analyzed). Note that the goals for the two studies differ. The goal for sampling the PRSA (i.e., RM1 to RM7) was to define the 1940 horizon. The RI/FS goal is to characterize sediment to the red brown clay, sand, or refusal. However, where PRSA cores are “complete” (i.e., low concentrations were detected at depth), the CPG will sample from the 2008 sediment-water interface to the sediment-water interface sampled in 1995, including a 0 to 6 inch BAZ sample, with the agreed upon segment sampling from 6 inches to the 1995 elevation.
3) Complete RI/FS requirements for determining nature and extent
• One mile transect spacing minimum coverage within RM 1.5 to 6.5 • Geomorphic region (channel, mudflat, bend, etc.) • Previously characterized sediment type • Previous characterization as erosional/depositional • Proximity to previous sampling locations • Proximity to potential contamination sources • Dundee Dam and tributary samples are intended to characterize potential upgradient sources to the LPRSA.
A summary of how these selection criteria apply to each proposed location in presented in QAPP Worksheet #18 and Table 1 of the FSP Addendum for this work. The ”target coordinate area” will be checked for obstructions by probing, where necessary. In addition, in hard bottom areas where gravel is found, probing will be conducted to determine if vibracoring can be performed at the target coordinate. Where not amenable to coring, probing will

Section: Worksheet #17 Revision: 1
Date: July 2008
Quality Assurance Project Plan Lower Passaic River Restoration Project Newark, New New Jersey Page 2 of 4
QAPP Worksheet #17 (UFP-QAPP Manual Section 3.1.1) Sampling Design and Rationale
J:\Water\ProjectFiles\P120\12182_Passaic\QAPP\Rev 1_July 2008\2008_Low Res Core QAPP_2008 July 18_Rev1_worksheet1-19.doc
check for other suitable areas within the 25 foot radius defined as a sample location. If no locations within the target radius appear amenable to coring, then the probing will move out (up- and down-stream), along a transect parallel to shore through the target location, to find the closest suitable location for attempting a core(s). If no locations are found within 300 feet up- or down-stream, the cores will be attempted within original target zone.
To obtain data representative of sediment conditions within the transect, geomorphology data, including bathymetry and surface sediment type, was reviewed to locate proposed samples. In the lower river, the data suggested that three samples per transect were required; whereas, in the upper river, above RM8, two samples per transect could meet the objective.
Describe the sampling design and rationale in terms of what matrices will be sampled, what analytical groups will be analyzed and at what concentration levels, the sampling locations (including QC, critical, and background samples), the number of samples to be taken, and the sampling frequency (including seasonal considerations):
As Phase 1 of the overall sediment characterization, this effort will focus on implementation of the RI FSP1 low resolution core investigation. Four groups of sediment analyses are proposed: 1) A comprehensive list of physical and inorganic and organic chemical analyses is proposed for the full set of stations. 2) Additional analyses are proposed for surficial samples from 13 stations over the length of the study area to determine their relevance in future investigation phases. 3) Additional particle size-density classification, microscopy, petrography and PCB sediment-water partitioning analysis is proposed for six to seven stations to allow for evaluation of this analytical technique for use in future investigation phases. 4) A subset of eight locations is propsed for a finer segmentation for fate and transport modeling data needs. Table 2 of the FSP Addendum (Appendix A) provides a summary of the analyses to be performed for each group.
The sample collection approach includes the combination of both sediment grabs and vibracores. An initial grab sample will be collected at each station using a modified Van Veen grab. The goal of the grab sampling is to collect a surficial sediment sample, from 0 to 1” below the sediment-water interface for Be-7 testing and from 0 to 0.5 ft below the sediment-water interface (for other surficial analytes).
A vibracore system will be used to collect the sediment samples for the 0-6” segment (to be sampled prior to collection from the grab as described in FSP Addendum Table 3), and between 0.5 ft and the red brown clay, sand, or refusal at each station in Worksheet #18 and Table 1 of the FSP Addendum (Appendix A). Longer cores will be sectioned as needed on the sampling vessel, to facilitate handling and to ensure that the cores are maintained upright during transport and storage. Sample processing and transfer to sample containers will be performed at the field facility. Additionally, piston coring or push coring may be used if more appropriate based on sediment depths encountered. Samples will be collected according to the following segmentation scheme:

Section: Worksheet #17 Revision: 1
Date: July 2008
Quality Assurance Project Plan Lower Passaic River Restoration Project Newark, New New Jersey Page 3 of 4
QAPP Worksheet #17 (UFP-QAPP Manual Section 3.1.1) Sampling Design and Rationale
J:\Water\ProjectFiles\P120\12182_Passaic\QAPP\Rev 1_July 2008\2008_Low Res Core QAPP_2008 July 18_Rev1_worksheet1-19.doc
Depth below sediment water interface
0 to 0.5 ft surface sediment (in conjunction with grab sampling)
0.5 to 1.5 ft 1-foot segment
1.5 to 2.5 ft 1-foot segment
2.5 to 3.5 ft 1-foot segment
3.5 to 5.5 ft 2-foot segment
5.5 + 2-foot segments continue to the red-brown clay layer, sand, or refusal
Where sand is encountered as a layer that completely underlies the recent, fine-grained sediments (rather than as a shallow sand lens) it will be sampled for a subset of analytes as agreed to with USEPA. Limited analyses including PAHs, metals, cyanide, SVOCs, TPH Extractables, TOC, grain size and VOCs will be performed where sand is found at the bottom of the core. The analytes will be taken out of the primary core only, so all analytes may not be achievable in all samples.
Under certain conditions, the segmentation scheme may be altered. With the agreement of the RI FTM, where a stratigraphic change in the sediment sequence (e.g., change in sediment size, obvious depositional boundary or unconformity) occurs within a segment, the sampling of that segment may be altered. This will prevent different material types, with possibly different depositional ages, from being mixed together in the same sample. Segments will be reduced below 1-foot only where it appears that the sediment density is such that sufficient solids are present to satisfy the laboratory sample volume requirement.
In addition, per agreement with USEPA, to address a component of FSP1 Task 5.3.3, which includes the collection of fine segmentation of “core top” samples from a subset of the cores, (to address sediment transport modeling and risk assessment data needs), eight of the planned locations will sampled by box core to complete this additional analysis. The proposed core(s) segmentation and grab sampling will be completed at all locations as well. A box core will be utilized for collection of surface sediment to be split into five segments per USEPA required segments:

Section: Worksheet #17 Revision: 1
Date: July 2008
Quality Assurance Project Plan Lower Passaic River Restoration Project Newark, New New Jersey Page 4 of 4
QAPP Worksheet #17 (UFP-QAPP Manual Section 3.1.1) Sampling Design and Rationale
J:\Water\ProjectFiles\P120\12182_Passaic\QAPP\Rev 1_July 2008\2008_Low Res Core QAPP_2008 July 18_Rev1_worksheet1-19.doc
• 0 to 2 cm • 2 to 5 cm • 5 to 10 cm • 10 to 30 cm • 30 cm to 2 feet
One box core will be collected at each of the 8 locations, shown in Table 1 as the Group D analyte group. The segments will be analyzed utilizing the sample prioritization scheme found in FSP Addendum Table 3, which is based on the order requested by USEPA on March 28, 2008. One box core will be collected from each location. The analytes not available from the box core finer segmentation will be available from the core and grab samples collected at the same location.

Section: Worksheet #18 Revision: 1
Date: July 2008
Quality Assurance Project Plan Lower Passaic River Restoration Project Newark, New New Jersey Page 1 of 15
J:\Water\ProjectFiles\P120\12182_Passaic\QAPP\Rev 1_July 2008\2008_Low Res Core QAPP_2008 July 18_Rev1_worksheet1-19.doc
QAPP Worksheet #18 (UFP-QAPP Manual Section 3.1.1) Sampling Locations and Methods/SOP Requirements Table
Station Location Previous Characterization/Siting Rationale Target Core Length/Analyses NAD 83 NJ State Plane Ft
Riv
er M
ile
Station ID
Stat
ion
#
Water Depth1 (National Geodetic Vertical Datum
[NGVD] ft) Geomorphic region2 Surficial sediment
type3 Subsurface
sediment type4
Preliminary Estimate (Qualitative) erosion/
deposition5
Co-located with [Located nearby] Siting rationale 10
Estimated Length (ft)
Rationale for Target Length4
Ana
lyse
s6
Easting Northing RM 0 -2.2 Point-No-Point Reach - last dredged to 30 ft depth, 300 ft width in 1983
0.00 2008 CLRC-001 1 -25 channel silt silt over clay depositional-static [geotech 1A]
half mile transect/ determine nature and extent 10
transition from silt to clay A, B 597505 682497
0.00 2008 CLRC-002 2 -5! mudflat silt-sand Not determined
(ND) depositional-static
half mile transect/ determine nature and extent 20 initial data A 598286 683951
0.00 2008 CLRC-003 3 -5! mudflat silt-sand ND depositional-static
half mile transect/ determine nature and extent 20 initial data A 599310 685714
0.05 2008 CLRC-004 4 -19 side channel silt ND depositional
side channel sample/ determine nature and extent 20 initial data A 597078 683257
0.25 2008 CLRC-005 5 -24 channel silt ND depositional-static
lack of previous data and historical depositional area/ determine nature and extent 10 initial data A 596969 684208
0.25 2008 CLRC-006 6 -19* mudflat silt-sand ND depositional-static
lack of previous data and historical depositional area/ determine nature and extent 20 initial data A 597726 685164
0.25 2008 CLRC-007 7 -3! mudflat silt-sand ND depositional-static
lack of previous data and historical depositional area/ determine nature and extent 20 initial data A, B 598383 686011
0.35 2008 CLRC-008 8 -15 side channel silt ND depositional
side channel sample/ determine nature and extent 20 initial data A 596614 685405
0.50 2008 CLRC-009 9 -24 channel silt ND depositional-static
half mile transect/ determine nature and extent 10 initial data A 596737 686124
0.50 2008 CLRC-010 10 -4 mudflat silt-sand ND depositional-static
half mile transect/ determine nature and extent 20 initial data A 597168 686354
0.50 2008 CLRC-011 11 -3 mudflat silt-sand ND depositional-static
half mile transect/ determine nature and extent 20 initial data A 597909 686696
0.67 2008 CLRC-012 12 -12 side channel silt ND depositional [geotech 1A-B]
side channel sample/ determine nature and extent 20 initial data A 596647 687125

Section: Worksheet #18 Revision: 1
Date: July 2008
Quality Assurance Project Plan Lower Passaic River Restoration Project Newark, New New Jersey Page 2 of 15
QAPP Worksheet #18 (UFP-QAPP Manual Section 3.1.1) Sampling Locations and Methods/SOP Requirements Table
J:\Water\ProjectFiles\P120\12182_Passaic\QAPP\Rev 1_July 2008\2008_Low Res Core QAPP_2008 July 18_Rev1_worksheet1-19.doc
Station Location Previous Characterization/Siting Rationale Target Core Length/Analyses NAD 83 NJ State Plane Ft
Riv
er M
ile
Station ID
Stat
ion
#
Water Depth1 (National Geodetic Vertical Datum
[NGVD] ft) Geomorphic region2 Surficial sediment
type3 Subsurface
sediment type4
Preliminary Estimate (Qualitative) erosion/
deposition5
Co-located with [Located nearby] Siting rationale 10
Estimated Length (ft)
Rationale for Target Length4
Ana
lyse
s6
Easting Northing
0.75 2008 CLRC-013 13 -19 channel silt silt over clay depos.-static
lack of previous data and historical depositional area/ determine nature and extent 18
transition from silt to clay A 596898 687639
0.75 2008 CLRC-014 14 -3 mudflat silt-sand ND depos.-static
lack of previous data and historical depositional area/ determine nature and extent 20 initial data A 597430 687665
1.10 2008 CLRC-015 15 -5* side channel silt silt over peat or
sand depositional [Tierra 201]
half mile transect adjusted upstream due to bridge, Roanoke Ave combined sewer outfall (CSO)/ determine nature and extent/ potential source identification 10
transition from silt to peat or sand A 597193 689657
1.10 2008 CLRC-016 16 -16 channel silt silt over sand depositional-static [Tierra 202,
geotech core 2B]
half mile transect adjusted upstream due to bridge 15
transition from silt to sand or clay A 597437 689554
1.10 2008 CLRC-017 17 -7 side channel silt silt over sand depositional-static HRC5A [Tierra
Core 203]
half mile transect adjusted upstream due to bridge/ determine nature and extent/ adjusted to co-locate with high resolution core (HRC) 5A where chemistry was not completed 15
transition from silt to sand A 597667 689292
1.45 2008 CLRC-018 18 -6 side channel silt silt over sand depositional Tierra 207
[geotech 2A]
one mile transect/ determine nature and extent 15
extend Tierra core to sand or clay A 597701 691423
1.45 2008 CLRC-019 19 -17 channel silt silt depos.-static Tierra 208
[geotech 2B]
one mile transect/ determine nature and extent
5
Tierra 208 was a completed core,
therefore the recent sediments
only will be analyzed,
estimated to be 5 feet or less. A,D 597976 691370
1.45 2008 CLRC-020 20 -6 side channel silt silt over sand depositional-static
Tierra 209 [geotech 2C,
HRC7
one mile transect/ determine nature and extent 15
extend Tierra core to sand or clay A 598203 691321

Section: Worksheet #18 Revision: 1
Date: July 2008
Quality Assurance Project Plan Lower Passaic River Restoration Project Newark, New New Jersey Page 3 of 15
QAPP Worksheet #18 (UFP-QAPP Manual Section 3.1.1) Sampling Locations and Methods/SOP Requirements Table
J:\Water\ProjectFiles\P120\12182_Passaic\QAPP\Rev 1_July 2008\2008_Low Res Core QAPP_2008 July 18_Rev1_worksheet1-19.doc
Station Location Previous Characterization/Siting Rationale Target Core Length/Analyses NAD 83 NJ State Plane Ft
Riv
er M
ile
Station ID
Stat
ion
#
Water Depth1 (National Geodetic Vertical Datum
[NGVD] ft) Geomorphic region2 Surficial sediment
type3 Subsurface
sediment type4
Preliminary Estimate (Qualitative) erosion/
deposition5
Co-located with [Located nearby] Siting rationale 10
Estimated Length (ft)
Rationale for Target Length4
Ana
lyse
s6
Easting Northing
1.90 2008 CLRC-021 21 -22 channel silt silt potentially erosional Tierra 214
EPA requested location in this area due to high historical concentration and incomplete mercury inventory 15
extend Tierra core to sand or clay A,B 598324 693855
RM 2.2-4.4 Harrison Reach - last dredged to 20 ft depth, 300 ft width in 1949
2.62 2008 CLRC-022 22 -2 mudflat silt silt depositional -static Tierra 284
one mile transect (relocated due to underground gas lines and bridge crossing), co-located with Tierra 284 to complete nature and extent determination 15
silt to sand or clay transition A,D 595458 695202
2.62 2008 CLRC-023 23 -7 channel silt silt depositional [Tierra 223, HRC10A]
one mile transect (relocated due to underground gas lines and bridge crossing), located near Tierra 223 to complete nature and extent determination 15
silt to sand or clay transition A 595563 695459
2.62 2008 CLRC-024 24 -11 side channel silt silt depositional Tierra 224
one mile transect (relocated due to underground gas lines and bridge crossing), co-located with Tierra 224 to complete nature and extent determination 15
silt to clay transition A 595561 695766
2.85 2008 CLRC-025 25 -10 channel, dredge area silt silt over sand depositional Tierra 226 [LRC 1, geotech 3C]
co-located with Tierra 227 to complete nature and extent determination 10
silt to sand transition A 594361 695470
3.15 2008 CLRC-026 26 -1 side channel/mudflat silt and sand silt depositional
[Tierra grabs 2000 5sdm, 1999
5sdm]
Tierra grabs on mudflat/ determine nature and extent 15 initial data A, B 592599 695423
3.51 2008 CLRC-027 27 -11 side channel silt silt over sand erosional Tierra 234
[LRC3]
one mile transect/ co-located with Tierra 234 to complete nature and extent determination 15
silt to sand transition A 591239 694157

Section: Worksheet #18 Revision: 1
Date: July 2008
Quality Assurance Project Plan Lower Passaic River Restoration Project Newark, New New Jersey Page 4 of 15
QAPP Worksheet #18 (UFP-QAPP Manual Section 3.1.1) Sampling Locations and Methods/SOP Requirements Table
J:\Water\ProjectFiles\P120\12182_Passaic\QAPP\Rev 1_July 2008\2008_Low Res Core QAPP_2008 July 18_Rev1_worksheet1-19.doc
Station Location Previous Characterization/Siting Rationale Target Core Length/Analyses NAD 83 NJ State Plane Ft
Riv
er M
ile
Station ID
Stat
ion
#
Water Depth1 (National Geodetic Vertical Datum
[NGVD] ft) Geomorphic region2 Surficial sediment
type3 Subsurface
sediment type4
Preliminary Estimate (Qualitative) erosion/
deposition5
Co-located with [Located nearby] Siting rationale 10
Estimated Length (ft)
Rationale for Target Length4
Ana
lyse
s6
Easting Northing
3.51 2008 CLRC-028 28 -16 channel silt silt erosional Tierra 235
one mile transect/ co-located with Tierra 235 to complete nature and extent determination 10
silt to sand transition A,D 591151 694213
3.51 2008 CLRC-029 29 -16 side channel silt silt over clay erosional Tierra 236 [HRC
17]
one mile transect/ co-located with Tierra 236 to complete nature and extent determination 10
silt to sand/clay transition A 591048 694264
RM 4.4-5.8 Newark Reach - last dredged to 16 ft depth, 300 ft width in 1949
4.20 2008 CLRC-115 115 -15 side silt and sand silt depositional-static Tierra 243
EPA requested additional location for determination of nature and extent 10
silt to sand/clay transition A,D 588403 692312
4.25 2008 CLRC-030 30 -13 side channel sand and silt silt potentially erosional [Tierra 243]
one mile transect, relocated per EPA request to this area of potential high contaminant inventory 10
silt to sand/clay transition A 588236 692271
4.25 2008 CLRC-031 31 -15 channel silt silt depositional -static [Tierra 244]
one mile transect, relocated per EPA request to this area of potential high contaminant inventory 10
silt to sand/clay transition A 588233 692388
4.25 2008 CLRC-032 32 -10 side channel silt silt depositional -static [Tierra 245, LRC
5]
one mile transect, relocated per EPA request to this area of potential high contaminant inventory 15
silt to sand/clay transition A 588227 692539
5.00 2008 CLRC-033 33 -16 channel silt silt over sand static
[MPI geotech 6B, Tierra grab 9909sdu]
multiple CSOs/ potential source identification/ determine nature and extent 10
silt to sand transition A 585378 694444
5.30 2008 CLRC-034 34 -18 channel silt silt over gravel depositional-erosional [Tierra 259, LRC
7]
multiple CSOs/ potential source identification/ determine nature and extent 5
silt to gravel transition A,B,D 584862 695962

Section: Worksheet #18 Revision: 1
Date: July 2008
Quality Assurance Project Plan Lower Passaic River Restoration Project Newark, New New Jersey Page 5 of 15
QAPP Worksheet #18 (UFP-QAPP Manual Section 3.1.1) Sampling Locations and Methods/SOP Requirements Table
J:\Water\ProjectFiles\P120\12182_Passaic\QAPP\Rev 1_July 2008\2008_Low Res Core QAPP_2008 July 18_Rev1_worksheet1-19.doc
Station Location Previous Characterization/Siting Rationale Target Core Length/Analyses NAD 83 NJ State Plane Ft
Riv
er M
ile
Station ID
Stat
ion
#
Water Depth1 (National Geodetic Vertical Datum
[NGVD] ft) Geomorphic region2 Surficial sediment
type3 Subsurface
sediment type4
Preliminary Estimate (Qualitative) erosion/
deposition5
Co-located with [Located nearby] Siting rationale 10
Estimated Length (ft)
Rationale for Target Length4
Ana
lyse
s6
Easting Northing
5.50 2008 CLRC-035 35 -13 channel silt and sand silt static Tierra 262
one mile transect, downstream from Orange St. CSO/potential source determination/ confirmation of nature and extent in Tierra262 5
Tierra 262 was a completed core,
therefore the recent sediments
only will be analyzed,
estimated to be 5 feet or less. A 584733 697058
5.50 2008 CLRC-036 36 -24 side channel silt and sand silt over gravel static Tierra 261
one mile transect/ co-located with Tierra 261 to complete nature and extent determination 10
silt to gravel transition A 584571 697029
5.50 2008 CLRC-037 37 -15 side channel silt and sand silt over gravel static Tierra 263
one mile transect, downstream from New Street CSO/ potential source identification/ co-located with Tierra 263 to complete nature and extent determination 10
silt to gravel transition A 584808 697060
RM 5.8-6.8 Kearny Reach - last dredged to 16 ft depth, 300 ft width in 1950
6.00 2008 CLRC-038 38 -15 side channel silt silt static [Tierra 269]
Below 2 CSOs9 / potential source identification/ determine nature and extent 15
extend Tierra core to sand or clay A 585066 699604
6.30 2008 CLRC-039 39 -10 side channel silt silt, peat/organic
matter depositional Tierra 272
At CSO/ potential source identification/ co-located with Tierra 272 to complete nature and extent determination 15
extend Tierra core to sand or clay A 585244 701011
6.50 2008 CLRC-040 40 -16 side channel silt silt erosional-static Tierra 273
one mile transect/ co-located with Tierra 273 to complete nature and extent determination 5
Tierra 273 was a completed core,
therefore the recent sediments
only will be analyzed,
estimated to be 5 feet or less. A, B 585518 702181

Section: Worksheet #18 Revision: 1
Date: July 2008
Quality Assurance Project Plan Lower Passaic River Restoration Project Newark, New New Jersey Page 6 of 15
QAPP Worksheet #18 (UFP-QAPP Manual Section 3.1.1) Sampling Locations and Methods/SOP Requirements Table
J:\Water\ProjectFiles\P120\12182_Passaic\QAPP\Rev 1_July 2008\2008_Low Res Core QAPP_2008 July 18_Rev1_worksheet1-19.doc
Station Location Previous Characterization/Siting Rationale Target Core Length/Analyses NAD 83 NJ State Plane Ft
Riv
er M
ile
Station ID
Stat
ion
#
Water Depth1 (National Geodetic Vertical Datum
[NGVD] ft) Geomorphic region2 Surficial sediment
type3 Subsurface
sediment type4
Preliminary Estimate (Qualitative) erosion/
deposition5
Co-located with [Located nearby] Siting rationale 10
Estimated Length (ft)
Rationale for Target Length4
Ana
lyse
s6
Easting Northing
6.50 2008 CLRC-041 41 -16 channel silt silt static Tierra 274
one mile transect/ co-located with Tierra 274 to complete nature and extent determination 5
Tierra 274 was a completed core,
therefore the recent sediments
only will be analyzed,
estimated to be 5 feet or less. A 585602 702137
6.50 2008 CLRC-042 42 -14 side of wide channel silt silt static Tierra 275 [HRC
24A]
one mile transect/ co-located with Tierra 275 to complete nature and extent determination 5
Tierra 275 was a completed core,
therefore the recent sediments
only will be analyzed,
estimated to be 5 feet or less. A 585643 702116
RM 6.8-17.4 Upstream - last dredged to 16 ft depth, 200 ft width in 1950
7.00 2008 CLRC-043 43 -10 side channel sand organic material static
half mile transect/ determine nature and extent 8
red brown clay layer, sand, or
refusal11 A 586932 704435
7.00 2008 CLRC-044 44 -17 channel silt sand static
half mile transect/ determine nature and extent 8
red brown clay layer, sand, or
refusal11 A 587070 704369
7.00 2008 CLRC-045 45 -5 side channel silt organic material static
half mile transect/ determine nature and extent 8
red brown clay layer, sand, or
refusal11 A, B 587161 704313
7.45 2008 CLRC-046 46 -10 side channel silt-sand ND static geotech 8A
half mile transect adjusted to co-locate with geotech cores/ determine nature and extent 8 initial data A 587705 706679
7.45 2008 CLRC-047 47 -14 channel silt ND static geotech 8B
half mile transect adjusted to co-locate with geotech cores/ determine nature and extent 8 initial data A,D 587831 706609
7.45 2008 CLRC-048 48 -2 mudflat silt ND static geotech 8C
half mile transect adjusted to co-locate with geotech cores/ determine nature and extent 8 initial data A 587985 706484

Section: Worksheet #18 Revision: 1
Date: July 2008
Quality Assurance Project Plan Lower Passaic River Restoration Project Newark, New New Jersey Page 7 of 15
QAPP Worksheet #18 (UFP-QAPP Manual Section 3.1.1) Sampling Locations and Methods/SOP Requirements Table
J:\Water\ProjectFiles\P120\12182_Passaic\QAPP\Rev 1_July 2008\2008_Low Res Core QAPP_2008 July 18_Rev1_worksheet1-19.doc
Station Location Previous Characterization/Siting Rationale Target Core Length/Analyses NAD 83 NJ State Plane Ft
Riv
er M
ile
Station ID
Stat
ion
#
Water Depth1 (National Geodetic Vertical Datum
[NGVD] ft) Geomorphic region2 Surficial sediment
type3 Subsurface
sediment type4
Preliminary Estimate (Qualitative) erosion/
deposition5
Co-located with [Located nearby] Siting rationale 10
Estimated Length (ft)
Rationale for Target Length4
Ana
lyse
s6
Easting Northing
7.85 2008 CLRC-049 49 -11 channel silt ND erosional [HRC 26A]
Second River Joint Meeting ERP/ potential source identification/ determine nature and extent 8
red brown clay layer, sand, or
refusal11 A 589179 708327
7.95 2008 CLRC-050 50 -2 mudflat silt-sand ND depositional
half mile transect adjusted to avoid coarse gravel below Second River / determine nature and extent 8 initial data A 589357 708818
7.95 2008 CLRC-051 51 -13 channel sand ND erosional
half mile transect adjusted to avoid coarse gravel below Second River / determine nature and extent; determine vertical distribution in sediment column 8 initial data A 589473 708766
7.95 2008 CLRC-052 52 -6* side channel coarse ND depositional
half mile transect adjusted to avoid coarse gravel below Second River / determine nature and extent determine vertical distribution in sediment column 8 initial data A 589616 708721
Second River RM 8.05
8.10 2008 CLRC-053 53 -14 channel sand static
upstream of Second River/ potential source identification/ determine nature and extent 8 initial data A 589474 709581
8.45 2008 CLRC-054 54 -16 channel sand sand/gravel static
half mile transect, adjusted due to bridge and utility crossing/ determine nature and extent 8
silt to sand transition A 589586 711235
8.45 2008 CLRC-055 55 -7 side channel silt silt over sand static EMBM core 2
half mile transect, adjusted due to bridge and utility crossing/ determine nature and extent 8
silt to sand transition, MPI
core depth A,B 589694 711214

Section: Worksheet #18 Revision: 1
Date: July 2008
Quality Assurance Project Plan Lower Passaic River Restoration Project Newark, New New Jersey Page 8 of 15
QAPP Worksheet #18 (UFP-QAPP Manual Section 3.1.1) Sampling Locations and Methods/SOP Requirements Table
J:\Water\ProjectFiles\P120\12182_Passaic\QAPP\Rev 1_July 2008\2008_Low Res Core QAPP_2008 July 18_Rev1_worksheet1-19.doc
Station Location Previous Characterization/Siting Rationale Target Core Length/Analyses NAD 83 NJ State Plane Ft
Riv
er M
ile
Station ID
Stat
ion
#
Water Depth1 (National Geodetic Vertical Datum
[NGVD] ft) Geomorphic region2 Surficial sediment
type3 Subsurface
sediment type4
Preliminary Estimate (Qualitative) erosion/
deposition5
Co-located with [Located nearby] Siting rationale 10
Estimated Length (ft)
Rationale for Target Length4
Ana
lyse
s6
Easting Northing
9.00 2008 CLRC-056 56 -16 channel sand sand over silt static
half mile transect/ determine nature and extent 10
probe data silt to sand transition A 590945 713740
9.00 2008 CLRC-057 57 -2 side channel silt silt over
sand/rock likely erosional
half mile transect/ determine nature and extent 8
probe data silt to sand transition A 591108 713659
9.40 2008 CLRC-058 58 -8 side channel silt silt over sand static EMBM core 5
shoal sample (silt deposit)/ determine nature and extent determine vertical distribution in sediment column 6
silt to sand transition A 592071 715758
9.60 2008 CLRC-059 59 -16 channel silt silt over silty
sand static
half mile transect, adjusted for fine-grained deposit, at unnamed tributary9
/potential source identification/ determine nature and extent 6
silt to sand transition A 592264 716454
9.60 2008 CLRC-060 60 0* side / shoal area at
minor tributary junction sand-gravel sand, gravel static [EMBM core 6]
half mile transect, adjusted for fine-grained deposit, at unnamed tributary9
/potential source identification/ determine nature and extent 6
silt to sand transition A 592488 716442
10.00 2008 CLRC-061 61 -11 channel sand sand ND
half mile transect/ determine nature and extent determine vertical distribution in sediment column 6 initial data A 591892 718819
10.00 2008 CLRC-062 62 -5 side channel silt sandy silt ND EMBM Core 10
[HRC 13A]
half mile transect/ determine nature and extent determine vertical distribution in sediment column 15
silt to sand transition A, D 592093 718741
10.25 2008 CLRC-063 63 -12 side channel silt silt over silty
sand ND silt pocket/ determine nature and extent 6
silt to sand transition A 592082 720029
10.50 2008 CLRC-064 64 -14 channel sand static
half mile transect/ determine nature and extent 6
initial data, coarse material expected A 592228 721507

Section: Worksheet #18 Revision: 1
Date: July 2008
Quality Assurance Project Plan Lower Passaic River Restoration Project Newark, New New Jersey Page 9 of 15
QAPP Worksheet #18 (UFP-QAPP Manual Section 3.1.1) Sampling Locations and Methods/SOP Requirements Table
J:\Water\ProjectFiles\P120\12182_Passaic\QAPP\Rev 1_July 2008\2008_Low Res Core QAPP_2008 July 18_Rev1_worksheet1-19.doc
Station Location Previous Characterization/Siting Rationale Target Core Length/Analyses NAD 83 NJ State Plane Ft
Riv
er M
ile
Station ID
Stat
ion
#
Water Depth1 (National Geodetic Vertical Datum
[NGVD] ft) Geomorphic region2 Surficial sediment
type3 Subsurface
sediment type4
Preliminary Estimate (Qualitative) erosion/
deposition5
Co-located with [Located nearby] Siting rationale 10
Estimated Length (ft)
Rationale for Target Length4
Ana
lyse
s6
Easting Northing
10.50 2008 CLRC-065 65 -1* side shoal sand likely static
half mile transect/ determine nature and extent 6
initial data, coarse material expected A 592388 721477
10.94 2008 CLRC-066 66 -11 channel sand sand depositional [SedFlume RM10.9]
half mile transect9 / determine nature and extent determine vertical distribution in sediment column 6 initial data A 593072 723331
10.94 2008 CLRC-067 67 -1* mud flat silt silt over sand static EMBM core 14
[HRC 29A]
half mile transect9 / determine nature and extent determine vertical distribution in sediment column 6
silt to sand transition A, B 593181 723166
Third River RM 11.2
11.30 2008 CLRC-068 68 -9 side channel silt and sand silt over gravel depositional EMBM core 17 [geotech 12B]
upstream of Third River9 / potential source identification/ determine nature and extent determine vertical distribution in sediment column 6
silt to gravel transition A 595000 724016
11.50 2008 CLRC-069 69 -9 side channel silt and sand sandy silt over
sand depositional
half mile transect/ determine nature and extent 6
silt to sand transition A 595819 724484
11.50 2008 CLRC-070 70 -9 side channel sand and gravel ND depositional
half mile transect, downstream of Rutherford Ave CSO/ potential source identification / determine nature and extent 6 initial data A 595944 724353
11.95 2008 CLRC-071 71 -14 channel sand ND erosional
half mile transect/ determine nature and extent 4
initial data - coarse material expected A 596759 726685
11.95 2008 CLRC-072 72 -13 channel sand ND depositional
half mile transect/ determine nature and extent 4
initial data - coarse material expected A 596854 726667
12.30 2008 CLRC-073 73 -8 side channel silt silt over sand depositional HRC 1A [EMBM
cores 18, 20]
examination of results at location of previous cluster of cores to confirm the determination of nature and extent 6 transition to sand A,B 596913 728361

Section: Worksheet #18 Revision: 1
Date: July 2008
Quality Assurance Project Plan Lower Passaic River Restoration Project Newark, New New Jersey Page 10 of 15
QAPP Worksheet #18 (UFP-QAPP Manual Section 3.1.1) Sampling Locations and Methods/SOP Requirements Table
J:\Water\ProjectFiles\P120\12182_Passaic\QAPP\Rev 1_July 2008\2008_Low Res Core QAPP_2008 July 18_Rev1_worksheet1-19.doc
Station Location Previous Characterization/Siting Rationale Target Core Length/Analyses NAD 83 NJ State Plane Ft
Riv
er M
ile
Station ID
Stat
ion
#
Water Depth1 (National Geodetic Vertical Datum
[NGVD] ft) Geomorphic region2 Surficial sediment
type3 Subsurface
sediment type4
Preliminary Estimate (Qualitative) erosion/
deposition5
Co-located with [Located nearby] Siting rationale 10
Estimated Length (ft)
Rationale for Target Length4
Ana
lyse
s6
Easting Northing
12.55 2008 CLRC-074 74 -3 channel sand-gravel silt over sand static HRC 32A
half mile transect, downstream of McDonald Brook/ potential source determination/ determine nature and extent 3
high resolution core was
complete, coarse material expected A 596404 729621
12.55 2008 CLRC-075 75 -16 channel gravel silty sand static
half mile transect, downstream of McDonald Brook/ potential source determination/ determine nature and extent 6
initial data - coarse material expected A 596522 729656
12.85 2008 CLRC-076 76 -14 side channel silt-sand sand static
half mile transect, adjusted due to bridge, upstream of McDonald Brook/ determine nature and extent 4
initial data - coarse material expected A 596110 731058
12.85 2008 CLRC-077 77 -13 side channel silt-sand sand depositional
half mile transect, adjusted due to bridge, upstream of McDonald Brook/ determine nature and extent 4
initial data - coarse material expected A 596225 731023
13.23 2008 CLRC-078 78 -10 side channel silt and sand sand and silty
sand likely erosional
EPA requested location, area coverage9 / determine nature and extent 6 initial data A,D 596800 732963
13.60 2008 CLRC-079 79 -10 side channel silty sand silty sand erosional [geotech 14B]
half mile transect/ determine nature and extent 6 initial data A 597243 734738
13.60 2008 CLRC-080 80 -12 side channel silty sand silty sand erosional [geotech 14C]
half mile transect, adjusted to siltier area/ determine nature and extent 6 initial data A 597368 734715
14.10 2008 CLRC-081 81 -16 channel sand silt sand static
half mile transect, 3 CSOs9 / potential source identification/ determine nature and extent 6 probing depth A 597321 737374
14.10 2008 CLRC-082 82 0 mudflat silt and sand silt over sand likely static
half mile transect, 3 CSOs9 / potential source identification/ determine nature and extent 6 probing depth A, B 597457 737355

Section: Worksheet #18 Revision: 1
Date: July 2008
Quality Assurance Project Plan Lower Passaic River Restoration Project Newark, New New Jersey Page 11 of 15
QAPP Worksheet #18 (UFP-QAPP Manual Section 3.1.1) Sampling Locations and Methods/SOP Requirements Table
J:\Water\ProjectFiles\P120\12182_Passaic\QAPP\Rev 1_July 2008\2008_Low Res Core QAPP_2008 July 18_Rev1_worksheet1-19.doc
Station Location Previous Characterization/Siting Rationale Target Core Length/Analyses NAD 83 NJ State Plane Ft
Riv
er M
ile
Station ID
Stat
ion
#
Water Depth1 (National Geodetic Vertical Datum
[NGVD] ft) Geomorphic region2 Surficial sediment
type3 Subsurface
sediment type4
Preliminary Estimate (Qualitative) erosion/
deposition5
Co-located with [Located nearby] Siting rationale 10
Estimated Length (ft)
Rationale for Target Length4
Ana
lyse
s6
Easting Northing
14.20 2008 CLRC-083 83 -16 channel sand silty sand depositional [geotech core
15B]
Weasel Brook (Dundee Canal)9 / potential source identification/ determine nature and extent 6 initial data A 597459 737973
14.20 2008 CLRC-084 84 -5 mudflat silt and sand silty sand depositional
[SedFlume RM14.2,geotech
core 15C]
Weasel Brook (Dundee Canal)9 / potential source identification/ determine nature and extent 8 silt over sand A 597562 737988
14.81 2008 CLRC-085 85 -4 side channel sand ND likely static
area coverage/ determine nature and extent 6 initial data A 599480 736942
15.10 2008 CLRC-086 86 -6 uniform shallow
channel sand ND ND
half mile transect, adjusted upstream away from bridge/ determine nature and extent 6
initial data, coarse material expected A 600476 737112
15.10 2008 CLRC-087 87 -6 uniform shallow
channel sand ND ND
half mile transect, adjusted upstream away from bridge/ determine nature and extent 6
initial data, coarse material expected A 600623 737046
15.50 2008 CLRC-088 88 -5 uniform shallow
channel sand ND ND
half mile transect, downstream of Saddle River/ potential source identification/ determine nature and extent 6
initial data, coarse material expected A, B 600699 739256
15.50 2008 CLRC-089 89 -1 bar/flat gravel ND ND
half mile transect, downstream of Saddle River/ potential source identification/ determine nature and extent 6
initial data, coarse material expected A 600861 739285
Saddle River RM 15.5
15.64 2008 CLRC-090 90 0 bar sand ND ND
upstream of Saddle River, downstream of Dundee Island lateral CSO/ potential source identification/ determine nature and extent 6 initial data A 600361 739764

Section: Worksheet #18 Revision: 1
Date: July 2008
Quality Assurance Project Plan Lower Passaic River Restoration Project Newark, New New Jersey Page 12 of 15
QAPP Worksheet #18 (UFP-QAPP Manual Section 3.1.1) Sampling Locations and Methods/SOP Requirements Table
J:\Water\ProjectFiles\P120\12182_Passaic\QAPP\Rev 1_July 2008\2008_Low Res Core QAPP_2008 July 18_Rev1_worksheet1-19.doc
Station Location Previous Characterization/Siting Rationale Target Core Length/Analyses NAD 83 NJ State Plane Ft
Riv
er M
ile
Station ID
Stat
ion
#
Water Depth1 (National Geodetic Vertical Datum
[NGVD] ft) Geomorphic region2 Surficial sediment
type3 Subsurface
sediment type4
Preliminary Estimate (Qualitative) erosion/
deposition5
Co-located with [Located nearby] Siting rationale 10
Estimated Length (ft)
Rationale for Target Length4
Ana
lyse
s6
Easting Northing
16.00 2008 CLRC-091 91 -2 uniform shallow
channel gravel and sand ND ND [geotech 16A]
half mile transect/ determine nature and extent 6 initial data A 599354 741319
16.00 2008 CLRC-092 92 -2 uniform shallow
channel gravel and sand ND ND [geotech 16C]
half mile transect/ determine nature and extent 6 initial data A 599463 741354
16.50 2008 CLRC-093 93 1 uniform shallow
channel gravel and sand ND ND
half mile transect, downstream of Fleischer Brook/ determine nature and extent 6 initial data A 598434 743699
16.50 2008 CLRC-094 94 2 uniform shallow
channel gravel and sand ND ND
half mile transect, downstream of Fleischer Brook/ determine nature and extent 6 initial data A 598547 743747
17.10 2008 CLRC-095 95 4* uniform shallow
channel gravel and sand ND ND
half mile transect, adjusted north of river and island/ determine nature and extent 6 initial data A 596669 746040
17.10 2008 CLRC-096 96 3* uniform shallow
channel gravel and sand ND ND
half mile transect, adjusted north of river and island/ determine nature and extent 6 initial data A 596784 746212
17.35 2008 CLRC-097 97 10* uniform shallow
channel gravel and sand ND ND
uppermost LPR, below dam/ determine nature and extent 6 initial data A 595533 746798
Above Dundee Dam
>17.4 2008 CLRC-098 98 ND Lake silt and organic
matter ND ND
Dundee Lake7 /potential upgradient source identification/ determine nature and extent 8 initial data A 595077 747203
>17.4 2008 CLRC-099 99 ND Lake silt and organic
matter ND ND
Dundee Lake7 /potential upgradient source identification/ determine nature and extent 8 initial data A 594943 747037
>17.4 2008 CLRC-100 100 ND Lake silt and organic
matter ND ND
Dundee Lake, CSO (Garden state paper) 7
/ potential upgradient source identification/determine nature and extent 8 initial data A, B 594601 747934

Section: Worksheet #18 Revision: 1
Date: July 2008
Quality Assurance Project Plan Lower Passaic River Restoration Project Newark, New New Jersey Page 13 of 15
QAPP Worksheet #18 (UFP-QAPP Manual Section 3.1.1) Sampling Locations and Methods/SOP Requirements Table
J:\Water\ProjectFiles\P120\12182_Passaic\QAPP\Rev 1_July 2008\2008_Low Res Core QAPP_2008 July 18_Rev1_worksheet1-19.doc
Station Location Previous Characterization/Siting Rationale Target Core Length/Analyses NAD 83 NJ State Plane Ft
Riv
er M
ile
Station ID
Stat
ion
#
Water Depth1 (National Geodetic Vertical Datum
[NGVD] ft) Geomorphic region2 Surficial sediment
type3 Subsurface
sediment type4
Preliminary Estimate (Qualitative) erosion/
deposition5
Co-located with [Located nearby] Siting rationale 10
Estimated Length (ft)
Rationale for Target Length4
Ana
lyse
s6
Easting Northing
>17.4 2008 CLRC-101 101 ND Lake silt and organic
matter ND ND
Dundee Lake7 /potential upgradient source identification/ determine nature and extent 8 initial data A 594316 747817
>17.4 2008 CLRC-102 102 ND Lake silt and organic
matter ND ND
Dundee Lake7 /potential upgradient source identification/ determine nature and extent 8 initial data A 594035 747696
>17.4 2008 CLRC-103 103 ND Lake silt and organic
matter ND ND
Dundee Lake behind Island (backwater)/ potential upgradient source identification/ determine nature and extent 8 initial data A 594080 748441
>17.4 2008 CLRC-104 104 ND Lake silt and organic
matter ND ND
Dundee Lake7 /potential upgradient source identification/ determine nature and extent 8 initial data A 594346 751403
Tributaries
8.05T 2008 CLRC-105 105 ND Tributary ND ND ND
Second River, above HOT8 / potential source identification/ determine nature and extent 3 initial data A ND ND
8.05T 2008 CLRC-106 106 ND Tributary ND ND ND
Second River, below HOT8 / potential source identification/ determine nature and extent 3 initial data A ND ND
8.05T 2008 CLRC-107 107 ND Tributary ND ND ND
Second River, below HOT8 / potential source identification/ determine nature and extent 3 initial data A ND ND
9.60 2008 CLRC-114 114 ND Tributary ND ND ND Unnamed tributary above HOT 3 initial data A ND ND
11.2T 2008 CLRC-108 108 ND Tributary ND ND ND
Third River, above HOT8 / potential source identification/ determine nature and extent 3 initial data A ND ND

Section: Worksheet #18 Revision: 1
Date: July 2008
Quality Assurance Project Plan Lower Passaic River Restoration Project Newark, New New Jersey Page 14 of 15
QAPP Worksheet #18 (UFP-QAPP Manual Section 3.1.1) Sampling Locations and Methods/SOP Requirements Table
J:\Water\ProjectFiles\P120\12182_Passaic\QAPP\Rev 1_July 2008\2008_Low Res Core QAPP_2008 July 18_Rev1_worksheet1-19.doc
Station Location Previous Characterization/Siting Rationale Target Core Length/Analyses NAD 83 NJ State Plane Ft
Riv
er M
ile
Station ID
Stat
ion
#
Water Depth1 (National Geodetic Vertical Datum
[NGVD] ft) Geomorphic region2 Surficial sediment
type3 Subsurface
sediment type4
Preliminary Estimate (Qualitative) erosion/
deposition5
Co-located with [Located nearby] Siting rationale 10
Estimated Length (ft)
Rationale for Target Length4
Ana
lyse
s6
Easting Northing
11.2T 2008 CLRC-109 109 ND Tributary ND ND ND
Third River, below HOT8 / potential source identification/ determine nature and extent 3 initial data A ND ND
11.2T 2008 CLRC-110 110 ND Tributary ND ND ND
Third River, below HOT8 / potential source identification/ determine nature and extent 3 initial data A ND ND
15.5T 2008 CLRC-111 111 ND Tributary ND ND ND
Saddle River, above HOT8 / potential source identification/ determine nature and extent 3 initial data A ND ND
15.5T 2008 CLRC-112 112 ND Tributary ND ND ND
Saddle River, below HOT8 / potential source identification/ determine nature and extent 3 initial data A ND ND
15.5T 2008 CLRC-113 113 ND Tributary ND ND ND
Saddle River, below HOT8 / potential source identification/ determine nature and extent 3 initial data A ND ND
Notes:
CLRC – CPG Low Resolution Core 1Water depths from CPG 2007 bathymetry surveys except where noted: ! = estimated from NOAA Chart 12337, * = MPI 2004 bathymetry survey (2.4 ft subtracted from mean low water (MLW) values to achieve National Geodetic Vertical Datum (NGVD)) 2Geomorphic region approximated from MPI 2004 bathymetry. ND = No data 3Surficial sediment types as mapped by ASI Geophysical Survey, Spring 2005 (MPI CSM, Feb 2007); except where identified as "assumed," where sediment types were based on inference from bathymetry and location within river. ND = No data 4Geology and depth to refusal based on MPI Probing Survey (2007) and MPI coring results (geotechnical, high resolution, low resolution, and limited 2008 coring data), Tierra Solutions Inc. (1995 coring data) and morpholologic setting for each location. Additionally, if core complete, then proposing sampling of recent sediments only. 5Erosion/deposition evaluated from MPI erosion/deposition analysis developed from several sets of bathymetry data (MPI 2007). ND = No data 6Analyses - Refer to complete list of analytes in Table 2 A - Base analyte list for all samples in Table 2 B - Additional chemical and biological analyses in Table 2, including TVPH, methylmercury, hexavalent chromium, AVS/SEM, P, N, coliforms, and Giardia C - Additional physical analyses in Table 2, including size-density classification, microscopy, petrography, PCB sediment-water partitioning. Samples will be identified by laboratory following laboratory screening of PCB concentration. D - Fine-segmentation of 0-20/24 inch upper layer 7Dundee Lake locations will be finalized following confirmation of previous sample locations. 8Head-of-Tide (HOT) as specified by NJDEP (1986), locations may be adjusted in the field during the sampling effort.

Section: Worksheet #18 Revision: 1
Date: July 2008
Quality Assurance Project Plan Lower Passaic River Restoration Project Newark, New New Jersey Page 15 of 15
QAPP Worksheet #18 (UFP-QAPP Manual Section 3.1.1) Sampling Locations and Methods/SOP Requirements Table
J:\Water\ProjectFiles\P120\12182_Passaic\QAPP\Rev 1_July 2008\2008_Low Res Core QAPP_2008 July 18_Rev1_worksheet1-19.doc
9 Location requires field examination and possible relocation if subsurface utility lines are present. 10 All locations will be evaluated for physical characteristic data to combine with other measures of sediment stability for evaluation of sediment transport in the RI/FS. 11The underlying sands and will be sampled and analyzed for PAHs, metals, cyanide, SVOCs, TPH Extractables, TOC, grain size, and VOCs. As agreed to with EPA, the analytes will be taken out of the primary core only, so all analytes may not be achievable in all samples. 12 Target core length/ analyses are estimated only for the purpose of estimating the number of samples for Worksheet #20. The estimated target depth was determined by reviewing available core logs and MPI Probing data, which included depth to refusal. The cores will be collected to the red brown clay layer, sand or refusal.

Section: Worksheet #19 Revision: 1
Date: July 2008
Quality Assurance Project Plan Phase I RI Low Resolution Coring/Sediment Sampling Lower Passaic River Restoration Project Newark, New Jersey Page 1 of 6
J:\Water\ProjectFiles\P120\12182_Passaic\QAPP\Rev 1_July 2008\2008_Low Res Core QAPP_2008 July 18_Rev1_worksheet1-19.doc
QAPP Worksheet #19 (UFP-QAPP Manual Section 3.1.1) Analytical SOP Requirements Table
Matrix Analytical
Group Concentration
Level
Analytical and Preparation Method/SOP Referencea Sample Sizeb
Containers (number, size,
and type) Preservation
Requirements
Maximum Holding Timec
(preparation/ analysis)
Sediment VOCs Low L-1 4 x 10 gramg
2 40mL VOA vials: (NaHSO4) + 1 40mL VOA vial (MeOH). 1 vial (unpreserved) collected for % solids. Note: Vials containing DI water will be used for low-level samples if NaHSO4 samples efferversce.
0-6°C; store in the dark
Field preservation upon collection (MeOH or NaHSO4); 48 hours to preservation in laboratory if unpreserved vials used; 14 calendar days to preparation and analysis
Sediment SVOCs Low L-2, L-3 125 g minimum 8 ounce (oz) wide-mouth glass jar
0-6°C; store in the dark
14 calendar days to preparatione; 40 calendar days from preparation to analysis
Sediment PAHs-HRGC/ LRMS-SIM Low L-6 45 g minimum 8 oz wide mouth
glass jar
During shipment: 0-6°C; store in the dark Upon arrival at lab: store at <-10°C in the dark h
14 calendar days to preparatione,f; 40 calendar days from preparation to analysis
Sediment Organochlorine Pesticides (GC/ECD)
Low L-2, L-4 125 g minimum 8 oz wide mouth glass jar
0-6°C; store in the dark
14 calendar days to preparatione,g; 40 calendar days from preparation to analysis

Section: Worksheet #19 Revision: 1
Date: July 2008
Quality Assurance Project Plan Phase I RI Low Resolution Coring/Sediment Sampling Lower Passaic River Restoration Project Newark, New Jersey Page 2 of 6
QAPP Worksheet #19 (UFP-QAPP Manual Section 3.1.1) Analytical SOP Requirements Table
J:\Water\ProjectFiles\P120\12182_Passaic\QAPP\Rev 1_July 2008\2008_Low Res Core QAPP_2008 July 18_Rev1_worksheet1-19.doc
Matrix Analytical
Group Concentration
Level
Analytical and Preparation Method/SOP Referencea Sample Sizeb
Containers (number, size,
and type) Preservation
Requirements
Maximum Holding Timec
(preparation/ analysis)
Sediment Organochlorine Pesticides (HRGC/HRMS)
Low L-15 40 g minimum 4 oz wide mouth glass jar
During shipment: 0-6°C; store in the dark; upon arrival at lab: store at <-10°C in the dark h
365 calendar days for preparation and analysis
Sediment PCBs (Aroclors) Low L-2, L-5 50 g minimum 8 oz wide mouth glass
0-6°C; store in the dark
14 calendar days to preparation e, i; 40 calendar days from preparation to analysis
Sediment PCBs (Homologs and Congeners) Low L-7 45 g minimum 8 oz wide mouth
glass
During shipment: 0-6°C; store in the dark; upon arrival at lab: store at <-10°C in the dark h
365 calendar days for preparation and analysis
Sediment Herbicides Low L-11, L-12 50 g 4 oz wide mouth glass
0-6°C; store in the dark
14 calendar days to preparation; 40 calendar days from preparation to analysis
Sediment TPH-Extractables Low L-13 100 g 8 oz wide mouth
glass 0-6°C; store in the dark
14 calendar days to preparation; 40 calendar days from preparation to analysis

Section: Worksheet #19 Revision: 1
Date: July 2008
Quality Assurance Project Plan Phase I RI Low Resolution Coring/Sediment Sampling Lower Passaic River Restoration Project Newark, New Jersey Page 3 of 6
QAPP Worksheet #19 (UFP-QAPP Manual Section 3.1.1) Analytical SOP Requirements Table
J:\Water\ProjectFiles\P120\12182_Passaic\QAPP\Rev 1_July 2008\2008_Low Res Core QAPP_2008 July 18_Rev1_worksheet1-19.doc
Matrix Analytical
Group Concentration
Level
Analytical and Preparation Method/SOP Referencea Sample Sizeb
Containers (number, size,
and type) Preservation
Requirements
Maximum Holding Timec
(preparation/ analysis)
Sediment TPH-Purgeables Low L-14 3 x 10 g
2 40mL VOA vials (DI water) + 1 40mL VOA vial (MeOH). 1 vial (unpreserved) collected for % solids.
0-6°C; store in the dark
Field preservation upon collection (MeOH); 48 hours to freezing in the laboratory for DI water vials; 14 calendar days for preparation and analysis
Sediment Dioxins/Furans Low L-35 20 g 2 oz wide mouth glass
During shipment: 0-6°C; store in the dark; upon arrival at lab: store at <-10°C in the dark h
365 calendar days for preparation and analysis
Sediment Radiochemistry (Be-7, Cs-137, Pb-210, K-40)
Low L-9, L-10 500 g 8 oz wide mouth glass or plastic
0-6°C; store in the dark
180 calendar days (6 months) for preparation and analysis, EXCEPT 30 days for Be-7
Sediment Radiochemistry Be-7 only
Low L-9, L-10 100 g 8 oz wide mouth glass or plastic
0-6°C; store in the dark
30 days to analysis
Sediment Metals Low L-16, L-17, L-18, L-19
20 g 8 oz wide mouth glass 0-6°C
180 calendar days (6 months) for preparation and analysis EXCEPT mercury and hexavalent chromium

Section: Worksheet #19 Revision: 1
Date: July 2008
Quality Assurance Project Plan Phase I RI Low Resolution Coring/Sediment Sampling Lower Passaic River Restoration Project Newark, New Jersey Page 4 of 6
QAPP Worksheet #19 (UFP-QAPP Manual Section 3.1.1) Analytical SOP Requirements Table
J:\Water\ProjectFiles\P120\12182_Passaic\QAPP\Rev 1_July 2008\2008_Low Res Core QAPP_2008 July 18_Rev1_worksheet1-19.doc
Matrix Analytical
Group Concentration
Level
Analytical and Preparation Method/SOP Referencea Sample Sizeb
Containers (number, size,
and type) Preservation
Requirements
Maximum Holding Timec
(preparation/ analysis)
Sediment Low Level Mercury Low L-36 20 g 2 oz wide mouth
glass
0-6°C during shipment; ≤ -15°C in lab
28 calendar days to analysis
Sediment Methyl Mercury Low L-37 10 g 2 oz wide mouth glass
0-6°C during shipment; ≤ -15°C in lab
28 calendar days to analysis
Sediment Hexavalent Chromium Low L-34 20 g 2 oz wide mouth
glass 0-6°C
30 calendar days to preparation; 7 calendar days from preparation to analysis
Sediment Butyltin Low L-20, L-21 20 g 8 oz wide mouth glass 0-6°C
14 calendar days to preparation; 40 calendar days from preparation to analysis
Sediment AVS/SEM Low L-22 20 g 2 oz wide mouth glass
0-6°C, minimize headspace
AVS: evolution within 14 calendar days; analysis within 24 hours of evolution. SEM: analysis within 14 calendar days of extraction
Sediment Ammonia Low L-23 20 g 8 oz wide mouth glass 0-6°C
7 calendar days to extraction; extracts preserved by lab with 9N sulfuric acid; 28 calendar days to analysis

Section: Worksheet #19 Revision: 1
Date: July 2008
Quality Assurance Project Plan Phase I RI Low Resolution Coring/Sediment Sampling Lower Passaic River Restoration Project Newark, New Jersey Page 5 of 6
QAPP Worksheet #19 (UFP-QAPP Manual Section 3.1.1) Analytical SOP Requirements Table
J:\Water\ProjectFiles\P120\12182_Passaic\QAPP\Rev 1_July 2008\2008_Low Res Core QAPP_2008 July 18_Rev1_worksheet1-19.doc
Matrix Analytical
Group Concentration
Level
Analytical and Preparation Method/SOP Referencea Sample Sizeb
Containers (number, size,
and type) Preservation
Requirements
Maximum Holding Timec
(preparation/ analysis)
Sediment Cyanide Low L-24, L-25 20 g 8 oz wide mouth glass 0-6°C 14 calendar days to
analysis.
Sediment Total Kjeldahl Nitrogen Low L-27 20 g 8 oz wide mouth
glass 0-6°C None established for soils/sediments
Sediment Total Phosphorus Low L-26 20 g 8 oz wide mouth
glass 0-6°C 28 calendar days to analysis
Sediment TOC Low L-28 20 g 8 oz wide mouth glass 0-6°C 28 calendar days to
analysis
Sediment Total Sulfide Low-High L-30 20 g 2 oz wide mouth glass
Fill jar completely with sediment. Pour 10 mL NaOH/Zinc Acetate solution over the top of the sample. Ship on ice 0-6°C
7 calendar days to analysis
Sediment Grain Size N/A L-31 250 gc 16 oz wide mouth glass 0-6°C None established
Sediment Atterberg Limits N/A L-32 See footnote d Included in above 0-6°C None established Sediment Specific Gravity N/A L-33 See footnote d Included in above 0-6°C None established
Sediment E. coli Low -High L-38 100 g 4 oz glass or plastic, sterile container
ice, 0-10°C; not frozen, store in the dark
30 hours to analysis
Sediment Giardia Low- High L-39 100 g 4 oz glass or plastic, sterile container
ice, 0-20°C; not frozen, store in the dark
96 hours to analysis

Section: Worksheet #19 Revision: 1
Date: July 2008
Quality Assurance Project Plan Phase I RI Low Resolution Coring/Sediment Sampling Lower Passaic River Restoration Project Newark, New Jersey Page 6 of 6
QAPP Worksheet #19 (UFP-QAPP Manual Section 3.1.1) Analytical SOP Requirements Table
J:\Water\ProjectFiles\P120\12182_Passaic\QAPP\Rev 1_July 2008\2008_Low Res Core QAPP_2008 July 18_Rev1_worksheet1-19.doc
a Refer to Worksheet #23 for SOP titles, SOP L-40 (CAS) or L-43 (TestAmerica), Percent Solids, applies to all sediment analyses performed by the referenced laboratory.
b Sample size is the minimum requested by each laboratory to perform the requested analysis; minimum sample size requirements reflect the additional sample needed permit the lab to obtain a dry aliquot of sufficient size to reach project QL goals assuming samples may contain up to 50% moisture. Additional sample volume is need for field QC samples (e.g., matrix spikes)
c Begins at time of collection of core, grab, or boxcore d 250 g includes sufficient sample to perform Grain Size, Atterberg Limits, and Specific Gravity e Samples will be frozen at the laboratory (< -10°C) after aliquot is removed for extraction. f The holding time for frozen samples is extended to 100 days per MPI QAPP modification (January 2007)
g The holding time for frozen samples is extended to 299 days per MPI QAPP modification (January 2007) h Samples will be stored frozen (< -10°C) and in the dark after receipt and log-in at the laboratory. When samples are scheduled for extraction, they will be removed from the freezer and allowed to thaw at room temperature until at a consistency where the sample can be mixed and a representative aliquot taken for analysis. The time samples are removed from the freezer and the time the remaining sample is returned to storage will be recorded; extraction will begin within 8 hours of the time samples are removed from the freezer.
i The holding time for frozen samples is extended to 365 days per MPI QAPP modification (January 2007).

Section: Worksheet #20 Revision: 1
Date: July 2008
Quality Assurance Project Plan Phase I RI Low Resolution Coring/Sediment Sampling Lower Passaic River Restoration Project Newark, New Jersey Page 1 of 3
J:\Water\ProjectFiles\P120\12182_Passaic\QAPP\Rev 1_July 2008\2008_Low Res Core QAPP_2008 July 18_Rev1_worksheets20-37_DQOs.doc
QAPP Worksheet #20 (UFP-QAPP Manual Section 3.1.1) Field Quality Control Sample Summary Table
Matrix Analytical Group Conc. Level
Analytical and Preparation SOP
Reference a
No. of Sampling Locations
(No. of Samples)b
No. of Field Replicatesc
No. of Rinsate Blanks d
No. of PE Samplese
Total No. of Samples to Lab
Sediment Volatile Organics Low L-1 115 (345)f, g 18 24 1 388 Sediment Semivolatile Organics Low L-2, L-3 115 (695) 35 25 1 756
Sediment PAHs-
HRGC/LRMS-SIM Low L-6 115 (695) 35 25 1 756
Sediment Organochlorine
Pesticides (GC/ECD) Low L-2, L-4, L-56 115 (605) 31 24 1 661
Sediment
Organochlorine Pesticides
(HRGC/HRMS) Low L-15, L-42
115 (645) 33 25 1 704 Sediment PCBs (Aroclors) Low L-2, L-5 115 (645) 33 25 1 704
Sediment PCBs (Homologs and
Congeners) Low L-7 115 (645) 33 25 1 704 Sediment Herbicides Low L-11, L-12 115 (645) 33 25 1 704 Sediment TPH Extractables Low L-13 115 (695) 35 25 1 756 Sediment TPH Purgeables Low L-14 13 (13)g,h 1 12 1 27 Sediment Dioxins/Furans Low L-35 115 (645) 33 25 1 704
Sediment Be-7 Low L-9, L-10 115 (230)h 12 0 None
Identified 242
Sediment Cs-137, Pb-210, K-40 Low L-9, L-10 115 (490) 25 0 None
Identified 515 Sediment TAL Metals, Titanium Low L-16, L-17, L-18, L-19 115 (695) 35 25 1 756 Sediment Metals (Cu and Ni) Low L-16, L-17, L-18, L-19 115 (115) 6 24 1 146 Sediment Low Level Mercury Low-High L-36 115 (695) 35 25 1 756 Sediment Methyl Mercury Low L-37 13 (13)h 1 12 1 27 Sediment Hexavalent Chromium Low L-34 13 (13)h 1 24 1 39 Sediment Butyltins Low L-21 115 (645) 33 25 1 704

Section: Worksheet #20 Revision: 1
Date: July 2008
Quality Assurance Project Plan Phase I RI Low Resolution Coring/Sediment Sampling Lower Passaic River Restoration Project Newark, New Jersey Page 2 of 3
QAPP Worksheet #20 (UFP-QAPP Manual Section 3.1.1) Field Quality Control Sample Summary Table
J:\Water\ProjectFiles\P120\12182_Passaic\QAPP\Rev 1_July 2008\2008_Low Res Core QAPP_2008 July 18_Rev1_worksheets20-37_DQOs.doc
Matrix Analytical Group Conc. Level
Analytical and Preparation SOP
Reference a
No. of Sampling Locations
(No. of Samples)b
No. of Field Replicatesc
No. of Rinsate Blanks d
No. of PE Samplese
Total No. of Samples to Lab
Sediment AVS/SEM Low L-22 13 (13)h 1 NA None
identified 14 Sediment Ammonia Low L-23 13 (13)h 1 24 1 39 Sediment Cyanide Low L-24, L-25 115 (695) 35 24 1 755 Sediment TKN Low L-27 13 (13)h 1 24 1 39 Sediment Total Phosphorus Low L-26 13 (13)h 1 24 1 39 Sediment TOC Low L-28 115 (695) 35 24 1 755 Sediment Total Sulfide Low-High L-30 115 (115)h 6 24 1 146 Sediment Grain Size N/A L-31 115 (695) 35 NA 1 731
Sediment Atterberg Limits N/A L-32 115 (605) 31 NA None
Identified 636 Sediment Specific Gravity N/A L-33 115 (605) 31 NA 1 637 Sediment E. Coli Low-High L-38, L-38a 13 (13)h 1 0 1 15
Sediment Giardia Low L-39, L-39a 13 (13)h 1 0 None
Identified 14
Sediment Percent Moisture High
L-40, L-43, L-48, L-49, L-50, L-51, L-52,
L-53, L-54, L-55 115 (605) 31 NA 1 637

Section: Worksheet #20 Revision: 1
Date: July 2008
Quality Assurance Project Plan Phase I RI Low Resolution Coring/Sediment Sampling Lower Passaic River Restoration Project Newark, New Jersey Page 3 of 3
QAPP Worksheet #20 (UFP-QAPP Manual Section 3.1.1) Field Quality Control Sample Summary Table
J:\Water\ProjectFiles\P120\12182_Passaic\QAPP\Rev 1_July 2008\2008_Low Res Core QAPP_2008 July 18_Rev1_worksheets20-37_DQOs.doc
a. Refer to Worksheet #23 for SOP title b. The estimated number of samples was based on the following assumptions:
A surface grab sample and core(s) will be taken at each location. Except as noted, samples will be collected from the grab (0 to 0.5 ft) and from core intervals 0.0 to 0.5 ft, 0.5 to 1.5 ft, 1.5 to 2.5 ft, 2.5 to 3.5 ft, and at 2-ft intervals to the bottom of the core. The cores will be collected to the red brown clay layer, sand or refusal. If red-brown sand is encountered at the bottom of the core, a sample will be collected and analyzed for PAHs, TAL metals, Titanium, low-level Hg, cyanide, SVOCs, TPH - extractables, TOC, grain size and VOCs (as allowed by the available sample volume). The estimated maximum number of samples per analyses is based on the assumed target core depth (Worksheet #18) and analytical suite for each location (Table 2 of the FSP Addendum), and assumes that sand will be encountered and sampled for all parameters at 50 locations.
Additionally, a box core will be utilized at 8 locations to collect sediment samples to be split into 5 finer segments (see previous discussion in Worksheet #14) and analyzed for the Group D analyte group shown in Table 3 of the FSP Addendum. For the purpose of estimating sample numbers, a total of 40 samples from the boxcore effort was assumed.
c. Field duplicates will be collected at a frequency of 1 per 20 samples unless noted otherwise. d. Equipment rinsate blanks will be collected at a frequency of one per week per sampling team for each set of decontaminated equipment
utilized for a particular task (for example, grab sampling, core collection, boxcore collection, and sample processing in the facility). One equipment rinsate blank per task was assumed, based on a 12-week field program, with the exception of the boxcore sampling, which was assumed to be one week in duration.
e. PE (also known as Proficiency Testing) Samples will be obtained from National Institute of Standards and Technology (NIST) or R.T.Corporation. These samples will be sent to the laboratories in advance of field sample collection. Note that these samples should not be confused with standard reference material (SRM) or CRM samples which are analyzed at laboratories as part of their method or on-going QC programs.
f. VOC samples will be collected as discrete, nonhomogenized samples at three depths: 0 to 0.5 ft (grab); 2.5 to 3.5 ft (core); and from the red-brown sand (if encountered), at the bottom of the core or the interval above the red-brown clay.
g. Trip blanks will be associated with VOC and TPH Purgeables analyses. One trip blank per analyses will be included in each cooler transporting sediment samples for these analyses to the respective laboratories.
h Surficial sample only (Be-7 will be collected from 0 to 1 inch from a dedicated grab and from the 0.0 to 0.5 ft core interval; the remaining surficial parameters will be collected from the 0.0 to 0.5 ft core interval).

Section: Worksheet #21 Revision: 1
Date: July 2008
Quality Assurance Project Plan Phase I RI Low Resolution Coring/Sediment Sampling Lower Passaic River Restoration Project Newark, New Jersey Page 1 of 1
J:\Water\ProjectFiles\P120\12182_Passaic\QAPP\Rev 1_July 2008\2008_Low Res Core QAPP_2008 July 18_Rev1_worksheets20-37_DQOs.doc
QAPP Worksheet #21 (UFP-QAPP Manual Section 3.1.2) Project Sampling SOP References Table
The following is a list of all Standard Operating Procedures (SOPs) associated with project sampling including, but not limited to, sample collection, sample preservation, equipment cleaning and decontamination, equipment testing, inspection and maintenance, supply inspection and acceptance, and sample handling and custody.
Reference Number Title, Revision Date and/or Number Originating Organization Equipment Type
Modified for Project Work?
(Y/N) Comments LPR-G-01 Field Records ENSR NA No Appendix B
LPR-G-02 Navigation/Positioning ENSR Differential Global
Positioning System (dGPS)
No Appendix B
LPR-G-03 Equipment decontamination ENSR Various – see Appendix B No Appendix B
LPR-G-04 IDW handling and disposal ENSR Various – see Appendix B No Appendix B
LPR-G-05 Sample custody ENSR NA No Appendix B LPR-G-06 Packaging and shipping ENSR NA No Appendix B
LPR-S-01 Sediment grab sampling ENSR Grab sampler, box corer No Appendix B
LPR-S-02 Sediment coring using a piston push core ENSR Piston corer No Appendix B LPR-S-03 Sediment coring using a vibracorer ENSR Vibracorer No Appendix B LPR-S-04 Sediment core processing ENSR NA No Appendix B
SOP-8 Procedure for sediment probing MPI Steel rod Yes (see below) Appendix B
7315 Operation and Calibration of a Photoionization Detector ENSR PID No Appendix B
SOP-8 – Section III.1 will be modified to be “Using the on-board dGPS system, maneuver the sampling vessel to the pre-programmed target coordinates for each core sample location, and stabilize the vessel as much as possible.”
Procedural modifications to these documents may be warranted depending upon field conditions, equipment limitations, or limitations imposed by the procedure. Substantive modification will be approved in advance by the Project QA Manager and RI Task Manager and communicated to the CPG Coordinator and to the USEPA RPM. Deviations will be documented in the field records.

Section: Worksheet #22 Revision: 1
Date: July 2008
Quality Assurance Project Plan Phase I RI Low Resolution Coring/Sediment Sampling Lower Passaic River Restoration Project Newark, New Jersey Page 1 of 1
J:\Water\ProjectFiles\P120\12182_Passaic\QAPP\Rev 1_July 2008\2008_Low Res Core QAPP_2008 July 18_Rev1_worksheets20-37_DQOs.doc
QAPP Worksheet #22 (UFP-QAPP Manual Section 3.1.2.4) Field Equipment Calibration, Maintenance, Testing, and Inspection Table
Field Equipment
Calibration Activity
Maintenance Activity
Testing Activity
Inspection Activity Frequency
Acceptance Criteria
Corrective Action
Responsible Person
SOP Reference1
PID Initial: Each time the instrument is turned on, or if the instrument gives erratic results. Check: Every 15 samples and at the end of the day. 100 ppm isobutylene standard
Refer to SOP Refer to SOP Refer to SOP Refer to SOP Within 10% for calibration
Recalibrated or replaced
Field Task Manager or designee
7315
Refractometer Calibrate daily with distilled water
Clean Confirm that scale is set to zero and tighten set screw
Daily for functionality
Daily Boundary line at zero
Recalibrated or replaced
Field Task Manager or designee
LPR-S-01
1Refer to the Project Sampling SOP References table (Worksheet #21).

Section: Worksheet #23 Revision: 1
Date: July 2008
Quality Assurance Project Plan Phase I RI Low Resolution Coring/Sediment Sampling Lower Passaic River Restoration Project Newark, New Jersey Page 1 of 10
J:\Water\ProjectFiles\P120\12182_Passaic\QAPP\Rev 1_July 2008\2008_Low Res Core QAPP_2008 July 18_Rev1_worksheets20-37_DQOs.doc
QAPP Worksheet #23 (UFP-QAPP Manual Section 3.2.1) Analytical SOP References Tablea
Reference Numberb
Title, Revision Date, and/or Number
Definitive or Screening
Data Analytical Group Instrument
Organization Performing
Analysis
Modified for Project Work? (Y/N)
L-1
Determination of Volatile Organics by GC/MS Based on Method 8260B, KNOX-MS-0015, Rev. 10, 10/09/2007
Definitive Organics (VOCs) GC/MS TestAmerica-
Knoxville, TN N, Field preserved sample option used
L-2
Extraction and Cleanup of Organic Compounds from Waters, Soils, Solids and Wastes Based on SW-846 3500 and 3600 Methods KNOX-OP-0011, Rev. 9, 6/6/2007
Definitive Organics (Sample Preparation) N/A TestAmerica-
Knoxville, TN N
L-3 GC/MS Analysis Based on Method 8270C, KNOX-MS-0016, Rev. 7, 2/9/2007
Definitive Organics (SVOCs) GC/MS TestAmerica-
Knoxville, TN
Y, Sonication prep option (in L-2) with increased aliquot size to achieve project DQLs
L-4
Analysis of Organochlorine Pesticides Based on NOAA Technical Memorandum NOS ORCA 130 and Methods 8081A/8081, KNOX-GC-0019, Rev. 1, 7/7/2008
Definitive Organics (Organochlorine Pesticides)
GC with Nickel (63Ni) Detector
TestAmerica-Knoxville, TN
Y, Sonication prep option (in L-2) with increased aliquot size to achieve project DQLs; cleanup by Florisil and Gel Permeation Chromatography (GPC) (in L-2)
L-6
Extraction and Isotope Dilution of Alkylated PAHs and Selected Semivolatile Organic Compounds by HRGC/LRMS-SIM, KNOX-01-0016, Rev. 6, 10/9/2007
Definitive Organics (PAHs) HRGC/LRMS-SIM TestAmerica-Knoxville, TN
Y, Cleanup by GPC(in L-2) and silica gel (in L-6)

Section: Worksheet #23 Revision: 1
Date: July 2008
Quality Assurance Project Plan Phase I RI Low Resolution Coring/Sediment Sampling Lower Passaic River Restoration Project Newark, New Jersey Page 2 of 10
QAPP Worksheet #23 (UFP-QAPP Manual Section 3.2.1) Analytical SOP References Table
J:\Water\ProjectFiles\P120\12182_Passaic\QAPP\Rev 1_July 2008\2008_Low Res Core QAPP_2008 July 18_Rev1_worksheets20-37_DQOs.doc
Reference Numberb
Title, Revision Date, and/or Number
Definitive or Screening
Data Analytical Group Instrument
Organization Performing
Analysis
Modified for Project Work? (Y/N)
L-7
Analysis of PCB Isomers by Isotope Dilution HRGC/HRMS, KNOX-ID-0013, Rev. 7, 7/10/2008
Definitive Organics HRGC/HRMS TestAmerica-Knoxville N
L-9
Standard Operating Procedure for the Determination of Gamma Isotopes, GL-RAD-A-013, Revision 14
Definitive Radiochemistry (Be-7, Cs-137, K-40, Pb-210)
Gamma Spectroscopy System
GEL Charleston, SC
Y, use 21-day in-growth time for radium-226; the associated combined 2 sigma uncertainty (total propagated uncertainty) must be ≤30% with a maximum count time of 1000 minutes.
L-10
Standard Operating Procedure for the Determination of Radiometric Polonium, GL-RAD-A-016, Revision 10
Definitive Pb-210 as Po-210c Alpha Spectroscopy System
GEL Charleston, SC
Y, the associated combined 2 sigma uncertainty (total propagated uncertainty) must be ≤30% with a maximum count time of 1000 minutes.
L-11
Extraction and Cleanup of Organic Compounds from Waters and Solids, PT-OP-001, Rev. 10, 10/19/2007
Definitive
Organics (Sample Preparation, Herbicides and PCB-Aroclors)
N/A TestAmerica-Pittsburgh, PA
Y, Cleanup by GPC required
L-12
Gas Chromatographic Analysis Based on SW-846 Methods, PITT-GC-001, Rev. 13, 3/31/2008
Definitive Organics (Herbicides and PCB-Aroclors)
GC with 63Ni Detector
TestAmerica-Pittsburgh, PA
Y, second column confirmation, and acid clearnup required for PCBs

Section: Worksheet #23 Revision: 1
Date: July 2008
Quality Assurance Project Plan Phase I RI Low Resolution Coring/Sediment Sampling Lower Passaic River Restoration Project Newark, New Jersey Page 3 of 10
QAPP Worksheet #23 (UFP-QAPP Manual Section 3.2.1) Analytical SOP References Table
J:\Water\ProjectFiles\P120\12182_Passaic\QAPP\Rev 1_July 2008\2008_Low Res Core QAPP_2008 July 18_Rev1_worksheets20-37_DQOs.doc
Reference Numberb
Title, Revision Date, and/or Number
Definitive or Screening
Data Analytical Group Instrument
Organization Performing
Analysis
Modified for Project Work? (Y/N)
L-13
NJDEP OQA-QAM-025, Quantitation of Semivolatile Petroleum Products in Water, Soil, Sediment and Sludge, EDS-GCS-011, Rev. 2, 3/23/2007
Definitive Organics (TPH) GC/FID TestAmerica-Edison, NJ N
L-14 Gasoline Range Organics Using GC/FID Method 8015, EDS-GCV-006, Rev. 8, 2/18/2008
Definitive Organics (TPH) GC/FID TestAmerica-Edison, NJ N
L-15
Analysis of Organochlorine Pesticides By High Resolution GC/MS, WS-ID-0014, Rev. 4, 7/11/2008
Definitive Organics (Pesticides) HRGC/HRMS TestAmerica-West Sacramento, CA
Y, Deactivated silica gel cleanup (described in method) + GPC in L-47
L-16 SOP for Metals Digestion, MET-3050, Rev. 10, 7/12/2007 Definitive Metals (Sample
Preparation-sediment) N/A CAS-Kelso, WA N
L-17 SOP for Metals Digestion, MET-3010A, Rev., 10, 7/12/2007 Definitive Metals (Sample
Preparation-Aqueous) N/A CAS-Kelso, WA N
L-18
Determination of Metals and Trace Elements by Inductively Coupled Plasma Atomic Emission Spectroscopy (ICP), MET-ICP, Rev. 18, 12/14/2006
Definitive Metals ICP/AES CAS-Kelso, WA N

Section: Worksheet #23 Revision: 1
Date: July 2008
Quality Assurance Project Plan Phase I RI Low Resolution Coring/Sediment Sampling Lower Passaic River Restoration Project Newark, New Jersey Page 4 of 10
QAPP Worksheet #23 (UFP-QAPP Manual Section 3.2.1) Analytical SOP References Table
J:\Water\ProjectFiles\P120\12182_Passaic\QAPP\Rev 1_July 2008\2008_Low Res Core QAPP_2008 July 18_Rev1_worksheets20-37_DQOs.doc
Reference Numberb
Title, Revision Date, and/or Number
Definitive or Screening
Data Analytical Group Instrument
Organization Performing
Analysis
Modified for Project Work? (Y/N)
L-19
Determination of Metals and Trace Elements by Inductively Coupled Plasma-Mass Spectrometry, EPA Method 6020, MET-6020, Rev. 11, 5/1/2007
Definitive Metals ICP/MS CAS-Kelso, WA N
L-20
Extraction of Organotins in Sediment, Water and Tissue Matrices, SOC-OSWT, Rev. 5, 1/20/2006
Definitive Organics (Sample Preparation) N/A CAS-Kelso, WA N
L-21 Butyltins, SOC-BUTYL, Rev. 8, 7/31/2007 Definitive Organics (Butyltin)
GC/Flame Photoionization Detector (FPD)
CAS-Kelso, WA N
L-22 Sulfides, Acid Volatile, GEN-AVS, Rev. 5, 1/26/2005 Definitive AVS/SEM
Ultraviolet Visible-Spectroscopy (UV-Visible), ICP, Cold Vapor Atomic Absorption Spectometry (CVAAS)
CAS-Kelso, WA N
L-23 Ammonia by Flow Injection Analysis, GEN-350.1, Rev 7, 5/1/07
Definitive General Chemistry Rapid Flow Analyzer Colorimeter
CAS-Kelso, WA
Y, modified to include sulfide cleanup procedures in Nitrogen, ammonia, colorimetry, salicylate-hypochlorite, automated-segmented flow, United States Geological Service (USGS) I-6522-90

Section: Worksheet #23 Revision: 1
Date: July 2008
Quality Assurance Project Plan Phase I RI Low Resolution Coring/Sediment Sampling Lower Passaic River Restoration Project Newark, New Jersey Page 5 of 10
QAPP Worksheet #23 (UFP-QAPP Manual Section 3.2.1) Analytical SOP References Table
J:\Water\ProjectFiles\P120\12182_Passaic\QAPP\Rev 1_July 2008\2008_Low Res Core QAPP_2008 July 18_Rev1_worksheets20-37_DQOs.doc
Reference Numberb
Title, Revision Date, and/or Number
Definitive or Screening
Data Analytical Group Instrument
Organization Performing
Analysis
Modified for Project Work? (Y/N)
L-24 Cyanide Extraction of Solids and Oils, GEN-9013, Rev. 0, 2/8/1998
Definitive General Chemistry (Sample Preparation) N/A CAS/Kelso, WA N
L-25 Total Cyanides and Cyanides Amenable to Chlorination, GEN-335, Rev. 12, 4/12/2007
Definitive General Chemistry Lachat Quik-Chem Analyzer CAS/Kelso, WA N
L-26
Phosphorus Determination Using Colorimetric Procedure, GEN-365.3, Rev. 9, 7/11/2008 (Includes sample preparation)
Definitive General Chemistry Ultraviolet-Visible Spectrophotometry (UV-VIS)
CAS-Kelso, WA N
L-27
Nitrogen, Total and Soluble Kjeldahl, GEN-TKN, Rev. 9, 5/8/2007 (Includes sample preparation)
Definitive General Chemistry Ion Selective Electrode CAS-Kelso, WA N
L-28 Carbon, Total Organic in Soil, GEN-ASTM, Rev. 5, 9/5/2006 Definitive General Chemistry Induction Furnace CAS-Kelso, WA N
L-29 Total Organic Carbon in Water, GEN-TOC, Rev. 8, 4/12/2007 Definitive General Chemistry
TOC Analyzer (Persulfate Oxidation Method)
CAS-Kelso, WA N
L-30
Total Sulfides by Methylene Blue Determination, GEN-9030M, Rev. 8, 1/5/2006 (Includes sample preparation)
Definitive General Chemistry UV-VIS CAS-Kelso, WA N

Section: Worksheet #23 Revision: 1
Date: July 2008
Quality Assurance Project Plan Phase I RI Low Resolution Coring/Sediment Sampling Lower Passaic River Restoration Project Newark, New Jersey Page 6 of 10
QAPP Worksheet #23 (UFP-QAPP Manual Section 3.2.1) Analytical SOP References Table
J:\Water\ProjectFiles\P120\12182_Passaic\QAPP\Rev 1_July 2008\2008_Low Res Core QAPP_2008 July 18_Rev1_worksheets20-37_DQOs.doc
Reference Numberb
Title, Revision Date, and/or Number
Definitive or Screening
Data Analytical Group Instrument
Organization Performing
Analysis
Modified for Project Work? (Y/N)
L-31 Particle Size Determination, GEN-PSP, Rev. 4, 11/11/2003 Definitive Physical Testing WS Tyler-RX Sieve
Shaker, Sieves CAS-Kelso, WA
Y, sieve sizes will conform to those specified L-31a (memo dated March 28, 2008 from Leonard Warner/MPI to Tom Taccone/EPA, entitled “Core Top” Modeling and Risk Assessment Data Needs, Lower Passaic River Restoration Project. Hydrometer for finer fractions will be utilized).
L-31a
“Core Top” Modeling and Risk Assessment Data Needs Lower Passaic River Restoration Project”, Malcolm Pirnie, March 28,2008 (modification to grain size determination)
Definitive Physical Testing NA CAS-Kelso, WA N
L-32
Standard Test Method for Liquid Limit, Plastic Limit, and Plasticity Index of Soils, ASTM D-4318-84, 10/26/1984
Definitive Physical Testing Liquid Limit Device CAS-Kelso, WA N
L-33 Specific Gravity, GEN-SPECGRAV, Rev. 0, 6/6/2005 Definitive Physical Testing Pycnometer CAS-Kelso, WA N
L-34 Hexavalent Chromium by Ion Chromatography, GEN-7199, Rev. 2, 9/30/2005
Definitive Metals Ion Chromatograph CAS-Rochester, NY N

Section: Worksheet #23 Revision: 1
Date: July 2008
Quality Assurance Project Plan Phase I RI Low Resolution Coring/Sediment Sampling Lower Passaic River Restoration Project Newark, New Jersey Page 7 of 10
QAPP Worksheet #23 (UFP-QAPP Manual Section 3.2.1) Analytical SOP References Table
J:\Water\ProjectFiles\P120\12182_Passaic\QAPP\Rev 1_July 2008\2008_Low Res Core QAPP_2008 July 18_Rev1_worksheets20-37_DQOs.doc
Reference Numberb
Title, Revision Date, and/or Number
Definitive or Screening
Data Analytical Group Instrument
Organization Performing
Analysis
Modified for Project Work? (Y/N)
L-35
Tetra-through Octa-Chlorinated Dioxins and Furans by Isotope Dilution HRGC/HRMS, SOP Code HRMS-1613B, Rev. 6.1, 4/24/08
Definitive Organics Isotope Dilution Mass Spectrometry CAS-Houston, TX N
L-36
BRL Procedure for EPA Method 1631, Total Mercury in Tissue, Sludge, Sediment, and Soil by Acid Digestion and Bromide Chloride (BrCl) Oxidation by CVAFS, BR-0002, Rev. 010, 4/9/2008
Definitive Metals (Total and Low Level Mercury) CVAF0053 Brooks Rand-
Seattle, WA N
L-37
Determination of Methyl Mercury by Aqueous Phase Ethylation, Trapping, Pre-Collection, Isothermal GC Separation, and CVAFS Detection: BRL Procedure for EPA Method 1630, BR-0011, Rev. 012, 4/1/2008
Definitive Metals (Methyl Mercury) CVAFS Brooks Rand-Seattle,
WA
N, solvent extraction option using KBr/H2SO4/CuSo4 will be used
L-38
Total Coliform and E. coli Using the Colilert and Quanti-Tray® System, ASI SOP No. ASI204-1, Modified Procedure for Coliform and E. coli in Sediment
Definitive Biological
Incubator, Ultraviolet Lamp, Thermometer, pH Meter
Analytical Services- Williston, VT
Y, modified for sediment (L-38a)

Section: Worksheet #23 Revision: 1
Date: July 2008
Quality Assurance Project Plan Phase I RI Low Resolution Coring/Sediment Sampling Lower Passaic River Restoration Project Newark, New Jersey Page 8 of 10
QAPP Worksheet #23 (UFP-QAPP Manual Section 3.2.1) Analytical SOP References Table
J:\Water\ProjectFiles\P120\12182_Passaic\QAPP\Rev 1_July 2008\2008_Low Res Core QAPP_2008 July 18_Rev1_worksheets20-37_DQOs.doc
Reference Numberb
Title, Revision Date, and/or Number
Definitive or Screening
Data Analytical Group Instrument
Organization Performing
Analysis
Modified for Project Work? (Y/N)
L-38a
Modification to SOP AS1204-1 for the Analysis of Sediment or Manure Samples for the Detection of Coliforms and E. coli Using Colilert-18 and Quanti-Tray 2000
Definitive Biological NA Analytical Services- Williston, VT
N
L-39
Cryptosporidium and Giardia in Water by Filtration/IMS/FA, ASI SOP No. ASI224, Modified Procedure for 1623 and ColorSeed for Sediment Samples
Definitive Biological Microscope Analytical Services- Williston, VT
Y, modified for sediment (L-39a)
L-39a
Modification to Method 1623 for the Detection and Enumeration of Cryptosporidium and Giardia from Sediment or Manure Samples and Determination of Recovery Efficiency using ColorSeed C&G
Definitive Biological NA Analytical Services- Williston, VT
N
L-40 Total Solids, GEN-160.3, Rev. 11, 4/10/2007 Definitive General Chemistry Analytical Balance CAS-Kelso, WA N
L-43 Percent Moisture, KNOX-WC-0012, Rev. 5, 1/30/07 Definitive General Chemistry Analytical Balance
TestAmerica- Knoxville, TN
N
L-45
Standard Operating Procedure for Gamma Spectroscopy System Operation, GL-RAD-I-001, Rev. 12
Definitive Radiochemistry Gamma Spectroscopy System
GEL Charleston, SC
N

Section: Worksheet #23 Revision: 1
Date: July 2008
Quality Assurance Project Plan Phase I RI Low Resolution Coring/Sediment Sampling Lower Passaic River Restoration Project Newark, New Jersey Page 9 of 10
QAPP Worksheet #23 (UFP-QAPP Manual Section 3.2.1) Analytical SOP References Table
J:\Water\ProjectFiles\P120\12182_Passaic\QAPP\Rev 1_July 2008\2008_Low Res Core QAPP_2008 July 18_Rev1_worksheets20-37_DQOs.doc
Reference Numberb
Title, Revision Date, and/or Number
Definitive or Screening
Data Analytical Group Instrument
Organization Performing
Analysis
Modified for Project Work? (Y/N)
L-46 Standard Operating Procedure for Alpha Spectroscopy System, GL-RAD-I-009, Rev. 9
Definitive Radiochemistry Alpha Spectroscopy System
GEL Charleston, SC
N
L-47 Gel Permeation Cleanup [Method 3640A], WS-OP-0012, rev 4, 10/5/2007
Definitive Organics (Pesticides) HRGC/HRMS TestAmerica-West Sacramento, CA
N
L-48 Determination of Solids in Water and Wastes, PT-WC-001, Rev. 1, 5/27/08
Definitive General Chemistry Analytical Balance TestAmerica-Pittsburgh, PA
N
L-49 Percent Solids Determination, SOP No. ED-WET-032, Rev. 3, 5/8/2006
Definitive General Chemistry Analytical Balance TestAmerica-Edison, NJ N
L-50 Determination of Percent Moisture, WS-OP-0013, Rev. 3, 2/13/08
Definitive General Chemistry Analytical Balance TestAmerica-West Sacramento, CA
N
L-51 Standard Operating Procedure for Total Solids, SMO-TS, Rev. 0, 7/7/08
Definitive General Chemistry Analytical Balance CAS-Houston, TX N
L-52
Standard Operating Procedure Dry Weight Perent Solids/Modified EPA 160.3/SM2540G, GEN-DWPS, Rev.1, 4/19/04
Definitive General Chemistry Analytical Balance CAS-Rochester, NY N

Section: Worksheet #23 Revision: 1
Date: July 2008
Quality Assurance Project Plan Phase I RI Low Resolution Coring/Sediment Sampling Lower Passaic River Restoration Project Newark, New Jersey Page 10 of 10
QAPP Worksheet #23 (UFP-QAPP Manual Section 3.2.1) Analytical SOP References Table
J:\Water\ProjectFiles\P120\12182_Passaic\QAPP\Rev 1_July 2008\2008_Low Res Core QAPP_2008 July 18_Rev1_worksheets20-37_DQOs.doc
Reference Numberb
Title, Revision Date, and/or Number
Definitive or Screening
Data Analytical Group Instrument
Organization Performing
Analysis
Modified for Project Work? (Y/N)
L-53
Standard Operating Procedure for Soil Sample Preparation for the Determination of Radionuclides, GL-RAD-A-021, Rev. 13, 3/08
Definitive General Chemistry Analytical Balance GEL Charleston, SC
Y, note on sample preparation log a description of sample (e.g., silt, sand, pebble, unusual color or items present)
L-54
Standard Operating Procedure for Soil Sample Ashing for the Determination of Radionuclides, GL-RAD-A-021B, Rev. 6, 4/05
Definitive General Chemistry Analytical Balance GEL Charleston, SC
N
L-55 Dry Weight Determination, BR-1501, Rev. 3, 6/6/06
Definitive General Chemistry Analytical Balance Brooks Rand-Seattle, WA
N
a All SOPs are contained in Appendix C-1. Bioavailability protocols are provided in Appendix D. b It is expected that the procedures outlined in these SOPs will be followed. Procedural modifications to individual SOPs may be warranted depending upon an individual sample matrix, interferences encountered, or limitations imposed by the procedure. Deviations from individual SOPs will be documented in the laboratory records. Substantive modification to any SOP will be approved in advance by the Project QA Manager and RI Task Manager and communicated to the CPG Coordinator and to the USEPA Remedial Project Manager. The ultimate procedure employed will be documented in the report summarizing the results of the sampling event or field activity. c Alpha spectrometry analysis optional depending on results of Pb-210 from gamma spectrometry analysis. Notes: CAS – Columbia Analytical Services, Inc.

Section: Worksheet #24 Revision: 1
Date: July 2008
Quality Assurance Project Plan Phase I RI Low Resolution Coring/Sediment Sampling Lower Passaic River Restoration Project Newark, New Jersey Page 1 of 7
J:\Water\ProjectFiles\P120\12182_Passaic\QAPP\Rev 1_July 2008\2008_Low Res Core QAPP_2008 July 18_Rev1_worksheets20-37_DQOs.doc
QAPP Worksheet #24 (UFP-QAPP Manual Section 3.2.2) Analytical Instrument Calibration Table
Instrument Calibration Procedure Frequency of Calibration Acceptance Criteria Corrective Action (CA)
Person Responsible
for CA SOP
Referencea
GC/MS (VOC)
Bromofluorobenzene (BFB) tune; Initial and Continuing Calibration as Required in SOP
Verify tuning every 12 hours; initial calibration after instrument set up, after major instrument changes and when continuing calibration criteria are not met.
Initial Calibration % relative standard deviation (RSD) ≤30% for CCCs; initial calibration (ICAL) % RSD <15% or linear curve r≥ 0.995, or quadratic curve r2>0.990. Continuing calibration verification (CCV) %D ≤20% for CCCs; system performance check compounds (SPCC) minimum average Response factors (RF).
Inspect system, correct problem, rerun calibration and affected samples
Analyst L-1
GC/MS (SVOC)
Decafluorotriphenylphosphine (DFTPP) tune; Initial and Continuing Calibration as required in SOP
Verify tune every 12 hours; Initial calibration after instrument set up, after major instrument changes and when continuing calibration criteria are not met.
Initial Calibration %RSD ≤30% for CCCs; ICAL %RSD <15% or linear curve r ≥ 0.995, or quadratic curve r2 >0.990. CCV %D ≤20% for CCCs; SPCC minimum avg. RF.
Inspect system, correct problem, rerun calibration and affected samples
Analyst L-3
HRGC/LRMS-SIM (PAH)
DFTPP tune; Initial and Continuing Calibration as required in SOP
Verify tune every 12 hours; Initial calibration after instrument set up, after major maintenance, and/or instrument changes have occurred
Initial Calibration %RSD ≤30% CCV %D ≤30%.
Inspect system, correct problem, rerun calibration and affected samples
Analyst L-6
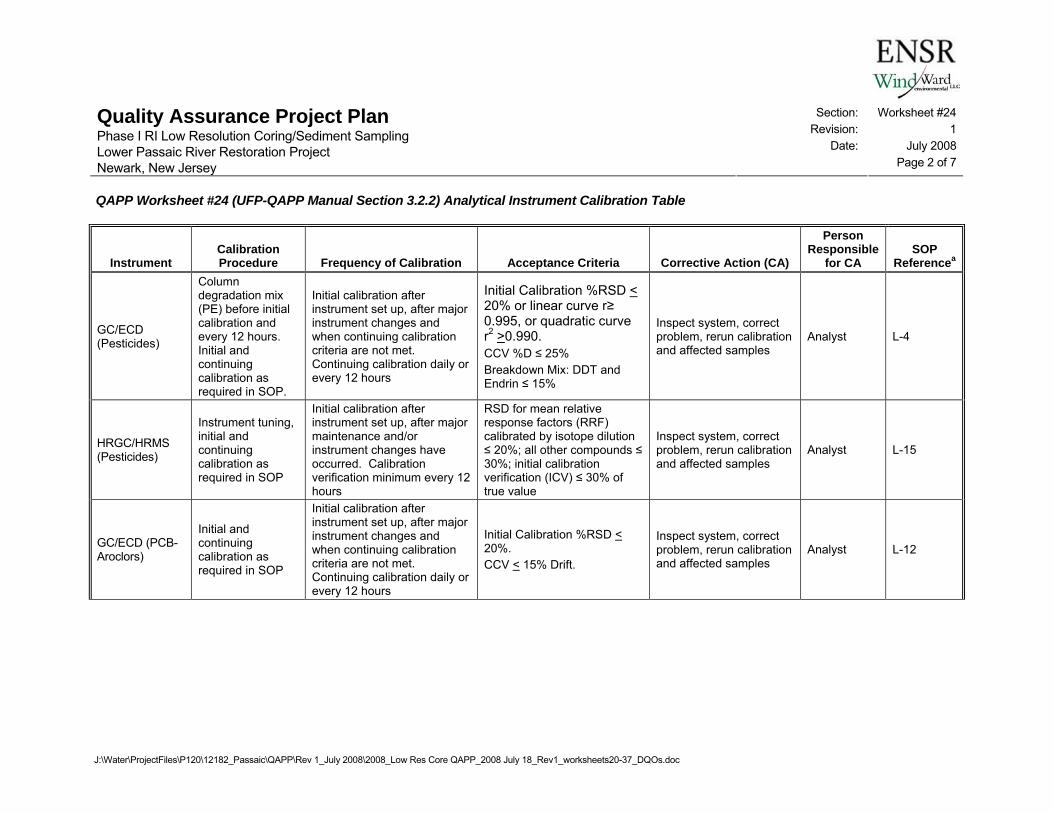
Section: Worksheet #24 Revision: 1
Date: July 2008
Quality Assurance Project Plan Phase I RI Low Resolution Coring/Sediment Sampling Lower Passaic River Restoration Project Newark, New Jersey Page 2 of 7
QAPP Worksheet #24 (UFP-QAPP Manual Section 3.2.2) Analytical Instrument Calibration Table
J:\Water\ProjectFiles\P120\12182_Passaic\QAPP\Rev 1_July 2008\2008_Low Res Core QAPP_2008 July 18_Rev1_worksheets20-37_DQOs.doc
Instrument Calibration Procedure Frequency of Calibration Acceptance Criteria Corrective Action (CA)
Person Responsible
for CA SOP
Referencea
GC/ECD (Pesticides)
Column degradation mix (PE) before initial calibration and every 12 hours. Initial and continuing calibration as required in SOP.
Initial calibration after instrument set up, after major instrument changes and when continuing calibration criteria are not met. Continuing calibration daily or every 12 hours
Initial Calibration %RSD < 20% or linear curve r≥ 0.995, or quadratic curve r2 >0.990. CCV %D ≤ 25% Breakdown Mix: DDT and Endrin ≤ 15%
Inspect system, correct problem, rerun calibration and affected samples
Analyst L-4
HRGC/HRMS (Pesticides)
Instrument tuning, initial and continuing calibration as required in SOP
Initial calibration after instrument set up, after major maintenance and/or instrument changes have occurred. Calibration verification minimum every 12 hours
RSD for mean relative response factors (RRF) calibrated by isotope dilution ≤ 20%; all other compounds ≤ 30%; initial calibration verification (ICV) ≤ 30% of true value
Inspect system, correct problem, rerun calibration and affected samples
Analyst L-15
GC/ECD (PCB-Aroclors)
Initial and continuing calibration as required in SOP
Initial calibration after instrument set up, after major instrument changes and when continuing calibration criteria are not met. Continuing calibration daily or every 12 hours
Initial Calibration %RSD < 20%. CCV < 15% Drift.
Inspect system, correct problem, rerun calibration and affected samples
Analyst L-12

Section: Worksheet #24 Revision: 1
Date: July 2008
Quality Assurance Project Plan Phase I RI Low Resolution Coring/Sediment Sampling Lower Passaic River Restoration Project Newark, New Jersey Page 3 of 7
QAPP Worksheet #24 (UFP-QAPP Manual Section 3.2.2) Analytical Instrument Calibration Table
J:\Water\ProjectFiles\P120\12182_Passaic\QAPP\Rev 1_July 2008\2008_Low Res Core QAPP_2008 July 18_Rev1_worksheets20-37_DQOs.doc
Instrument Calibration Procedure Frequency of Calibration Acceptance Criteria Corrective Action (CA)
Person Responsible
for CA SOP
Referencea
HRGC/HRMS (PCB Congeners)
Retention time calibration, initial calibration, continuing calibration as required in SOP
Initial calibration after instrument set up, after major instrument changes and when continuing calibration criteria are not met. Calibration verification minimum every 12 hours
Initial Calibration %RSD < 20% for target analytes calculated by isotope dilution. %RSD < 35% for target analytes calculated by internal standard. CCV < 30% Drift for Toxics and LOC congeners CCV 40-160% for non-Toxic congeners.
Inspect system, correct problem, rerun calibration and affected samples
Analyst L-7
GC/ECD (Herbicides)
Initial and continuing calibration as required in SOP.
Initial calibration after instrument set up, after major instrument changes and when continuing calibration criteria are not met. Calibration verification minimum every 12 hours
Initial Calibration %RSD < 20%; ICV ± 20%; continuing calibration ± 15%; retention time windows ± 3x SD update daily
Inspect system, correct problem, rerun calibration and affected samples
Analyst L-12
GC/FID (TPH)
Initial and continuing calibration as required in SOP
Initial calibration after instrument set up, after major instrument changes and when continuing calibration criteria are not met. Calibration verification every 10 samples
Initial Calibration %RSD < 20%; continuing calibration ± 15%
Inspect system, correct problem, rerun calibration and affected samples
Analyst L-13, L-14

Section: Worksheet #24 Revision: 1
Date: July 2008
Quality Assurance Project Plan Phase I RI Low Resolution Coring/Sediment Sampling Lower Passaic River Restoration Project Newark, New Jersey Page 4 of 7
QAPP Worksheet #24 (UFP-QAPP Manual Section 3.2.2) Analytical Instrument Calibration Table
J:\Water\ProjectFiles\P120\12182_Passaic\QAPP\Rev 1_July 2008\2008_Low Res Core QAPP_2008 July 18_Rev1_worksheets20-37_DQOs.doc
Instrument Calibration Procedure Frequency of Calibration Acceptance Criteria Corrective Action (CA)
Person Responsible
for CA SOP
Referencea
Isotope Dilution Mass Spectrometry (Dioxins/Furans)
Perfluorokerosene (PFK) Tune; initial and continuing calibration as required in SOP
Initial calibration after instrument set up, after major instrument changes and when continuing calibration criteria are not met. Continuing calibration minimum every 12 hours
%RSD for mean response of unlabeled standards < 20%; labeled reference compounds ± 35% Continuing calibration per SOP Table 6
Inspect system, correct problem, rerun calibration and affected samples
Analyst L-35
Germanium Spectroscopy Detector (Radionuclides)
Calibration procedures as outlined in GL-RAD-A-013 and GL-RAD-I-001, Rev. 12
Daily or with each use; count calibration spectrum, initial energy and shape calibration
Within limits defined in SOP Inspect system, correct problem, rerun calibration and affected samples
Analyst L-9, L-45
Alpha Spectroscopy Detector (Radionuclides)
Calibration procedures as outlined in GL-RAD –A-016 and GL-RAD-I-009, Rev. 9
Monthly energy and efficiency calibration Daily pulser checks
Within limits defined in SOP Inspect system, correct problem, rerun calibration and affected samples
Analyst L-10, L-46
ICP (Metals)
Initial and continuing calibration per SOP
Profile instrument; Cu/Mn ratio daily; blank, RL and high standard daily; ICS at start and every 8 hours; CCB, CCV every 10 samples
Copper/Manganese (Cu/Mn)ratio within 20% of value at time interelement corrections (IECs) determined. ICV, CCV ± 10% of true value; ICSAB ± 20% of true value
Inspect system, correct problem, rerun calibration and affected samples
Analyst L-18
ICPMS (Metals)
Initial and continuing calibration per SOP
Intensity check, Cu/Mn ratio ; blank, RL and high standard daily; ICS at start and every 8 hours; CCB, CCV every 10 samples
Cu/Mn ratio within 20% of value at time IECs determined. ICV, CCV ± 10% of true value; ICSAB ± 20% of true value
Inspect system, correct problem, rerun calibration and affected samples
Analyst L-19

Section: Worksheet #24 Revision: 1
Date: July 2008
Quality Assurance Project Plan Phase I RI Low Resolution Coring/Sediment Sampling Lower Passaic River Restoration Project Newark, New Jersey Page 5 of 7
QAPP Worksheet #24 (UFP-QAPP Manual Section 3.2.2) Analytical Instrument Calibration Table
J:\Water\ProjectFiles\P120\12182_Passaic\QAPP\Rev 1_July 2008\2008_Low Res Core QAPP_2008 July 18_Rev1_worksheets20-37_DQOs.doc
Instrument Calibration Procedure Frequency of Calibration Acceptance Criteria Corrective Action (CA)
Person Responsible
for CA SOP
Referencea
Cold Vapor Atomic Fluorescence Spectroscopy (CVAFS) (Mercury, Methyl Mercury)
Initial and continuing calibration per SOP
Calibrate daily with a minimum of 5 standards and ICV daily. CCV every 10 samples
ICV 80 -120% CCV 67 -133% (methyl mercury) CCV 77-123% (total mercury)
Inspect system, correct problem, rerun calibration and affected samples
Analyst L-36, L-37
Ion Chromatograph (Hexavalent Chromium)
Initial and continuing calibration per SOP
Calibrate daily using a minimum of a blank and 3 standards; r ≥ 0.999; CCB, CCV every 10 samples
ICV, CCV ± 10% of true value Inspect system, correct problem, rerun calibration and affected samples
Analyst L-34
GC/FPD (Butyltins)
Initial and continuing calibration per SOP
External calibration prior to each use; continuing calibration every 10 injections or every 12 hours whichever is more frequent
ICV, CCV ± 25% of true value Inspect system, correct problem, rerun calibration and affected samples
Analyst L-21
UV-VIS (Sulfides, AVS)
Initial and continuing calibration per SOP
Allow spectrophotometer to warm up for 30 minutes. External calibration prior to each use; r ≥ 0.995; CCB, CCV every 10 samples
ICV, CCV ± 10% of true value
Inspect system, correct problem, rerun calibration and affected samples
Analyst L-22, L-30
Rapid Flow Analyzer Colorimeter (Ammonia)
Initial and continuing calibration per SOP
Determine Linear Calibration range at initial calibration and verify at least every 6 months using a blank and 3 standards; r ≥ 0.995; CCB, CCV every 10 samples
Linearity check must be within ± 10% of original values; ICV, CCV ± 10% of true value
Inspect system, correct problem, rerun calibration and affected samples
Analyst L-23

Section: Worksheet #24 Revision: 1
Date: July 2008
Quality Assurance Project Plan Phase I RI Low Resolution Coring/Sediment Sampling Lower Passaic River Restoration Project Newark, New Jersey Page 6 of 7
QAPP Worksheet #24 (UFP-QAPP Manual Section 3.2.2) Analytical Instrument Calibration Table
J:\Water\ProjectFiles\P120\12182_Passaic\QAPP\Rev 1_July 2008\2008_Low Res Core QAPP_2008 July 18_Rev1_worksheets20-37_DQOs.doc
Instrument Calibration Procedure Frequency of Calibration Acceptance Criteria Corrective Action (CA)
Person Responsible
for CA SOP
Referencea
Rapid Flow Analyzer Colorimeter (Cyanide)
Initial and continuing calibration per SOP
Determine Linear Calibration range at initial calibration and verify at least every 6 months using a blank and 3 standards; r ≥ 0.995; CCB, CCV every 10 samples
Linearity check must be within ± 10% of original values; ICV, CCV ± 10% of true value
Inspect system, correct problem, rerun calibration and affected samples
Analyst L-25
Ion Selective Electrode (TKN)
Initial and continuing calibration per SOP
Calibrate daily, ICV, CCV every 10 samples
ICV, CCV ± 10% of true value
Inspect system, correct problem, rerun calibration and affected samples
Analyst L-27
UV-VIS (Phosphorus)
Initial and continuing calibration per SOP
External calibration prior to each use; r ≥ 0.995; CCB, CCV every 10 samples
ICV, CCV ± 10% of true value
Inspect system, correct problem, rerun calibration and affected samples
Analyst L-26
Induction Furnace (TOC)
Initial and continuing calibration per SOP
CCV each batch CCV+/- 20% true value. Inspect system, correct problem, rerun calibration and affected samples
Analyst L-28
Analytical Balance (Grain Size, Percent Moisture)
Daily Weigh and record NIST traceable standard weight in range of interest
± 5% of certified weight Inspect system, correct problem, rerun calibration and affected samples
Analyst
L-31, L-40, L-43, L-48, L-49, L-50, L-51, L-52, L-53, L-54, L-55
Induction Furnace (TOC)
Initial and continuing calibration per SOP
CCV each batch CCV+/- 20% true value. Inspect system, correct problem, rerun calibration and affected samples
Analyst L-28

Section: Worksheet #24 Revision: 1
Date: July 2008
Quality Assurance Project Plan Phase I RI Low Resolution Coring/Sediment Sampling Lower Passaic River Restoration Project Newark, New Jersey Page 7 of 7
QAPP Worksheet #24 (UFP-QAPP Manual Section 3.2.2) Analytical Instrument Calibration Table
J:\Water\ProjectFiles\P120\12182_Passaic\QAPP\Rev 1_July 2008\2008_Low Res Core QAPP_2008 July 18_Rev1_worksheets20-37_DQOs.doc
Instrument Calibration Procedure Frequency of Calibration Acceptance Criteria Corrective Action (CA)
Person Responsible
for CA SOP
Referencea
Analytical Balance (Grain Size, Percent Moisture)
Daily Weigh and record NIST traceable standard weight in range of interest
± 5% of certified weight Inspect system, correct problem, rerun calibration and affected samples
Analyst L-31, L-40
a Refer to the Analytical SOP References table (Worksheet #23). All SOPs are contained in Appendix C.

Section: Worksheet #25 Revision: 1
Date: July 2008
Quality Assurance Project Plan Phase I RI Low Resolution Coring/Sediment Sampling Lower Passaic River Restoration Project Newark, New Jersey Page 1 of 4
J:\Water\ProjectFiles\P120\12182_Passaic\QAPP\Rev 1_July 2008\2008_Low Res Core QAPP_2008 July 18_Rev1_worksheets20-37_DQOs.doc
QAPP Worksheet #25 (UFP-QAPP Manual Section 3.2.2) Analytical Instrument and Equipment Maintenance, Testing, and Inspection Table
Instrument/ Equipment Maintenance Activity
Testing Activity
Inspection Activity Frequency
Acceptance Criteria
Corrective Action
Responsible Person
SOP Referencea
GC/MS (VOC)
Clean sources and quadrupole rods; maintain vacuum pumps
Tuning Instrument performance and sensitivity
Service vacuum pumps twice per year; other maintenance as needed
See SOP See SOP Analyst or Section Supervisor
L-1
GC/MS (SVOC)
Clean sources and quadrupole rods; maintain vacuum pumps
Tuning Instrument performance and sensitivity
Service vacuum pumps twice per year; other maintenance as needed
See SOP See SOP Analyst or Section Supervisor
L-3
HRGC/LRMS-SIM (PAH)
Clean sources and quadrupole rods; maintain vacuum pumps
Tuning Instrument performance and sensitivity
Service vacuum pumps once per year; other maintenance as needed
See SOP See SOP Analyst or Section Supervisor
L-6
GC/ECD (Pesticides)
Change septa, clean injectors, change or trim columns, install new liners
Detector signals and chromatogram review
Instrument performance and sensitivity
As needed See SOP See SOP Analyst or Section Supervisor
L-4
HRGC/HRMS (Pesticides)
Clean sources and quadrupole rods; maintain vacuum pumps
Tuning Instrument performance and sensitivity
Service vacuum pumps twice per year; other maintenance as needed
See SOP See SOP Analyst or Section Supervisor
L-15
GC/ECD (PCB-Aroclors)
Change septa, clean injectors, change or trim columns, install new liners
Detector signals and chromatogram review
Instrument performance and sensitivity
As needed See SOP See SOP Analyst or Section Supervisor
L-12

Section: Worksheet #25 Revision: 1
Date: July 2008
Quality Assurance Project Plan Phase I RI Low Resolution Coring/Sediment Sampling Lower Passaic River Restoration Project Newark, New Jersey Page 2 of 4
QAPP Worksheet #25 (UFP-QAPP Manual Section 3.2.2) Analytical Instrument and Equipment Maintenance, Testing, and Inspection Table
J:\Water\ProjectFiles\P120\12182_Passaic\QAPP\Rev 1_July 2008\2008_Low Res Core QAPP_2008 July 18_Rev1_worksheets20-37_DQOs.doc
Instrument/ Equipment Maintenance Activity
Testing Activity
Inspection Activity Frequency
Acceptance Criteria
Corrective Action
Responsible Person
SOP Referencea
HRGC/HRMS (PCB Congeners)
Clean sources; maintain vacuum pumps
Tuning Instrument performance and sensitivity
Service vacuum pumps once per year; other maintenance as needed
See SOP See SOP Analyst or Section Supervisor
L-7
GC/ECD (Herbicides)
Change septa, clean injectors, change or trim columns, install new liners
Detector signals and chromatogram review
Instrument performance and sensitivity
Daily or as needed See SOP See SOP
Analyst or Section Supervisor
L-12
GC/FID (TPH)
Change septa, clean injectors, change or trim columns, install new liners
Detector signals and chromatogram review
Instrument performance and sensitivity
Daily or as needed See SOP See SOP
Analyst or Section Supervisor
L-13, L-14
Isotope Dilution Mass Spectrometry (Dioxins/Furans)
Clean sources and quadrupole rods; maintain vacuum pumps
Tuning Instrument performance and sensitivity
Service vacuum pumps twice per year; other maintenance as needed
See SOP See SOP Analyst or Section Supervisor
L-35
Germanium Spectroscopy Detector (Radionuclides)
Check lead cave surrounding detector
Daily check source and Background check counts
Check for gaps in bricks surrounding detector and make sure bricks are aligned
Prior to use See SOP See SOP Analyst or Section Supervisor
L-9, L-45

Section: Worksheet #25 Revision: 1
Date: July 2008
Quality Assurance Project Plan Phase I RI Low Resolution Coring/Sediment Sampling Lower Passaic River Restoration Project Newark, New Jersey Page 3 of 4
QAPP Worksheet #25 (UFP-QAPP Manual Section 3.2.2) Analytical Instrument and Equipment Maintenance, Testing, and Inspection Table
J:\Water\ProjectFiles\P120\12182_Passaic\QAPP\Rev 1_July 2008\2008_Low Res Core QAPP_2008 July 18_Rev1_worksheets20-37_DQOs.doc
Instrument/ Equipment Maintenance Activity
Testing Activity
Inspection Activity Frequency
Acceptance Criteria
Corrective Action
Responsible Person
SOP Referencea
Alpha Spectroscopy Detector (Radionuclides)
Background checks Recertification
Update detector background Recertification of rare-earth fluoride efficiency sources
Count blank planchets to update detector background Verify using reference solution
Weekly Annually
See SOP See SOP Analyst L-10, L-46
ICP (Metals) Replace disposables, flush lines Cu/Mn ratio Check
connections Daily or as needed See SOP See SOP
Analyst or Section Supervisor
L-18
ICPMS (Metals) Replace disposables, flush lines Cu/Mn ratio Check
connections Daily or as needed See SOP See SOP
Analyst or Section Supervisor
L-19
CVAFS (Mercury, Methyl Mercury)
Replace disposables, flush lines
Sensitivity check
Check connections
Daily or as needed See SOP See SOP
Analyst or Section Supervisor
L-36, L-37
Ion Chromatograph (Hexavalent Chromium)
Replace columns as needed; check eluent and regenerant reservoirs
Analytical standards
Instrument performance and sensitivity
Daily or as needed See SOP See SOP
Analyst or Section Supervisor
L-34
GC/FPD (Butyltins)
Change septa, clean injectors, change or trim columns, install new liners
Detector signals and chromatogram review
Instrument performance and sensitivity
Daily or as needed See SOP See SOP
Analyst or Section Supervisor
L-21

Section: Worksheet #25 Revision: 1
Date: July 2008
Quality Assurance Project Plan Phase I RI Low Resolution Coring/Sediment Sampling Lower Passaic River Restoration Project Newark, New Jersey Page 4 of 4
QAPP Worksheet #25 (UFP-QAPP Manual Section 3.2.2) Analytical Instrument and Equipment Maintenance, Testing, and Inspection Table
J:\Water\ProjectFiles\P120\12182_Passaic\QAPP\Rev 1_July 2008\2008_Low Res Core QAPP_2008 July 18_Rev1_worksheets20-37_DQOs.doc
Instrument/ Equipment Maintenance Activity
Testing Activity
Inspection Activity Frequency
Acceptance Criteria
Corrective Action
Responsible Person
SOP Referencea
UV-VIS (Sulfides, AVS) UV-VIS Analytical
standards
Instrument performance and sensitivity
Verify lamp is working
Daily or as needed See SOP
Analyst or Section Supervisor
L-22, L-30
Rapid Flow Analyzer Colorimeter (Ammonia)
Replace disposables, flush lines
Analytical standards
Check connections
Daily or as needed See SOP See SOP
Analyst or Section Supervisor
L-23
Rapid Flow Analyzer (Cyanide)
Replace disposables, flush lines
Analytical standards
Check connections
Daily or as needed See SOP See SOP
Analyst or Section Supervisor
L-25
Ion Selective Electrode (TKN)
Replace membrane and filling solution; store electrode in ammonia solution
Verify standardization with solutions as required in SOP
Inspect membrane for signs of failure
Prior to use See SOP See SOP Analyst or Section Supervisor
L-27
UV-VIS (Phosphorus) UV-VIS Analytical
standards
Instrument performance and sensitivity
Verify lamp is working
Daily or as needed See SOP
Analyst or Section Supervisor
L-26
Induction Furnace(TOC)
Replace disposables, clean quartz boat Check
connections Daily or as needed See SOP See SOP
Analyst or Section Supervisor
L-28
Analytical Balance (Grain Size, Percent Moisture)
Clean balance after each use; service annually
NIST Traceable weights
Prior to every use
Measured weight within certified tolerance
Clean, verify zero on balance, reweigh; call for service
Analyst or Section Supervisor
L-31, L-40, L-43, L-48, L-49,L-50, L-51, L-52, L-53, L-54, L-55
a Refer to the Analytical SOP References table (Worksheet #23). All SOPs are contained in Appendix C.

Section: Worksheet #26 Revision: 1
Date: July 2008
Quality Assurance Project Plan Phase I RI Low Resolution Coring/Sediment Sampling Lower Passaic River Restoration Project Newark, New Jersey Page 1 of 2
J:\Water\ProjectFiles\P120\12182_Passaic\QAPP\Rev 1_July 2008\2008_Low Res Core QAPP_2008 July 18_Rev1_worksheets20-37_DQOs.doc
QAPP Worksheet #26 (UFP-QAPP Manual Appendix A) Sample Handling System
SAMPLE COLLECTION, PACKAGING, AND SHIPMENT Sample Collection (Personnel/Organization): ENSR Field Team (see Worksheet 21 for a list of the sample collection methods) Sample Packaging (Personnel/Organization): ENSR Field Team Coordination of Shipment (Personnel/Organization): ENSR Field Team Type of Shipment/Carrier: UPS or FedEx for overnight delivery or laboratory courier SAMPLE RECEIPT AND ANALYSIS Sample Receipt (Personnel/Organization): Assigned laboratory personnel (see Worksheet 30 for laboratories providing analytical services) Sample Custody and Storage (Personnel/Organization): Assigned laboratory personnel (see Worksheet 30 for laboratories providing analytical services) Sample Preparation (Personnel/Organization): Assigned laboratory personnel (see Worksheet 30 for laboratories providing analytical services) Sample Determinative Analysis (Personnel/Organization): Assigned laboratory personnel (see Worksheet 30 for laboratories providing analytical services) SAMPLE ARCHIVING Field Sample Storage (No. of days from sample collection): Samples will not be stored in the field but will be shipped to the designated laboratory the same day as collection or no later than the day after collection. If circumstances require that the samples be stored in the field, they will be maintained under the method-specified conditions (e.g., kept at 4±2° C). Sample Extract/Digestate Storage (No. of days from extraction/digestion): Sample extraction and digestion holding times are summarized in Worksheet 19. Biological Sample Storage (No. of days from sample collection): Sample storage time for biological tests is summarized in Worksheet 19. SAMPLE DISPOSAL Personnel/Organization: Assigned laboratory personnel (see Worksheet 30 for laboratories providing analytical services). Number of Days from Analysis: Varies by laboratory; laboratory is required to give ENSR 30 days notice prior to intent to discard any project samples.

Section: Worksheet #26 Revision: 1
Date: July 2008
Quality Assurance Project Plan Phase I RI Low Resolution Coring/Sediment Sampling Lower Passaic River Restoration Project Newark, New Jersey Page 2 of 2
QAPP Worksheet #26 (UFP-QAPP Manual Appendix A) Sample Handling System
J:\Water\ProjectFiles\P120\12182_Passaic\QAPP\Rev 1_July 2008\2008_Low Res Core QAPP_2008 July 18_Rev1_worksheets20-37_DQOs.doc
Sample Handling and Custody
Sample custody procedures ensure the timely, correct, and complete analysis of each samples for all parameters requested. A sample is considered to be in someone’s custody if it:
• Is in his/her possession
• Is in his/her view, after being in his/her possession
• Is in his/her possession and has been placed in a secured location
• Is in a designated secure area
Sample custody documentation provides a written record of sample collection and analysis. The sample custody procedures require the specific identification of samples associated with an exact location and the recording of pertinent information associated with the sample, including time of collection and any preservation techniques, and a COC record which serves as physical evidence of sample custody. Custody procedures will be similar to the procedures outlined in USACE’s Requirements for the Preparation of Sampling and Analysis Plans (USACE 2001) and the USEPA’s Contract Laboratory Program Guidance for Field Samplers (USEPA 2007). The COC documentation system provides the means to individually identify, track, and monitor each sample from the time of collection through final data reporting. Sample custody procedures are developed for three areas: sample collection, laboratory analysis, and final evidence files, which are described in Worksheet 27 and SOP LPR-G-05.
Field Sample Handling and Custody
Field records provide a means of recording information for each field activity performed at the site. COC procedures document pertinent sampling data and all transfers of custody until the samples reach the analytical laboratory. The sample packaging and shipment procedures summarized in Worksheet 27 are designed to ensure that the samples arrive at the laboratory with the COC intact. Specific preservation procedures required for each analytical method are described in Worksheet 19.

Section: Worksheet #27 Revision: 1
Date: July 2008
Quality Assurance Project Plan Phase I RI Low Resolution Coring/Sediment Sampling Lower Passaic River Restoration Project Newark, New Jersey Page 1 of 3
J:\Water\ProjectFiles\P120\12182_Passaic\QAPP\Rev 1_July 2008\2008_Low Res Core QAPP_2008 July 18_Rev1_worksheets20-37_DQOs.doc
QAPP Worksheet #27 (UFP-QAPP Manual Section 3.3.3) Sample Custody Requirements
Field Sample Custody Procedures (sample collection, packaging, shipment, and delivery to laboratory): The field sample custody procedures including sample packing, shipment, and delivery requirements, are discussed in Worksheets 17 and 26. Sample management information is also provided in SOPs LPR-G-05 and LPR-G-06.
Laboratory Sample Custody Procedures (receipt of samples, archiving, disposal): Each laboratory has a sample custodian who accepts custody of the samples and verifies that the information on the sample labels matches the information on the COC. The sample custodian will document any discrepancies, document sample condition upon receipt at the laboratory and will sign and date all appropriate receiving documents. Additional information on laboratory sample receiving procedures is provided in the text below this summary table.
Sample Identification Procedures: Each sample will be assigned a unique sample identification number using the Lower Passaic River Data Management System. This identification nomenclature will consist of an alphanumeric code that identifies the program, sample location (including depth interval if needed), and sample type.
Chain-of-Custody Procedures: A chain-of-custody will accompany all samples from the time of sampling through all custody transfers. Samples of the COC form and the Grab/Core Field Custody and Transfer Form are provided in LPR-G-05; the COC procedures are summarized below and in SOP LPR-G-05 provided in Appendix B
Chain of Custody Procedure
The COC form serves as an official communication to the laboratory detailing the specific analyses required for each sample. The COC record is prepared by the field sample custodian and accompanies samples from the time of sampling through all transfers of custody. The COC will be retained by the laboratory which analyzes and archives the samples. Three copies of the COC are created; one copy is retained in the field and two copies are sent to the laboratory.
Transfer of Custody and Shipment
Sample custody must be maintained form the time of sampling through shipment and receipt at the laboratory. The procedures for custody transfer are outlined in SOP LPR-G-05 (included in Appendix B).

Section: Worksheet #27 Revision: 1
Date: July 2008
Quality Assurance Project Plan Phase I RI Low Resolution Coring/Sediment Sampling Lower Passaic River Restoration Project Newark, New Jersey Page 2 of 3
QAPP Worksheet #27 (UFP-QAPP Manual Section 3.3.3) Sample Custody Requirements
J:\Water\ProjectFiles\P120\12182_Passaic\QAPP\Rev 1_July 2008\2008_Low Res Core QAPP_2008 July 18_Rev1_worksheets20-37_DQOs.doc
Sample Packaging and Shipping Requirements
Sample custody must be maintained through shipment of samples to the contracted laboratory. All samples will be packaged and shipped at the end of each day unless other arrangements have been made with the laboratory. Samples will be delivered directly to the laboratory by sampling personnel or will be shipped using the procedures outlined in SOP LPR-G-6 (Appendix B).
Laboratory Custody Procedures
Each contracted laboratory will have a SOP that details the procedures used to document sample receipt and custody within the laboratory. The following procedures must be addressed in the laboratory custody SOP:
• Each laboratory must have a designated sample custodian who accepts custody of the samples at the time of delivery to the laboratory and verifies that the information on the sample labels matches the information on the COC. The sample custodian must sign and date all appropriate receiving documents and note any discrepancies in sample documentation as well as the condition of the samples at the time of receipt.
• Once the samples have been accepted by the laboratory, checked, and logged in, they must be maintained in accordance with laboratory custody and security requirements as outlined in the laboratory QMP.
• To ensure traceability of samples during the analytical process the laboratory will assign a sample ID number based on procedures outlined in the laboratory QMP or laboratory SOP.
• The following procedures, at a minimum, must be documented by the laboratory:
– Sample extraction /preparation – Sample analysis – Data reduction – Data reporting
• Laboratory personnel are responsible for sample custody until the samples are returned to the sample custodian.
• When sample analysis and QC procedures are completed any remaining sample must be stored in accordance with contractual terms. A minimum of 30 days notice must be provided before disposal of any sample. Data sheets, custody documents and all other laboratory records must be retained in accordance with contractual agreements.

Section: Worksheet #27 Revision: 1
Date: July 2008
Quality Assurance Project Plan Phase I RI Low Resolution Coring/Sediment Sampling Lower Passaic River Restoration Project Newark, New Jersey Page 3 of 3
QAPP Worksheet #27 (UFP-QAPP Manual Section 3.3.3) Sample Custody Requirements
J:\Water\ProjectFiles\P120\12182_Passaic\QAPP\Rev 1_July 2008\2008_Low Res Core QAPP_2008 July 18_Rev1_worksheets20-37_DQOs.doc
Final Evidence Files
Laboratory records including COCs and other sample receiving records, sample preparation and analysis records, and the final data package become part of the laboratory final evidence file and must be retained as required by the contractual agreement. An original copy of the data package and associated electronic deliverable must be provided to ENSR in accordance with the contractual agreement and will be retained by ENSR along with associated field records and other related correspondence.
Final evidence files as retained by ENSR will include, but not be limited to, correspondence (paper and email), plans, contractual documents, maps and drawings, field data, calculations, assessment reports, laboratory deliverables, progress and data reports. This information will be maintained in a secure area according to the procedures outlined in the Lower Passaic River Quality Management Plan (ENSR, 2007).

Section: Worksheet #28 Revision: 1
Date: July 2008
Quality Assurance Project Plan Phase I RI Low Resolution Coring/Sediment Sampling Lower Passaic River Restoration Project Newark, New Jersey Page 1 of 48
J:\Water\ProjectFiles\P120\12182_Passaic\QAPP\Rev 1_July 2008\2008_Low Res Core QAPP_2008 July 18_Rev1_worksheets20-37_DQOs.doc
QAPP Worksheet #28 (UFP-QAPP Manual Section 3.4) QC Samples Table
Matrix Sediment Analytical Group VOCs Concentration Level Low Sampling SOP LPR-S-01, LPR-S-02, LPR-S-03, LPR-S-04 Analytical Method/ SOP Reference L-1 Sampler’s Name ENSR Field Staff Field Sampling Organization ENSR Analytical Organization TestAmerica (Knoxville) Number of Sample Locations 115
QC Sample Frequency/
Number
Method/SOP QC Acceptance
Limits Corrective Action
Person(s) Responsible for
Corrective Action Data Quality
Indicator (DQI) Measurement
Performance Criteria
Method Blank, Equipment Rinsate Blank, and Trip Blank
Method Blank - 1/Batch (20 samples); Equipment Rinsate Blank: 1 per week per sampling team Trip Blank: 1 per cooler of VOC samples
No Target Compounds>QL; no common lab contaminants >5xQL.
If sufficient sample is available, reanalyze samples. Qualify data as needed. Report results if sample results >20x blank result or sample results ND.
Analyst/Section Supervisor
Accuracy/Bias-Contamination
No Target Compounds>QL; no common lab contaminants >5xQL.
Surrogates Every sample
See Laboratory % Recovery Control Limits (RCLs) (Appendix C-2)
Check calculations and instrument performance; recalculate, reanalyze
Analyst/Section Supervisor Accuracy/Bias
See Laboratory % RCLs (Appendix C-2)
LCS 1/Batch (20 samples)
See Laboratory % RCLs (Appendix C-2)
If sufficient sample is available, reanalyze samples. Qualify data as needed.
Analyst/Section Supervisor Accuracy/Bias
See Laboratory % RCLs (Appendix C-2)

Section: Worksheet #28 Revision: 1
Date: July 2008
Quality Assurance Project Plan Phase I RI Low Resolution Coring/Sediment Sampling Lower Passaic River Restoration Project Newark, New Jersey Page 2 of 48
QAPP Worksheet #28 (UFP-QAPP Manual Section 3.4) QC Samples Table
J:\Water\ProjectFiles\P120\12182_Passaic\QAPP\Rev 1_July 2008\2008_Low Res Core QAPP_2008 July 18_Rev1_worksheets20-37_DQOs.doc
QC Sample Frequency/
Number
Method/SOP QC Acceptance
Limits Corrective Action
Person(s) Responsible for
Corrective Action Data Quality
Indicator (DQI) Measurement
Performance Criteria
MS/MSD 1/Batch (20 samples)
See Laboratory % RCLs/RPD Control Limits (Appendix C-2)
Flag Data. Discuss in narrative.
Analyst/Section Supervisor
Accuracy/Bias-Precision
See Laboratory % Recovery/RPD Control Limits (Appendix C-2)
Field Duplicate 1/20 field samples RPD ≤ 50% if both samples are > 5x QL
Evaluate during data validation. Qualify data.
ENSR Data Validators Precision RPD ≤ 50% if both
samples are >5x QL
Performance Evaluation Sample 1 Supplier Certified
Limits Provide feedback to lab/lab reviews data
ENSR Chemists/ Laboratory Staff
Accuracy/Bias Supplier Certified Limits

Section: Worksheet #28 Revision: 1
Date: July 2008
Quality Assurance Project Plan Phase I RI Low Resolution Coring/Sediment Sampling Lower Passaic River Restoration Project Newark, New Jersey Page 3 of 48
QAPP Worksheet #28 (UFP-QAPP Manual Section 3.4) QC Samples Table
J:\Water\ProjectFiles\P120\12182_Passaic\QAPP\Rev 1_July 2008\2008_Low Res Core QAPP_2008 July 18_Rev1_worksheets20-37_DQOs.doc
Matrix Sediment Analytical Group SVOCs Concentration Level Low Sampling SOP LPR-S-01, LPR-S-02, LPR-S-03, LPR-S-04 Analytical Method/ SOP Reference L-2, L-3 Sampler’s Name ENSR Field Staff Field Sampling Organization ENSR Analytical Organization TestAmerica (Knoxville) Number of Sample Locations 115
QC Sample Frequency/
Number
Method/SOP QC Acceptance
Limits Corrective Action
Person(s) Responsible for
Corrective Action Data Quality
Indicator (DQI) Measurement
Performance Criteria
Method Blank and Equipment Rinsate Blank
Method Blank - 1/Batch (20 samples); Equipment Rinsate Blank: 1 per week per sampling team
No Target Compounds>QL; no common lab contaminants >5xQL.
If sufficient sample is available, reanalyze samples. Qualify data as needed. Report results if sample results >20x blank result or sample results ND.
Analyst/Section Supervisor
Accuracy/Bias-Contamination
No Target Compounds>QL; no common lab contaminants >5xQL.
Surrogates Every sample See Laboratory % RCLs (Appendix C-2)
Check calculations and instrument performance; recalculate, reanalyze
Analyst/Section Supervisor Accuracy/Bias
See Laboratory % RCLs (Appendix C-2)
LCS 1/Batch (20 samples)
See Laboratory % RCLs (Appendix C-2)
If sufficient sample is available, reanalyze samples. Qualify data as needed.
Analyst/Section Supervisor Accuracy/Bias
See Laboratory % RCLts (Appendix C-2)
MS/MSD 1/Batch (20 samples)
See Laboratory % RCLs/ RPD Control Limits (Appendix C-2)
Flag Data. Discuss in narrative.
Analyst/Section Supervisor
Accuracy/Bias-Precision
See Laboratory % Recovery/ RPD Control Limits (Appendix C-2)
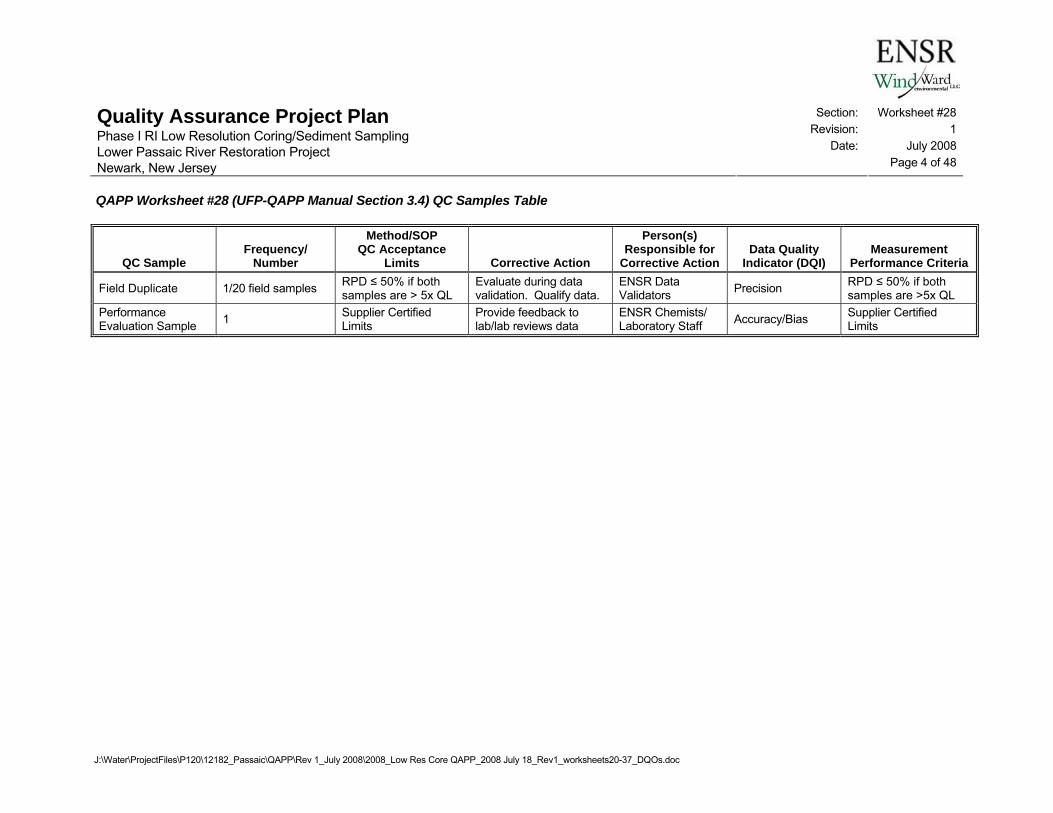
Section: Worksheet #28 Revision: 1
Date: July 2008
Quality Assurance Project Plan Phase I RI Low Resolution Coring/Sediment Sampling Lower Passaic River Restoration Project Newark, New Jersey Page 4 of 48
QAPP Worksheet #28 (UFP-QAPP Manual Section 3.4) QC Samples Table
J:\Water\ProjectFiles\P120\12182_Passaic\QAPP\Rev 1_July 2008\2008_Low Res Core QAPP_2008 July 18_Rev1_worksheets20-37_DQOs.doc
QC Sample Frequency/
Number
Method/SOP QC Acceptance
Limits Corrective Action
Person(s) Responsible for
Corrective Action Data Quality
Indicator (DQI) Measurement
Performance Criteria
Field Duplicate 1/20 field samples RPD ≤ 50% if both samples are > 5x QL
Evaluate during data validation. Qualify data.
ENSR Data Validators Precision RPD ≤ 50% if both
samples are >5x QL Performance Evaluation Sample 1 Supplier Certified
Limits Provide feedback to lab/lab reviews data
ENSR Chemists/ Laboratory Staff Accuracy/Bias Supplier Certified
Limits

Section: Worksheet #28 Revision: 1
Date: July 2008
Quality Assurance Project Plan Phase I RI Low Resolution Coring/Sediment Sampling Lower Passaic River Restoration Project Newark, New Jersey Page 5 of 48
QAPP Worksheet #28 (UFP-QAPP Manual Section 3.4) QC Samples Table
J:\Water\ProjectFiles\P120\12182_Passaic\QAPP\Rev 1_July 2008\2008_Low Res Core QAPP_2008 July 18_Rev1_worksheets20-37_DQOs.doc
Matrix Sediment Analytical Group PAHs and Alkyl PAHs (HRGC/LRMS-SIM) Concentration Level Low Sampling SOP LPR-S-01, LPR-S-02, LPR-S-03, LPR-S-04 Analytical Method/ SOP Reference L-6 Sampler’s Name ENSR Field Staff Field Sampling Organization ENSR Analytical Organization TestAmerica (Knoxville) Number of Sample Locations 115
QC Sample Frequency/
Number
Method/SOP QC Acceptance
Limits Corrective Action
Person(s) Responsible for
Corrective Action Data Quality
Indicator (DQI) Measurement
Performance Criteria
Method Blank and Equipment Rinsate Blank
Method Blank - 1/Batch (20 samples); Equipment Rinsate Blank: 1 per week per sampling team
No Target Compounds>EML.
If sufficient sample is available, reanalyze samples. Qualify data as needed. Report results if sample results >20x blank result or sample results ND.
Analyst/Section Supervisor
Accuracy/Bias-Contamination
No Target Compounds>EML.
Pre-extraction Internal Standards Every sample
See Laboratory % RCLs (Appendix C-2)
Check calculations. Ensure that instrument performance is acceptable. If signal/noise ratio is <10, reprepare and reanalyze sample. If signal/noise ratio is >10, flag the data
Analyst/Section Supervisor Accuracy/Bias
See Laboratory % RCLs (Appendix C-2)
LCS 1/Batch (20 samples)
See Laboratory % RCLs (Appendix C-2)
If sufficient sample is available, reanalyze samples. Qualify data as needed.
Analyst/Section Supervisor Accuracy/Bias
See Laboratory % RCLs (Appendix C-2)

Section: Worksheet #28 Revision: 1
Date: July 2008
Quality Assurance Project Plan Phase I RI Low Resolution Coring/Sediment Sampling Lower Passaic River Restoration Project Newark, New Jersey Page 6 of 48
QAPP Worksheet #28 (UFP-QAPP Manual Section 3.4) QC Samples Table
J:\Water\ProjectFiles\P120\12182_Passaic\QAPP\Rev 1_July 2008\2008_Low Res Core QAPP_2008 July 18_Rev1_worksheets20-37_DQOs.doc
QC Sample Frequency/
Number
Method/SOP QC Acceptance
Limits Corrective Action
Person(s) Responsible for
Corrective Action Data Quality
Indicator (DQI) Measurement
Performance Criteria
MS/MSD 1/Batch (20 samples)
See Laboratory % RCLs/ RPD Control Limits (Appendix C-2
Flag Data. Discuss in narrative..
Analyst/Section Supervisor
Accuracy/Bias- Precision
See Laboratory % RCLs (Appendix C-2
Field Duplicate 1/20 field samples RPD ≤ 50% if both samples are > 5x QL
Evaluate during data validation. Qualify data.
ENSR Data Validators Precision RPD ≤ 50% if both
samples are >5x QL Performance Evaluation Sample 1 Supplier Certified
Limits Provide feedback to lab/lab reviews data
ENSR Chemists/ Laboratory Staff Accuracy/Bias Supplier Certified
Limits

Section: Worksheet #28 Revision: 1
Date: July 2008
Quality Assurance Project Plan Phase I RI Low Resolution Coring/Sediment Sampling Lower Passaic River Restoration Project Newark, New Jersey Page 7 of 48
QAPP Worksheet #28 (UFP-QAPP Manual Section 3.4) QC Samples Table
J:\Water\ProjectFiles\P120\12182_Passaic\QAPP\Rev 1_July 2008\2008_Low Res Core QAPP_2008 July 18_Rev1_worksheets20-37_DQOs.doc
Matrix Sediment Analytical Group Organochlorine Pesticides (GC/ECD) Concentration Level Low Sampling SOP LPR-S-01, LPR-S-02, LPR-S-03, LPR-S-04 Analytical Method/ SOP Reference L-2, L-4, L-56 Sampler’s Name ENSR Field Staff Field Sampling Organization ENSR Analytical Organization TestAmerica (Knoxville) Number of Sample Locations 115
QC Sample Frequency/
Number
Method/SOP QC Acceptance
Limits Corrective Action
Person(s) Responsible for
Corrective Action Data Quality
Indicator (DQI) Measurement
Performance Criteria
Method Blank and Equipment Rinsate Blank
Method Blank - 1/Batch (20 samples); Equipment Rinsate Blank: 1 per week per sampling team
No Target Compounds>QL.
Reanalyze affected samples. Qualify data as needed.
Analyst/Section Supervisor
Accuracy/Bias Contamination
No Target Compounds>QL.
Surrogates Every sample See Laboratory % RCLs (Appendix C-2)
Check calculations and instrument performance; recalculate, reanalyze
Analyst/Section Supervisor Accuracy/Bias
See Laboratory % RCLs (Appendix C-2)
LCS 1/Batch (20 samples)
See Laboratory % RCLs (Appendix C-2)
Reanalyze affected samples. Qualify data as needed.
Analyst/Section Supervisor Accuracy/Bias
See Laboratory % RCLs (Appendix C-2)
MS/MSD 1/Batch (20 samples)
See Laboratory % RCLs/RPD Control Limits (Appendix C-2)
Flag Data. Discuss in narrative.
Analyst/Section Supervisor
Accuracy/Bias- Precision
See Laboratory % Recovery/RPD Control Limits (Appendix C-2)

Section: Worksheet #28 Revision: 1
Date: July 2008
Quality Assurance Project Plan Phase I RI Low Resolution Coring/Sediment Sampling Lower Passaic River Restoration Project Newark, New Jersey Page 8 of 48
QAPP Worksheet #28 (UFP-QAPP Manual Section 3.4) QC Samples Table
J:\Water\ProjectFiles\P120\12182_Passaic\QAPP\Rev 1_July 2008\2008_Low Res Core QAPP_2008 July 18_Rev1_worksheets20-37_DQOs.doc
QC Sample Frequency/
Number
Method/SOP QC Acceptance
Limits Corrective Action
Person(s) Responsible for
Corrective Action Data Quality
Indicator (DQI) Measurement
Performance Criteria
Field Duplicate 1/20 field samples RPD ≤ 50% if both samples are > 5x QL
Evaluate during data validation. Qualify data.
ENSR Data Validators Precision RPD ≤ 50% if both
samples are >5x QL Performance Evaluation Sample 1 Supplier Certified
Limits Provide feedback to lab/lab reviews data
ENSR Chemists/ Laboratory Staff Accuracy/Bias Supplier Certified Limits

Section: Worksheet #28 Revision: 1
Date: July 2008
Quality Assurance Project Plan Phase I RI Low Resolution Coring/Sediment Sampling Lower Passaic River Restoration Project Newark, New Jersey Page 9 of 48
QAPP Worksheet #28 (UFP-QAPP Manual Section 3.4) QC Samples Table
J:\Water\ProjectFiles\P120\12182_Passaic\QAPP\Rev 1_July 2008\2008_Low Res Core QAPP_2008 July 18_Rev1_worksheets20-37_DQOs.doc
Matrix Sediment Analytical Group Organochlorine Pesticides (HRGC/HRMS) Concentration Level Low Sampling SOP LPR-s-01, LPR-S-02, LPR-S-03, LPR-S-04 Analytical Method/ SOP Reference L-15 Sampler’s Name ENSR Field Staff Field Sampling Organization ENSR Analytical Organization TestAmerica (West Sacramento) Number of Sample Locations 115
QC Sample Frequency/
Number
Method/SOP QC Acceptance
Limits Corrective Action
Person(s) Responsible for
Corrective Action Data Quality
Indicator (DQI) Measurement
Performance Criteria
Method Blank and Equipment Rinsate Blank
Method Blank - 1/Batch (20 samples); Equipment Rinsate Blank: 1 per week per sampling team
No Target Compounds>QL.
1) Report results if sample results >10x blank result or sample results ND. 2) If results are <20x blank and if sufficient sample is available, re-extract and reanalyze samples. 3) If insufficient sample is available, reanalyze extracts. 4) Qualify data as needed.
Analyst/Section Supervisor
Accuracy/Bias- Contamination
No Target Compounds>QL.
Instrument Blank Once per 12 hours if method blank is not run
No Target Compounds>QL
Reanalyze affected samples. Qualify data as needed
Analyst/Section Supervisor
Accuracy/Bias-Contamination
No Target Compounds>QL.

Section: Worksheet #28 Revision: 1
Date: July 2008
Quality Assurance Project Plan Phase I RI Low Resolution Coring/Sediment Sampling Lower Passaic River Restoration Project Newark, New Jersey Page 10 of 48
QAPP Worksheet #28 (UFP-QAPP Manual Section 3.4) QC Samples Table
J:\Water\ProjectFiles\P120\12182_Passaic\QAPP\Rev 1_July 2008\2008_Low Res Core QAPP_2008 July 18_Rev1_worksheets20-37_DQOs.doc
QC Sample Frequency/
Number
Method/SOP QC Acceptance
Limits Corrective Action
Person(s) Responsible for
Corrective Action Data Quality
Indicator (DQI) Measurement
Performance Criteria
OPR Sample (or LCS)
1/Batch (20 samples)
See Laboratory % RCLs (Appendix C-2)
1) Check calculations. 2) Reanalyze LCS. Repeated reanalysis is acceptable if the failure is attributed to instrument variability. 3) If repeated failures occur on consecutive LCS's for the same analyte, the cause of the failure will be investigated and corrected before any re-extraction is performed. 4) If sufficient sample is available, re-extract and reanalyze samples. 5) If insufficient sample is available, reanalyze extracts. Qualify data as needed.
Analyst/Section Supervisor Accuracy/Bias
See Laboratory % RCLs (Appendix C-2)

Section: Worksheet #28 Revision: 1
Date: July 2008
Quality Assurance Project Plan Phase I RI Low Resolution Coring/Sediment Sampling Lower Passaic River Restoration Project Newark, New Jersey Page 11 of 48
QAPP Worksheet #28 (UFP-QAPP Manual Section 3.4) QC Samples Table
J:\Water\ProjectFiles\P120\12182_Passaic\QAPP\Rev 1_July 2008\2008_Low Res Core QAPP_2008 July 18_Rev1_worksheets20-37_DQOs.doc
QC Sample Frequency/
Number
Method/SOP QC Acceptance
Limits Corrective Action
Person(s) Responsible for
Corrective Action Data Quality
Indicator (DQI) Measurement
Performance Criteria
Labeled Isotope Dilution Internal Standards
Spiked into every sample and QC sample
. See Laboratory % RCLs (Appendix C-2)
Check all calculations for error; ensure that instrument performance is acceptable; recalculate the data and/or reanalyze the extract if either of the above checks reveals a problem. If S/N<10 for the quantitation ion, reprepare and reanalyze the sample. If S/N>10, flag the data.
Analyst/Section Supervisor Accuracy/Bias
See Laboratory % RCLs (Appendix C-2)
MS/MSD or MS/ Laboratory Duplicate
1/Batch (20 samples)
See Laboratory % RCLS/RPD Control Limits (Appendix C-2)
1) Review Internal Standards. 2) If %R or RPD exceeds limit, re-inject extract. 3) Narrate any outliers.
Analyst/Section Supervisor
Accuracy/Bias-Precision
See Laboratory % Recovery/RPD Control Limits (Appendix C-2)
Field Duplicate 1/20 field samples RPD ≤ 50% if both samples are > 5x QL
Evaluate during data validation. Qualify data.
ENSR Data Validators Precision RPD ≤ 50% if both
samples are >5x QL Performance Evaluation Sample 1 Supplier Certified
Limits Provide feedback to lab/lab reviews data
ENSR Chemists/ Laboratory Staff Accuracy/Bias Supplier Certified Limits

Section: Worksheet #28 Revision: 1
Date: July 2008
Quality Assurance Project Plan Phase I RI Low Resolution Coring/Sediment Sampling Lower Passaic River Restoration Project Newark, New Jersey Page 12 of 48
QAPP Worksheet #28 (UFP-QAPP Manual Section 3.4) QC Samples Table
J:\Water\ProjectFiles\P120\12182_Passaic\QAPP\Rev 1_July 2008\2008_Low Res Core QAPP_2008 July 18_Rev1_worksheets20-37_DQOs.doc
Matrix Sediment Analytical Group PCB Aroclors (GC/ECD) Concentration Level Low Sampling SOP LPR-S-01, LPR-S-02, LPR-S-03, LPR-S-04 Analytical Method/ SOP Reference L-12 Sampler’s Name ENSR Field Staff Field Sampling Organization ENSR Analytical Organization TestAmerica (Knoxville) Number of Sample Locations 115
QC Sample Frequency/
Number
Method/SOP QC Acceptance
Limits Corrective Action
Person(s) Responsible for
Corrective Action Data Quality
Indicator (DQI) Measurement
Performance Criteria
Method Blank and Equipment Rinsate Blank
Method Blank - 1/Batch (20 samples); Equipment Rinsate Blank: 1 per week per sampling team
No Target Compounds>QL
Reanalyze affected samples. Qualify data as needed.
Analyst/Section Supervisor
Accuracy/Bias Contamination
No Target Compounds>QL
Instrument Blank Once per 12 hours if method blank is not run
No Target Compounds>QL
Reanalyze affected samples. Qualify data as needed
Analyst/Section Supervisor
Accuracy/Bias-Contamination
No Target Compounds>QL.
LCS 1 Per batch of 20 samples
See Laboratory % RCLs (Appendix C-2)
Reanalyze affected samples. Qualify data as needed.
Analyst/Section Supervisor Accuracy/Bias
See Laboratory % RCLs (Appendix C-2)
MS/MSD 1/Batch (20 samples)
See Laboratory % RCLS/RPD Control Limits (Appendix C-2)
Flag Data. Discuss in narrative.
Analyst/Section Supervisor
Accuracy/Bias- Precision
See Laboratory % Recovery/RPD Control Limits (Appendix C-2)

Section: Worksheet #28 Revision: 1
Date: July 2008
Quality Assurance Project Plan Phase I RI Low Resolution Coring/Sediment Sampling Lower Passaic River Restoration Project Newark, New Jersey Page 13 of 48
QAPP Worksheet #28 (UFP-QAPP Manual Section 3.4) QC Samples Table
J:\Water\ProjectFiles\P120\12182_Passaic\QAPP\Rev 1_July 2008\2008_Low Res Core QAPP_2008 July 18_Rev1_worksheets20-37_DQOs.doc
QC Sample Frequency/
Number
Method/SOP QC Acceptance
Limits Corrective Action
Person(s) Responsible for
Corrective Action Data Quality
Indicator (DQI) Measurement
Performance Criteria
Field Duplicate 1/20 field samples RPD ≤ 50% if both samples are > 5x QL
Evaluate during data validation. Qualify data.
ENSR Data Validators Precision RPD ≤ 50% if both
samples are >5x QL Performance Evaluation Sample 1 Supplier Certified
Limits Provide feedback to lab/lab reviews data
ENSR Chemists/ Laboratory Staff Accuracy/Bias Supplier Certified Limits

Section: Worksheet #28 Revision: 1
Date: July 2008
Quality Assurance Project Plan Phase I RI Low Resolution Coring/Sediment Sampling Lower Passaic River Restoration Project Newark, New Jersey Page 14 of 48
QAPP Worksheet #28 (UFP-QAPP Manual Section 3.4) QC Samples Table
J:\Water\ProjectFiles\P120\12182_Passaic\QAPP\Rev 1_July 2008\2008_Low Res Core QAPP_2008 July 18_Rev1_worksheets20-37_DQOs.doc
Matrix Sediment Analytical Group PCBs – Congeners (HRGC/HRMS) Concentration Level Low Sampling SOP LPR-S-01, LPR-S-02, LPR-S-03, LPR-S-04 Analytical Method/ SOP Reference L-7 Sampler’s Name ENSR Field Staff Field Sampling Organization ENSR Analytical Organization TestAmerica (Knoxville) Number of Sample Locations 115
QC Sample Frequency/
Number
Method/SOP QC Acceptance
Limits Corrective Action
Person(s) Responsible for
Corrective Action Data Quality
Indicator (DQI) Measurement
Performance Criteria
Method Blank and Equipment Rinsate Blank
Method Blank - 1/Batch (20 samples); Equipment Rinsate Blank: 1 per week per sampling team
No Target Compounds>EML
Reanalyze affected samples. Qualify data as needed.
Analyst/Section Supervisor
Accuracy/Bias Contamination
No Target Compounds>EML
Instrument Blank Once per 12 hours if method blank is not run
No Target Compounds>EML
Reanalyze affected samples. Qualify data as needed
Analyst/Section Supervisor
Accuracy/Bias-Contamination
No Target Compounds>EML.
OPR Sample (or LCS)
1/Batch (20 samples)
See Laboratory % RCLs (Appendix C-2)
Reanalyze affected samples. Qualify data as needed
Analyst/Section Supervisor
Accuracy/Bias
See Laboratory % RCLs (Appendix C-2)

Section: Worksheet #28 Revision: 1
Date: July 2008
Quality Assurance Project Plan Phase I RI Low Resolution Coring/Sediment Sampling Lower Passaic River Restoration Project Newark, New Jersey Page 15 of 48
QAPP Worksheet #28 (UFP-QAPP Manual Section 3.4) QC Samples Table
J:\Water\ProjectFiles\P120\12182_Passaic\QAPP\Rev 1_July 2008\2008_Low Res Core QAPP_2008 July 18_Rev1_worksheets20-37_DQOs.doc
QC Sample Frequency/
Number
Method/SOP QC Acceptance
Limits Corrective Action
Person(s) Responsible for
Corrective Action Data Quality
Indicator (DQI) Measurement
Performance Criteria
Labeled Isotope Dilution Internal Standards
Spiked into every sample and QC sample.
See Laboratory % RCLs (Appendix C-2)
Check all calculations for error; ensure that instrument performance is acceptable; recalculate the data and/or reanalyze the extract if either of the above checks reveal a problem. If S/N<10 for the quantitation ion, reprepare and reanalyze the sample. If S/N>10, flag the data.
Analyst/Section Supervisor Accuracy/Bias
See Laboratory % RCLs (Appendix C-2)
MS/MSD or MS/ Laboratory Duplicate
1/Batch (20 samples)
See Laboratory % RCLS/RPD Control Limits (Appendix C-2)
Flag Data. Discuss in narrative.
Analyst/Section Supervisor
Accuracy/Bias- Precision
See Laboratory % RCLS/RPD Control Limits (Appendix C-2)
Field Duplicate 1/20 field samples RPD ≤ 50% if both samples are > 5x QL
Evaluate during data validation. Qualify data.
ENSR Data Validators Precision RPD ≤ 50% if both
samples are >5x QL Performance Evaluation Sample 1 Supplier Certified
Limits Provide feedback to lab/lab reviews data
ENSR Chemists/ Laboratory Staff Accuracy/Bias Supplier Certified Limits

Section: Worksheet #28 Revision: 1
Date: July 2008
Quality Assurance Project Plan Phase I RI Low Resolution Coring/Sediment Sampling Lower Passaic River Restoration Project Newark, New Jersey Page 16 of 48
QAPP Worksheet #28 (UFP-QAPP Manual Section 3.4) QC Samples Table
J:\Water\ProjectFiles\P120\12182_Passaic\QAPP\Rev 1_July 2008\2008_Low Res Core QAPP_2008 July 18_Rev1_worksheets20-37_DQOs.doc
Matrix Sediment Analytical Group Herbicides (GC/ECD) Concentration Level Low Sampling SOP LPR-S-01, LPR-S-02, LPR-S-03, LPR-S-04 Analytical Method/ SOP Reference L-11, L-12 Field Sampling Organization ENSR Field Staff Analytical Organization TestAmerica (Pittsburgh) Number of Sample Locations 115
QC Sample Frequency/
Number
Method/SOP QC Acceptance
Limits Corrective Action
Person(s) Responsible for
Corrective Action Data Quality
Indicator (DQI) Measurement
Performance Criteria
Method Blank and Equipment Rinsate Blank
Method Blank - 1/Batch (20 samples); Equipment Rinsate Blank: 1 per week per sampling team
No Target Compounds>QL
Reanalyze affected samples. Qualify data as needed.
Analyst/Section Supervisor
Accuracy/Bias Contamination
No Target Compounds>QL
LCS 1/Batch (20 samples)
See Laboratory % RCLs (Appendix C-2)
Reanalyze affected samples. Qualify data as needed.
Analyst/Section Supervisor Accuracy/Bias
RCLs (Appendix C-2)
MS/MSD 1/Batch (20 samples)
See Laboratory % RCLS/RPD Control Limits (Appendix C-2)
Flag Data. Discuss in narrative.
Analyst/Section Supervisor
Accuracy/Bias- Precision
See Laboratory % Recovery/RPD Control Limits (Appendix C-2)
Field Duplicate 1/20 field samples RPD ≤ 50% if both samples are > 5x QL
Evaluate during data validation. Qualify data.
ENSR Data Validators Precision RPD ≤ 50% if both
samples are >5x QL Performance Evaluation Sample 1 Supplier Certified
Limits Provide feedback to lab/lab reviews data
ENSR Chemists/ Laboratory Staff Accuracy/Bias Supplier Certified Limits

Section: Worksheet #28 Revision: 1
Date: July 2008
Quality Assurance Project Plan Phase I RI Low Resolution Coring/Sediment Sampling Lower Passaic River Restoration Project Newark, New Jersey Page 17 of 48
QAPP Worksheet #28 (UFP-QAPP Manual Section 3.4) QC Samples Table
J:\Water\ProjectFiles\P120\12182_Passaic\QAPP\Rev 1_July 2008\2008_Low Res Core QAPP_2008 July 18_Rev1_worksheets20-37_DQOs.doc
Matrix Sediment Analytical Group TPH- Extractables (GC/FID) Concentration Level Low - High Sampling SOP LPR-S-01, LPR-S-02, LPR-S-03, LPR-S-04 Analytical Method/ SOP Reference L-13 Sampler’s Name ENSR Field Staff Field Sampling Organization ENSR Analytical Organization TestAmerica (Edison) Number of Sample Locations 115
QC Sample Frequency/
Number
Method/SOP QC Acceptance
Limits Corrective Action
Person(s) Responsible for
Corrective Action Data Quality
Indicator (DQI) Measurement
Performance Criteria
Method Blank and Equipment Rinsate Blank
Method Blank - 1/Batch (20 samples); Equipment Rinsate Blank: 1 per week per sampling team
No Target Compounds>QL
Reanalyze affected samples. Qualify data as needed.
Analyst/Section Supervisor
Accuracy/Bias Contamination
No Target Compounds>QL
Surrogates Every sample See Laboratory % RCLs (Appendix C-2)
Check calculations and instrument performance; recalculate, reanalyze
Analyst/Section Supervisor Accuracy/Bias
See Laboratory % RCLs (Appendix C-2)
LCS 1/Batch (20 samples)
See Laboratory % RCLs (Appendix C-2)
Reanalyze affected samples. Qualify data as needed.
Analyst/Section Supervisor Accuracy/Bias
See Laboratory % RCLs (Appendix C-2)
MS/MSD 1/Batch (20 samples)
See Laboratory % RCLS/RPD Control Limits (Appendix C-2)
Flag Data. Discuss in narrative.
Analyst/Section Supervisor
Accuracy/Bias- Precision
See Laboratory % Recovery/RPD Control Limits (Appendix C-2)

Section: Worksheet #28 Revision: 1
Date: July 2008
Quality Assurance Project Plan Phase I RI Low Resolution Coring/Sediment Sampling Lower Passaic River Restoration Project Newark, New Jersey Page 18 of 48
QAPP Worksheet #28 (UFP-QAPP Manual Section 3.4) QC Samples Table
J:\Water\ProjectFiles\P120\12182_Passaic\QAPP\Rev 1_July 2008\2008_Low Res Core QAPP_2008 July 18_Rev1_worksheets20-37_DQOs.doc
QC Sample Frequency/
Number
Method/SOP QC Acceptance
Limits Corrective Action
Person(s) Responsible for
Corrective Action Data Quality
Indicator (DQI) Measurement
Performance Criteria
Field Duplicate 1/20 field samples RPD ≤ 50% if both samples are > 5x QL
Evaluate during data validation. Qualify data.
ENSR Data Validators Precision RPD ≤ 50% if both
samples are >5x QL Performance Evaluation Sample 1 Supplier Certified
Limits Provide feedback to lab/lab reviews data
ENSR Chemists/ Laboratory Staff Accuracy/Bias Supplier Certified Limits

Section: Worksheet #28 Revision: 1
Date: July 2008
Quality Assurance Project Plan Phase I RI Low Resolution Coring/Sediment Sampling Lower Passaic River Restoration Project Newark, New Jersey Page 19 of 48
QAPP Worksheet #28 (UFP-QAPP Manual Section 3.4) QC Samples Table
J:\Water\ProjectFiles\P120\12182_Passaic\QAPP\Rev 1_July 2008\2008_Low Res Core QAPP_2008 July 18_Rev1_worksheets20-37_DQOs.doc
Matrix Sediment Analytical Group TPH-Purgeables (GC/FID) Concentration Level Low - High Sampling SOP LPR-S-01 Analytical Method/ SOP Reference L-14 Sampler’s Name ENSR Field Staff Field Sampling Organization ENSR Analytical Organization TestAmerica (Edison) Number of Sample Locations 13
QC Sample
Frequency/ Number
Method/SOP QC Acceptance
Limits Corrective Action
Person(s) Responsible for
Corrective Action Data Quality
Indicator (DQI) Measurement
Performance Criteria
Method Blank, Equipment Rinsate Blank, and Trip Blank
Method Blank - 1/Batch (20 samples); Equipment Rinsate Blank: 1 per week per sampling team Trip Blank : 1 per cooler of TPH-purgeable samples
No Target Compounds>QL
Reanalyze affected samples. Qualify data as needed.
Analyst/Section Supervisor
Accuracy/Bias Contamination
No Target Compounds>QL
Surrogates Every sample See Laboratory % RCLs (Appendix C-2)
Check calculations and instrument performance; recalculate, reanalyze
Analyst/Section Supervisor Accuracy/Bias
See Laboratory % RCLs (Appendix C-2)
LCS 1/Batch (20 samples)
See Laboratory % RCLs (Appendix C-2
Reanalyze affected samples. Qualify data as needed.
Analyst/Section Supervisor Accuracy/Bias
See Laboratory % RCLts (Appendix C-2

Section: Worksheet #28 Revision: 1
Date: July 2008
Quality Assurance Project Plan Phase I RI Low Resolution Coring/Sediment Sampling Lower Passaic River Restoration Project Newark, New Jersey Page 20 of 48
QAPP Worksheet #28 (UFP-QAPP Manual Section 3.4) QC Samples Table
J:\Water\ProjectFiles\P120\12182_Passaic\QAPP\Rev 1_July 2008\2008_Low Res Core QAPP_2008 July 18_Rev1_worksheets20-37_DQOs.doc
QC Sample
Frequency/ Number
Method/SOP QC Acceptance
Limits Corrective Action
Person(s) Responsible for
Corrective Action Data Quality
Indicator (DQI) Measurement
Performance Criteria
MS/MSD 1/Batch (20 samples)
See Laboratory % RCLs/RPD Control Limits (Appendix C-2)
Flag Data. Discuss in narrative.
Analyst/Section Supervisor
Accuracy/Bias- Precision
See Laboratory % Recovery/RPD Control Limits (Appendix C-2)
Field Duplicate 1/20 field samples RPD ≤ 50% if both samples are > 5x QL
Evaluate during data validation. Qualify data.
ENSR Data Validators Precision RPD ≤ 50% if both
samples are >5x QL Performance Evaluation Sample 1 Supplier Certified
Limits Provide feedback to lab/lab reviews data
ENSR Chemists/ Laboratory Staff
Accuracy/Bias Supplier Certified Limits

Section: Worksheet #28 Revision: 1
Date: July 2008
Quality Assurance Project Plan Phase I RI Low Resolution Coring/Sediment Sampling Lower Passaic River Restoration Project Newark, New Jersey Page 21 of 48
QAPP Worksheet #28 (UFP-QAPP Manual Section 3.4) QC Samples Table
J:\Water\ProjectFiles\P120\12182_Passaic\QAPP\Rev 1_July 2008\2008_Low Res Core QAPP_2008 July 18_Rev1_worksheets20-37_DQOs.doc
Matrix Sediment Analytical Group Dioxins/Furans (Isotope Dilution Mass Spectrometry) Concentration Level Low Sampling SOP LPR-S-01, LPR-S-02, LPR-S-03, LPR-S-04 Analytical Method/ SOP Reference L-35 Sampler’s Name ENSR Field Staff Field Sampling Organization ENSR Analytical Organization Columbia Analytical Services (Houston) Number of Sample Locations 115
QC Sample Frequency/
Number
Method/SOP QC Acceptance
Limits Corrective Action
Person(s) Responsible for
Corrective Action Data Quality
Indicator (DQI) Measurement
Performance Criteria
Method Blank and Equipment Rinsate Blank
Method Blank - 1/Batch (20 samples); Equipment Rinsate Blank: 1 per week per sampling team
No Target Compounds>QL
Reanalyze affected samples. Qualify data as needed.
Analyst/Section Supervisor
Accuracy/Bias- Contamination
No Target Compounds>QL
Labeled Compounds 1/Batch (20 samples)
See Laboratory % RCLs (Appendix C-2)
Reanalyze affected samples. Qualify data as needed.
Analyst/Section Supervisor Accuracy/Bias
See Laboratory % RCLs (Appendix C-2)
LCS or QC Standard 1/Batch (20 samples)
See Laboratory % RCLs (Appendix C-2)
Reanalyze affected samples. Qualify data as needed.
Analyst/Section Supervisor Accuracy/Bias
See Laboratory % RCLs (Appendix C-2)
MS/MSD 1/Batch (20 samples) See Laboratory % RCLs (Appendix C-2)
Flag Data. Discuss in narrative.
Analyst/Section Supervisor
Accuracy/Bias- Precision
See Laboratory % RCLs (Appendix C-2)

Section: Worksheet #28 Revision: 1
Date: July 2008
Quality Assurance Project Plan Phase I RI Low Resolution Coring/Sediment Sampling Lower Passaic River Restoration Project Newark, New Jersey Page 22 of 48
QAPP Worksheet #28 (UFP-QAPP Manual Section 3.4) QC Samples Table
J:\Water\ProjectFiles\P120\12182_Passaic\QAPP\Rev 1_July 2008\2008_Low Res Core QAPP_2008 July 18_Rev1_worksheets20-37_DQOs.doc
QC Sample Frequency/
Number
Method/SOP QC Acceptance
Limits Corrective Action
Person(s) Responsible for
Corrective Action Data Quality
Indicator (DQI) Measurement
Performance Criteria
Field Duplicate 1/20 field samples RPD ≤ 50% if both samples are > 5x QL
Evaluate during data validation. Qualify data.
ENSR Data Validators Precision RPD ≤ 50% if both
samples are >5x QL Performance Evaluation Sample 1 Supplier Certified
Limits Provide feedback to lab/lab reviews data
ENSR Chemists/ Laboratory Staff Accuracy/Bias Supplier Certified Limits

Section: Worksheet #28 Revision: 1
Date: July 2008
Quality Assurance Project Plan Phase I RI Low Resolution Coring/Sediment Sampling Lower Passaic River Restoration Project Newark, New Jersey Page 23 of 48
QAPP Worksheet #28 (UFP-QAPP Manual Section 3.4) QC Samples Table
J:\Water\ProjectFiles\P120\12182_Passaic\QAPP\Rev 1_July 2008\2008_Low Res Core QAPP_2008 July 18_Rev1_worksheets20-37_DQOs.doc
Matrix Sediment Analytical Group Radiochemistry (Be-7, Cs-137, Pb-210c, K-40) Concentration Level Low Sampling SOP LPR-S-01, LPR-S-02, LPR-S-03, LPR-S-04 Analytical Method/ SOP Reference L-9, L-10, L-45, L-46 Sampler’s Name ENSR Field Staff Field Sampling Organization ENSR Analytical Organization GEL Laboratories, LLC, Charleston, SC Number of Sample Locations 115
QC Sample Frequency/
Number
Method/SOP QC Acceptance
Limits Corrective Action
Person(s) Responsible for
Corrective Action Data Quality
Indicator (DQI) Measurement
Performance Criteria
Method Blank
1 per batch or 1 per 20 samples, whichever is more frequent
No Target Analyte>QL Recount blank or re-analyze batch
Analyst/Section Supervisor
Accuracy/Bias Contamination
No Target Analyte>QL
LCS
1 per batch or 1 per 20 samples, whichever is more frequent
75 -125% Recount LCS or re-analyze batch
Analyst/Section Supervisor Accuracy/Bias 75% - 125%
MSa
1 per batch or 1 per 20 samples, whichever is more frequent
75-125% Recount MS or re-analyze batch
Analyst/Section Supervisor Accuracy/Bias 75% - 125%
Field Duplicate 1/20 field samples RPD ≤ 50% if both samples are > 5x QL
Evaluate during data validation. Qualify data.
ENSR Data Validators Precision RPD ≤ 50% if both
samples are >5x QL
Combine Standard Uncertaintyb All results ≤30%
Recount to a maximum of 1000 minutes or increase sample size
Analyst/Section Supervisor Accuracy/Bias ≤30%

Section: Worksheet #28 Revision: 1
Date: July 2008
Quality Assurance Project Plan Phase I RI Low Resolution Coring/Sediment Sampling Lower Passaic River Restoration Project Newark, New Jersey Page 24 of 48
QAPP Worksheet #28 (UFP-QAPP Manual Section 3.4) QC Samples Table
J:\Water\ProjectFiles\P120\12182_Passaic\QAPP\Rev 1_July 2008\2008_Low Res Core QAPP_2008 July 18_Rev1_worksheets20-37_DQOs.doc
QC Sample Frequency/
Number
Method/SOP QC Acceptance
Limits Corrective Action
Person(s) Responsible for
Corrective Action Data Quality
Indicator (DQI) Measurement
Performance Criteria
Laboratory Duplicate
1 per batch or 1 per 20 samples, whichever is more frequent
RPD ≤20%, if both samples >5x QL
Recount or re-analyze Sample & Duplicate
Analyst/Section Supervisor Precision RPD ≤20%, if both
samples > 5x QL
Tracera
1 per batch or 1 per 20 samples, whichever is more frequent
50 - 120% RE, if still out then re-prep and re-analyze
Analyst/Section Supervisor Accuracy/Bias 50 - 120%
a Applicable to alpha spectrometry analysis only. b Combined standard uncertainty is the 2-sigma expanded measurement uncertainty. C Lead 210 will be determined as polonium-210 and radium-226.

Section: Worksheet #28 Revision: 1
Date: July 2008
Quality Assurance Project Plan Phase I RI Low Resolution Coring/Sediment Sampling Lower Passaic River Restoration Project Newark, New Jersey Page 25 of 48
QAPP Worksheet #28 (UFP-QAPP Manual Section 3.4) QC Samples Table
J:\Water\ProjectFiles\P120\12182_Passaic\QAPP\Rev 1_July 2008\2008_Low Res Core QAPP_2008 July 18_Rev1_worksheets20-37_DQOs.doc
Matrix Sediment Analytical Group Metals: ICP/AES 6010B Concentration Level Low Sampling SOP LPR-S-01, LPR-S-02, LPR-S-03, LPR-S-04 Analytical Method/ SOP Reference L-16, L-18 Sampler’s Name ENSR Field Staff Field Sampling Organization ENSR Analytical Organization Columbia Analytical Services (Kelso) Number of Sample Locations 115
QC Sample Frequency/
Number
Method/SOP QC Acceptance
Limits Corrective Action
Person(s) Responsible for
Corrective Action Data Quality
Indicator (DQI) Measurement
Performance Criteria
Method Blank and Equipment Rinsate Blank
Method Blank - 1/Batch (20 samples); Equipment Rinsate Blank: 1 per week per sampling team
No Target Compounds>QL
Reanalyze affected samples. Qualify data as needed.
Analyst/Section Accuracy/Bias Contamination
No Target Compounds>QL
LCS or QC Standard 1/Batch (20 samples)
See Laboratory % RCLs (Appendix C-2)
Reanalyze affected samples. Qualify data as needed.
Analyst/Section Accuracy/Bias See Laboratory % RCLs (Appendix C-2)
Laboratory Duplicates
1/Batch (20 samples) RPD 30%
Reanalyze affected samples. Qualify data as needed.
Analyst/Section Supervisor Precision RPD 30%
MS 1/Batch (20 samples)
See Laboratory % RCLs (Appendix C-2)
Flag Data. Discuss in narrative. Analyst/Section Accuracy/Bias
See Laboratory % RCLs (Appendix C-2)

Section: Worksheet #28 Revision: 1
Date: July 2008
Quality Assurance Project Plan Phase I RI Low Resolution Coring/Sediment Sampling Lower Passaic River Restoration Project Newark, New Jersey Page 26 of 48
QAPP Worksheet #28 (UFP-QAPP Manual Section 3.4) QC Samples Table
J:\Water\ProjectFiles\P120\12182_Passaic\QAPP\Rev 1_July 2008\2008_Low Res Core QAPP_2008 July 18_Rev1_worksheets20-37_DQOs.doc
QC Sample Frequency/
Number
Method/SOP QC Acceptance
Limits Corrective Action
Person(s) Responsible for
Corrective Action Data Quality
Indicator (DQI) Measurement
Performance Criteria
Field Duplicate 1/20 field samples RPD ≤ 35% if both samples are > 5x QL
Evaluate during data validation. Qualify data.
ENSR Data Validators Precision RPD ≤ 35% if both
samples are >5x QL Performance Evaluation Sample 1 Supplier Certified
Limits Provide feedback to lab/lab reviews data
ENSR Chemists/ Laboratory Staff Accuracy/Bias Supplier Certified Limits
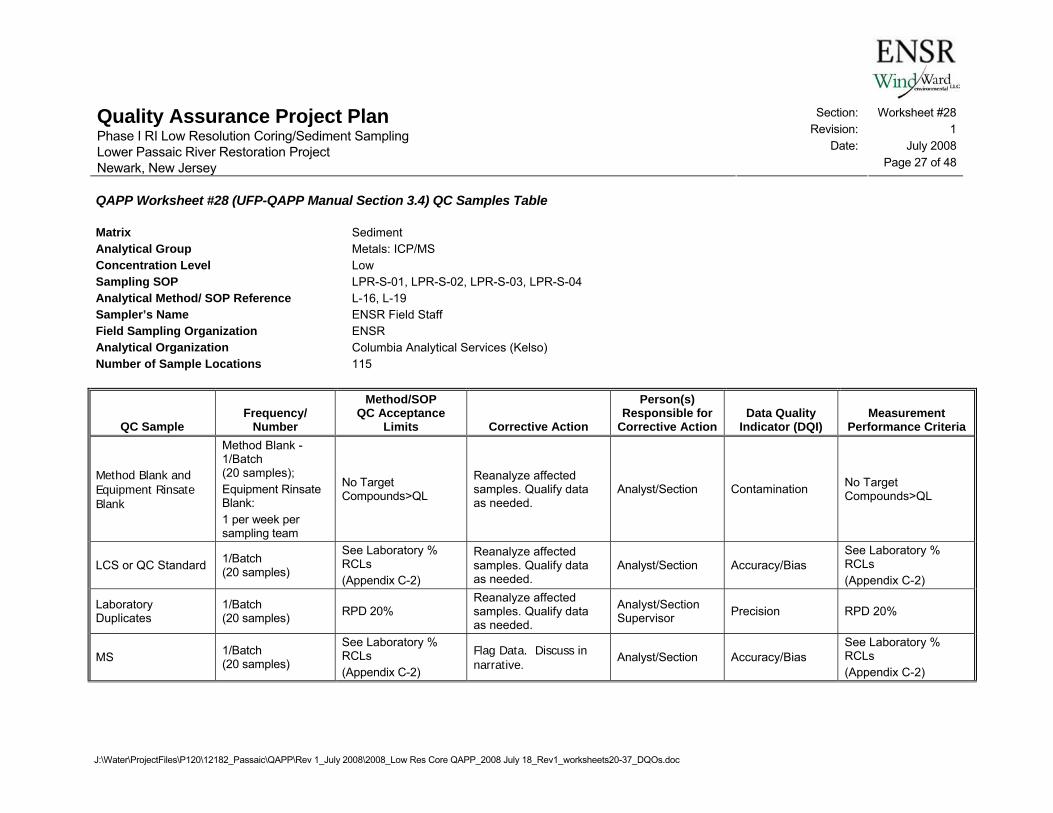
Section: Worksheet #28 Revision: 1
Date: July 2008
Quality Assurance Project Plan Phase I RI Low Resolution Coring/Sediment Sampling Lower Passaic River Restoration Project Newark, New Jersey Page 27 of 48
QAPP Worksheet #28 (UFP-QAPP Manual Section 3.4) QC Samples Table
J:\Water\ProjectFiles\P120\12182_Passaic\QAPP\Rev 1_July 2008\2008_Low Res Core QAPP_2008 July 18_Rev1_worksheets20-37_DQOs.doc
Matrix Sediment Analytical Group Metals: ICP/MS Concentration Level Low Sampling SOP LPR-S-01, LPR-S-02, LPR-S-03, LPR-S-04 Analytical Method/ SOP Reference L-16, L-19 Sampler’s Name ENSR Field Staff Field Sampling Organization ENSR Analytical Organization Columbia Analytical Services (Kelso) Number of Sample Locations 115
QC Sample Frequency/
Number
Method/SOP QC Acceptance
Limits Corrective Action
Person(s) Responsible for
Corrective Action Data Quality
Indicator (DQI) Measurement
Performance Criteria
Method Blank and Equipment Rinsate Blank
Method Blank - 1/Batch (20 samples); Equipment Rinsate Blank: 1 per week per sampling team
No Target Compounds>QL
Reanalyze affected samples. Qualify data as needed.
Analyst/Section Contamination No Target Compounds>QL
LCS or QC Standard 1/Batch (20 samples)
See Laboratory % RCLs (Appendix C-2)
Reanalyze affected samples. Qualify data as needed.
Analyst/Section Accuracy/Bias See Laboratory % RCLs (Appendix C-2)
Laboratory Duplicates
1/Batch (20 samples) RPD 20%
Reanalyze affected samples. Qualify data as needed.
Analyst/Section Supervisor Precision RPD 20%
MS 1/Batch (20 samples)
See Laboratory % RCLs (Appendix C-2)
Flag Data. Discuss in narrative. Analyst/Section Accuracy/Bias
See Laboratory % RCLs (Appendix C-2)

Section: Worksheet #28 Revision: 1
Date: July 2008
Quality Assurance Project Plan Phase I RI Low Resolution Coring/Sediment Sampling Lower Passaic River Restoration Project Newark, New Jersey Page 28 of 48
QAPP Worksheet #28 (UFP-QAPP Manual Section 3.4) QC Samples Table
J:\Water\ProjectFiles\P120\12182_Passaic\QAPP\Rev 1_July 2008\2008_Low Res Core QAPP_2008 July 18_Rev1_worksheets20-37_DQOs.doc
QC Sample Frequency/
Number
Method/SOP QC Acceptance
Limits Corrective Action
Person(s) Responsible for
Corrective Action Data Quality
Indicator (DQI) Measurement
Performance Criteria
Field Duplicate 1/20 field samples RPD ≤ 35% if both samples are > 5x QL
Evaluate during data validation. Qualify data.
ENSR Data Validators Precision RPD ≤ 35% if both
samples are >5x QL Performance Evaluation Sample 1 Supplier Certified
Limits Provide feedback to lab/lab reviews data
ENSR Chemists/ Laboratory Staff Accuracy/Bias Supplier Certified Limits

Section: Worksheet #28 Revision: 1
Date: July 2008
Quality Assurance Project Plan Phase I RI Low Resolution Coring/Sediment Sampling Lower Passaic River Restoration Project Newark, New Jersey Page 29 of 48
QAPP Worksheet #28 (UFP-QAPP Manual Section 3.4) QC Samples Table
J:\Water\ProjectFiles\P120\12182_Passaic\QAPP\Rev 1_July 2008\2008_Low Res Core QAPP_2008 July 18_Rev1_worksheets20-37_DQOs.doc
Matrix Sediment Analytical Group Metals: Mercury, Low Level Mercury Concentration Level Low Sampling SOP LPR-S-01, LPR-S-02, LPR-S-03, LPR-S-04 Analytical Method/ SOP Reference L-36 Sampler’s Name ENSR Field Staff Field Sampling Organization ENSR Analytical Organization Brooks Rand, LLC Number of Sample Locations 115
QC Sample Frequency/
Number
Method/SOP QC Acceptance
Limits Corrective Action
Person(s) Responsible for
Corrective Action Data Quality
Indicator (DQI) Measurement
Performance Criteria
Method Blank 1/Batch (20 samples);
Average MB <2x MDL and standard deviation <0.67x MDL or <0.1x the concentration of project samples
Reanalyze affected samples. Qualify data as needed.
Analyst/Section Supervisor Contamination
Average MB <2x MDL and standard deviation <0.67x MDL or <0.1x the concentration of project samples
Equipment Rinsate Blank
1 per week per sampling team
No Target Compounds>QL
Reanalyze affected samples. Qualify data as needed.
Analyst/Section Contamination No Target Compounds>QL
LCS 1/batch 80 -120% Reanalyze affected samples. Qualify data as needed.
Analyst/Section Supervisor Accuracy/Bias 80 -120% of expected
value
CRM 1/Batch (10 samples)
Within 25% of certified value
Reanalyze affected samples. Qualify data as needed.
Analyst/Section Accuracy/Bias Within 25% of certified value
Laboratory Duplicates
1/Batch (10 samples)
RPD 30% (or ±2x the QL if result is ≤5x the QL)
Reanalyze affected samples. Qualify data as needed.
Analyst/Section Supervisor Precision
RPD 30% (or ±2x the QL if result is ≤5x the QL)
MS/MSD 1/Batch (10 samples)
70-130% R ≤30% RPD
Flag Data. Discuss in narrative. Analyst/Section Accuracy/Bias-
Precision 70-130% R 30 RPD

Section: Worksheet #28 Revision: 1
Date: July 2008
Quality Assurance Project Plan Phase I RI Low Resolution Coring/Sediment Sampling Lower Passaic River Restoration Project Newark, New Jersey Page 30 of 48
QAPP Worksheet #28 (UFP-QAPP Manual Section 3.4) QC Samples Table
J:\Water\ProjectFiles\P120\12182_Passaic\QAPP\Rev 1_July 2008\2008_Low Res Core QAPP_2008 July 18_Rev1_worksheets20-37_DQOs.doc
QC Sample Frequency/
Number
Method/SOP QC Acceptance
Limits Corrective Action
Person(s) Responsible for
Corrective Action Data Quality
Indicator (DQI) Measurement
Performance Criteria
Field Duplicate 1/20 field samples RPD ≤ 50% if both samples are > 5x QL
Evaluate during data validation. Qualify data.
ENSR Data Validators Precision RPD ≤ 50% if both
samples are >5x QL Performance Evaluation Sample 1 Supplier Certified
Limits Provide feedback to lab/lab reviews data
ENSR Chemists/ Laboratory Staff Accuracy/Bias Supplier Certified Limits

Section: Worksheet #28 Revision: 1
Date: July 2008
Quality Assurance Project Plan Phase I RI Low Resolution Coring/Sediment Sampling Lower Passaic River Restoration Project Newark, New Jersey Page 31 of 48
QAPP Worksheet #28 (UFP-QAPP Manual Section 3.4) QC Samples Table
J:\Water\ProjectFiles\P120\12182_Passaic\QAPP\Rev 1_July 2008\2008_Low Res Core QAPP_2008 July 18_Rev1_worksheets20-37_DQOs.doc
Matrix Sediment Analytical Group Metals: Methyl Mercury Concentration Level Low Sampling SOP LPR-S-01 Analytical Method/ SOP Reference L-36 Sampler’s Name ENSR Field Staff Field Sampling Organization ENSR Analytical Organization Brooks Rand, LLC Number of Sample Locations 13
QC Sample Frequency/
Number
Method/SOP QC Acceptance
Limits Corrective Action
Person(s) Responsible for
Corrective Action Data Quality
Indicator (DQI) Measurement
Performance Criteria
Method Blank
Minimum of four method blanks with each batch (10 samples)
Average MB ≤0.45 ng/L and standard deviation <0.15 ng/L or <0.1x the concentration of project samples
Reanalyze affected samples. Qualify data as needed.
Analyst/Section Contamination
Average MB ≤0.45 ng/L and standard deviation <0.15 ng/L or <0.1x the concentration of project samples
Equipment Rinsate Blank
1 per week per sampling team
No Target Compounds>QL
Reanalyze affected samples. Qualify data as needed.
Analyst/Section Contamination No Target Compounds>QL
CRM 1/Batch (10 samples)
Within 35% of certified value
Reanalyze affected samples. Qualify data as needed.
Analyst/Section Accuracy/Bias Within 35% of certified value
Laboratory Duplicates
1/Batch (10 samples)
RPD 35% (or ±QL if result is ≤5x the QL)
Reanalyze affected samples. Qualify data as needed.
Analyst/Section Supervisor Precision RPD 35% (or ± QL if
result is ≤5x the QL)
MS/MSD 1/Batch (10 samples)
65-135% R ≤35% RPD
Flag Data. Discuss in narrative. Analyst/Section Accuracy/Bias-
Precision 60-135% R 35 RPD

Section: Worksheet #28 Revision: 1
Date: July 2008
Quality Assurance Project Plan Phase I RI Low Resolution Coring/Sediment Sampling Lower Passaic River Restoration Project Newark, New Jersey Page 32 of 48
QAPP Worksheet #28 (UFP-QAPP Manual Section 3.4) QC Samples Table
J:\Water\ProjectFiles\P120\12182_Passaic\QAPP\Rev 1_July 2008\2008_Low Res Core QAPP_2008 July 18_Rev1_worksheets20-37_DQOs.doc
QC Sample Frequency/
Number
Method/SOP QC Acceptance
Limits Corrective Action
Person(s) Responsible for
Corrective Action Data Quality
Indicator (DQI) Measurement
Performance Criteria
Field Duplicate 1/20 field samples RPD ≤ 50% if both samples are > 5x QL
Evaluate during data validation. Qualify data.
ENSR Data Validators Precision RPD ≤ 50% if both
samples are >5x QL
Performance Evaluation Sample 1 Supplier Certified
Limits Provide feedback to lab/lab reviews data
ENSR Chemists/ Laboratory Staff Accuracy/Bias Supplier Certified Limits

Section: Worksheet #28 Revision: 1
Date: July 2008
Quality Assurance Project Plan Phase I RI Low Resolution Coring/Sediment Sampling Lower Passaic River Restoration Project Newark, New Jersey Page 33 of 48
QAPP Worksheet #28 (UFP-QAPP Manual Section 3.4) QC Samples Table
J:\Water\ProjectFiles\P120\12182_Passaic\QAPP\Rev 1_July 2008\2008_Low Res Core QAPP_2008 July 18_Rev1_worksheets20-37_DQOs.doc
Matrix Sediment Analytical Group Hexavalent Chromium (Ion Chromatography) Concentration Level Low Sampling SOP LPR-S-01 Analytical Method/ SOP Reference L-34 Sampler’s Name ENSR Field Staff Field Sampling Organization ENSR Analytical Organization Columbia Analytical Services (Rochester) Number of Sample Locations 13
QC Sample Frequency/
Number
Method/SOP QC Acceptance
Limits Corrective Action
Person(s) Responsible for
Corrective ActionData Quality
Indicator (DQI) Measurement
Performance Criteria
Method Blank andEquipment Rinsate Blank
Method Blank - 1/Batch (20 samples); Equipment Rinsate Blank: 1 per week per sampling team
No Target Compounds>QL
Reanalyze affected samples. Qualify data as needed.
Analyst/Section Accuracy/Bias Contamination
No Target Compounds>QL
LCS 1/Batch (20 samples) 80-120%
Reanalyze affected samples. Qualify data as needed.
Analyst/Section Accuracy/Bias 80 – 120%
Laboratory Duplicates
1/Batch (20 samples) RPD 20%
Reanalyze affected samples. Qualify data as needed.
Analyst/Section Supervisor Precision RPD 20%
MS/MSD 1/Batch (20 samples)
75 -125% RPD 20%
Flag Data. Discuss in narrative. Analyst/Section Accuracy/Bias
75 – 125% RPD 20%
Field Duplicate 1/20 field samples RPD ≤ 50% if both samples are > 5x QL
Evaluate during data validation. Qualify data.
ENSR Data Validators Precision RPD ≤ 50% if both
samples are >5x QL Performance Evaluation Sample 1 Supplier Certified
Limits Provide feedback to lab/lab reviews data
ENSR Chemists/ Laboratory Staff Accuracy/Bias Supplier Certified
Limits

Section: Worksheet #28 Revision: 1
Date: July 2008
Quality Assurance Project Plan Phase I RI Low Resolution Coring/Sediment Sampling Lower Passaic River Restoration Project Newark, New Jersey Page 34 of 48
QAPP Worksheet #28 (UFP-QAPP Manual Section 3.4) QC Samples Table
J:\Water\ProjectFiles\P120\12182_Passaic\QAPP\Rev 1_July 2008\2008_Low Res Core QAPP_2008 July 18_Rev1_worksheets20-37_DQOs.doc
Matrix Sediment Analytical Group Butyltins Concentration Level Low Sampling SOP LPR-S-01, LPR-S-02, LPR-S-03, LPR-S-04 Analytical Method/ SOP Reference L-20, L-21 Sampler’s Name ENSR Field Staff Field Sampling Organization ENSR Analytical Organization Columbia Analytical Services (Kelso) Number of Sample Locations 115
QC Sample Frequency/
Number
Method/SOP QC Acceptance
Limits Corrective Action
Person(s) Responsible for
Corrective Action Data Quality
Indicator (DQI) Measurement
Performance Criteria
Method Blank and Equipment Rinsate Blank
Method Blank - 1/Batch (20 samples); Equipment Rinsate Blank: 1 per week per sampling team
No Target Compounds>QL
Reanalyze affected samples. Qualify data as needed.
Analyst/Section Supervisor
Accuracy/Bias Contamination
No Target Compounds>QL
LCS 1/Batch (20 samples)
See Laboratory % RCLs (Appendix C-2)
Reanalyze affected samples. Qualify data as needed.
Analyst/Section Supervisor Accuracy/Bias
See Laboratory % RCLs (Appendix C-2)
MS/MSD 1/Batch (20 samples)
See Laboratory % RCLS/RPD Control Limits (Appendix C-2)
Flag Data. Discuss in narrative.
Analyst/Section Supervisor
Accuracy/Bias- Precision
See Laboratory % RCLs/RPD Control Limits (Appendix C-2)
Field Duplicate 1/20 field samples RPD ≤ 50% if both samples are > 5x QL
Evaluate during data validation. Qualify data.
ENSR Data Validators Precision RPD ≤ 50% if both
samples are >5x QL Performance Evaluation Sample 1 Supplier Certified
Limits Provide feedback to lab/lab reviews data
ENSR Chemists/ Laboratory Staff Accuracy/Bias Supplier Certified Limits

Section: Worksheet #28 Revision: 1
Date: July 2008
Quality Assurance Project Plan Phase I RI Low Resolution Coring/Sediment Sampling Lower Passaic River Restoration Project Newark, New Jersey Page 35 of 48
QAPP Worksheet #28 (UFP-QAPP Manual Section 3.4) QC Samples Table
J:\Water\ProjectFiles\P120\12182_Passaic\QAPP\Rev 1_July 2008\2008_Low Res Core QAPP_2008 July 18_Rev1_worksheets20-37_DQOs.doc
Matrix Sediment Analytical Group General Chemistry - Sulfides Concentration Level Low -High Sampling SOP LPR-S-01 Analytical Method/ SOP Reference L-30 Sampler’s Name ENSR Field Staff Field Sampling Organization ENSR Analytical Organization Columbia Analytical Services (Kelso) Number of Sample Locations 115
QC Sample Frequency/
Number
Method/SOP QC Acceptance
Limits Corrective Action
Person(s) Responsible for
Corrective Action Data Quality
Indicator (DQI) Measurement
Performance Criteria
Method Blank and Equipment Rinsate Blank
Method Blank - 1/Batch (20 samples); Equipment Rinsate Blank: 1 per week per sampling team
No Target Compounds>QL
Reanalyze affected samples. Qualify data as needed.
Analyst/Section Supervisor
Accuracy/Bias Contamination
No Target Compounds>QL
LCS 1/Batch (20 samples)
51-125% (see Appendix C-2)
Reanalyze affected samples. Qualify data as needed.
Analyst/Section Supervisor Accuracy/Bias 51-125% (see
Appendix C-2)
Laboratory Duplicates
1/Batch (20 samples)
RPD ≤ 43% (see Appendix C-2)
Reanalyze affected samples. Qualify data as needed.
Analyst/Section Supervisor Precision RPD ≤ 43% (see
Appendix C-2)
MS 1/Batch (20 samples)
46-144% (see Appendix C-2)
Flag Data. Discuss in narrative.
Analyst/Section Supervisor Accuracy/Bias 46-144% (see
Appendix C-2)
Field Duplicate 1/20 field samples RPD ≤ 50% if both samples are > 5x QL
Evaluate during data validation. Qualify data.
ENSR Data Validators Precision RPD ≤ 50% if both
samples are >5x QL Performance Evaluation Sample 1 Supplier Certified
Limits Provide feedback to lab/lab reviews data
ENSR Chemists/ Laboratory Staff Accuracy/Bias Supplier Certified
Limits

Section: Worksheet #28 Revision: 1
Date: July 2008
Quality Assurance Project Plan Phase I RI Low Resolution Coring/Sediment Sampling Lower Passaic River Restoration Project Newark, New Jersey Page 36 of 48
QAPP Worksheet #28 (UFP-QAPP Manual Section 3.4) QC Samples Table
J:\Water\ProjectFiles\P120\12182_Passaic\QAPP\Rev 1_July 2008\2008_Low Res Core QAPP_2008 July 18_Rev1_worksheets20-37_DQOs.doc
Matrix Sediment Analytical Group General Chemistry – AVS/SEM Concentration Level Low Sampling SOP LPR-S-01 Analytical Method/ SOP Reference L-22 Sampler’s Name ENSR Field Staff Field Sampling Organization ENSR Analytical Organization Columbia Analytical Services (Kelso) Number of Sample Locations 13
QC Sample Frequency/
Number
Method/SOP QC Acceptance
Limits Corrective Action
Person(s) Responsible for
Corrective Action Data Quality
Indicator (DQI) Measurement
Performance Criteria
Method Blank Method Blank - 1/Batch (20 samples);
No Target Compounds>QL
Reanalyze affected samples. Qualify data as needed.
Analyst/Section Supervisor
Accuracy/Bias Contamination
No Target Compounds>QL
LCS 1/Batch (20 samples)
62-109%% for sulfide; See Laboratory % RCLs for metals (Appendix C-2)
Reanalyze affected samples. Qualify data as needed.
Analyst/Section Supervisor Accuracy/Bias
62-109% for sulfide; See Laboratory % RCLs for metals (Appendix C-2)
Laboratory Duplicates
1/Batch (20 samples)
RPD≤ 45% for sulfide; RPD ≤ 30% for metals
Reanalyze affected samples. Qualify data as needed.
Analyst/Section Supervisor Precision
RPD 45% for sulfide; RPD 30% for metals
MS 1/Batch (20 samples)
66-117% for sulfide; See Laboratory % RCLs for metals (Appendix C-2)
Flag Data. Discuss in narrative.
Analyst/Section Supervisor Accuracy/Bias
66-117% for sulfide; See Laboratory % RCLs for metals (Appendix C-2)
Field Duplicate 1/20 field samples RPD ≤ 50% if both samples are > 5x QL
Evaluate during data validation. Qualify data.
ENSR Data Validators Precision RPD ≤ 50% if both
samples are >5x QL Performance Evaluation Sample 1 Supplier Certified
Limits Provide feedback to lab/lab reviews data
ENSR Chemists/ Laboratory Staff Accuracy/Bias Supplier Certified
Limits

Section: Worksheet #28 Revision: 1
Date: July 2008
Quality Assurance Project Plan Phase I RI Low Resolution Coring/Sediment Sampling Lower Passaic River Restoration Project Newark, New Jersey Page 37 of 48
QAPP Worksheet #28 (UFP-QAPP Manual Section 3.4) QC Samples Table
J:\Water\ProjectFiles\P120\12182_Passaic\QAPP\Rev 1_July 2008\2008_Low Res Core QAPP_2008 July 18_Rev1_worksheets20-37_DQOs.doc
Matrix Sediment Analytical Group General Chemistry – Ammonia -N Concentration Level Low Sampling SOP LPR-S-01 Analytical Method/ SOP Reference L-23 Sampler’s Name ENSR Field Staff Field Sampling Organization ENSR Analytical Organization Columbia Analytical Services (Kelso) Number of Sample Locations 13
QC Sample Frequency/
Number
Method/SOP QC Acceptance
Limits Corrective Action
Person(s) Responsible for
Corrective Action Data Quality
Indicator (DQI) Measurement
Performance Criteria
Method Blank and Equipment Rinsate Blank
Method Blank - 1/Batch (20 samples); Equipment Rinsate Blank: 1 per week per sampling team
No Target Compounds>QL
Reanalyze affected samples. Qualify data as needed.
Analyst/Section Supervisor
Accuracy/Bias Contamination
No Target Compounds>QL
LCS 1/Batch (20 samples)
58-131% (see Appendix C-2)
Reanalyze affected samples. Qualify data as needed.
Analyst/Section Supervisor Accuracy/Bias 58-131% (see
Appendix C-2)
Laboratory Duplicates
1/Batch (20 samples)
RPD 32% (see Appendix C-2)
Reanalyze affected samples. Qualify data as needed.
Analyst/Section Supervisor Precision RPD 32% (see
Appendix C-2)
MS 1/Batch (20 samples)
66-127% (see Appendix C-2)
Flag Data. Discuss in narrative.
Analyst/Section Supervisor Accuracy/Bias 66-127% (see
Appendix C-2)
Field Duplicate 1/20 field samples RPD ≤ 50% if both samples are > 5x QL
Evaluate during data validation. Qualify data.
ENSR Data Validators Precision RPD ≤ 50% if both
samples are >5x QL Performance Evaluation Sample 1 Supplier Certified
Limits Provide feedback to lab/lab reviews data
ENSR Chemists/ Laboratory Staff Accuracy/Bias Supplier Certified
Limits

Section: Worksheet #28 Revision: 1
Date: July 2008
Quality Assurance Project Plan Phase I RI Low Resolution Coring/Sediment Sampling Lower Passaic River Restoration Project Newark, New Jersey Page 38 of 48
QAPP Worksheet #28 (UFP-QAPP Manual Section 3.4) QC Samples Table
J:\Water\ProjectFiles\P120\12182_Passaic\QAPP\Rev 1_July 2008\2008_Low Res Core QAPP_2008 July 18_Rev1_worksheets20-37_DQOs.doc
Matrix Sediment Analytical Group General Chemistry - Cyanide Concentration Level Low Sampling SOP LPR-S-01, LPR-S-02, LPR-S-03, LPR-S-04 Analytical Method/ SOP Reference L-25 Sampler’s Name ENSR Field Staff Field Sampling Organization ENSR Analytical Organization Columbia Analytical Services (Kelso) Number of Sample Locations 115
QC Sample Frequency/
Number
Method/SOP QC Acceptance
Limits Corrective Action
Person(s) Responsible for
Corrective Action Data Quality
Indicator (DQI) Measurement
Performance Criteria
Method Blank and Equipment Rinsate Blank
Method Blank - 1/Batch (20 samples); Equipment Rinsate Blank: 1 per week per sampling team
No Target Compounds>QL
Reanalyze affected samples. Qualify data as needed.
Analyst/Section Supervisor
Accuracy/Bias Contamination
No Target Compounds>QL
LCS 1/Batch (20 samples)
85-115% (see Appendix C-2)
Reanalyze affected samples. Qualify data as needed.
Analyst/Section Supervisor Accuracy/Bias 85-115% (see
Appendix C-2)
Laboratory Duplicates
1/Batch (20 samples)
RPD 20% (see Appendix C-2)
Reanalyze affected samples. Qualify data as needed.
Analyst/Section Supervisor Precision RPD 20% (see
Appendix C-2)
MS 1/Batch (20 samples)
75-125% (see Appendix C-2)
Flag Data. Discuss in narrative.
Analyst/Section Supervisor Accuracy/Bias 75-125% (see
Appendix C-2)

Section: Worksheet #28 Revision: 1
Date: July 2008
Quality Assurance Project Plan Phase I RI Low Resolution Coring/Sediment Sampling Lower Passaic River Restoration Project Newark, New Jersey Page 39 of 48
QAPP Worksheet #28 (UFP-QAPP Manual Section 3.4) QC Samples Table
J:\Water\ProjectFiles\P120\12182_Passaic\QAPP\Rev 1_July 2008\2008_Low Res Core QAPP_2008 July 18_Rev1_worksheets20-37_DQOs.doc
QC Sample Frequency/
Number
Method/SOP QC Acceptance
Limits Corrective Action
Person(s) Responsible for
Corrective Action Data Quality
Indicator (DQI) Measurement
Performance Criteria
Field Duplicate 1/20 field samples RPD ≤ 50% if both samples are > 5x QL
Evaluate during data validation. Qualify data.
ENSR Data Validators Precision RPD ≤ 50% if both
samples are >5x QL Performance Evaluation Sample 1 Supplier Certified
Limits Provide feedback to lab/lab reviews data
ENSR Chemists/ Laboratory Staff Accuracy/Bias Supplier Certified
Limits

Section: Worksheet #28 Revision: 1
Date: July 2008
Quality Assurance Project Plan Phase I RI Low Resolution Coring/Sediment Sampling Lower Passaic River Restoration Project Newark, New Jersey Page 40 of 48
QAPP Worksheet #28 (UFP-QAPP Manual Section 3.4) QC Samples Table
J:\Water\ProjectFiles\P120\12182_Passaic\QAPP\Rev 1_July 2008\2008_Low Res Core QAPP_2008 July 18_Rev1_worksheets20-37_DQOs.doc
Matrix Sediment Analytical Group General Chemistry - TKN Concentration Level Low Sampling SOP LPR-S-01, LPR-S-02, LPR-S-03, LPR-S-04 Analytical Method/ SOP Reference L-27 Sampler’s Name ENSR Field Staff Field Sampling Organization ENSR Analytical Organization Columbia Analytical Services (Kelso) Number of Sample Locations 13
QC Sample Frequency/
Number
Method/SOP QC Acceptance
Limits Corrective Action
Person(s) Responsible for
Corrective Action Data Quality
Indicator (DQI) Measurement
Performance Criteria
Method Blank and Equipment Rinsate Blank
Method Blank - 1/Batch (20 samples); Equipment Rinsate Blank: 1 per week per sampling team
No Target Compounds>QL
Reanalyze affected samples. Qualify data as needed.
Analyst/Section Supervisor
Accuracy/Bias Contamination
No Target Compounds>QL
LCS 1/Batch (20 samples)
70-108% (see Appendix C-2)
Reanalyze affected samples. Qualify data as needed.
Analyst/Section Supervisor Accuracy/Bias 70-108% (see
Appendix C-2)
Laboratory Duplicates
1/Batch (20 samples)
RPD 20% (see Appendix C-2)
Reanalyze affected samples. Qualify data as needed.
Analyst/Section Supervisor Precision RPD 20% (see
Appendix C-2)
MS 1/Batch (20 samples)
38-138% (see Appendix C-2)
Flag Data. Discuss in narrative.
Analyst/Section Supervisor Accuracy/Bias 38-138% (see
Appendix C-2)
Field Duplicate 1/20 field samples RPD ≤ 50% if both samples are > 5x QL
Evaluate during data validation. Qualify data.
ENSR Data Validators Precision RPD ≤ 50% if both
samples are >5x QL
Performance Sample 1 Supplier Certified Limits
Provide feedback to lab/lab reviews data
ENSR Chemists/ Laboratory Staff Accuracy/Bias Supplier Certified
Limits

Section: Worksheet #28 Revision: 1
Date: July 2008
Quality Assurance Project Plan Phase I RI Low Resolution Coring/Sediment Sampling Lower Passaic River Restoration Project Newark, New Jersey Page 41 of 48
QAPP Worksheet #28 (UFP-QAPP Manual Section 3.4) QC Samples Table
J:\Water\ProjectFiles\P120\12182_Passaic\QAPP\Rev 1_July 2008\2008_Low Res Core QAPP_2008 July 18_Rev1_worksheets20-37_DQOs.doc
Matrix Sediment Analytical Group General Chemistry - Phosphorus Concentration Level Low Sampling SOP LPR-S-01, LPR-S-02, LPR-S-03, LPR-S-04 Analytical Method/ SOP Reference L-26 Sampler’s Name ENSR Field Staff Field Sampling Organization ENSR Analytical Organization Columbia Analytical Services (Kelso) Number of Sample Locations 13
QC Sample Frequency/
Number
Method/SOP QC Acceptance
Limits Corrective Action
Person(s) Responsible for
Corrective Action Data Quality
Indicator (DQI) Measurement
Performance Criteria
Method Blank and Equipment Rinsate Blank
Method Blank - 1/Batch (20 samples); Equipment Rinsate Blank: 1 per week per sampling team
No Target Compounds>QL
Reanalyze affected samples. Qualify data as needed.
Analyst/Section Supervisor
Accuracy/Bias Contamination
No Target Compounds>QL
LCS 1/Batch (20 samples)
85-115% (see Appendix C-2)
Reanalyze affected samples. Qualify data as needed.
Analyst/Section Supervisor Accuracy/Bias 85-115% (see
Appendix C-2)
Laboratory Duplicates
1/Batch (20 samples)
RPD 20% (see Appendix C-2)
Reanalyze affected samples. Qualify data as needed.
Analyst/Section Supervisor Precision RPD 20% (see
Appendix C-2)
MS 1/Batch (20 samples)
75-125% (see Appendix C-2)
Flag Data. Discuss in narrative.
Analyst/Section Supervisor Accuracy/Bias 75-125% (see
Appendix C-2)

Section: Worksheet #28 Revision: 1
Date: July 2008
Quality Assurance Project Plan Phase I RI Low Resolution Coring/Sediment Sampling Lower Passaic River Restoration Project Newark, New Jersey Page 42 of 48
QAPP Worksheet #28 (UFP-QAPP Manual Section 3.4) QC Samples Table
J:\Water\ProjectFiles\P120\12182_Passaic\QAPP\Rev 1_July 2008\2008_Low Res Core QAPP_2008 July 18_Rev1_worksheets20-37_DQOs.doc
QC Sample Frequency/
Number
Method/SOP QC Acceptance
Limits Corrective Action
Person(s) Responsible for
Corrective Action Data Quality
Indicator (DQI) Measurement
Performance Criteria
Field Duplicate 1/20 field samples RPD ≤ 50% if both samples are > 5x QL
Evaluate during data validation. Qualify data.
ENSR Data Validators Precision RPD ≤ 50% if both
samples are >5x QL Performance Evaluation Sample 1 Supplier Certified
Limits Provide feedback to lab/lab reviews data
ENSR Chemists/ Laboratory Staff Accuracy/Bias Supplier Certified
Limits

Section: Worksheet #28 Revision: 1
Date: July 2008
Quality Assurance Project Plan Phase I RI Low Resolution Coring/Sediment Sampling Lower Passaic River Restoration Project Newark, New Jersey Page 43 of 48
QAPP Worksheet #28 (UFP-QAPP Manual Section 3.4) QC Samples Table
J:\Water\ProjectFiles\P120\12182_Passaic\QAPP\Rev 1_July 2008\2008_Low Res Core QAPP_2008 July 18_Rev1_worksheets20-37_DQOs.doc
Matrix Sediment Analytical Group General Chemistry – TOC Concentration Level Low Sampling SOP LPR-S-01, LPR-S-02, LPR-S-03, LPR-S-04 Analytical Method/ SOP Reference L-28 Sampler’s Name ENSR Field Staff Field Sampling Organization ENSR Analytical Organization Columbia Analytical Services (Kelso) Number of Sample Locations 115
QC Sample Frequency/
Number
Method/SOP QC Acceptance
Limits Corrective Action
Person(s) Responsible for
Corrective Action Data Quality
Indicator (DQI) Measurement
Performance Criteria
Method Blank and Equipment Rinsate Blank
Method Blank - 1/Batch (20 samples); Equipment Rinsate Blank: 1 per week per sampling team
No Target Compounds>QL
Reanalyze affected samples. Qualify data as needed.
Analyst/Section Supervisor
Accuracy/Bias Contamination
No Target Compounds>QL
LCS 1/Batch (20 samples)
74-123% (see Appendix C-2)
Reanalyze affected samples. Qualify data as needed.
Analyst/Section Supervisor Accuracy/Bias 74-123% (see
Appendix C-2)
Laboratory Duplicates
1/Batch (20 samples)
RPD 27% (see Appendix C-2)
Reanalyze affected samples. Qualify data as needed.
Analyst/Section Supervisor Precision RPD 27% (see
Appendix C-2)
MS 1/Batch (20 samples)
75-114% (see Appendix C-2)
Flag Data. Discuss in narrative.
Analyst/Section Supervisor Accuracy/Bias 75-114% (see
Appendix C-2)
Field Duplicate 1/20 field samples RPD ≤ 50% if both samples are > 5x QL
Evaluate during data validation. Qualify data.
ENSR Data Validators Precision RPD ≤ 50% if both
samples are >5x QL Performance Evaluation Sample 1 Supplier Certified
Limits Provide feedback to lab/lab reviews data
ENSR Chemists/ Laboratory Staff Accuracy/Bias Supplier Certified
Limits

Section: Worksheet #28 Revision: 1
Date: July 2008
Quality Assurance Project Plan Phase I RI Low Resolution Coring/Sediment Sampling Lower Passaic River Restoration Project Newark, New Jersey Page 44 of 48
QAPP Worksheet #28 (UFP-QAPP Manual Section 3.4) QC Samples Table
J:\Water\ProjectFiles\P120\12182_Passaic\QAPP\Rev 1_July 2008\2008_Low Res Core QAPP_2008 July 18_Rev1_worksheets20-37_DQOs.doc
Matrix Sediment Analytical Group Physical Testing – Grain Size Analysis Concentration Level Low Sampling SOP LPR-S-01, LPR-S-02, LPR-S-03, LPR-S-04 Analytical Method/ SOP Reference L-31 Sampler’s Name ENSR Field Staff Field Sampling Organization ENSR Analytical Organization Columbia Analytical Services (Kelso) Number of Sample Locations 115
QC Sample Frequency/
Number
Method/SOP QC Acceptance
Limits Corrective Action
Person(s) Responsible for
Corrective Action Data Quality
Indicator (DQI) Measurement
Performance Criteria Method Blank N/A N/A N/A N/A N/A N/A LCS N/A N/A N/A N/A N/A N/A
Laboratory Duplicates
1 Per batch of 20 samples RPD ≤ 20%
Reanalyze affected samples. Qualify data as needed.
Analyst/Section Supervisor Precision RPD ≤20%
Field Duplicate 1/20 field samples RPD ≤ 50% Evaluate during data validation. Qualify data.
ENSR Data Validators Precision RPD ≤ 50%
Performance Evaluation Sample 1 Supplier Certified
Limits Provide feedback to lab/lab reviews data
ENSR Chemists/ Laboratory Staff Accuracy/Bias Supplier Certified
Limits
N/A – Not applicable to this analysis.

Section: Worksheet #28 Revision: 1
Date: July 2008
Quality Assurance Project Plan Phase I RI Low Resolution Coring/Sediment Sampling Lower Passaic River Restoration Project Newark, New Jersey Page 45 of 48
QAPP Worksheet #28 (UFP-QAPP Manual Section 3.4) QC Samples Table
J:\Water\ProjectFiles\P120\12182_Passaic\QAPP\Rev 1_July 2008\2008_Low Res Core QAPP_2008 July 18_Rev1_worksheets20-37_DQOs.doc
Matrix Sediment Analytical Group Physical Testing – Atterberg Limits Concentration Level Low Sampling SOP LPR-S-01, LPR-S-02, LPR-S-03, LPR-S-04 Analytical Method/ SOP Reference L-32 Sampler’s Name ENSR Field Staff Field Sampling Organization ENSR Analytical Organization Columbia Analytical Services (Kelso) Number of Sample Locations 115
QC Sample Frequency/
Number
Method/SOP QC Acceptance
Limits Corrective Action
Person(s) Responsible for
Corrective Action Data Quality
Indicator (DQI) Measurement
Performance Criteria Method Blank N/A N/A N/A N/A N/A N/A LCS N/A N/A N/A N/A N/A N/A
Laboratory Duplicates
1 Per batch of 20 samples 1% Absolute
Reanalyze affected samples. Qualify data as needed.
Analyst/Section Supervisor Precision 1% Absolute
Field Duplicate 1/20 field samples RPD ≤ 50% Evaluate during data validation. Qualify data.
ENSR Data Validators Precision RPD ≤ 50%
Performance Evaluation Sample N/A N/A N/A N/A N/A N/A
N/A – Not applicable to this analysis.

Section: Worksheet #28 Revision: 1
Date: July 2008
Quality Assurance Project Plan Phase I RI Low Resolution Coring/Sediment Sampling Lower Passaic River Restoration Project Newark, New Jersey Page 46 of 48
QAPP Worksheet #28 (UFP-QAPP Manual Section 3.4) QC Samples Table
J:\Water\ProjectFiles\P120\12182_Passaic\QAPP\Rev 1_July 2008\2008_Low Res Core QAPP_2008 July 18_Rev1_worksheets20-37_DQOs.doc
Matrix Sediment Analytical Group Physical Testing – Specific Gravity Concentration Level Low Sampling SOP LPR-S-01, LPR-S-02, LPR-S-03, LPR-S-04 Analytical Method/ SOP Reference L-33 Sampler’s Name ENSR Field Staff Field Sampling Organization ENSR Analytical Organization Columbia Analytical Services (Kelso) Number of Sample Locations 115
QC Sample Frequency/
Number
Method/SOP QC Acceptance
Limits Corrective Action
Person(s) Responsible for
Corrective Action Data Quality
Indicator (DQI) Measurement
Performance Criteria Method Blank N/A N/A N/A N/A N/A N/A LCS N/A N/A N/A N/A N/A N/A
Laboratory Duplicates
1 Per batch of 20 samples RPD ≤ 20%
Reanalyze affected samples. Qualify data as needed.
Analyst/Section Supervisor Precision RPD ≤ 20%
Field Duplicate 1/20 field samples RPD ≤ 50% Evaluate during data validation. Qualify data.
ENSR Data Validators Precision RPD ≤ 50%
Performance Evaluation Sample N/A N/A N/A N/A N/A N/A
N/A – Not applicable to this analysis.

Section: Worksheet #28 Revision: 1
Date: July 2008
Quality Assurance Project Plan Phase I RI Low Resolution Coring/Sediment Sampling Lower Passaic River Restoration Project Newark, New Jersey Page 47 of 48
QAPP Worksheet #28 (UFP-QAPP Manual Section 3.4) QC Samples Table
J:\Water\ProjectFiles\P120\12182_Passaic\QAPP\Rev 1_July 2008\2008_Low Res Core QAPP_2008 July 18_Rev1_worksheets20-37_DQOs.doc
Matrix Sediment Analytical Group Biological –E Coli Concentration Level Low -High Sampling SOP LPR-S-01 Analytical Method/ SOP Reference L-38, L-38a Sampler’s Name ENSR Field Staff Field Sampling Organization ENSR Analytical Organization Analytical Services, Inc. Number of Sample Locations 13
QC Sample Frequency/
Number
Method/SOP QC Acceptance
Limits Corrective Action
Person(s) Responsible for
Corrective Action Data Quality
Indicator (DQI) Measurement
Performance Criteria
Method Blank 1 per batch of 20 samples
No color, no fluorescence
Reanalyze associated samples, dependent upon extent of holding time exceedance
Analyst or Section Supervisor
Accuracy Contamination
No color, no fluorescence
LCS 1 per batch of 20 samples
Yellow color with fluorescence
Reanalyze associated sample, dependent upon extent of holding time exceedance
Analyst or Section Supervisor Accuracy/Bias Within established
control limits
Performance Evaluation Sample 1 Supplier Certified
Limits Provide feedback to lab/lab reviews data
ENSR Chemists/ Laboratory Staff Accuracy/Bias Supplier Certified
Limits

Section: Worksheet #28 Revision: 1
Date: July 2008
Quality Assurance Project Plan Phase I RI Low Resolution Coring/Sediment Sampling Lower Passaic River Restoration Project Newark, New Jersey Page 48 of 48
QAPP Worksheet #28 (UFP-QAPP Manual Section 3.4) QC Samples Table
J:\Water\ProjectFiles\P120\12182_Passaic\QAPP\Rev 1_July 2008\2008_Low Res Core QAPP_2008 July 18_Rev1_worksheets20-37_DQOs.doc
Matrix Sediment Analytical Group Biological –Giardia Concentration Level Low -High Sampling SOP LPR-S-01 Analytical Method/ SOP Reference L-39, L-39a Sampler’s Name ENSR Field Staff Field Sampling Organization ENSR Analytical Organization Analytical Services, Inc. Number of Sample Locations 13
QC Sample Frequency/
Number
Method/SOP QC Acceptance
Limits Corrective Action
Person(s) Responsible for
Corrective Action Data Quality
Indicator (DQI) Measurement
Performance Criteria
Method Blank 1 per batch of 20 samples Negative
Reanalyze associated samples, dependent upon extent of holding time exceedance
Analyst or Section Supervisor
Accuracy Contamination
Negative results
LCS 1 per batch of 20 samples 14 -100%
Reanalyze associated samples, dependent upon extent of holding time exceedance
Analyst or Section Supervisor Accuracy/Bias Within control limits
Laboratory Duplicate 1 per batch of 20 samples ±30%
Reanalyze associated samples, dependent upon extent of holding time exceedance
Analyst or Section Supervisor
Precision Within control limits
Field Duplicate 1/20 field samples RPD ≤ 50% Evaluate during data validation. Qualify data.
ENSR Data Validators Precision RPD ≤ 50%
Performance Evaluation Sample N/A N/A N/A N/A N/A N/A
N

Section: Worksheet #29 Revision: 1
Date: July 2008
Quality Assurance Project Plan Phase I RI Low Resolution Coring/Sediment Sampling Lower Passaic River Restoration Project Newark, New Jersey Page 1 of 3
J:\Water\ProjectFiles\P120\12182_Passaic\QAPP\Rev 1_July 2008\2008_Low Res Core QAPP_2008 July 18_Rev1_worksheets20-37_DQOs.doc
QAPP Worksheet #29 (UFP-QAPP Manual Section 3.5.1) Project Documents and Records Table
Sample Collection Documents and Records
On-site Analysis Documents and Records
Off-site Analysis Documents and Records
Data Assessment Documents and Records Other
Field notes, field data sheets, field logbooks
Field notes, field data sheets, field logbooks
Custody records and copies of airbills Reports of field sampling audits Progress reports
Custody records and airbills Field instrument calibration records
Analytical data packages and EDDs Reports of laboratory audits
Final report - Prepared and submitted to clients and USEPA.
Communication logs, records or copies of pertinent e-mails Field measurement data Communication logs Validation reports
QAPP/FSP Addendum and HASP
QAPP/FSP Addendum and HASP
Laboratory notebooks and bench sheets documenting sample preparation and analysis
QA reports to management
Correction action reports and results
Correction action reports and results
Instrument maintenance and calibration records, standard preparation and traceability records
Correction action reports and results
Documentation of field modifications
Documentation of field modifications
Laboratory SOPs and documentation of method modifications
Internal laboratory assessments, including internal audits, third-party audit reports, and PE results
Daily Acitivity Log Dail Activity Log Corrective action logs and documentation of corrective action results
Results of pre-analysis PE samples

Section: Worksheet #29 Revision: 1
Date: July 2008
Quality Assurance Project Plan Phase I RI Low Resolution Coring/Sediment Sampling Lower Passaic River Restoration Project Newark, New Jersey Page 2 of 3
QAPP Worksheet #29 (UFP-QAPP Manual Section 3.5.1) Project Documents and Records Table
J:\Water\ProjectFiles\P120\12182_Passaic\QAPP\Rev 1_July 2008\2008_Low Res Core QAPP_2008 July 18_Rev1_worksheets20-37_DQOs.doc
This section describes the project data management process tracing the data from their generation through final use and/or storage. All project data, communications, and other information must be documented in a format useable to project personnel.
Project Document Control System
Project documents are controlled by ENSR’s Project Document Control Manager who will maintain and manage hardcopies and electronic copies of all project related documents according to the Lower Passaic River Quality Management Plan (ENSR, 2007). Electronic copies of all information relating to this project are maintained on the project network files which are backed up at least once per day; access to these files is limited to authorized project personnel. All project data and information must be documented in a standard format which is usable by all project personnel.
Data Recording
Data generated during this project will be captured electronically or entered by hand into bound field or laboratory logbooks or preprinted forms (refer to SOP LPR-G-01 in Appendix B). Computer generated laboratory data will be managed using the laboratory information management system (LIMS); the LIMS used by subcontracted laboratories are described in their QA documentation.
Data Quality Assurance Procedures
ENSR will monitor the progress of sample collection to verify that samples are collected as planned. The progress of sample collection and processing will be monitored through the documentation of samples collected and shipped each day. The participating laboratories must maintain a formal QA Plan to which they adhere and which addresses all data generating aspects of daily operations. A policy of continuous improvement will allow all data generation processes to be reviewed and modified as needed to meet project objectives. Periodic audits of field and laboratory operations will ensure that data collection, documentation and QC procedures are being followed.
Laboratory Data Transmittal
Laboratory data are managed by the laboratory’s LIMS beginning with the sample receiving process. Laboratories are required to provide validated data reports (sample results, QC summary information, and supporting raw data) including EDDs within the turnaround times specified in Worksheet #30. EDDs will be provided in an Earthsoft EQuIS® four-file format (modified by ENSR), using reference file tables provided by ENSR. All EDDs will be checked prior to transmittal to ENSR using current versions of Earthsoft’s Electronic Data Processor (EDP).

Section: Worksheet #29 Revision: 1
Date: July 2008
Quality Assurance Project Plan Phase I RI Low Resolution Coring/Sediment Sampling Lower Passaic River Restoration Project Newark, New Jersey Page 3 of 3
QAPP Worksheet #29 (UFP-QAPP Manual Section 3.5.1) Project Documents and Records Table
J:\Water\ProjectFiles\P120\12182_Passaic\QAPP\Rev 1_July 2008\2008_Low Res Core QAPP_2008 July 18_Rev1_worksheets20-37_DQOs.doc
Data Storage and Retrieval
Completed forms, logbooks, photographs, data packages, and electronic files will be transmitted regularly to the Project Document Control Manager. Each laboratory will maintain copies of all documents it generates as well as backup files of all electronic data relating to the analysis of samples. Raw data and electronic files of all field samples, QC analyses and blanks must be archived from the date of generation and maintained by each laboratory in accordance with the terms of the contract between ENSR and the laboratory. Project closeout will be conducted in accordance with contractual guidance. As required by the Settlement Agreement all data and other project records will be made available to USEPA.
Data transfer to USEPA will include a Multi-media Electronic Data Deliverable (MEDD) that conforms to the 2007 EPA Region 2 MEDD format. The MEDD will include all qualified and rejected data (including the reported, numerical value for rejected data).

Section: Worksheet #30 Revision: 2
Date: July 2008
Quality Assurance Project Plan Phase I RI Low Resolution Coring/Sediment Sampling Lower Passaic River Restoration Project Newark, New Jersey Page 1 of 9
J:\Water\ProjectFiles\P120\12182_Passaic\QAPP\Rev 1_July 2008\2008_Low Res Core QAPP_2008 July 18_Rev1_worksheets20-37_DQOs.doc
QAPP Worksheet #30 (UFP-QAPP Manual Section 3.5.2.3) Analytical Services Table
Matrix Analytical
Group Concentration
Level
Sample Locations/ ID Number
Analytical SOP
Data Package Turnaround
Timea Laboratory/
Organization Backup Laboratory/
Organization)
Sediment VOCs Low All L-1 30 days
Test America 5815 Middlebrook Pike Knoxville, TN 37921 John Reynolds 865.291.3000
CAS 1317 South 13th Ave. Kelso, WA 98626 Ed Wallace 360.577.7222
Sediment SVOCs Low All L-2, L-3 30 days
Test America 5815 Middlebrook Pike Knoxville, TN 37921 John Reynolds 865.291.3000
CAS 1317 South 13th Ave. Kelso, WA 98626 Ed Wallace 360.577.7222
Sediment PAHs – HRGC/LRMS SIM Low All L-6 35-56 days
Test America 5815 Middlebrook Pike Knoxville, TN 37921 John Reynolds 865.291.3000
CAS 1317 South 13th Ave. Kelso, WA 98626 Ed Wallace 360.577.7222
Sediment Organochlorine Pesticides (GC/ECD)
Low All L-2, L-4 45 days
Test America 5815 Middlebrook Pike Knoxville, TN 37921 John Reynolds 865.291.3000
CAS 1317 South 13th Ave. Kelso, WA 98626 Ed Wallace 360.577.7222
Sediment Organochlorine Pesticides (HRGC/HRMS)
Low All L-15 45 days
Test America 880 Riverside Parkway West Sacramento, CA 95605 David Alltucker 865.291.3000
N/A

Section: Worksheet#30 Revision: 1
Date: July 2008
Quality Assurance Project Plan Phase I RI Low Resolution Coring/Sediment Sampling Lower Passaic River Restoration Project Newark, New Jersey Page 2 of 9
QAPP Worksheet #30 (UFP-QAPP Manual Section 3.5.2.3) Analytical Services Table
J:\Water\ProjectFiles\P120\12182_Passaic\QAPP\Rev 1_July 2008\2008_Low Res Core QAPP_2008 July 18_Rev1_worksheets20-37_DQOs.doc
Matrix Analytical
Group Concentration
Level
Sample Locations/ ID Number
Analytical SOP
Data Package Turnaround
Timea Laboratory/
Organization Backup Laboratory/
Organization)
Sediment PCBs (Aroclors) Low All L-12 30 days
Test America 301 Alpha Drive Pittsburgh, PA 15238 Chris Kovitch 412.963.7058
Columbia Analytical Services (CAS) 1317 South 13th Ave. Kelso, WA 98626 Ed Wallace 360.577.7222
Sediment PCBs (Homologs and Congeners) Low All L-7 45-84 days
Test America 5815 Middlebrook Pike Knoxville, TN 37921 John Reynolds 865.291.3000
CAS 19408 Park Row Suite 320 Houston, TX 77084 Jane Freemyer 713.266.1599
Sediment Herbicides Low All L-11, L-12 45 days
Test America 301 Alpha Drive Pittsburgh, PA 15238 Chris Kovitch 412.963.7058
CAS 1317 South 13th Ave. Kelso, WA 98626 Ed Wallace 360.577.7222
Sediment TPH –Purgeables Low
2008-CLRC-001 2008-CLRC-007 2008-CLRC-021 2008-CLCR-026 2008-CLCR-034 2008-CLRC-040 2008-CLRC-045 2008-CLRC-055 2008-CLRC-067 2008-CLRC-073 2008-CLRC-082 2008-CLRC-088 2008-CLRC-100
L-14 30 days
Test America 777 New Durham Road. Edison, NJ 08817 Jamie Capaci 732.549.3900
CAS 1317 South 13th Ave. Kelso, WA 98626 Ed Wallace 360.577.7222

Section: Worksheet#30 Revision: 1
Date: July 2008
Quality Assurance Project Plan Phase I RI Low Resolution Coring/Sediment Sampling Lower Passaic River Restoration Project Newark, New Jersey Page 3 of 9
QAPP Worksheet #30 (UFP-QAPP Manual Section 3.5.2.3) Analytical Services Table
J:\Water\ProjectFiles\P120\12182_Passaic\QAPP\Rev 1_July 2008\2008_Low Res Core QAPP_2008 July 18_Rev1_worksheets20-37_DQOs.doc
Matrix Analytical
Group Concentration
Level
Sample Locations/ ID Number
Analytical SOP
Data Package Turnaround
Timea Laboratory/
Organization Backup Laboratory/
Organization)
Sediment TPH – Extractables Low All L-13 30 days
Test America 777 New Durham Road. Edison, NJ 08817 Jamie Capaci 732.549.3900
Test America 30 Community Drive, Suite 11 South Burlington, VT 05403 John Reynolds 865.291.3000
Sediment Dioxins/Furans Low All L-35 45 days
CAS 19408 Park Row Suite 320 Houston, TX 77084 Jane Freemyer 713.266.1599
Test America 5815 Middlebrook Pike Knoxville, TN 37921 John Reynolds 865.291.3000
Sediment Radiochemistry (Be-7, Cs-137, Pb-210, K-40)
Low All L-9, L-10, L-45, L-46 45 days
GEL Laboratories, LLC 2040 Savage Road Charleston, SC29407 Edith Kent 843.769.7385 x 4453
Test America 2800 George Washington Way Richland, WA 99352 Ken Miller 509.375.3131
Sediment Metals Low All L-16, L-17, L-18, L-19 30 days
CAS 1317 South 13th Ave. Kelso, WA 98626 Ed Wallace 360.577.7222
Brooks Rand, LLC 3958 6th Ave. NW Seattle, WA 98107 Misty Kennard-Mayer 206-632-6206
Sediment Low Level Mercury Low - High All L-36 30 days
Brooks Rand, LLC 3958 6th Ave. NW Seattle, WA 98107 Misty Kennard-Mayer 206-632-6206
CAS 1317 South 13th Ave. Kelso, WA 98626 Ed Wallace 360.577.7222

Section: Worksheet#30 Revision: 1
Date: July 2008
Quality Assurance Project Plan Phase I RI Low Resolution Coring/Sediment Sampling Lower Passaic River Restoration Project Newark, New Jersey Page 4 of 9
QAPP Worksheet #30 (UFP-QAPP Manual Section 3.5.2.3) Analytical Services Table
J:\Water\ProjectFiles\P120\12182_Passaic\QAPP\Rev 1_July 2008\2008_Low Res Core QAPP_2008 July 18_Rev1_worksheets20-37_DQOs.doc
Matrix Analytical
Group Concentration
Level
Sample Locations/ ID Number
Analytical SOP
Data Package Turnaround
Timea Laboratory/
Organization Backup Laboratory/
Organization)
Sediment Methyl Mercury Low
2008-CLRC-001 2008-CLRC-007 2008-CLRC-021 2008-CLCR-026 2008-CLCR-034 2008-CLRC-040 2008-CLRC-045 2008-CLRC-055 2008-CLRC-067 2008-CLRC-073 2008-CLRC-082 2008-CLRC-088 2008-CLRC-100
L-37 30 days
Brooks Rand, LLC3958 6th Ave. NW Seattle, WA 98107 Misty Kennard-Mayer 206-632-6206
CAS 1317 South 13th Ave. Kelso, WA 98626 Ed Wallace 360.577.7222
Sediment Hexavalent Chromium Low
2008-CLRC-001 2008-CLRC-007 2008-CLRC-021 2008-CLCR-026 2008-CLCR-034 2008-CLRC-040 2008-CLRC-045 2008-CLRC-055 2008-CLRC-067 2008-CLRC-073 2008-CLRC-082 2008-CLRC-088 2008-CLRC-100
L-34 30 Days
CAS 1 Mustard St. Suite 250 Rochester, NY 14609 Janice Jaeger 585.288.5380
Test America 777 New Durham Road. Edison, NJ 08817 Jamie Capaci 732.549.3900

Section: Worksheet#30 Revision: 1
Date: July 2008
Quality Assurance Project Plan Phase I RI Low Resolution Coring/Sediment Sampling Lower Passaic River Restoration Project Newark, New Jersey Page 5 of 9
QAPP Worksheet #30 (UFP-QAPP Manual Section 3.5.2.3) Analytical Services Table
J:\Water\ProjectFiles\P120\12182_Passaic\QAPP\Rev 1_July 2008\2008_Low Res Core QAPP_2008 July 18_Rev1_worksheets20-37_DQOs.doc
Matrix Analytical
Group Concentration
Level
Sample Locations/ ID Number
Analytical SOP
Data Package Turnaround
Timea Laboratory/
Organization Backup Laboratory/
Organization)
Sediment Butyltins Low All L-20, L-21 30 days
CAS 1317 South 13th Ave. Kelso, WA 98626 Ed Wallace 360.577.7222
Test America 30 Community Drive, Suite 11 South Burlington, VT 05403 John Reynolds 865.291.3000
Sediment AVS/SEM Low
2008-CLRC-001 2008-CLRC-007 2008-CLRC-021 2008-CLCR-026 2008-CLCR-034 2008-CLRC-040 2008-CLRC-045 2008-CLRC-055 2008-CLRC-067 2008-CLRC-073 2008-CLRC-082 2008-CLRC-088 2008-CLRC-100
L-22 30 days
CAS 1317 South 13th Ave. Kelso, WA 98626 Ed Wallace 360.577.7222
Test America 301 Alpha Drive RIDC Park Pittsburgh, PA 15238 Chris Kovitch 412.963.7058

Section: Worksheet#30 Revision: 1
Date: July 2008
Quality Assurance Project Plan Phase I RI Low Resolution Coring/Sediment Sampling Lower Passaic River Restoration Project Newark, New Jersey Page 6 of 9
QAPP Worksheet #30 (UFP-QAPP Manual Section 3.5.2.3) Analytical Services Table
J:\Water\ProjectFiles\P120\12182_Passaic\QAPP\Rev 1_July 2008\2008_Low Res Core QAPP_2008 July 18_Rev1_worksheets20-37_DQOs.doc
Matrix Analytical
Group Concentration
Level
Sample Locations/ ID Number
Analytical SOP
Data Package Turnaround
Timea Laboratory/
Organization Backup Laboratory/
Organization)
Sediment Ammonia-N Low
2008-CLRC-001 2008-CLRC-007 2008-CLRC-021 2008-CLCR-026 2008-CLCR-034 2008-CLRC-040 2008-CLRC-045 2008-CLRC-055 2008-CLRC-067 2008-CLRC-073 2008-CLRC-082 2008-CLRC-088 2008-CLRC-100
L-23 30 days
CAS 1317 South 13th Ave. Kelso, WA 98626 Ed Wallace 360.577.7222
Test America 4101 Shuffel St. NW North Canton, OH 44720 John Reynolds 865.291.3000
Sediment Cyanide Low All L-24, L-25 30 days
CAS 1317 South 13th Ave. Kelso, WA 98626 Ed Wallace 360.577.7222
Test America 4101 Shuffel St. NW North Canton, OH 44720 John Reynolds 865.291.3000
Sediment TKN Low
2008-CLRC-001 2008-CLRC-007 2008-CLRC-021 2008-CLCR-026 2008-CLCR-034 2008-CLRC-040 2008-CLRC-045 2008-CLRC-055 2008-CLRC-067 2008-CLRC-073 2008-CLRC-082 2008-CLRC-088 2008-CLRC-100
L-27 30 days
CAS 1317 South 13th Ave. Kelso, WA 98626 Ed Wallace 360.577.7222
Test America 4101 Shuffel Dr. NW North Canton, OH 44720 John Reynolds 865.291.3000

Section: Worksheet#30 Revision: 1
Date: July 2008
Quality Assurance Project Plan Phase I RI Low Resolution Coring/Sediment Sampling Lower Passaic River Restoration Project Newark, New Jersey Page 7 of 9
QAPP Worksheet #30 (UFP-QAPP Manual Section 3.5.2.3) Analytical Services Table
J:\Water\ProjectFiles\P120\12182_Passaic\QAPP\Rev 1_July 2008\2008_Low Res Core QAPP_2008 July 18_Rev1_worksheets20-37_DQOs.doc
Matrix Analytical
Group Concentration
Level
Sample Locations/ ID Number
Analytical SOP
Data Package Turnaround
Timea Laboratory/
Organization Backup Laboratory/
Organization)
Sediment Total Phosphorus Low
2008-CLRC-001 2008-CLRC-007 2008-CLRC-021 2008-CLCR-026 2008-CLCR-034 2008-CLRC-040 2008-CLRC-045 2008-CLRC-055 2008-CLRC-067 2008-CLRC-073 2008-CLRC-082 2008-CLRC-088 2008-CLRC-100
L-26 30 days
CAS 1317 South 13th Ave. Kelso, WA 98626 Ed Wallace 360.577.7222
Test America 4101 Shuffel Dr. NW North Canton, OH 44720 John Reynolds 865.291.3000
Sediment TOC Low All L-28 30 days
CAS 1317 South 13th Ave. Kelso, WA 98626 Ed Wallace 360.577.7222
Test America 301 Alpha Drive RIDC Park Pittsburgh, PA 15238 Chris Kovitch 412.963.7058
Sediment Total Sulfide Low All L-30 30 days
CAS 1317 South 13th Ave. Kelso, WA 98626 Ed Wallace 360.577.7222
Test America 301 Alpha Drive Pittsburgh, PA 15238 Chris Kovitch 412.963.7058
Sediment Grain Size N/A All L-31 30 days
CAS 1317 South 13th Ave. Kelso, WA 98626 Ed Wallace 360.577.7222
Test America 30 Community Drive, Suite 11 South Burlington, VT 05403 John Reynolds 865.291.3000

Section: Worksheet#30 Revision: 1
Date: July 2008
Quality Assurance Project Plan Phase I RI Low Resolution Coring/Sediment Sampling Lower Passaic River Restoration Project Newark, New Jersey Page 8 of 9
QAPP Worksheet #30 (UFP-QAPP Manual Section 3.5.2.3) Analytical Services Table
J:\Water\ProjectFiles\P120\12182_Passaic\QAPP\Rev 1_July 2008\2008_Low Res Core QAPP_2008 July 18_Rev1_worksheets20-37_DQOs.doc
Matrix Analytical
Group Concentration
Level
Sample Locations/ ID Number
Analytical SOP
Data Package Turnaround
Timea Laboratory/
Organization Backup Laboratory/
Organization)
Sediment Atterberg Limits N/A All L-32 30 days
CAS 1317 South 13th Ave. Kelso, WA 98626 Ed Wallace 360.577.7222
Test America 30 Community Drive, Suite 11 South Burlington, VT 05403 John Reynolds 865.291.3000
Sediment Specific Gravity N/A All L-33 30 days
CAS 1317 South 13th Ave. Kelso, WA 98626 Ed Wallace 360.577.7222
Test America 30 Community Drive, Suite 11 South Burlington, VT 05403 John Reynolds 865.291.3000
Sediment E. Coli Low - High
2008-CLRC-001 2008-CLRC-007 2008-CLRC-021 2008-CLCR-026 2008-CLCR-034 2008-CLRC-040 2008-CLRC-045 2008-CLRC-055 2008-CLRC-067 2008-CLRC-073 2008-CLRC-082 2008-CLRC-088 2008-CLRC-100
L-38 30 days
Analytical Services, Inc. 130 Allen Brook Lane Williston, VT 05495 Paul Warden 800.723.4432
CAS 1317 South 13th Ave. Kelso, WA 98626 Ed Wallace 360.577.7222

Section: Worksheet#30 Revision: 1
Date: July 2008
Quality Assurance Project Plan Phase I RI Low Resolution Coring/Sediment Sampling Lower Passaic River Restoration Project Newark, New Jersey Page 9 of 9
QAPP Worksheet #30 (UFP-QAPP Manual Section 3.5.2.3) Analytical Services Table
J:\Water\ProjectFiles\P120\12182_Passaic\QAPP\Rev 1_July 2008\2008_Low Res Core QAPP_2008 July 18_Rev1_worksheets20-37_DQOs.doc
Matrix Analytical
Group Concentration
Level
Sample Locations/ ID Number
Analytical SOP
Data Package Turnaround
Timea Laboratory/
Organization Backup Laboratory/
Organization)
Sediment Giardia Low-High
2008-CLRC-001 2008-CLRC-007 2008-CLRC-021 2008-CLCR-026 2008-CLCR-034 2008-CLRC-040 2008-CLRC-045 2008-CLRC-055 2008-CLRC-067 2008-CLRC-073 2008-CLRC-082 2008-CLRC-088 2008-CLRC-100
L-39 30 Days
Analytical Services, Inc. 130 Allen Brook Lane Williston, VT 05495 Paul Warden 800.723.4432
N/A
a Turnaround time is in calendar days from receipt of the last sample in the data package sample delivery group.

Section: Worksheet #31 Revision: 2
Date: July 2008
Quality Assurance Project Plan Phase I RI Low Resolution Coring/Sediment Sampling Lower Passaic River Restoration Project Newark, New Jersey Page 1 of 2
J:\Water\ProjectFiles\P120\12182_Passaic\QAPP\Rev 1_July 2008\2008_Low Res Core QAPP_2008 July 18_Rev1_worksheets20-37_DQOs.doc
QAPP Worksheet #31 (UFP-QAPP Manual Section 4.1.1) Planned Project Assessments Table
Assessment Type Frequency
Internal or External
Organization Performing
Assessment
Person(s) Responsible for
Performing Assessment
Person(s) Responsible for Responding to
Assessment Findings
Person(s) Responsible for Identifying and Implementing
Corrective Actions (CA)
Person(s) Responsible for
Monitoring Effectiveness of CA
Safety Audit Once, during the first week of field work
Internal ENSR ENSR Regional EHS Manager
ENSR RI FTM, SSO, and RI Task Manager
ENSR RI FTM, SSO and RI Task Manager
ENSR Regional EHS Manager
Technical Audit of Field Activities
Once during the first few days of field operations; follow-up audits as necessary
Internal ENSR ENSR Project QA Manager
ENSR On-Site Coordinator, RI FTM and RI Task Manager
ENSR On-Site Coordinator, RI FTM and RI Task Manager
ENSR Project QA Manager
Internal Lab Audits
Per laboratory QA Manual; at least annually
Internal Laboratory Laboratory QA Officer or designee
Laboratory management and staff
Laboratory management and staff Laboratory QA Officer
External Lab Audits
Audit will be performed in advance of field work or during the initial stages; follow-up audits as necessary.
External
State or national certifying authority and/or ENSR
State or national certifying authority auditor or ENSR Project QA Manager or designee
Laboratory management and staff
Laboratory management and staff
Laboratory management and staff; ENSR Project QA Manager or designee.

Section: Worksheet #31 Revision: 1
Date: July 2008
Quality Assurance Project Plan Phase I RI Low Resolution Coring/Sediment Sampling Lower Passaic River Restoration Project Newark, New Jersey Page 2 of 2
QAPP Worksheet #31 (UFP-QAPP Manual Section 4.1.1) Planned Project Assessments Table
J:\Water\ProjectFiles\P120\12182_Passaic\QAPP\Rev 1_July 2008\2008_Low Res Core QAPP_2008 July 18_Rev1_worksheets20-37_DQOs.doc
Assessment Type Frequency
Internal or External
Organization Performing
Assessment
Person(s) Responsible for
Performing Assessment
Person(s) Responsible for Responding to
Assessment Findings
Person(s) Responsible for Identifying and Implementing
Corrective Actions (CA)
Person(s) Responsible for
Monitoring Effectiveness of CA
Project- Specific External Lab Audit
Audit will be performed in advance of field work or during the initial stages; follow-up audits as necessary.
External ENSR ENSR Project QA Manager or designee
Laboratory management and staff
Laboratory management and staff
Laboratory management and staff; ENSR Project QA Manager or designee.
PE samples
PE samples will be sent to the laboratories for analysis in advance of initiation of field work; with follow-up PEs as necessary.
External ENSR ENSR Project QA Manager or designee
Laboratory management and staff
Laboratory management and staff
Laboratory management and staff; ENSR Project QA Manager or designee.

Section: Worksheet #32 Revision: 1
Date: July 2008
Quality Assurance Project Plan Phase I RI Low Resolution Coring/Sediment Sampling Lower Passaic River Restoration Project Newark, New Jersey Page 1 of 3
J:\Water\ProjectFiles\P120\12182_Passaic\QAPP\Rev 1_July 2008\2008_Low Res Core QAPP_2008 July 18_Rev1_worksheets20-37_DQOs.doc
QAPP Worksheet #32 (UFP-QAPP Manual Section 4.1.2) Assessment Findings and Corrective Action Responses
Assessment Type
Nature of Deficiencies
Documentation Individual(s) Notified
of Findings Timeframe of Notification
Nature of Corrective Action Response Documentation
Individual(s) Receiving Corrective Action
Response Timeframe for Response
Field System Audit Written audit report
RI/FS PM, RI Task Manager, RI FTM, On-Site Coordinator, CPG QA Coordinator
Verbal summary of major findings within 24 hours; written report within one week.
Memo with possible reaudit
Project QA Manager, RI/FS PM, RI Task Manager, CPG QA Coordinator
One week
Internal Laboratory Audits
Written audit report Laboratory Manager,
Major deficiencies within 24 hours; written report as required by laboratory QA Manual
Memo or as required by laboratory QA Manual
Laboratory Manager, Laboratory PM ENSR Project Chemist and Project QA Manager (if project DQOs are affected)
As required by laboratory QA Manual
External Laboratory Audits by third-party entities
Written audit report Laboratory Manager
Major deficiencies communicated orally at exit meeting; written report based on policy of external auditing organization
Letter or as required by external auditing organization with possible reaudit
External auditing organization ENSR Project Chemist and ENSR Project QA Manager (if project DQOs are affected)
As required by external auditing organization.
External Laboratory Audits by ENSR
Written audit report Laboratory Manager
Major deficiencies communicated orally at exit meeting written report within 1 month
Letter with possible reaudit
ENSR Project Chemist, Project QA Manager, and CPG QA Coordinator
One month

Section: Worksheet #32 Revision: 2
Date: July 2008
Quality Assurance Project Plan Phase I RI Low Resolution Coring/Sediment Sampling Lower Passaic River Restoration Project Newark, New Jersey Page 2 of 3
QAPP Worksheet #32 (UFP-QAPP Manual Section 4.1.2) Assessment Findings and Corrective Action Responses
J:\Water\ProjectFiles\P120\12182_Passaic\QAPP\Rev 1_July 2008\2008_Low Res Core QAPP_2008 July 18_Rev1_worksheets20-37_DQOs.doc
Assessment Type
Nature of Deficiencies
Documentation Individual(s) Notified
of Findings Timeframe of Notification
Nature of Corrective Action Response Documentation
Individual(s) Receiving Corrective Action
Response Timeframe for Response
PE samples Written PE results evaluation report Laboratory Manager
Deficiencies (results outside acceptance range) identified within one week of receiving laboratory results
Letter with request for laboratory investigation into deficiencies and corrective action, if necessary, before project field samples are analyzed. Corrective action may include investigation and preparation by the laboratory of a corrective action report, analysis of a new PE sample, or if ENSR deems appropriate, the analyses may be moved to another lab.
ENSR Project Chemist, Project QA Manager, and CPG QA Coordinator
One week
Non-Conformance/QC Reporting
A non-conformance is defined as an identified or suspected deficiency in, or deviation from, procedures described in an approved document (e.g., improper sampling procedures, improper instrument calibration, errors in calculations or errors in computer algorithms); an item where the quality of the end product itself or subsequent activities conducted using the document or item would be affected by the deficiency; or an activity that is not conducted in accordance with established plans or procedures. Any project staff member that discovers or suspects a non-conformance is responsible for initiating a non-conformance report to the Project QA Manager. The Project QA Manager will evaluate each non-conformance report and provide a response describing the actions to be taken and assigning responsibility for the corrective action. The appropriate Task Manager will verify that the nonconforming item or procedure is not used until the corrective action has been performed and found to produce acceptable results. If the non-conformance involves instrumentation or equipment, the device must be tagged to indicate it is defective and not to be used.
A copy of each non-conformance report will be added to the project file. Original non-conformance reports will be maintained by the Project QA Manager.

Section: Worksheet #32 Revision: 2
Date: July 2008
Quality Assurance Project Plan Phase I RI Low Resolution Coring/Sediment Sampling Lower Passaic River Restoration Project Newark, New Jersey Page 3 of 3
QAPP Worksheet #32 (UFP-QAPP Manual Section 4.1.2) Assessment Findings and Corrective Action Responses
J:\Water\ProjectFiles\P120\12182_Passaic\QAPP\Rev 1_July 2008\2008_Low Res Core QAPP_2008 July 18_Rev1_worksheets20-37_DQOs.doc
Assessment
Assessment activities will measure the effectiveness of the project implementation and associated QA/QC activities. Audits are used as a means of monitoring the performance of field and laboratory activities and are conducted by the Project QA Manager or another member of the QA staff. Audits will include systems audits which are more qualitative in nature and will be made at appropriate intervals to ensure that all aspects of the QA program are operative. Performance audits are quantitative audits which are conducted to assess the accuracy of measurement systems; this would include the use of performance evaluation samples.
Systems audits will be conducted for field and laboratory operations to assess implementation of QA/QC requirements and determine if the systems under review are capable of meeting project DQOs. Any minor deficiencies noted during an audit will be corrected as soon as possible according to an agreed upon schedule. If a major deficiency is noted during an audit a stop work order will be issued until the deficiency can be corrected and the effectiveness of the corrective action measured and documented. A stop work order may be issued by the Project QA Manager who will notify the RI Task Manager and the RI/FS PM. The conditions which lead to a stop work order must be documented in sufficient detail to clearly define the problem and identify possible corrective measures. All communications among project staff which address evaluation of the problem and appropriate solutions must be attached to the stop work order. The Project QA Manager, the RI Task Manager, and RI/FS PM must agree in writing to resume work after review of the data supporting correction of the deficiency. The Project QA Manager will maintain a corrective action log which lists deficiencies that were noted, the individual(s) responsible for follow-up, documentation of the effectiveness of the corrective actions taken, and implementation of procedures to prevent recurrence of the problem.
A written report will be prepared for all audits regardless of the outcome and submitted to the RI Task Manager and the RI/FS PM. Any modifications to the existing program, corrective actions required, or the need for additional audits will be documented.
In addition to participation in any audits conducted by ENSR QA personnel, participating laboratories are required to take part in regularly scheduled performance evaluations and audits required by state and federal agencies as part of ongoing certification or participation in specific contracts and to provide copies of the results of these performance evaluations and audits to the Project Chemist. Any change in laboratory ownership, management, or certification status must be immediately reported to the Project Chemist. If any laboratory analysis is found to be out of control, the laboratory must immediately implement corrective action and notify the Project Chemist. The laboratory PM will be responsible for documenting the effectiveness of the corrective action measures before continuing analysis of project samples.

Section: Worksheet #33 Revision: 2
Date: July 2008
Quality Assurance Project Plan Phase I RI Low Resolution Coring/Sediment Sampling Lower Passaic River Restoration Project Newark, New Jersey Page 1 of 1
J:\Water\ProjectFiles\P120\12182_Passaic\QAPP\Rev 1_July 2008\2008_Low Res Core QAPP_2008 July 18_Rev1_worksheets20-37_DQOs.doc
QAPP Worksheet #33 (UFP-QAPP Manual Section 4.2) QA Management Reports Table
Type of Report Frequency Projected Delivery Date(s) Person(s) Responsible for
Report Preparation Report Recipient(s)
Progress Reports Monthly Due the 15th of each month ENSR RI/FS PM/ CPG Project Coordinator USEPA RPM
Audit Reports
During first week of sampling, at least annually during analytical program and as needed for follow up.
Within one month after field work begins and at least annually or as required during program
ENSR Project QA Manager ENSR RI Task Manager, ENSR RI/FS PM, CPG QA Coordinator
Data Validation Reports After laboratory data are received and validated See Worksheet 16 ENSR Data Validation Task
Manager
ENSR Project QA Manager, RI Task Manager, and ENSR RI/FS PM
Nonconformance report As needed When a nonconformance is identified ENSR staff
ENSR Project QA Manager, applicable ENSR Task Manager, USEPA RPM
Corrective Action Reports When corrective action is required
When corrective action is implemented
ENSR Project QA Manager or designated Task Manager
ENSR RI/FS PM, RI Task Manager, applicable Task Managers and Project Team Members, CPG QA Coordinator, CPG Project Coordinator, USEPA RPM
The monthly management report will address the results of any corrective actions or audits which took place during the reporting period as well as any trends noted during the data validation process. Problems or issues which arise between regular reporting periods may be identified to management at any time. Information included in the monthly progress report will include:
• Results of audits conducted during the reporting period;
• Discussion of problems with measurement data including issues related to precision, accuracy, completeness, representativeness, and comparability that could affect achievement of the DQOs; and
• A listing of any non-conformance reports or stop-work orders, the associated corrective actions taken, and the outcome of these corrective actions.

Section: Worksheet #34 Revision: 1
Date: July 2008
Quality Assurance Project Plan Phase I RI Low Resolution Coring/Sediment Sampling Lower Passaic River Restoration Project Newark, New Jersey Page 1 of 1
J:\Water\ProjectFiles\P120\12182_Passaic\QAPP\Rev 1_July 2008\2008_Low Res Core QAPP_2008 July 18_Rev1_worksheets20-37_DQOs.doc
QAPP Worksheet #34 (UFP-QAPP Manual Section 5.2.1) Verification (Step I) Process Table
Verification Input Description Internal/ External Responsible for Verification)
Field data Field data will be reviewed for completeness, accuracy and agreement with SOP LPR-G-01 (Field Records). Internal ENSR RI FTM or designee
The COC will be reviewed initially in the field for complete and correct information. Internal ENSR On-Site Coordinator, RI FTM, or
designee
Upon receipt at the lab the COC will be compared to sample containers and any discrepancies will be resolved. External Laboratory Sample Custodian Chain-of-Custody
During validation the COC will be verified against laboratory receipt and reporting information. External ENSR Data Validator
Laboratory data (hard copy and EDDs) will be verified by the laboratory performing the work for completeness and technical accuracy prior to release.
Internal Laboratory Laboratory Data Packages and EDD
Laboratory data will be assessed using the validation procedures described in Worksheets 35 and 36 External ENSR Data Validator
Audit Reports Audit reports will be reviewed to confirm that specified corrective actions have been taken, the corrective action has been effective and all documentation of corrective action is attached to the audit report.
Internal ENSR Project QA Manager
Assessment actions and reports
QA/QC process will be reviewed for agreement with QAPP/FSP Addendum External ddmis, inc.
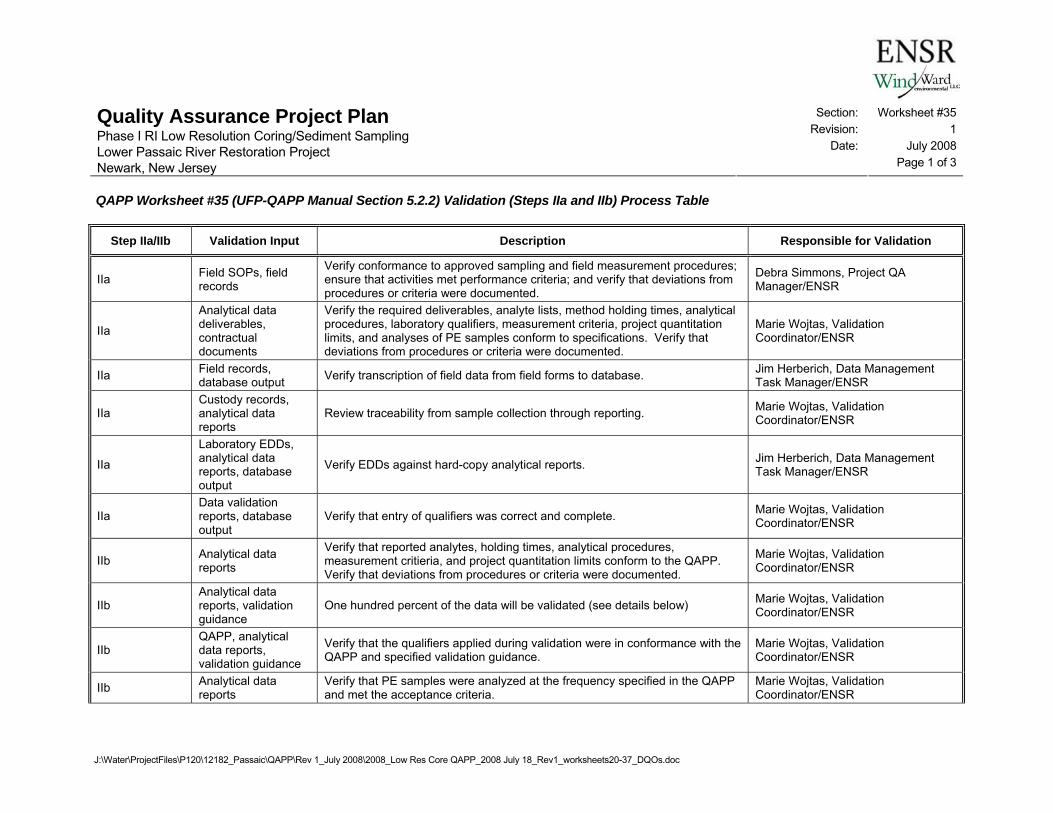
Section: Worksheet #35 Revision: 1
Date: July 2008
Quality Assurance Project Plan Phase I RI Low Resolution Coring/Sediment Sampling Lower Passaic River Restoration Project Newark, New Jersey Page 1 of 3
J:\Water\ProjectFiles\P120\12182_Passaic\QAPP\Rev 1_July 2008\2008_Low Res Core QAPP_2008 July 18_Rev1_worksheets20-37_DQOs.doc
QAPP Worksheet #35 (UFP-QAPP Manual Section 5.2.2) Validation (Steps IIa and IIb) Process Table
Step IIa/IIb Validation Input Description Responsible for Validation
IIa Field SOPs, field records
Verify conformance to approved sampling and field measurement procedures; ensure that activities met performance criteria; and verify that deviations from procedures or criteria were documented.
Debra Simmons, Project QA Manager/ENSR
IIa
Analytical data deliverables, contractual documents
Verify the required deliverables, analyte lists, method holding times, analytical procedures, laboratory qualifiers, measurement criteria, project quantitation limits, and analyses of PE samples conform to specifications. Verify that deviations from procedures or criteria were documented.
Marie Wojtas, Validation Coordinator/ENSR
IIa Field records, database output Verify transcription of field data from field forms to database. Jim Herberich, Data Management
Task Manager/ENSR
IIa Custody records, analytical data reports
Review traceability from sample collection through reporting. Marie Wojtas, Validation Coordinator/ENSR
IIa
Laboratory EDDs, analytical data reports, database output
Verify EDDs against hard-copy analytical reports. Jim Herberich, Data Management Task Manager/ENSR
IIa Data validation reports, database output
Verify that entry of qualifiers was correct and complete. Marie Wojtas, Validation Coordinator/ENSR
IIb Analytical data reports
Verify that reported analytes, holding times, analytical procedures, measurement critieria, and project quantitation limits conform to the QAPP. Verify that deviations from procedures or criteria were documented.
Marie Wojtas, Validation Coordinator/ENSR
IIb Analytical data reports, validation guidance
One hundred percent of the data will be validated (see details below) Marie Wojtas, Validation Coordinator/ENSR
IIb QAPP, analytical data reports, validation guidance
Verify that the qualifiers applied during validation were in conformance with the QAPP and specified validation guidance.
Marie Wojtas, Validation Coordinator/ENSR
IIb Analytical data reports
Verify that PE samples were analyzed at the frequency specified in the QAPP and met the acceptance criteria.
Marie Wojtas, Validation Coordinator/ENSR

Section: Worksheet #35 Revision: 1
Date: July 2008
Quality Assurance Project Plan Phase I RI Low Resolution Coring/Sediment Sampling Lower Passaic River Restoration Project Newark, New Jersey Page 2 of 3
QAPP Worksheet #35 (UFP-QAPP Manual Section 5.2.2) Validation (Steps IIa and IIb) Process Table
J:\Water\ProjectFiles\P120\12182_Passaic\QAPP\Rev 1_July 2008\2008_Low Res Core QAPP_2008 July 18_Rev1_worksheets20-37_DQOs.doc
Step IIa/IIb Validation Input Description Responsible for Validation
IIb QAPP, data validation reports
Verify that data validation was performed in accordance with the QAPP specifications and that all required peer reviews were conducted. If validation actions deviated from the QAPP specifications and/or regional validation guidance based on professional judgment, verify that rationale was documented.
Debra Simmons, Project QA Manager/ENSR
Data Validation
At a minimum, 100% full validation (includes review of raw data and spot check for verification of calculations) will be conducted for Dioxins/Furans, and PCB Homologs and Congeners for each sample delivery group (SDG). For all other parameters, 100% full validation (as appropriate to the analyses) will be peformed on the first two SDGs. The remaining SDGs will be subject to full validation for every ten SDGs, and limited validation for the remaining SDGs.
Limited validation will be based on information provided by the laboratory on their QC forms, and will include no or minimal raw data review. At a minimum, limited validation will include the following data elements:
• Agreement of analyses conducted with COC requests • Holding times and sample preservation • Initial and continuing calibrations and analytical sequence • Mass spectrometer tuning (GC/MS only) • Internal standard performance (GC/MS only) • Laboratory blanks/equipment blanks/ field blanks/ trip blanks • Surrogate recoveries • Laboratory control sample/laboratory control sample duplicate (LCS/LCSD) results • Matrix spike/matrix spike duplicate (MS/MSD) results • Laboratory duplicate results • Field duplicate results • Interference check sample (ICS) results (AB solution only)

Section: Worksheet #35 Revision: 1
Date: July 2008
Quality Assurance Project Plan Phase I RI Low Resolution Coring/Sediment Sampling Lower Passaic River Restoration Project Newark, New Jersey Page 3 of 3
QAPP Worksheet #35 (UFP-QAPP Manual Section 5.2.2) Validation (Steps IIa and IIb) Process Table
J:\Water\ProjectFiles\P120\12182_Passaic\QAPP\Rev 1_July 2008\2008_Low Res Core QAPP_2008 July 18_Rev1_worksheets20-37_DQOs.doc
• Inductively Coupled Plasma (ICP) serial dilution results • Chemical yield (tracers and carriers) (radiochemical only) • Percent solids • Quantitation limits and sample results (limited to evaluating dilutions and reanalyses)
If significant issues (e.g., those affecting achievement of the DQOs) are noted during full validation, the limited validation will be expanded to include this issue. Systematic or random errors that would not be detected during a review of the summary forms might include, for example, misidentification or quantitation of compounds, transcription errors, or calculation errors. In addition, limited validation will provide review of key laboratory QC elements, which would highlight potential underlying lab issues which may require further investigation (i.e., full validation effort). If a high frequency of measurement performance issues are found, the issue will be investigated and an additional validation effort may be implemented. ENSR plans to maintain communication/notification systems with the laboratory during the analytical process to circumvent significant QC issues. If QC issues do arise, investigations and corrective actions will be documented and implemented in a timely fashion to optimize the amount of un-qualified data. In addition, data packages receiving limited validation will receive a completeness check so that full validation could be performed at a later data, if necessary. The check will verify that the raw data for each sample (including all reanalyses and dilutions) are present and complete. The data supporting the sample results, such as QC samples (method blanks, LCS, MS/MSD), calibrations, tunes, and preparation logs, will also be reviewed for overall completeness, however, an in-depth inventory to ensure specific association with all sample data will not be performed. No additional completeness check will be performed for the geotechnical or pathogen tests due to limited back-up information provided and the nature of the tests. Qualifiers will be applied based on the criteria in the QAPP, method-specific Region II validation SOPs, or professional judgement.
Reports summarizing data qualification as a result of the validation effort will be prepared.

Section: Worksheet #36 Revision: 1
Date: July 2008
Quality Assurance Project Plan Phase I RI Low Resolution Coring/Sediment Sampling Lower Passaic River Restoration Project Newark, New Jersey Page 1 of 4
J:\Water\ProjectFiles\P120\12182_Passaic\QAPP\Rev 1_July 2008\2008_Low Res Core QAPP_2008 July 18_Rev1_worksheets20-37_DQOs.doc
QAPP Worksheet #36 (UFP-QAPP Manual Section 5.2.2) Validation (Steps IIa and IIb) Summary Table
Step IIa/IIb Matrix Analytical Group Concentration
Level Validation Criteria*
Data Validator (title and organizational
affiliation)
IIa Sediment Metals Low Region II validation SOP HW-2, modified for method
Marie Wojtas, Validation Coordinator/ENSR (or designate)
IIa Sediment Butyltins Low Region II validation SOP HW-44, modified for method
Marie Wojtas, Validation Coordinator/ENSR (or designate)
IIa Sediment Dioxins/Furans Low Region II validation SOP HW-25 Marie Wojtas, Validation Coordinator/ENSR (or designate)
IIa Sediment Low Level Mercury Low Region II validation SOP HW-2, modified for method
Marie Wojtas, Validation Coordinator/ENSR (or designate)
IIa Sediment Methyl Mercury Low Region II validation SOP HW-2, modified for method
Marie Wojtas, Validation Coordinator/ENSR (or designate)
IIa Sediment Hexavalent Chromium Low NJDEP SOP 5.A.10, rev. no. 2, modified
Marie Wojtas, Validation Coordinator/ENSR (or designate)
IIa Sediment Organochlorine Pesticides – GC/ECD Low Region II validation SOP HW-44 Marie Wojtas, Validation
Coordinator/ENSR (or designate)
IIa Sediment Organochlorine Pesticides – HRGC/HRMS
Low Region II validation SOP HW-25, modified for method
Marie Wojtas, Validation Coordinator/ENSR (or designate)
IIa Sediment PCBs – Aroclors Low- High Region II validation SOP HW-45 Marie Wojtas, Validation Coordinator/ENSR (or designate)
IIa Sediment PCBs – homologs and congeners Low- High Region II validation SOP HW-46 Marie Wojtas, Validation
Coordinator/ENSR (or designate)
IIa Sediment SVOCs Low Region II validation SOP HW-22 Marie Wojtas, Validation Coordinator/ENSR (or designate)
IIa Sediment PAHs and Alkyl PAHs – HRGC/LRMS-SIM Low Region II validation SOP HW-22,
modified for method Marie Wojtas, Validation Coordinator/ENSR (or designate)
IIa Sediment VOCs Low Region II validation SOP HW-24 Marie Wojtas, Validation Coordinator/ENSR (or designate)
IIa Sediment TPH-DRO Low Region II validation SOP HW-44, modified for method
Marie Wojtas, Validation Coordinator/ENSR (or designate)

Section: Worksheet #36 Revision: 1
Date: July 2008
Quality Assurance Project Plan Phase I RI Low Resolution Coring/Sediment Sampling Lower Passaic River Restoration Project Newark, New Jersey Page 2 of 4
QAPP Worksheet #36 (UFP-QAPP Manual Section 5.2.2) Validation (Steps IIa and IIb) Summary Table
J:\Water\ProjectFiles\P120\12182_Passaic\QAPP\Rev 1_July 2008\2008_Low Res Core QAPP_2008 July 18_Rev1_worksheets20-37_DQOs.doc
Step IIa/IIb Matrix Analytical Group Concentration
Level Validation Criteria*
Data Validator (title and organizational
affiliation)
IIa Sediment TPH-GRO Low Region II validation SOP HW-44, modified for method
Marie Wojtas, Validation Coordinator/ENSR (or designate)
IIa Sediment Herbicides Low Region II validation SOP HW-17 Marie Wojtas, Validation Coordinator/ENSR (or designate)
IIa Sediment Wet chemistry Low QAPP Worksheets 12, 15, 19, and 24
Marie Wojtas, Validation Coordinator/ENSR (or designate)
IIa Sediment Radiochemistry Low Multi-Agency Radiological Laboratory Analytical Protocols Manual (MARLAP), July 2004
Marie Wojtas, Validation Coordinator/ENSR (or designate)
IIa Sediment Physical Testing N/A QAPP Worksheets 12, 15, 19, and 24
Marie Wojtas, Validation Coordinator/ENSR (or designate)
IIb Sediment Metals Low Region II validation SOP HW-2, modified, and/or QAPP Worksheets 12, 15, 19, and 24
Marie Wojtas, Validation Coordinator/ENSR (or designate)
IIb Sediment Butyltins Low QAPP Worksheets 12, 15, 19, and 24
Marie Wojtas, Validation Coordinator/ENSR (or designate)
IIb Sediment Dioxins/Furans Low
Region II validation SOP HW-25 and/or QAPP Worksheets 12, 15, 19, and 24, whichever is more stringent
Marie Wojtas, Validation Coordinator/ENSR (or designate)
IIb Sediment Low Level Mercury Low QAPP Worksheets 12, 15, 19, and 24
Marie Wojtas, Validation Coordinator/ENSR (or designate)
IIb Sediment Methyl Mercury Low QAPP Worksheets 12, 15, 19, and 24
Marie Wojtas, Validation Coordinator/ENSR (or designate)
IIb Sediment Hexavalent Chromium Low NJDEP SOP 5.A.10, rev. no. 2, modified, and/or QAPP Worksheets 12, 15, 19, and 24
Marie Wojtas, Validation Coordinator/ENSR (or designate)

Section: Worksheet #36 Revision: 1
Date: July 2008
Quality Assurance Project Plan Phase I RI Low Resolution Coring/Sediment Sampling Lower Passaic River Restoration Project Newark, New Jersey Page 3 of 4
QAPP Worksheet #36 (UFP-QAPP Manual Section 5.2.2) Validation (Steps IIa and IIb) Summary Table
J:\Water\ProjectFiles\P120\12182_Passaic\QAPP\Rev 1_July 2008\2008_Low Res Core QAPP_2008 July 18_Rev1_worksheets20-37_DQOs.doc
Step IIa/IIb Matrix Analytical Group Concentration
Level Validation Criteria*
Data Validator (title and organizational
affiliation)
IIb Sediment Organochlorine Pesticides – GC/ECD Low
Region II validation SOP HW-44 and/or QAPP Worksheets 12, 15, 19, and 24, whichever is more stringent
Marie Wojtas, Validation Coordinator/ENSR (or designate)
IIb Sediment Organochlorine Pesticides – HRGC/HRMS
Low QAPP Worksheets 12, 15, 19, and 24
Marie Wojtas, Validation Coordinator/ENSR (or designate)
IIb Sediment PCBs – Aroclors Low- High Region II validation SOP HW-45 and/or QAPP Worksheets 12, 15, 19, and 24
Marie Wojtas, Validation Coordinator/ENSR (or designate)
IIb Sediment PCBs – homologs and congeners Low- High
Region II validation SOP HW-46 and/or QAPP Worksheets 12, 15, 19, and 24
Marie Wojtas, Validation Coordinator/ENSR (or designate)
IIb Sediment SVOCs Low
Region II validation SOP HW-22 and/or QAPP Worksheets 12, 15, 19, and 24, whichever is more stringent
Marie Wojtas, Validation Coordinator/ENSR (or designate)
IIb Sediment PAHs and Alkyl PAHs – HRGC/LRMS-SIM Low QAPP Worksheets 12, 15, 19, and
24 Marie Wojtas, Validation Coordinator/ENSR (or designate)
IIb Sediment VOCs Low
Region II validation SOP HW-24 and/or QAPP Worksheets 12, 15, 19, and 24, whichever is more stringent
Marie Wojtas, Validation Coordinator/ENSR (or designate)
IIb Sediment TPH-DRO Low QAPP Worksheets 12, 15, 19, and 24
Marie Wojtas, Validation Coordinator/ENSR (or designate)
IIb Sediment TPH-GRO Low QAPP Worksheets 12, 15, 19, and 24
Marie Wojtas, Validation Coordinator/ENSR (or designate)
IIb Sediment Herbicides Low Region II validation SOP HW-17 and/or QAPP Worksheets 12, 15, 19, and 24, which is more stringent
Marie Wojtas, Validation Coordinator/ENSR (or designate)

Section: Worksheet #36 Revision: 1
Date: July 2008
Quality Assurance Project Plan Phase I RI Low Resolution Coring/Sediment Sampling Lower Passaic River Restoration Project Newark, New Jersey Page 4 of 4
QAPP Worksheet #36 (UFP-QAPP Manual Section 5.2.2) Validation (Steps IIa and IIb) Summary Table
J:\Water\ProjectFiles\P120\12182_Passaic\QAPP\Rev 1_July 2008\2008_Low Res Core QAPP_2008 July 18_Rev1_worksheets20-37_DQOs.doc
Step IIa/IIb Matrix Analytical Group Concentration
Level Validation Criteria*
Data Validator (title and organizational
affiliation)
IIa Sediment Wet chemistry Low QAPP Worksheets 12, 15, 19, and 24
Marie Wojtas, Validation Coordinator/ENSR (or designate)
IIb Sediment Radiochemistry Low MARLAP, July 2004 and/or QAPP Worksheets 12, 15, 19, and 24
Marie Wojtas, Validation Coordinator/ENSR (or designate)
IIb Sediment Physical Testing N/A QAPP Worksheets 12, 15, 19, and 24
Marie Wojtas, Validation Coordinator/ENSR (or designate)
*Validation criteria includes professional judgment where appropriate and necessary. Note that modifications to the Region 2 data validation SOPs are performed when there is no SOP for the specified method. In those cases, the most relevant Region 2 data validation SOP is used as a reference, and modified for method specific criteria, with consistent Region 2 validation actions. Modifications to the Region 2 SOPs may also be made to incorporate the performance measurement criteria for this project. Modifications will be discussed in the data validation reports.

Section: Worksheet #37 Revision: 1
Date: July 2008
Quality Assurance Project Plan Phase I RI Low Resolution Coring/Sediment Sampling Lower Passaic River Restoration Project Newark, New Jersey Page 1 of 3
J:\Water\ProjectFiles\P120\12182_Passaic\QAPP\Rev 1_July 2008\2008_Low Res Core QAPP_2008 July 18_Rev1_worksheets20-37_DQOs.doc
QAPP Worksheet #37 (UFP-QAPP Manual Section 5.2.3) Usability Assessment
Summarize the usability assessment process and all procedures, including interim steps and any statistics, equations, and computer algorithms that will be used: ENSR’s data validation staff will validate all laboratory data in accordance with the protocols described in Worksheet 36. The Project QA Manager, in conjunction with the project team, will determine whether the analytical data meet the requirements for use in making decisions related to further actions at the site. The results of laboratory measurements will be compared to the DQOs described in Attachment 1 of this document.
Describe the evaluative procedures used to assess overall measurement error associated with the project: During the data validation process the validator will use information confirming sample identification; sample preparation; analysis within holding time; instrument calibration data; and results of QC samples designed to assess blank contamination, analytical precision, and accuracy to identify any limitations in data use and, if known, data bias. The validator will apply qualifiers as needed to reflect any limitations on the use of specific data points and prepare a report detailing the information reviewed, data limitations, and overall usability. Patterns of data use limitations or anomalies which become apparent during the validation process or as the users will be reviewed with the Project QA Manager and the appropriate laboratory. Data that do not meet the quality acceptance limits of Worksheet #28, or quality levels of Worksheet #15, or analytical performance criteria specified in Worksheet #12 will be clearly identified in the database so data users are aware of any limitations associated with data usability. Details of the problems identified during data validation and the bias in the data will be provided in the associated validation memorandum.
Identify the personnel responsible for performing the usability assessment: Data validation will be performed by ENSR’s data validation staff under the supervision of the Project QA Manager. The usability assessment will be performed jointly by the ENSR and CPG project teams and will include input by field personnel, QA staff, and project management.
Describe the documentation that will be generated during usability assessment and how usability assessment results will be presented so that they identify trends, relationships (correlations), and anomalies: The documentation generated during data validation will include a comprehensive memorandum that describes the information reviewed, the results of this review and provides a recommendation on overall data usability and limitations on specific data points. The memorandum and associated validation worksheets provide information on the samples included in the review and the date they were collected; the condition of samples when received at the laboratory and any discrepancies noted during the receiving process; verification of sample preparation and analysis within the method specified holding time; instrument calibration information; review of associated QC analyses including blanks, laboratory control samples, matrix spikes, and field and/or laboratory duplicates; verification of selected reported values from raw data. As a result of this review standard qualifiers are entered into the database so that data users can readily identify any limitations associated with a specific data point.

Section: Worksheet #37 Revision: 1
Date: July 2008
Quality Assurance Project Plan Phase I RI Low Resolution Coring/Sediment Sampling Lower Passaic River Restoration Project Newark, New Jersey Page 2 of 3
QAPP Worksheet #37 (UFP-QAPP Manual Section 5.2.3) Usability Assessment
J:\Water\ProjectFiles\P120\12182_Passaic\QAPP\Rev 1_July 2008\2008_Low Res Core QAPP_2008 July 18_Rev1_worksheets20-37_DQOs.doc
Assessment of data usability will be performed by ENSR’s data validation staff using current USEPA Region II data validation guidance. The results of the Data Usability Assessment will be summarized in the final project report. The following items will be assessed and conclusions drawn based on their results:
Holding Time: All sample data will be checked to verify that both sample preparation and analysis were performed within the method required holding time.
Calibration: Data associated with instrument calibration and verification of calibration will be reviewed to confirm that all data were generated using properly calibrated instrumentation.
Accuracy/Bias Contamination: Results for all field blanks, trip blanks, laboratory method blanks, and instrument calibration blanks will be checked against performance criteria specified in Worksheet # 28; results for analytes that exceed criteria will be identified and the impact on field sample data will be assessed. Data will be summarized by type of blank.
Accuracy/Bias Overall: Reported values of laboratory control samples, performance samples, and matrix spikes will be evaluated against the spiked or certified concentration and the percent recovery will be calculated and compared to the criteria specified in Worksheet #28. The percent recovery information will be used to assess the bias associated with the analysis. Recovery for matrix spikes in conjunction with the recovery reported for performance samples and laboratory control samples will provide information on the impact of the sample matrix on specific analyses. Average recoveries will be calculated and reported by analyte for each type of QC sample.
Precision: Results of the relative percent difference (RPD) will be calculated for each analyte in laboratory and field duplicates. These RPDs will be checked against measurement performance criteria presented on Worksheet #28; RPDs exceeding the stated criteria will be identified. Additionally the combined RPD of each analyte will be averaged across duplicate pairs whose original and duplicate values are both greater than the QL and a combined overall RPD average will be determined for each analyte in both laboratory and field duplicates. This information will be used to draw conclusions about the precision of the analyses and, for field duplicates, the precision of sampling and analysis. Any limitations on the use of the data will also be described.
Sensitivity: Reporting limits will be checked against the criteria presented on Worksheet #15 and QLs presented on Worksheet #15. Limitations on the use of the data and conclusions about the sensitivity of the analysis will be reported.
Representativeness: A review of field records will be used to confirm that sample collection and handling was performed in a manner that conformed to the designated SOP. Similarly laboratory preparation procedures will be reviewed during validation to ensure that a representative sample was

Section: Worksheet #37 Revision: 1
Date: July 2008
Quality Assurance Project Plan Phase I RI Low Resolution Coring/Sediment Sampling Lower Passaic River Restoration Project Newark, New Jersey Page 3 of 3
QAPP Worksheet #37 (UFP-QAPP Manual Section 5.2.3) Usability Assessment
J:\Water\ProjectFiles\P120\12182_Passaic\QAPP\Rev 1_July 2008\2008_Low Res Core QAPP_2008 July 18_Rev1_worksheets20-37_DQOs.doc
selected for analysis. Any deviations or modifications to field or laboratory procedures which might impact the representativeness of the sample will be discussed in the project final report.
Comparability: The sampling and analytical procedures which will be used in this program have been selected to ensure that the resulting data will be comparable to data from similar programs conducted previously or which will be conducted in the future. Any modifications or deviations from stated procedures which might impact data comparability will be addressed in the project final report
Completeness: Completeness for the analytical program will be calculated as the number of data points that are accepted as usable based on the validation process divided by the total number of data points for each analysis. Completeness will be reported for each analytical category and an overall value will be reported. As shown in Worksheet #12, the analytical completeness goal is ≥90%. Completeness for the field program will be calculated as the number of samples successfully collected compared to the total number proposed in this QAPP/FSP Addendum. The completeness goal for the field sampling program is ≥95%.
Each of the PQOs presented on Worksheet #15 will be reviewed to determine if the stated objective was met. The major impacts observed from data validation, data quality indicators (DQI) and measurement performance criteria assessments will be used to assess the overall data quality and whether PQOs were achieved. The final report will summarize the information used to reconcile each objective and overall conclusions regarding data quality.

Section: Attachments Revision: 1
Date: July 2008
Quality Assurance Project Plan Phase I RI Low Resolution Coring/Sediment Sampling Lower Passaic River Restoration Project Newark, New Jersey Page 1 of 18
J:\Water\ProjectFiles\P120\12182_Passaic\QAPP\Rev 1_July 2008\2008_Low Res Core QAPP_2008 July 18_Rev1_worksheets20-37_DQOs.doc
Attachment 1 Data Quality Objectives

Section: Attachments Revision: 1
Date: July 2008
Quality Assurance Project Plan Phase I RI Low Resolution Coring/Sediment Sampling Lower Passaic River Restoration Project Newark, New Jersey Page 2 of 18
J:\Water\ProjectFiles\P120\12182_Passaic\QAPP\Rev 1_July 2008\2008_Low Res Core QAPP_2008 July 18_Rev1_worksheets20-37_DQOs.doc
DQO Step
Data Quality Objective 1 (DQO 1): Develop Understanding of Physical Characteristics of Impacted Sediment Description
STEP 1 State the problem
The stability of the impacted sediment in the Lower Passaic River Study Area (LPRSA) must be understood to permit an evaluation of sediment erosion, resuspension, and transport as one of the mechanisms for the transport of site chemicals. Physical characteristics of the sediment, such as particle size distribution, mineralogy bulk density, and shear strength, are required for this evaluation. Other important lines of evidence to assess sediment stability include radiodating, sediment probing, surface sediment grabs, Sedflume, and bathymetry time-series data. Understanding these physical characteristics is necessary to (1) support the continued development of the Lower Passaic River/Newark Bay (LPR/NB) Model components, including the hydrodynamic, sediment transport, and contaminant fate and transport models; (2) support our understanding of the conceptual site model (CSM); (3) provide information regarding the handling and settling characteristics of the material needed for the feasibility study (FS); and, (4) confirm the stability of the sediment has the potential to impact the evaluation of current and future potential risks to human health and the environment.
STEP 2 Identify the goals of the study
Principal Study Questions ▪ How do measured physical characteristics of the sediment
support the assessment of sediment stability?
▪ What are the values of representative input parameters for the sediment transport model?
▪ What is the geomorphology of the river over its entire length?
▪ Using data obtained from this and DQO 2, how will sediment erosion and depositional mechanisms (including storm events and tidal influences) in the LPRSA affect the fate and transport of impacted sediment (e.g., will burial of contaminated sediment by new sediment impact the natural attenuation of the contaminated sediments)?
▪ How does the physical character of the sediment change throughout the river influence assumptions regarding dredge material handling, cap placement and in-situ stabilization?
▪ How does the relative stability or instability of sediments in the various geomorphologic segments of the Lower Passaic affect exposure concentrations, pathways, and routes for human and ecological receptors of concern?

Section: Attachments Revision: 1
Date: July 2008
Quality Assurance Project Plan Phase I RI Low Resolution Coring/Sediment Sampling Lower Passaic River Restoration Project Newark, New Jersey Page 3 of 18
J:\Water\ProjectFiles\P120\12182_Passaic\QAPP\Rev 1_July 2008\2008_Low Res Core QAPP_2008 July 18_Rev1_worksheets20-37_DQOs.doc
DQO Step
Data Quality Objective 1 (DQO 1): Develop Understanding of Physical Characteristics of Impacted Sediment Description
Program Goals Program goals for determining site physical characteristics were identified by EPA in the QAPP of August 2005, Attachment 1.1. The summary includes all media and data collection necessary for completion of the RI/FS. This sediment low resolution coring effort, fulfills a portion of these data requirements. This program will supplement the existing geotechnical data, which were used as the basis for the CSM, with a comprehensive data set that is collected synoptically throughout the LPRSA. Specifically this field effort will collect field data that will permit further assessment of the stability of the sediment, which includes the biologically active zone, over the entire main stem of the river and in the major tributaries, including the thalweg, shoals, and nearshore areas. Data collection will include analysis of:
▪ Radiochemistry (beryllium-7, cesium-137, lead-210, and potassium-40)
▪ Total organic carbon (TOC)
▪ Total sulfide
▪ Percent moisture
▪ Grain size
▪ Specific gravity
▪ Bulk density determined in field facility
▪ Atterberg Limits (using ASTM D4318) Alternative Actions The following alternative actions could result from resolution of the principal study questions:
▪ Confirm or revise the characterization of erosional and stable sediment, including location and extent as presented in the CSM, reconciling the most recent observations with those made in previous studies (i.e., historical core data, 2005 sediment texture map, and historical bathymetry data updated with the recent 2007 bathymetry data).
▪ Confirm or revise the geomorphological interpretations of river mile (RM) 1 to 7 based upon previous studies.
▪ Re-evaluate future potential risks to human health and the environment in the context of sediment stability concerns.

Section: Attachments Revision: 1
Date: July 2008
Quality Assurance Project Plan Phase I RI Low Resolution Coring/Sediment Sampling Lower Passaic River Restoration Project Newark, New Jersey Page 4 of 18
J:\Water\ProjectFiles\P120\12182_Passaic\QAPP\Rev 1_July 2008\2008_Low Res Core QAPP_2008 July 18_Rev1_worksheets20-37_DQOs.doc
DQO Step
Data Quality Objective 1 (DQO 1): Develop Understanding of Physical Characteristics of Impacted Sediment Description
Decision Statements on Physical Characteristics of Sediment ▪ If the sediment transport model can be successfully
calibrated and validated with the new data plus select historical data, then there is no need to evaluate the utility of collecting additional physical characteristics data.
▪ If multiple lines of evidence (i.e., sediment physical characteristics, radiodating, analysis of temporal bathymetry data, and comparison of chemical impacts with 1995 horizon) suggest a stable sediment (or depositional environment) bed, and other lines of evidence (e.g., Sediment Profile Imaging [SPI]) suggest that the biologically active zone and the nature and extent of deeper buried contaminants have been determined (via historical and current [via DQO 2] chemical evaluation), then no further coring will be conducted at this location.
▪ If multiple lines of evidence (i.e., sediment physical characteristics, radiodating, analysis of temporal bathymetry data, and comparison of chemical impacts with 1995 horizon) suggest an unstable sediment (or erosional environment) bed, then chemical concentration data will be reviewed to determine if further coring/sediment sampling is necessary in the area to define extent.
STEP 3 Identify the information inputs
Information required to answer the decision statement will include the existing field data and data to be obtained from the planned sampling events (See Step 5 of DQO 1), as summarized below. New Data Needed Low resolution coring, as required by Field Sampling Plan (FSP) 1 (EPA, 2005), will be implemented throughout RM 0 - 17, the tributaries, and above Dundee Dam to obtain physical characteristics data including, radiodating chemistry and physical parameters detailed below in Step 5. Surface grab samples will be used to assess the 0-1” interval for evidence of recent deposition using beryllium-7. Vibracoring and grab sampling will be utilized for collection of the 0-6” segment for all analytes. Deeper samples (greater than 6”) will be collected using vibracoring techniques, with analysis throughout the core to the red brown clay layer, sand, or refusal. In addition, at the request of EPA, at 8 locations, the top 2 feet of sediment will be further studied through finer segmentation of 5 layers with physical and chemical analyses. This finer segmentation sampling will be done with a box core device.

Section: Attachments Revision: 1
Date: July 2008
Quality Assurance Project Plan Phase I RI Low Resolution Coring/Sediment Sampling Lower Passaic River Restoration Project Newark, New Jersey Page 5 of 18
J:\Water\ProjectFiles\P120\12182_Passaic\QAPP\Rev 1_July 2008\2008_Low Res Core QAPP_2008 July 18_Rev1_worksheets20-37_DQOs.doc
DQO Step
Data Quality Objective 1 (DQO 1): Develop Understanding of Physical Characteristics of Impacted Sediment Description
Existing Field Data (to be Augmented) ▪ 1995 geotechnical cores collected by Tierra in RM 1 to 7
▪ 1995 piezocone data collected by Tierra in RM 1 to 7
▪ 1995 remedial investigation data collected by Tierra in RM 1 to 7
▪ 2005 geotechnical cores collected by EPA/Malcolm Pirnie, Inc.
▪ 2005 Malcolm Pirnie, Inc., grab samples for radioisotope analysis
▪ 2005 EPA/Malcolm Pirnie, Inc.., high resolution cores in RM 1 to 7
▪ 2005 EPA/Malcolm Pirnie, Inc., sediment stability samples
▪ 2006 EPA/Malcolm Pirnie, Inc., low resolution cores in RM 1 to 7
▪ 2008 EPA/Malcolm Pirnie, Inc., sediment cores (data not yet available)
▪ 2007 EPA/Malcolm Pirnie, Inc., Dundee Lake cores
▪ 2005 EPA beryllium-7 field reconnaissance in the Lower Passaic River
▪ 2005 EPA sediment texture maps (as interpreted by Aqua Survey, Inc. side-scan sonar) of the Lower Passaic River
▪ Historical bathymetric surveys from 2004, 2001, 1999, 1997, 1996, 1995, and 1989, as well as the 2007 bathymetric data
▪ Sediment probing data collected during the 2007/2008 field program
Existing Reports ▪ Malcolm Pirnie, Inc., 2007 Conceptual Site Model
▪ Malcolm Pirnie, Inc., 2006 Draft Geochemical Evaluation (Step 2)
▪ Malcolm Pirnie, Inc., 2007 Source Control Early Action Focused Feasibility Study
▪ Malcolm Pirnie, Inc., 2007/2008 Narratives for High Resolution Cores, Low Resolution Cores, Dundee Dam Coring

Section: Attachments Revision: 1
Date: July 2008
Quality Assurance Project Plan Phase I RI Low Resolution Coring/Sediment Sampling Lower Passaic River Restoration Project Newark, New Jersey Page 6 of 18
J:\Water\ProjectFiles\P120\12182_Passaic\QAPP\Rev 1_July 2008\2008_Low Res Core QAPP_2008 July 18_Rev1_worksheets20-37_DQOs.doc
DQO Step
Data Quality Objective 1 (DQO 1): Develop Understanding of Physical Characteristics of Impacted Sediment Description
STEP 4 Define the boundaries of the study
Geographic Area The LPRSA includes the 17-mile tidal reach of the Lower Passaic River from below the Dundee Dam (RM 17.4) to the confluence with Newark Bay (RM 0). The LPRSA also includes the tributaries to this reach (e.g., Saddle River, Second River, and Third River) and the unnamed creek. This phase of the low resolution coring program will include sampling within RM 0 to 17, the tributaries, the unnamed creek and Dundee Lake above the dam. Timeframe Data will be collected over an estimated 3-month period between July and October 2008. Sample Type Sampling intervals will include recently deposited surface sediment (0–1-inch sediment depth); surface sediment (0–6 inches); three, 1-foot sediment segments; and then 2-foot segments down to the red-brown clay layer, the sand, or refusal, with sampling for selected analytes in the red-brown sand layer where encountered.
STEP 5 Develop the analytical approach
Approach for Collecting Sediment Samples An initial grab sample will be collected at each station using a Ted-Young-modified Van Veen grab sampler (per Standard Operating Procedure [SOP] LPR-S-01). The grab sampling effort will collect surface sediment samples, defined as the interval from 0 to 6 inches below the sediment-water interface. In addition, a 0–1-inch sample will be collected from the Van Veen Grab for beryllium-7 analysis. Vibracoring will be used to collect both surface and deeper sediment samples (per SOP LPR-S-04). Longer cores will be sectioned as needed on the sampling vessel to ensure the cores are maintained upright during handling, transport, and storage. Sample processing and transfer to sample containers will be performed at the field facility. In addition, piston coring or push coring may be used, if more appropriate, based on sediment depths encountered (per SOP LPR-S-02). Lastly, a box coring device will be utilized to collect data within the top two feet for finer segmentation analysis for fate and transport modeling. Anticipated Analytical Methods for Sediment Cores The following lists the analytical methods for sediment sampling:

Section: Attachments Revision: 1
Date: July 2008
Quality Assurance Project Plan Phase I RI Low Resolution Coring/Sediment Sampling Lower Passaic River Restoration Project Newark, New Jersey Page 7 of 18
J:\Water\ProjectFiles\P120\12182_Passaic\QAPP\Rev 1_July 2008\2008_Low Res Core QAPP_2008 July 18_Rev1_worksheets20-37_DQOs.doc
DQO Step
Data Quality Objective 1 (DQO 1): Develop Understanding of Physical Characteristics of Impacted Sediment Description
▪ Radiochemistry (for beryllium-7, cesium-137, lead-210, and potassium-40) using DOE EML HASL-300/EPA Method 900
▪ TOC using the Lloyd Kahn Method
▪ Total sulfide using EPA Method 9030 mod.
▪ Percent moisture using ASTM Method D2974-07A
▪ Grain size using ASTM Method D422
▪ Specific gravity using ASTM Method D854
▪ Bulk density (method to be determined during field activity)
▪ Atterberg Limits using ASTM D4318 Project Quantification Limits The reporting limits are included in QAPP Worksheet #15. Quality Assurance/Quality Control Program (QA/QC) QA/QC samples will be analyzed with the sediment samples appropriate for each analytical test, such as field replicates, laboratory duplicates, lab control and matrix control spikes (optional), and performance samples. QAPP Worksheets # 12 and #28 provide performance criteria of these precision and accuracy measurements. Worksheet #20 provides frequency of field replicates and blanks. Data verification and validation protocols are detailed in Worksheets 34, 35, 36, and 37. QAPP Worksheet # 31provides auditing details for the program. Anticipated Data Evaluations ▪ Assessment of sediment grain size, texture, stability, and
biological habitat substrate;
▪ Sediment stability evaluation by location and with depth for identification of depositional and erosional zones;
▪ Sediment stability evaluation by location and with depth to compare to contaminant data identified in DQO 2;
▪ Sediment stability evaluation by location and with depth to compare with physical structures, dredge events, and shoreline conditions;
▪ Geomorphological interpretations to support the LPRSA CSM;
▪ Multivariate evaluation of physical data to look for patterns or trends in data;

Section: Attachments Revision: 1
Date: July 2008
Quality Assurance Project Plan Phase I RI Low Resolution Coring/Sediment Sampling Lower Passaic River Restoration Project Newark, New Jersey Page 8 of 18
J:\Water\ProjectFiles\P120\12182_Passaic\QAPP\Rev 1_July 2008\2008_Low Res Core QAPP_2008 July 18_Rev1_worksheets20-37_DQOs.doc
DQO Step
Data Quality Objective 1 (DQO 1): Develop Understanding of Physical Characteristics of Impacted Sediment Description
▪ Comparison of data with bathymetry changes;
▪ Assessment and grouping of geotechnical data with location and depth into similar properties for the FS;
▪ Input of data into the sediment transport model; STEP 6 Specify performance or acceptance criteria
Uncertainty is always present in the measurement and interpretation of environmental data. In this case, the focus is on collecting and interpreting data to understand the physical characteristics of the sediment in the LPRSA. In the absence of defined decision tolerance limits, the sampling design should still strive to identify possible sources of error and minimize them, to the extent practical. The most significant type of error that may be encountered includes that of sediment sampling. Both random and systematic errors can be introduced during the physical collection of the sample, sample handling, sample analysis, and data handling. Errors introduced through these steps will be controlled by preparing and following SOPs and establishing appropriate controls for data quality. These controls apply to field procedures (e.g., adherence to SOPs, field equipment calibration, and field duplicates), laboratory analytical errors (e.g., calibration standard, internal standard, surrogate recoveries, and laboratory control sample), and data validation. The QAPP worksheets provide further detail on error control procedures, both in the field and in the laboratory. Appendix B (Field SOPs) and Appendix C (Laboratory SOPs) provide supporting details. Sampling design error is the result of the inherent variability of the sampled population over space and time, the sample collection design, and the number of samples available upon which to base the decision. Because it is impossible to sample every inch of the LPRSA, there is always a possibility that some feature of the natural variability is missed. Sampling design error can increase the chance for misrepresenting the natural variability by random error (imprecision) or systematic error (bias) in sampling. Because the number of samples controls how well the sampled population (i.e., LPRSA sediment inventory) is characterized, use of the DQO process requires that the variability of data be understood to evaluate the trade off between uncertainty (confidence limit) and sampling intensity. In addition, as explained in this QAPP/FSP Addendum, the sampling plan includes the entire area of study in RM 0 to 17, contributing tributaries, and above Dundee Dam. This investigation is meant

Section: Attachments Revision: 1
Date: July 2008
Quality Assurance Project Plan Phase I RI Low Resolution Coring/Sediment Sampling Lower Passaic River Restoration Project Newark, New Jersey Page 9 of 18
J:\Water\ProjectFiles\P120\12182_Passaic\QAPP\Rev 1_July 2008\2008_Low Res Core QAPP_2008 July 18_Rev1_worksheets20-37_DQOs.doc
DQO Step
Data Quality Objective 1 (DQO 1): Develop Understanding of Physical Characteristics of Impacted Sediment Description to characterize the physical and chemical qualities of the LPR sediments using a small but robust data set of the LPR sediments. This data set has a characteristic natural variability that will be represented by this data set if all other sources of variability are minimized. By reducing the errors associated with samples collection handling, analyses, and reporting with the strict adherence and use of standardized and documented procedures, as well as the noting of deviations from these procedures, the induced variability of the data set is minimized and the data set is a better representation of the LPR sediments allowing, among other things, increased power in statistic testing and improved parameterization of numeric and empirical models.
STEP 7 Develop the detailed plan for obtaining data
Sediment Sampling in the Lower Passaic River The currently proposed sampling program will consist of:
▪ 115 sampling locations
▪ One sampling event (up to3 months of field work) to minimize temporal variability
At each location, collect one surface sediment grab sample using Ted-Young-modified Van Veen grab (SOP LPR-S-01). Samples will be collected to represent the surface sediment depth interval of 0–1 inch (for beryllium-7 only). Using vibracoring and sediment grab samples the 0–6 inch interval will be sampled. Samples should also have sufficient mass to analyze for the following suite of analytes:
▪ Radiochemistry (beryllium-7, cesium-137, lead-210, potassium-40)
▪ TOC
▪ Total sulfide
▪ Percent moisture
▪ Grain size
▪ Specific gravity
▪ Bulk density
▪ Atterberg Limits Two sediment cores using a vibracore will be obtained. Where more appropriate for field conditions, or a hand-held coring device, such as a piston-corer will be used. Each sediment core will be continuously analyzed in the following segments:

Section: Attachments Revision: 1
Date: July 2008
Quality Assurance Project Plan Phase I RI Low Resolution Coring/Sediment Sampling Lower Passaic River Restoration Project Newark, New Jersey Page 10 of 18
J:\Water\ProjectFiles\P120\12182_Passaic\QAPP\Rev 1_July 2008\2008_Low Res Core QAPP_2008 July 18_Rev1_worksheets20-37_DQOs.doc
DQO Step
Data Quality Objective 1 (DQO 1): Develop Understanding of Physical Characteristics of Impacted Sediment Description
▪ 0-6” segment (as described above)
▪ Three 1-foot segments followed by
▪ 2-foot segments to the red-brown clay layer, sand, or refusal
▪ Top portion of the red-brown sand layer, where encountered at the bottom of the core
Sample interval segments may vary to accommodate collection of distinctly different layers of sediment, as described in the QAPP/FSP Addendum attached to this QAPP. The second core will be a shorter core of up to 4 feet to obtain the necessary sample mass for the 1 foot segments.
The grab sampling effort will collect a surface sediment sample from 0 to 6 inches below the sediment-water interface. The surface sediment from the grab sampler will be utilized after the sediment sample mass from the vibracores has been exhausted. A prioritization of sample analytes is provided in Tables 3 and 4 of the FSP Addendum.
Samples will be analyzed for the above parameters, with the exception of beryllium-7, which is only proposed for surface sampling (0 – 6 in). Data evaluations will be performed to inform the completion of a Phase II RI Work Plan to comply with the requirements of FSP1 and FSP2. Please see the attached QAPP/FSP Addendum for further details.

Section: Attachments Revision: 1
Date: July 2008
Quality Assurance Project Plan Phase I RI Low Resolution Coring/Sediment Sampling Lower Passaic River Restoration Project Newark, New Jersey Page 11 of 18
J:\Water\ProjectFiles\P120\12182_Passaic\QAPP\Rev 1_July 2008\2008_Low Res Core QAPP_2008 July 18_Rev1_worksheets20-37_DQOs.doc
DQO Step
Data Quality Objective 2 (DQO 2): Characterize Nature and Extent of Contamination in Sediment within the Lower Passaic River Study Area (LPRSA) Description
STEP 1 State the problem
The nature and extent of contamination in the sediment must be understood (1) to permit an evaluation of all the sources of constituent loading to the LPRSA; (2) to assess the potential for environmental chemicals in sediment to pose a risk to human health and the environment; and 3) to support the requirements of the FS. The proposed low resolution core program will provide a comprehensive examination of the nature and extent of contamination in the sediment over the entire main stem of the river (RM 0 to 17); the thalweg, shoals, and nearshore areas; its major tributaries; and above Dundee Dam, collectively referred to as the LPRSA. Consistent with the requirements of the CERCLA RI/FS, this data set will be the first comprehensive synoptic data set of sediment contaminant nature and extent for the entire LPRSA that will have been collected within the same time period, using the same methods, and analyzing for the same parameters. The results will present a study-wide snapshot of the chemical characteristics of the sediment in these reaches, including the surface sediment, the biologically active zone, and, to the extent practical, the total vertical extent. The inclusion of the analysis of limited suite of Non- Hazardous Substance List (HSL) stressors including pathogens, will provide a study-wide snapshot of characteristics in surface sediment that impair biotic interaction in and on the sediment. This data will support both WRDA FS and restoration requirements and provide a characterization of the LPRSA baseline conditions to be reported in the RI/FS.
STEP 2 Identify the goals of the study
Principal Study Questions
▪ What is the nature and extent of the contamination in sediment in the LPRSA?
▪ How do the chemistry data compare to the previous chemical characterization data that were collected in the LPRSA (i.e., in 1995, 2005, and 2007/2008 sediment samples)?
▪ How do the chemistry data compare to screening level benchmarks for the protection of human health and the environment (This is specifically relevant to surficial sample intervals.)?
▪ What are the major sources and processes controlling chemical distribution in the sediment of the LPRSA?
▪ Using information gathered as part of DQO 1, is there any correlation between grain size, TOC, and chemical concentration/distribution in the LPRSA?
▪ Using information gathered as part of DQO 1, at what depth is sediment found to be stable and unlikely to mobilize chemical concentrations via erosional processes in the LPRSA?
▪ What non-HSL stressors that impact water quality are present and need to be understood in order to complete the WRDA FS and plan for restoration?
Program Goals Program goals for determining nature and extent of contamination were identified by EPA in the QAPP of August 2005, Attachment 1.1. The summary includes all media and

Section: Attachments Revision: 1
Date: July 2008
Quality Assurance Project Plan Phase I RI Low Resolution Coring/Sediment Sampling Lower Passaic River Restoration Project Newark, New Jersey Page 12 of 18
J:\Water\ProjectFiles\P120\12182_Passaic\QAPP\Rev 1_July 2008\2008_Low Res Core QAPP_2008 July 18_Rev1_worksheets20-37_DQOs.doc
DQO Step
Data Quality Objective 2 (DQO 2): Characterize Nature and Extent of Contamination in Sediment within the Lower Passaic River Study Area (LPRSA) Description data collection necessary for completion of the RI/FS. This sediment low resolution coring effort fulfills a portion of these data requirements. This program will supplement the existing sediment chemistry data (contaminant and radioisotope concentration data), which were used as the basis for the CSM, with a comprehensive synoptic contaminant chemistry of LPRSA sediment. Specifically in this field effort, field data will be collected to:
▪ Further assess the types of chemicals that are present, the concentrations of those chemicals, the vertical and horizontal extent of impacts within the sediment (the entire length of the river and between river banks based on distribution of sediment grain size), the co-occurrence of those chemicals, and the potential source and timing of impacts
▪ Provide additional information regarding the sediment deposition history in RM 1 to 7 since 1995, which was the last time the sediment column of the Lower Passaic River was systematically and comprehensively documented
▪ Assess human health and ecological risk in accordance with EPA Risk Assessment guidance and AOC/SOW requirements
▪ Provide information regarding background conditions associated with non-HSL stressors, including pathogens, in surface sediment for the WRDA FS restoration planning and will be reported in the RI/FS
▪ Investigate the potential relationships between the sediment contaminants concentrations and the physical characteristics of the sediment
▪ Further the conceptual understanding of where contaminants might be found in the LPRSA, their potential to be bioavailable, their association with stable sediment, and the likelihood that they will be transported throughout the system
All samples will be analyzed for: ▪ TAL metals and titanium ▪ TCL VOCs ▪ SVOCs ▪ PAHs and alkyl PAHs ▪ PCBs (homologs, congeners, and aroclors) ▪ Dioxins/furans ▪ Organochlorine pesticides ▪ Chlorinated herbicides ▪ TPHs (extractable) ▪ Butyltins ▪ Mercury (low-level) ▪ Cyanide

Section: Attachments Revision: 1
Date: July 2008
Quality Assurance Project Plan Phase I RI Low Resolution Coring/Sediment Sampling Lower Passaic River Restoration Project Newark, New Jersey Page 13 of 18
J:\Water\ProjectFiles\P120\12182_Passaic\QAPP\Rev 1_July 2008\2008_Low Res Core QAPP_2008 July 18_Rev1_worksheets20-37_DQOs.doc
DQO Step
Data Quality Objective 2 (DQO 2): Characterize Nature and Extent of Contamination in Sediment within the Lower Passaic River Study Area (LPRSA) Description
Thirteen samples, identified in QAPP Worksheets #18 and #28, will be analyzed for:
▪ TPHs (purgeable)
▪ Methyl mercury
▪ Hexavalent chromium
▪ AVS and SEM
▪ Phosphorus (total)
▪ Total Kjeldahl Nitrogen
▪ Ammonia as N
▪ E. Coli
▪ Giardia Up to seven samples, identified in QAPP Worksheet #18 and #28, will be analyzed for:
▪ Additional size-density classification, microscopy, and petrography
▪ PCB sediment-water partitioning Alternative Actions The following alternative actions could result from resolution of the principal study questions:
▪ Confirm or revise the assessment of the nature and extent of contamination in the recently deposited sediment (1995 to present), which includes the biologically active zone, as presented in the CSM, reconciling the most recent observations with those made in previous studies (i.e., 1995, 2005, and 2007/2008 sediment samples).
▪ Focus the risk assessment sampling program relative to the refined understanding of the nature and extent of contamination and the potential for contaminants to be bioavailable via data generated through this effort.
▪ Focus the sampling program relative to expanding the understanding of pathogens and their contribution to background conditions in the study area.
▪ Additional collection of sediment quality data may be required as a result of this program to further resolve the nature and extent of contaminated sediment in the LPRSA.
Decision Statements on Nature and Extent of Contamination in Sediment ▪ If multiple lines of evidence (i.e., sediment physical characteristics [DQO 1],
radiodating, analysis of temporal bathymetry data, and comparison of contaminant impacts with 1995 horizon) suggest a stable sediment (or depositional environment) bed, and other lines of evidence (e.g., SPI) suggest that the biologically active zone and the nature and extent of deeper buried contaminants have been determined (via historical and current chemical evaluation), then no further coring will be conducted at this location.

Section: Attachments Revision: 1
Date: July 2008
Quality Assurance Project Plan Phase I RI Low Resolution Coring/Sediment Sampling Lower Passaic River Restoration Project Newark, New Jersey Page 14 of 18
J:\Water\ProjectFiles\P120\12182_Passaic\QAPP\Rev 1_July 2008\2008_Low Res Core QAPP_2008 July 18_Rev1_worksheets20-37_DQOs.doc
DQO Step
Data Quality Objective 2 (DQO 2): Characterize Nature and Extent of Contamination in Sediment within the Lower Passaic River Study Area (LPRSA) Description
▪ If multiple lines of evidence (i.e., sediment physical characteristics [DQO 1], radiodating, analysis of temporal bathymetry data, and comparison of contaminant impacts with 1995 horizon) suggest an unstable sediment (or erosional environment) bed, then chemical concentration data will be reviewed to determine if further coring/sediment sampling is necessary in the area to define extent.
▪ If sufficient data are collected to characterize internal and external sources and loads, to calibrate the sediment transport models and chemical fate transport; then the need for additional data collection will not be necessary.
▪ If following evaluation of chemical concentrations (from this event as well as other RI sampling events) through geostatistical analysis, along with sediment type data from geotechnical and geophysical surveys, the extent of contaminated sediment exceeding the project-specific action levels (to be determined) can be established, then the need for further data collection will not be necessary. This data along with all other data collected in the RI will be reported to EPA.
STEP 3 Identify the information inputs
Information required to answer the decision statement will include the existing field data and data to be obtained from the planned sampling event, as well as future RI scopes of work (See Step 5 of DQO 2). New Data Needed Low resolution coring as required by FSP 1 (EPA, 2005), will be implemented throughout RM 0-17, the tributaries, and above Dundee Dam to characterize the nature and extent of impacts and determine potential sources including extensive chemistry data collection as detailed below in Step 5. Vibracoring and surface grab sampling will be used to assess the 0-6” segment for all analytes. Deeper samples (greater than 6”) will be collected using vibracoring techniques, with analysis throughout the core to the red brown clay layer, sand, or refusal. In addition, at the request of EPA, at 8 locations, the top 2 feet of sediment will be further studied through finer segmentation of 5 layers with physical and chemical analyses. This finer segmentation sampling will be done with a box core device. Existing Field Data (to be Augmented) ▪ 2005 EPA/Malcolm Pirnie, Inc., high resolution cores in RM 1 to 7
▪ 2005 EPA/Malcolm Pirnie, Inc., sediment stability samples
▪ 2006 EPA/Malcolm Pirnie, Inc., low resolution cores in RM 1 to 7
▪ 2007 EPA/Malcolm Pirnie, Inc., Dundee Lake cores
▪ 2005 Tierra Solutions, Inc., remedial investigation phase 1 program in Newark Bay
▪ 1995 Tierra Solutions, Inc., remedial investigation data
▪ 2008 Malcolm Pirnie, Inc., sediment coring program (data not available yet) Existing Reports ▪ Malcolm Pirnie, Inc., 2007 Conceptual Site Model

Section: Attachments Revision: 1
Date: July 2008
Quality Assurance Project Plan Phase I RI Low Resolution Coring/Sediment Sampling Lower Passaic River Restoration Project Newark, New Jersey Page 15 of 18
J:\Water\ProjectFiles\P120\12182_Passaic\QAPP\Rev 1_July 2008\2008_Low Res Core QAPP_2008 July 18_Rev1_worksheets20-37_DQOs.doc
DQO Step
Data Quality Objective 2 (DQO 2): Characterize Nature and Extent of Contamination in Sediment within the Lower Passaic River Study Area (LPRSA) Description
▪ Malcolm Pirnie, Inc., 2006 Draft Geochemical Evaluation (Step 2)
▪ Malcolm Pirnie, Inc., 2007 Source Control Early Action Focused Feasibility Study
▪ Malcolm Pirnie, Inc., 2007/2008 Narratives for High Resolution Cores, Low Resolution Cores, Dundee Dam Coring
STEP 4 Define the boundaries of the study
Geographic Area The LPRSA includes the 17-mile tidal reach of the Lower Passaic River from below the Dundee Dam (RM 17.4) to the confluence with Newark Bay (RM 0). The LPRSA also includes the tributaries to this reach (e.g., Saddle River, Second River, Third River, and an unnamed tributary). This phase of the low resolution coring program will include sampling within RM 0 to 17, the tributaries, and Dundee Lake above the dam. Timeframe Data will be collected over an estimated 3-month period between July and October 2008. Sample Type Sampling intervals will include surface sediment (0–6 inches); three 1-foot segment intervals; and then 2-foot segment intervals to the red-brown clay layer, sand, or refusal. The upper portion of the red-brown sand layer will be sampled where it is encountered at the bottom of the core..
STEP 5 Develop the analytical approach
Approach for Collecting Sediment Samples An initial grab sample will be collected at each station using a Ted-Young-modified Van Veen grab (SOP LPR-S-01). The grab sampling effort will collect a surface sediment sample, defined as the sequence from 0 to 6 inches below the sediment-water interface. Vibracoring will be used to collect the shallow (0-6”) and deeper sediment samples (per SOP LPR-S-03). Longer cores will be sectioned as needed on the sampling vessel to ensure that the cores are maintained upright during handling, transport, and storage. Sample processing and transfer to sample containers will be performed at the field facility. In addition, piston coring or push coring may be used, if more appropriate, based on sediment depths encountered (per SOP LPR-S-02). Lastly, a box coring device will be utilized to collect data within the top two feet for finer segmentation analysis for fate and transport modeling. Anticipated Analytical Methods for Sediment Cores The following lists the analytical methods for all sediment samples: ▪ TAL metals and titanium using EPA Method 6010B/6020A/7471A ▪ TCL VOCs using EPA Method 8260B ▪ SVOCs using EPA Method 8270C ▪ PAHs and alkyl PAHs using HRGC/LRMS-SIM ▪ PCBs (homologs and congeners) using EPA Method 1668A ▪ PCBs (aroclors) using EPA Method 8082

Section: Attachments Revision: 1
Date: July 2008
Quality Assurance Project Plan Phase I RI Low Resolution Coring/Sediment Sampling Lower Passaic River Restoration Project Newark, New Jersey Page 16 of 18
J:\Water\ProjectFiles\P120\12182_Passaic\QAPP\Rev 1_July 2008\2008_Low Res Core QAPP_2008 July 18_Rev1_worksheets20-37_DQOs.doc
DQO Step
Data Quality Objective 2 (DQO 2): Characterize Nature and Extent of Contamination in Sediment within the Lower Passaic River Study Area (LPRSA) Description
▪ Dioxins/furans using EPA Method 1613B ▪ Organochlorine pesticides using EPA Method 8081A ▪ Organochlorine pesticides using HRGC/HRMS ▪ Chlorinated herbicides using EPA Method 8151A ▪ TPHs (extractable) using NJDEP Method OQA-QAM-025-02/08 ▪ Butyltins using EPA Method 8270 mod. or NOAA 130 ▪ Mercury, low-level using EPA Method 1631 ▪ Cyanide using EPA Method 9010C/9014 The following lists the analytical methods for 13 sediment samples only: ▪ TPHs (purgeable) using EPA Method 8015B ▪ Methyl mercury using EPA Method 1630 mod. ▪ Hexavalent chromium using EPA Method 7199/3060A ▪ AVS and SEM using EPA Methods 821R91100, 6010C/6020 ▪ Phosphate (total) and orthophosphate (total) using EPA Method 365.2 modified ▪ Total Kjeldahl Nitrogen using ASTM D3590-89-02 ▪ Ammonia as N using EPA 350.1 ▪ E. Coli using SM9223B with modifications ▪ Giardia using EPA Method 1623 modified The following lists the analytical methods for up to seven sediment samples only:
▪ Additional size-density classification, microscopy and petrography using University of Maryland ASTM D2797, D2798, D2799
▪ PCB sediment-water partitioning using EPA Method 1668A
Project Quantification Limits The reporting limits are included in QAPP Worksheet #15. Quality Assurance/Quality Control Program (QA/QC) QA/QC samples will be analyzed with the sediment samples appropriate for each analytical test such as field duplicates, laboratory duplicates, lab control and matrix control spikes (optional), and performance samples. QA/QC samples will be analyzed with the sediment samples appropriate for each analytical test, such as field replicates, laboratory duplicates, lab control and matrix control spikes (optional), and performance samples. QAPP Worksheets #12 and #28 provide performance criteria of these precision and accuracy measurements. Worksheet #20 provides frequency of field replicates and blanks. Data verification and validation protocols are detailed in Worksheets 34, 35, 36, and 37. QAPP Worksheet # 31 provides auditing details for the program.

Section: Attachments Revision: 1
Date: July 2008
Quality Assurance Project Plan Phase I RI Low Resolution Coring/Sediment Sampling Lower Passaic River Restoration Project Newark, New Jersey Page 17 of 18
J:\Water\ProjectFiles\P120\12182_Passaic\QAPP\Rev 1_July 2008\2008_Low Res Core QAPP_2008 July 18_Rev1_worksheets20-37_DQOs.doc
DQO Step
Data Quality Objective 2 (DQO 2): Characterize Nature and Extent of Contamination in Sediment within the Lower Passaic River Study Area (LPRSA) Description
Anticipated Data Evaluations ▪ Evaluation and determination of current inventory of contaminant concentration for
determination of nature and extent and input into risk assessment, modeling, and the feasibility study
▪ Evaluation of potential contaminant contribution to Newark Bay ▪ Comparison of the analyte patterns (finger printing) in sediment ▪ Comparison of analyte ratios between existing data and new data for
characterization of nature and extent of contamination ▪ Evaluation of the potential for natural attenuation of detected chemicals using the
results of a geochemical evaluation of data, information from a literature research, and calibrated model output
▪ Evaluation and use of contaminant sediment loads, discharges, and other sources of external input to calibrate and validate the sediment transport and chemical fate and transport models inform the sediment transport and chemical fate and transport models.
▪ Evaluation of data in risk assessment context to help inform future risk assessment sampling and analysis activities
▪ Evaluation of sediment quality impacts by non-HSL stressors to support the WRDA FS and restoration planning
STEP 6 Specify performance or acceptance criteria
Uncertainty is always present in the measurement and interpretation of environmental data. In this case, the focus is on collecting and interpreting data to better characterize the nature and extent of chemicals of potential concern (COPCs) including identification of potential sources. In the absence of defined decision tolerance limits, the sampling design should still strive to identify possible sources of error and minimize them, to the extent practical. The most significant type of error that may be encountered includes that of sediment sampling. Both random and systematic errors can be introduced during the physical collection of the sample, sample handling, sample analysis, and data handling. Errors introduced through these steps will be controlled by preparing and following SOPs, and establishing appropriate controls for data quality. These controls apply to field procedures (e.g., adherence to SOPs, field equipment calibration, and field duplicates), laboratory analytical errors (e.g., calibration standard, internal standard, surrogate recoveries, and laboratory control samples), and data validation. The QAPP Worksheets provide further detail on error control procedures, both in the field and in the laboratory. Appendix B (Field SOPs) and Appendix C (Laboratory SOPs) provide supporting details. Sampling design error is the result of the inherent variability of the sampled population over space and time, the sample collection design, and the number of samples available upon which to base the decision. Because it is impossible to sample every inch of the LPRSA, there is always a possibility that some feature of the natural variability is missed. Sampling design error can increase the chance for misrepresenting the natural variability by random error (imprecision) or systematic error (bias) in sampling.

Section: Attachments Revision: 1
Date: July 2008
Quality Assurance Project Plan Phase I RI Low Resolution Coring/Sediment Sampling Lower Passaic River Restoration Project Newark, New Jersey Page 18 of 18
J:\Water\ProjectFiles\P120\12182_Passaic\QAPP\Rev 1_July 2008\2008_Low Res Core QAPP_2008 July 18_Rev1_worksheets20-37_DQOs.doc
DQO Step
Data Quality Objective 2 (DQO 2): Characterize Nature and Extent of Contamination in Sediment within the Lower Passaic River Study Area (LPRSA) Description
Because the number of samples controls how well the sampled population (i.e., LPRSA sediment inventory) is characterized, use of the DQO process requires that the variability of data be understood to evaluate the trade off between uncertainty (confidence limit) and sampling intensity. In addition, as explained in this QAPP/FSP Addendum, the sampling plan includes the entire area of study in RM 0 to 17, contributing tributaries, and above Dundee Dam. This investigation is meant to characterize the physical and chemical qualities of the LPR sediments using a small but robust data set of the LPR sediments. This data set has a characteristic natural variability that will be represented by this data set if all other sources of variability are minimized. By reducing the errors associated with samples collection handling, analyses, and reporting with the strict adherence and use of standardized and documented procedures, as well as the noting of deviations from these procedures, the induced variability of the data set is minimized and the data set is a better representation of the LPR sediments, allowing, among other things, increased power in statistical testing and improved parameterization of numeric and empirical models.
STEP 7 Develop the detailed plan for obtaining data
Sediment Sampling in the LPRSA The currently proposed sampling program will consist of:
▪ 115 sampling locations
▪ One sampling event (up to three months of field work) to minimize temporal variability
Using vibracoring and sediment grab samples the 0–6 inch interval will be sampled. Samples should also have sufficient mass to analyze for an extensive set of chemical target analytes, as shown in QAPP Worksheet #15 and listed above in Step 5. Two sediment cores using a vibracore will be obtained. Where more appropriate for field conditions, or a hand-held coring device, such as a piston-corer will be used. Each sediment core will be continuously analyzed in the following segments: ▪ 0-6” interval ▪ Three 1-foot segments followed by ▪ 2-foot segments to the red-brown clay layer, sand, or refusal ▪ The top of the re-brown sand layer, where encountered for a subset of analytes Sample interval segments may vary to accommodate collection of distinctly different layers of sediment, as described in QAPP/FSP Addendum. The second core will likely be a shorter core of up to 4 feet to obtain the necessary sample mass for the 1 foot segments. The grab sampling effort will collect a surface sediment sample from 0 to 6 inches below the sediment-water interface. The surface sediment from the grab sampler will be utilized after the sediment sample mass from the vibracores has been exhausted. A prioritization of sample analytes is provided in Tables 3 and 4 of the FSP Addendum. Data evaluations will be performed to inform the completion of a Phase II RI Work Plan to comply with the requirements of FSP1 and FSP2. Please see the attached QAPP/FSP Addendum for further details.