Revised Ariki Phase 2 Final Without Article
26
Te Ariki professional values for school development Final Report from the online survey trial for the Te Ariki Trust Dr Susan Lovett, University of Canterbury
Transcript of Revised Ariki Phase 2 Final Without Article

Te Ariki professional values for school development
Final Report from the online survey trial for the Te Ariki Trust
Dr Susan Lovett, University of Canterbury

i
Dr Susan Lovett Associate Professor in Educational Leadership
School of Educational Studies & Leadership
University of Canterbury
Christchurch
New Zealand
Email: [email protected]
This is the final report to meet the reporting requirements as
specified in the contract.
January 2018

ii
List of figures & tables
Figures
Figure 1: Means for sample school compared with regional means across items for all professional
values
Tables
Table 1: Regional responses to the value ‘Professional Discretion’
Table 2: Regional responses to the value ‘Collegial Obligation’
Table 3: Regional responses to the value ‘Reflective Inquiry & Discourse’
Table 4: Regional responses to the value ‘Evidence-based Professional Practice’
Table 5: Regional means, standard deviations & variance for ‘Professional Discretion’
Table 6: Regional means, standard deviations & variance for ‘Collegial Obligation’
Table 7: Regional means, standard deviations & variance for ‘Reflective Inquiry & Discourse’
Table 8: Regional means, standard deviations & variance for ‘Evidence-based Professional Practice’
Table 9: ‘Professional discretion’ in tabular form showing percentages for the sample school
Table 10: ‘Collegial Obligation’ in tabular form showing percentages for the sample school
Table 11: ‘Reflective Inquiry & Discourse’ in tabular form showing percentages for the sample school
Table 12: ‘Evidence-based Professional Practice’ in tabular form showing percentages for the sample
school
Table 13: Disciplined dialogue discussion example
Table of Contents
Acknowledgement .................................................................................................................................. 4
Purpose ................................................................................................................................................... 4
Process .................................................................................................................................................... 5
The survey tool........................................................................................................................................ 6
Suggested strategies for interpreting and using the data ...................................................................... 6
Results for the trial region ...................................................................................................................... 8
Value 1: Professional Discretion ......................................................................................................... 8
Value 2: Collegial Obligation ............................................................................................................... 9
Value 3: Reflective Inquiry and Discourse ........................................................................................ 10
Value 4: Evidence-based Professional Practice ................................................................................ 11
The means and distribution for regional responses ............................................................................. 11
Means and distribution for Value 1: Professional Discretion ........................................................... 12
Means and distribution for Value 2: Collegial Obligation ................................................................. 12
Means and distribution for Value 3: Reflective Inquiry and Discourse ............................................ 13
Means and distribution for Value 4: Evidence-based Professional Practice .................................... 13
Individual school reports ...................................................................................................................... 14
Sample school results ....................................................................................................................... 14
Suggested changes resulting from the trial .......................................................................................... 19
Conclusion to the trial ........................................................................................................................... 20
References ............................................................................................................................................ 21
Appendix 1: email introducing the survey ............................................................................................ 22
Appendix 2: Online survey tool: Professional values for school development .................................... 23

4
Final Report
Online survey trial: Te Ariki professional values for school development
Acknowledgement
This research report builds on the legacy of David Stewart’s work in the leadership
development of New Zealand primary school principals. The four professional values, the
focus of this report, can be directly attributed to David’s lifetime work which was about
furthering the ways in which school leaders could develop teachers as reflective
professional practitioners working within collaborative school cultures to meet students’
learning needs in the classroom. David viewed education first and foremost as an
intellectual activity enhanced when teachers and school leaders conversed about puzzles of
practice and came together as learners. The development of an online survey tool derived
from these four professional values resonates with the way David reached out to the
teaching profession to foster collaborative ways of working. His outreach included face to
face as well as online interactions so it is fitting that the recent development and trial of an
online survey tool continues that intent.
Purpose
The University of Canterbury was commissioned and funded by the Te Ariki Trust, supported
by the New Zealand Educational Institute (NZEI) and the New Zealand Principals’ Federation
(NZPF) to develop and trial a professional values survey tool for schools. The Trust’s Board
deemed the development of such a survey a timely initiative for providing a possible view of
the readiness of schools and/or Communities of Learners contemplating new initiatives. The
regional trial of the online survey provided an opportunity to ascertain whether schools
would find the tool helpful in determining some of the enabling actions or latent barriers to
the implementation of change initiatives. The trial was limited to one New Zealand
geographical region. It was anticipated that the trial outcomes would help the Trust decide
whether there may be a future in continuing to offer an online survey service to schools and
if so, how this might be arranged.
The survey tool was developed from the results of a previously commissioned research and
scholarly literature review relevant to the Te Ariki Trust’s four values (Lovett, 2016). The
development of such a tool online was deemed to be the next logical step in the Trust’s
work to promote wider dissemination of its values. It was expected that principals and
school staff completing the survey would be able to compare their own results with those of
others as a prompt for staffroom discussion and the planning of development steps.

5
Process
The trial survey tool was approved for use by the University of Canterbury Educational
Research Human Ethics Committee. Its design was led by Associate Professor Susan Lovett
who distilled 6-7 statements to support each of the trust’s four professional values from the
literature review mentioned above. These 27 statements in all covered the review’s
synthesis of key points. The statements were then reframed as survey items for respondents
to rate on a four point Likert scale (to a great, moderate, slight or no extent). John
Boereboom, from the University of Canterbury’s Centre for Evaluation and Monitoring (CEM
Centre) provided assistance in getting the survey uploaded for schools to access using the
Qualtrix programme. Results from all schools were later aggregated to form a regional
report and confidential electronic reports in graphic and tabular form were returned to each
of the participating schools.
Email communications were sent to the principals of Year 1-8 primary schools from the
Ministry of Education’s database. A total of 123 schools received this communication. Two
reminder emails were sent to all schools. One of these reminders was per favour of the
regional Primary Principals’ Association in its weekly email tree.
A total of 17 schools responded in the two week survey window. The total number of
teacher respondents was 59. The principals of these schools were asked to circulate the
email invitation with the survey link to all staff. Respondents were asked to name their
employing schools on the questionnaire to enable the results to be sorted by school and a
school report to be collated, 47 respondents provided their schools’ names whilst a further
12 were anonymous. Twelve schools sent in one response each, one school returned 3
responses, two schools returned 9 responses and a further school returned 14 responses.
Prior to the survey being sent to the schools, two principals outside the subject region were
invited to complete the questionnaire and provide their comments about the instructions,
ease of completion, and wording of the items. One of these principals said, “It is clear and
will be easily followed by teachers and school leaders”. That principal noted a particular
challenge associated with the tool’s completion saying it would be difficult “to make a single
judgement that describes my school or my staff, given that we have people at all parts of
the continuum on these indicators”. However, having said that, he also added, “having to do
that is in itself a useful checkpoint”. The difficult judgement to which the principal was
referring was caused by the stem for each of the values which asked, ‘to what extent does
the staff of this school’… The second principal who provided feedback was enthusiastic
about the possibilities of the survey, saying it was easy to follow and took just 10 minutes
completion time. That principal’s only suggestion was about checking the meaning of the
wording of the first value, ‘Professional Discretion’, intimating that it was not as clear as the

6
wording for the other values. This comment was not a surprise. It confirmed the earlier
difficulty encountered when undertaking the commissioned literature review for the first of
the Trust’s four values. Whilst the terms collegiality, collaboration, trust, reflection, inquiry
and evidence-based practice were widely used, it seemed that professional discretion was
not a term principals typically employed in their everyday work. The information letter and
layout of the survey were also discussed with Lyn Bird from the Te Ariki Trust before they
were finalised. It was agreed not to randomise the survey items so as to make it clear to
which values the items related.
The survey tool
The Te Ariki Trust’s four professional values were confirmed in the literature review as
central to the processes required to underpin collective commitment to learning and
development. The four values are:
Value No. 1: Professional Discretion means acting professionally to ensure the work being
done is in the interests of students and their learning, no matter the pressures being faced;
Value No. 2: Collegial Obligation recognises that collective meanings of practice matter and
are formed by working with colleagues;
Value No. 3: Reflective Inquiry and Discourse encourage processes which depend on trusting
relationships and opportunities to co-construct meaning; and
Value No. 4: Evidence-based Professional Practice is about having robust data sources to
inform teaching and learning.
Suggested strategies for interpreting and using the data
The layout of the survey’s questionnaire was deliberately presented with a single Likert
scale and generic item stem: ‘to what extent does the staff of this school’ …. Other options
considered were, ‘to what extent does the principal…’ and ‘to what extent as a teacher, do
you personally …’. After consideration it seemed sensible to have one survey link in the
invitational email which would serve both teachers and principals.
Dempster et al. (2017) argue for the importance of schools adopting a consistent process for
interrogating data. To this end, we returned data in graphic and tabular formats to each of
the schools with personalised reports outlining an analytical process to follow as principals
and teachers interrogated the data. Dempster et al. (2017) suggest that the process of
interpreting data “is the professional starting point for improvement action on children’s
[learning]” (p.39). Time spent interpreting data together is important if schools are to take
collective responsibility for changing practice.

7
The notion of professionals knowing why they and their colleagues have responded in
particular ways to nominated issues is critical if they are to collaborate and develop school-
wide commitment to improving student learning and achievement. This is where the Trust’s
four professional values as a unit, resonate with Eraut’s (1994) description of essential
actions undertaken by professionals, which he refers to as tenets. The first of these tenets is
expressed in terms of the moral commitment to improvement, serving the interests of
students as learners. He follows this with the acceptance of the need to self-monitor, review
the effectiveness of one’s practices, extend repertoires and reflect on experiences in order
to develop expertise. Dempster et al. (2017) maintain, “those who accept their professional
obligations contribute to the quality of their organization and to discussions on the changing
role of their profession in wider society” (p.40). This is precisely why gathering attitudinal
data about professional values in action is needed but as Dempster et al. caution, such data
must be credible and robust as this “provides the basis for evidence-informed practice”
(p.40).
The term ‘disciplined dialogue’ (Swaffield & Dempster, 2009) joins other descriptions of
professional conversations in the workplace. For example, peer conversations (Timperley,
2015), problem encounters (Robinson & Timperley, 2007), constructive problem talk
(Robinson & Timperley, 2007), and professional learning conversations (Danielson, 2009;
Earl & Timperley, 2009) are widely used.
Disciplined dialogue, a term coined by Swaffield and Dempster (2009), signals the need to
be disciplined about data collection, followed by a commitment to improvement and
realising the conditions which support learning. Dempster et al. (2017) maintain “the nexus
between dialogue and moral purpose is shown to be pivotal to the pedagogical power of
professional conversations” (p.43).The three disciplined dialogue questions are:
1. What do we see in these data?
2. Why are we seeing what we are?
3. What, if anything, should we be doing about it? (Dempster et al, 2017, p.44).
The first of these disciplined dialogue questions seeks a descriptive answer. When asking
what is seen, the temptation is often to make assumptions or jump to explanations and
conclusions. In disciplined dialogue, the first step is “to get a clear picture of “what is” …
[because this provides] a concrete understanding of present reality” (p.45). This means
being deliberate, systematic and disciplined in the way the data are interrogated, which for
tabulated quantitative data, means looking at each cell, row, column and then by totals to
crystallise key findings. Doing so, opens up the realm of subsidiary questions – eg. examining
aspects such as gender, age or experience differences if such personal information is part of
the data gathering process.
The second question helps teachers and leaders explore the reasons why things are
happening as they are. This is where Dempster et al. (2017) suggest that knowledge of the

8
school context is important as multiple reasons are contemplated and a sorting process
begins to determine which explanations are the most credible.
The third and remaining question is about what, if any, action might be required. This, like
the previous question, relies on “knowledge of the local context, staff capacities in the
matters discussed and the school’s available resources” (Dempster et al., 2017, p.46).
Results for the trial region
The results for each professional value are now presented to provide an overview of how all
schools and teachers in the trial region responded.
Value 1: Professional Discretion
Data are presented in Table 1 for the first of the Trust’s values, ‘Professional Discretion’.
Table 1: Regional responses to the value ‘Professional Discretion’
Item Number
Value 1: ‘Professional Discretion’ To a great extent
To a moderate extent
To a slight extent
Not at all
1.1 Stick to the moral obligation to improve students’ learning no matter the pressures
89.83% 10.17% 0.00% 0.00%
1.2 Adopt a continuous improvement mindset for teaching practice
71.19% 28.81% 0.00% 0.00%
1.3
Take opportunities to deepen professional practice through partnerships or networks within and beyond the school
45.76% 42.37% 11.86% 0.00%
1.4 Create opportunities for teachers to lead
55.93% 32.20% 10.17% 1.69%
1.5 Accept that those new to leadership work need to be supported
50.85% 33.90% 11.86% 3.39%
1.6 Realise that collegial sharing provides new insights to practice
77.97% 18.64% 3.39% 0.00%
1.7 Collect and act on data to inform next steps
67.80% 28.81% 3.39% 0.00%
In percentage format, it is easy to see precisely where the responses cluster. For example, in
Item 1.1 (Stick to the moral obligation to improve students’ learning no matter the
pressures), the results of 89.83% ‘to a great extent’ and 10.17% ‘to moderate extent’ show
this is a value which is deeply embedded in teachers’ work. Likewise, Item 1.6, indicates that
collegial sharing is highly valued with 77.97% rating it ‘to a great extent’. The result for Item
3 relating to learning through partnerships and other networks was not as clear cut. This
had a more even split between ‘to a great extent’ and ‘to a moderate extent’. Two items
describing leadership by teachers (Items 1.4 & 1.5) suggest that the respondents want more
opportunities and support for leadership work. This is a matter which would warrant further
consideration.
9
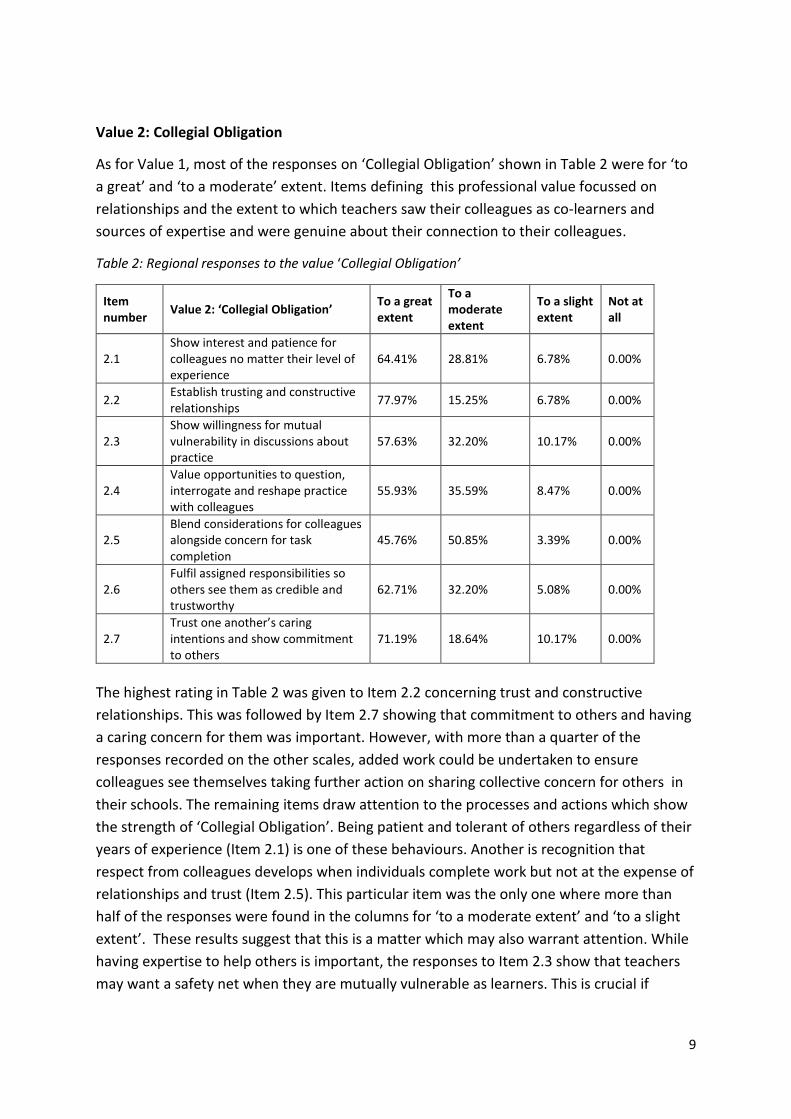
Value 2: Collegial Obligation
As for Value 1, most of the responses on ‘Collegial Obligation’ shown in Table 2 were for ‘to
a great’ and ‘to a moderate’ extent. Items defining this professional value focussed on
relationships and the extent to which teachers saw their colleagues as co-learners and
sources of expertise and were genuine about their connection to their colleagues.
Table 2: Regional responses to the value ‘Collegial Obligation’
Item number
Value 2: ‘Collegial Obligation’ To a great extent
To a moderate extent
To a slight extent
Not at all
2.1 Show interest and patience for colleagues no matter their level of experience
64.41% 28.81% 6.78% 0.00%
2.2 Establish trusting and constructive relationships
77.97% 15.25% 6.78% 0.00%
2.3 Show willingness for mutual vulnerability in discussions about practice
57.63% 32.20% 10.17% 0.00%
2.4 Value opportunities to question, interrogate and reshape practice with colleagues
55.93% 35.59% 8.47% 0.00%
2.5 Blend considerations for colleagues alongside concern for task completion
45.76% 50.85% 3.39% 0.00%
2.6 Fulfil assigned responsibilities so others see them as credible and trustworthy
62.71% 32.20% 5.08% 0.00%
2.7 Trust one another’s caring intentions and show commitment to others
71.19% 18.64% 10.17% 0.00%
The highest rating in Table 2 was given to Item 2.2 concerning trust and constructive
relationships. This was followed by Item 2.7 showing that commitment to others and having
a caring concern for them was important. However, with more than a quarter of the
responses recorded on the other scales, added work could be undertaken to ensure
colleagues see themselves taking further action on sharing collective concern for others in
their schools. The remaining items draw attention to the processes and actions which show
the strength of ‘Collegial Obligation’. Being patient and tolerant of others regardless of their
years of experience (Item 2.1) is one of these behaviours. Another is recognition that
respect from colleagues develops when individuals complete work but not at the expense of
relationships and trust (Item 2.5). This particular item was the only one where more than
half of the responses were found in the columns for ‘to a moderate extent’ and ‘to a slight
extent’. These results suggest that this is a matter which may also warrant attention. While
having expertise to help others is important, the responses to Item 2.3 show that teachers
may want a safety net when they are mutually vulnerable as learners. This is crucial if

10
schools are to be communities of learners where teachers can function and work alongside
one another with confidence.
Value 3: Reflective Inquiry and Discourse
The results for Value 3, ‘Reflective Inquiry and Discourse’ are displayed in Table 3. This value
is expressed in items which delve into how teachers can make meaning of their practice
through interactions with others.
Table 3: Regional responses to the value ‘Reflective Inquiry and Discourse’
Item number
Value 3: ‘Reflective Inquiry and Discourse’
To a great extent
To a moderate extent
To a slight extent
Not at all
3.1 Take risks knowing support will be there
45.76% 42.37% 10.17% 1.69%
3.2 Respect the integrity, honesty and commitment of colleagues
66.10% 25.42% 8.47% 0.00%
3.3 Invite others to observe in one’s classroom as learners
37.29% 44.07% 13.56% 5.08%
3.4 Share best lessons with colleagues
37.29% 49.15% 11.86% 1.69%
3.5 Know the types of questions which help to make sense of practice
28.81% 61.02% 10.17% 0.00%
3.6 Make time for reading research and discussing insights with colleagues
18.64% 42.37% 37.29% 1.69%
3.7 Co-construct meanings of practice with external facilitators
28.81% 49.15% 20.34% 1.69%
The responses against this value show a greater spread across the possible ratings than
those for Values 1 and 2. More than two-thirds or the respondents (66.1%) felt, for Item
3.2, respecting the integrity, honesty and commitment of colleagues was evident ‘to a great
extent’. The combination of results for the first two rating categories for Item 3.5 reaches
almost 90%, suggesting that knowledge of the types of questions which help to make sense
of practice is evident in the region. Similar results for Item 3.1 suggest that risk taking by the
staff is likely to be supported. Again, the combination of the first two columns’ results for
Items 3.3 and 3.4 signal that classroom observation by peers and the sharing of best lessons
occurs and is acknowledged by a majority of staff members. Of further note is the result for
Item 3.6, where the combination of ‘to a great’ and ‘moderate extent’ produced a figure of
less than two thirds of the respondents making time for reading research and discussing
insights with colleagues

11
Value 4: Evidence-based Professional Practice
Table 4 shows the results for Value 4, ‘Evidence-based Professional Practice’. This cluster of
items reveals some of the skillsets associated with accepting the need for robust evidence
about teaching and learning.
Table 4: Regional responses to the value ‘Evidence-based Professional Practice’
Item number
Value 4: ‘Evidence-based Professional Practice’
To a great extent
To a moderate extent
To a slight extent
Not at all
4.1 Interpret and use data for improvement
48.33% 48.33% 3.33% 0.00%
4.2 Discern what is important and what is irrelevant
50.00% 46.67% 3.33% 0.00%
4.3 Show sensitivity to teachers’ feelings and competence when interrogating student data in public
58.33% 36.67% 3.33% 1.67%
4.4 Work with a data coach/team to build data literacy
20.00% 43.33% 21.67% 15.00%
4.5 Develop mutual relationships where both parties increase knowledge, skills & thinking
43.33% 50.00% 5.00% 1.67%
4.6 Construct new knowledge through collaborative work and social interactions
61.67% 31.67% 5.00% 1.67%
Table 4 shows for Item 4.6 that more than 90% of respondents (93.34%) said that new
knowledge was constructed through collaborative work and social interactions in their
school. Collegial interactions need a measure of sensitivity so that teachers of lower
performing students do not feel their teaching competence is being questioned when
comparative achievement is discussed. This was apparent in the ‘to a great extent’ rating
made by more than half of the respondents (58.33%) to Item 4.3. Of particular interest in
this table, is Item 4.4 for which the responses were distributed across all four scales. Here,
‘to a moderate extent’ received more responses (43.33%) than ‘to a great extent’ (20%).
This item described working with a data coach or team to build data literacy, and when the
results are considered across all four scales, they may well indicate a desire for further
professional development regionally.
The means and distribution for regional responses
This section of the report presents, for the four Te Ariki professional values, means for each
survey item together with standard deviations and variance. Following the tabular data
display, brief treatment is given to a small number of items selected for discussion. These
items are highlighted in grey in Tables 5, 7 and 8 so they can be easily distinguished.

12
Means and distribution for Value 1: Professional Discretion
Table 5: Regional means, standard deviations and variance for ‘Professional Discretion’
Item
number
Value 1: ‘Professional
Discretion’ Minimum Maximum Mean
Standard
Deviation Variance
1.1
Stick to the moral obligation
to improve students’
learning no matter the
pressures
1.00 2.00 1.10 0.30 0.09
1.2 Adopt a continuous
improvement mindset for
teaching practice
1.00 2.00 1.29 0.45 0.21
1.3
Take opportunities to
deepen professional practice
through partnerships or
networks within and beyond
the school
1.00 3.00 1.66 0.68 0.46
1.4 Create opportunities for
teachers to lead 1.00 4.00 1.58 0.74 0.55
1.5 Accept that those new to
leadership work need to be
supported
1.00 4.00 1.68 0.81 0.66
1.6 Realise that collegial sharing
provides new insights to
practice
1.00 3.00 1.25 0.51 0.26
1.7 Collect and act on data to
inform next steps 1.00 3.00 1.36 0.55 0.30
Means and distribution for Value 2: Collegial Obligation
Table 6: Regional means, standard deviations and variance for ‘Collegial Obligations’
Item
number
Value 2: ‘Collegial
Obligation’ Minimum Maximum Mean
Standard
Deviation Variance
2.1 Show interest and patience
for colleagues no matter
their level of experience
1.00 3.00 1.42 0.62 0.38
2.2 Establish trusting and
constructive relationships 1.00 3.00 1.29 0.58 0.34
2.3 Show willingness for
mutual vulnerability in
discussions about practice
1.00 3.00 1.53 0.67 0.45
2.4
Value opportunities to
question, interrogate and
reshape practice with
colleagues
1.00 3.00 1.53 0.65 0.42
2.5 Blend considerations for
colleagues alongside 1.00 3.00 1.58 0.56 0.31

13
concern for task
completion
2.6
Fulfil assigned
responsibilities so others
see them as credible and
trustworthy
1.00 3.00 1.42 0.59 0.35
2.7 Trust one another’s caring
intentions and show
commitment to others
1.00 3.00 1.39 0.66 0.44
Means and distribution for Value 3: Reflective Inquiry and Discourse
Table 7: Regional means, standard deviations and variance for ‘Reflective Inquiry and Discourse’
Item
number
Value 3: ‘Reflective
Inquiry and Discourse’ Minimum Maximum Mean
Standard
Deviation Variance
3.1 Take risks knowing
support will be there 1.00 4.00 1.68 0.72 0.52
3.2
Respect the integrity,
honesty and commitment
of colleagues
1.00 3.00 1.42 0.64 0.41
3.3
Invite others to observe in
one’s classroom as
learners
1.00 4.00 1.86 0.83 0.69
3.4 Share best lessons with
colleagues 1.00 4.00 1.78 0.71 0.51
3.5
Know the types of
questions which help to
make sense of practice
1.00 3.00 1.81 0.60 0.36
3.6
Make time for reading
research & discussing
insights with colleagues
1.00 4.00 2.22 0.76 0.58
3.7
Co-construct meanings of
practice with external
facilitators
1.00 4.00 1.95 0.75 0.56
Means and distribution for Value 4: Evidence-based Professional Practice
Table 8: Regional means, standard deviations and variance for ‘Evidence-based Professional Practice’
Item number
Evidence-based Professional Practice
Minimum Maximum Mean Standard Deviation
Variance
4.1 Interpret & use data for improvement
1.00 3.00 1.55 0.56 0.31
4.2 Discern what is important & what is irrelevant
1.00 3.00 1.53 0.56 0.32
4.3
Show sensitivity to teachers’ feelings & competence when interrogating student data in public
1.00 4.00 1.48 0.65 0.42

14
4.4 Work with a data coach/team to build data literacy
1.00 4.00 2.32 0.96 0.92
4.5
Develop mutual relationships where both parties increase knowledge, skills & thinking
1.00 4.00 1.65 0.65 0.43
4.6 Construct new knowledge through collaborative work and social interactions
1.00 4.00 1.47 0.67 0.45
Tables 5, 6, 7 and 8 provide information on the mean, standard deviation and variance for
each values item. A much greater response rate than achieved in the trial would be
necessary to gain an understanding of the items on which there is widespread acceptance
and agreement by participants and those on which no strong consensus is evident. At a
regional level, items with a small standard deviation and corresponding variance would
indicate generally broad agreement while those with a large standard deviation and
variance would signal a diversity of views about particular values in action. It is when there
is a diversity of views that a keen ‘edge’ is created for discussion amongst principals and
teachers, especially when they can be brought together for dialogue across schools.
Notwithstanding the limitations mentioned, three items are selected for brief commentary:
Item 1.5 – ‘Accepting that those new to leadership work need to be supported’; Item 3.3 –
‘Inviting others to observe in one’s classroom as learners’; and Item 4.4 – ‘Working with a
data coach/team to build data literacy’. These three items show a spread of responses
giving an indication that there is less consensus on these values in action than on Item 1.1 -
‘sticking to the moral obligation to improve students’ learning no matter the pressures – for
which the Standard Deviation is 0.03 and the Variance 0.09.
This concludes the commentary on responses from leaders and teachers in the trial region.
Individual school reports
The results of the trial are further presented with a focus on one school in the light of the
strength of the professional values’ positions taken by leaders and teachers in the region in
which all work. This is done so that an example of the type of discussion the results may
provoke can be demonstrated using the process of disciplined dialogue explained earlier.
The text is presented in the form that would be required for a scholarly article for
publication in a blind-reviewed scholarly journal. The purpose here is to show the Trust the
nature and extent of what is possible in making the outcomes of the trial public.
Sample school results
As for all schools, the sample school received its results graphed in Figure 1, using school
means compared with regional means across all four professional values. The graph shows a
mean of ‘1’ if all respondents selected ‘to a great extent’ on the scale. As can be seen, no
mean exceeded 2.5 on the 4 point scale. This graph enabled principals and teachers to
recognise items in alignment or otherwise with the views of others in the region. The

15
distance between the lines shows the degree of difference between the two groups. The
sample school’s plot is the lower line in Figure 1, indicating that for most items, slightly
more positive views were apparent than in the region at large. For the school in focus, direct
alignment was found in items 1.6, 3.1, 3.5, 4.1, 4.2 and 4.4. There were many items for
which the school results produced lower means and therefore, more positive results than
those for the region.
Figure 1: Means for the sample school compared with regional means across items for all
professional values.
----------------------------- ---------------------------- --------------------------- ------------------------- Professional Discretion Collegial Obligation Reflective Inquiry … Evidence-based Practice
The school response to the very first item (1.1) in the survey is a ‘standout’ – To what extent
does the staff of this school stick to the moral obligation to improve students’ learning no
matter the pressures? The mean here lies at 1.0, recording a 100% response rate for all
teachers. As the figure shows, others in the region are not far behind, with almost 90%
selecting ‘to a great extent’ as their response while the remaining 10% selected ‘to a
moderate extent’.
The least positive means, both for the school and the region were recorded for items 3.6
and 4.4 respectively – To what extent does the staff of this school make time for reading
research and discussing insights with colleagues? and To what extent does the staff of this
school work with a data coach/team to build data literacy? In both cases, more than a third
of the respondents said that these actions were evident ‘to a slight extent’ or ‘not at all’.
More is said about these findings in the presentation of the school’s data below.
Value 1: ‘Professional Discretion’
Table 1 records the results for the first of the four values – ‘Professional Discretion’ about
which the first of the disciplined dialogue questions applies: What are we seeing in these
data? For the purposes of the report, attention is paid to Items 1.1 and 1.5. As has been
said, the 100% response to the moral obligation to improve students’ learning is
noteworthy. The combined ratings of ‘to a great extent’ (50%) and ‘to a moderate extent’
(43%) for supporting those new to leadership work are positive (93%). However, there are
some negative views (7%). A discussion of this matter will be picked up later in the report
using the second and third disciplined dialogue questions. It should be noted that all Item

16
numbers in the school tables which follow are the same as for all tables in the report. This is
done to ensure that all items are able to be readily recognised.
Table 9: ‘Professional discretion’ in tabular form showing percentages for the sample school
Item number
Value 1: ‘Professional Discretion’ To a great extent %
To a moderate extent %
To a slight extent %
Not at all %
1.1 Stick to the moral obligation to improve students’ learning no matter the pressures
100 0 0 0
1.2 Adopt a continuous improvement mindset for teaching practice
93 7 0 0
1.3
Take opportunities to deepen professional practice through partnerships or networks within & beyond the school
43 57 0 0
1.4 Create opportunities for teachers to lead
57 36 7 0
1.5 Accept that those new to leadership work need to be supported
50 43 7 0
1.6 Realise that collegial sharing provides new insights to practice
79 21 0 0
1.7 Collect and act on data to inform next steps
71 29 0 0
Value 2: ‘Collegial Obligation’
Table 10 records the results for the second of the four professional values – ‘Collegial
Obligation’ about which the first of the disciplined dialogue questions is asked: What are we
seeing in these data? In answer, attention is given to Items 2.2 and 2.3. Both of these items
show that the school staff acknowledge the positive nature of staff relationships and the
support available when practice vulnerability emerges. For these items, establishing trusting
and constructive relationships and showing willingness for mutual vulnerability in discussions
about practice, the combined positive ratings reach 100%. Again more will be said about this
in the later discussion of the two remaining disciplined dialogue questions.
Table 10: ‘Collegial Obligation’ in tabular form showing percentages for the sample school
Item number
Value 2: ‘Collegial Obligation’ To a great extent %
To a moderate extent %
To a slight extent %
Not at all %
2.1 Show interest and patience for colleagues no matter their level of experience
86 14 0 0
2.2 Establish trusting and constructive relationships
93 7 0 0
2.3 Show willingness for mutual vulnerability in discussions about practice
93 7 0 0
2.4 Value opportunities to question, interrogate and reshape practice with colleagues
79 21 0 0

17
2.5 Blend considerations for colleagues alongside concern for task completion
71 29 0 0
2.6 Fulfil assigned responsibilities so others see them as credible and trustworthy
79 21 0 0
2.7 Trust one another’s caring intentions and show commitment to others
86 14 0 0
Value 3: ‘Reflective Inquiry and Discourse’
Following the pattern established for values 1 and 2, Table 11 records the results for the
third of the four professional values – ‘Reflective Inquiry and Discourse’. Again the first of
the disciplined dialogue questions is asked: What are we seeing in these data? In response,
the focus turns to Items 3.2 and 3.6. The results for ‘respecting the integrity, honesty and
commitment of colleagues’ (Item 3.2) show this professional value is held ‘to a great extent’
by 71% of respondents, with ‘to a moderate extent’ drawing 29% or responses. This positive
result reinforces the strength of ‘Collegial Obligation’ already shown in Table 2. The ‘to a
slight extent’ with 21% of responses to Item 3.6, ‘making time for reading research and
discussing insights with colleagues’, is the highest for the items in this third values cluster.
As for the results from previous tables, this finding is discussed later using the second and
third disciplined dialogue questions.
Table 11: ‘Reflective inquiry and discourse’ in tabular form showing percentages for the sample
school
Item number
Value 3: ‘Reflective inquiry & discourse’
To a great extent %
To a moderate extent %
To a slight extent %
Not at all %
3.1 Take risks knowing support will be there
43 57 0 0
3.2 Respect the integrity, honesty & commitment of colleagues
71 29 0 0
3.3 Invite others to observe in one’s classroom as learners
50 50 0 0
3.4 Share best lessons with colleagues 50 50 0 0
3.5 Know the types of questions which help to make sense of practice
29 64 7 0
3.6 Make time for reading research & discussing insights with colleagues
29 50 21 0
3.7 Co-construct meanings of practice with external facilitators
36 64 0 0
Value 4: Evidence-based Professional Practice
Finally, Table 12 records the results for the last of the four values ‘Evidence-based
Professional Practice’. Again we ask the first of the disciplined dialogue questions: What are
we seeing in these data? From this table, the results for Item 4.4 are highlighted. Here
‘working with a data coach/team to build data literacy’ drew but 14% of responses ‘to a
great extent’ and 50% ‘to a moderate extent. This left 28% of respondents rating this item,
‘to a slight extent’ and a further 8% marking it ‘not at all’. These findings call for discussions

18
of the reasons why these results have been reported and what might be done about them -
questions which are featured in the disciplined dialogue sequence in the next section.
Table 12: ‘Evidence-based Professional Practice’ in tabular form showing percentages for the sample
school
Item number
Value 4: ‘Evidence- based Professional Practice’
To a great extent %
To a moderate extent %
To a slight extent %
Not at all %
4.1 Interpret & use data for improvement
43 57 0 0
4.2 Discern what is important & what is irrelevant
50 50 0 0
4.3 Show sensitivity to teachers’ feelings & competence when interrogating student data in public
71 29 0 0
4.4 Work with a data coach/team to build data literacy
14 50 28 8
4.5 Develop mutual relationships where both parties increase knowledge
50 50 0 0
4.6 Construct new knowledge through collaborative work and social interactions
86 14 0 0
Having made a number of selections in response to the first of the three disciplined
questions – What do we see in these data? - an example of the kind of discussion which
might take place amongst this school’s staff members is portrayed using the remaining two
questions.
The discussion is presented in Table 13, with the first column showing the results for
selected items, the second, possible reasons why these results might have been recorded in
the school and in the third, some suggested strategies addressing the explanations given.
Table 13: Disciplined dialogue discussion example
Results for the items selected Why are we seeing what we are?
What, if anything, should we be doing about it?
100% of the staff report to a great extent sticking to the moral obligation to improve students’ learning no matter the pressures (Item 1.1)
In this school there is ongoing discussion about students’ learning needs. A discussion about the moral purpose of education is conducted at the beginning of each school year.
Present practices should be continued. Experienced staff should be invited to lead annual discussions of the pressures to be faced this year and what will be necessary for the continuing improvement of student achievement.
93% of the staff report to a great extent willingness for mutual vulnerability in discussions about practice (Item 2.3)
The opening up of classrooms for peer observation is a recent development. The sharing of good practice examples and issues of practice occurs at staff meetings.
Extending the peer observation process as a common school practice with support for teacher release for improvement discussions. Creating opportunities for sharing effective practices within and beyond the school.

19
21% of the staff report to a slight extent making time for reading research & discussing insights with colleagues (Item 3.6)
The low percentage here is explained through the busyness of the teachers’ day. A limited professional library exists within the school.
Selecting a high priority learning area as a focus for research review and the compilation of relevant articles. Creating research reading groups periodically and applying learnings.
36% of the staff report to a slight extent or not at all working with a data coach/team to build data literacy (Item 4.4)
Evidenced-based strategy development is relatively new to the school. Systematic gathering of school data is variable.
Determining what kind of data about student learning and achievement is a priority, gathering such data and creating professional learning opportunities for its use.
The examples provided in Table 13 indicate the likely discussion that staff members with
local knowledge about their circumstances would be able to contribute. There is much in
the survey about each of the four professional values which when combined with disciplined
dialogue open the school to collaborative inquiry, reflection and planning. In this sense the
trial shows direct and relevant utility for leaders and teachers in their own school
environments.
Suggested changes resulting from the trial
Since this report has been about the trialling of a survey tool on professional values, it is
important now to identify suggested amendments to the instrument in the light of its
implementation.
First, in the invitation for schools to use this tool, it should be made clear that the outcome
is meant to be a discussion starter - a ‘tin opener’ for dialogue. The survey is not a
sophisticated research instrument. School leaders and teachers should be able to apply,
analyse and follow up on their local results with ease. They may also like to administer the
tool more than once, perhaps a year or so apart, as an aide to continuing discussion about
these core professional values.
Second, the items are currently not randomised in the tool but appear as category clusters.
When randomised, each item is taken on its merits, thus avoiding repetitious responses to
like items in a category. The re-categorisation of the items need only occur when the
findings are reported. Each category and particular items within it then becomes the focus
for staff dialogue.
Third, the disaggregation of results which allow for an individual teacher or leader to
compare his or her responses with the aggregated school view overall, is likely to attract
personal reflection and therefore possible commitment to action.
Fourth, as has been indicated already, a school may implement the survey tool a second
time following the implementation of improvement strategies developed from its first use.
Fifth, the comparison of the sample school results with those from teachers and leaders in
the region suggests that potential lies for schools to compare their results if, and when, this
is possible. An aspirational suggestion, therefore, derived from the trial recognises its
20
potential as an enabling device that could usefully be employed by Communities of Learners
(CoLs) being established by New Zealand’s “Investing in Educational Success (IES) Policy”.
Under this policy, how these new partnerships develop is left for CoLs to determine. If each
school in a CoL were to complete the Te Ariki online tool, there would be available to
leaders and teachers, professional values’ profiles on which discussions to understand
similarities and differences could proceed. One outcome of such discussions may be the
identification of protocols, ways of working and relationship building amongst the schools in
the CoL. If this were so, the Te Ariki Trust’s hopes for the wider use of is professional values
may indeed be realised.
Conclusion to the trial
What now follows is an overall conclusion from the trial, summarising school staff members’ and leaders’ experience of it.
Schools received their reports by email the day before they closed for the year. Therefore, what principals and teachers will do with their individualised reports is not known at this stage. Nevertheless, two principals made contact on receipt of their reports before the last day. Others will be reading their reports early in 2018. One of the principals who made contact was from the school where 14 teachers had responded. Time had been made at a staff meeting to complete the survey although not all teachers had done so. That principal was committed to studying the results with staff and following the ‘disciplined dialogue’ pattern of analysis modelled in the school’s report. The other principal was from a school where just one teacher had responded. That principal, recognising the limitation of one respondent, and not knowing who it was, nevertheless thought the information had potential to be of use. Based on this experience, a recommendation from the trial would be that schools actively encourage all teaching staff to complete the survey at a given time to ensure the maximum number of returns. Doing so would provide a fuller and more accurate overview of a school’s response to this corpus of the core professional values always implicated in school development.
In returning the reports to each of the participating schools, a brief explanation of the ‘disciplined dialogue’ approach to data analysis was included. That explanation named the three levels of questions (descriptive, explanatory and development-oriented future steps). A further recommendation would be to encourage school principals to adopt this question sequence and apply it as a matter of course when data are being analysed. Such a strategy would serve to build commitment to development and increase data literacy and use.
Despite a low response rate from schools in the trial (N=17) early indications are that the professional values instrument would be welcomed. For the Trust to extend the survey to a national audience, it would need to consider how it could be managed on an annual basis, its administration costs, and how it could be analysed at several levels, school, CoL and region.

21
References Danielson, C. (2009). Talk about teaching: Leading professional conversations. Thousand Oaks, CA:
Corwin Press.
Dempster, N., Townsend, T., Johnson, G., Bayetto, A., Lovett, S., & Stevens, E. (2017). Leadership and
Literacy. Principals, Partnerships and Pathways to Improvement. Dordrecht, Switzerland: Springer.
Earl, L., & Timperley, H. (2009). Professional learning conversations. The Netherlands: Springer.
Eraut, M. (1994). Developing professional knowledge and competence. London: Routledge.
Lovett, S. (2016). Values for New Zealand School Leadership. A Literature Review for the Te Ariki
Trust, Christchurch, NZ: University of Canterbury.
Robinson, V., & Timperley, H. (2007). The leadership of the improvement of teaching and learning:
Lessons from initiatives with positive outcomes for students. Australian Journal of Education, 51(3),
247-262.
Swaffield, S., & Dempster, N. (2009). A learning dialogue (principle 3). In J. MacBeath., & N.
Dempster. (Eds.). Connecting Leadership and Learning. (pp.106-120). Abingdon, UK: Routledge.
Timperley, H. (2015). Professional conversations and improvement focused feedback: A review of the
research literature and the impact on practice and student outcomes. AITSL, Melbourne: Prepared
for the Australian Institute for Teaching and School Leadership.

22
Appendix 1: email introducing the survey
Dear [principal]
This email is to invite you and your teachers to participate in a trial of a recently developed
survey tool. This trial is only being offered to those working in primary and intermediate
schools in your region. It is a free trial which can be answered in 10 minutes by accessing an
online link provided below. This trial is to determine whether this survey tool would be of
value to other New Zealand schools. If deemed to be of use then other schools would be
able to access the survey tool for a small administration fee. If you participate now, there
will be no fee payable.
This online survey tool is designed to provide a readiness measure for schools and/or
Communities of Learners embarking on new initiatives and can then be used for in-school
discussion. The data from the survey will be analysed per school and then aggregated for
the region. The value of the survey tool will depend on the number of teachers in a school
who respond to the 10 minute survey.
This survey tool has been commissioned by the Ariki Trust with the support of NZEI and
NZPF. The University of Canterbury has been responsible for developing the survey tool and
is offering those in its local area the opportunity to participate. Local principal, Dr Lyn Bird
(Board member of the Ariki Trust and Principal of Selwyn House), has suggested to us that
this would be of interest to those in your region so we are now offering you the opportunity
to be the first to participate.
Your participation is welcomed using the link provided below. Please circulate this email to
your teachers and encourage them to join you in completing the survey tool.
If you have any questions about this trial and what is requested, I would be happy for you or
your teachers to contact me.
The link to access this survey tool will be open until 10 November 2017.
Thank you
Susan Lovett
Associate Professor Educational Leadership
School of Educational Studies & Leadership
College of Education, Health & Human Development
University of Canterbury
Email: [email protected]
Phone: (03) 3693629
23
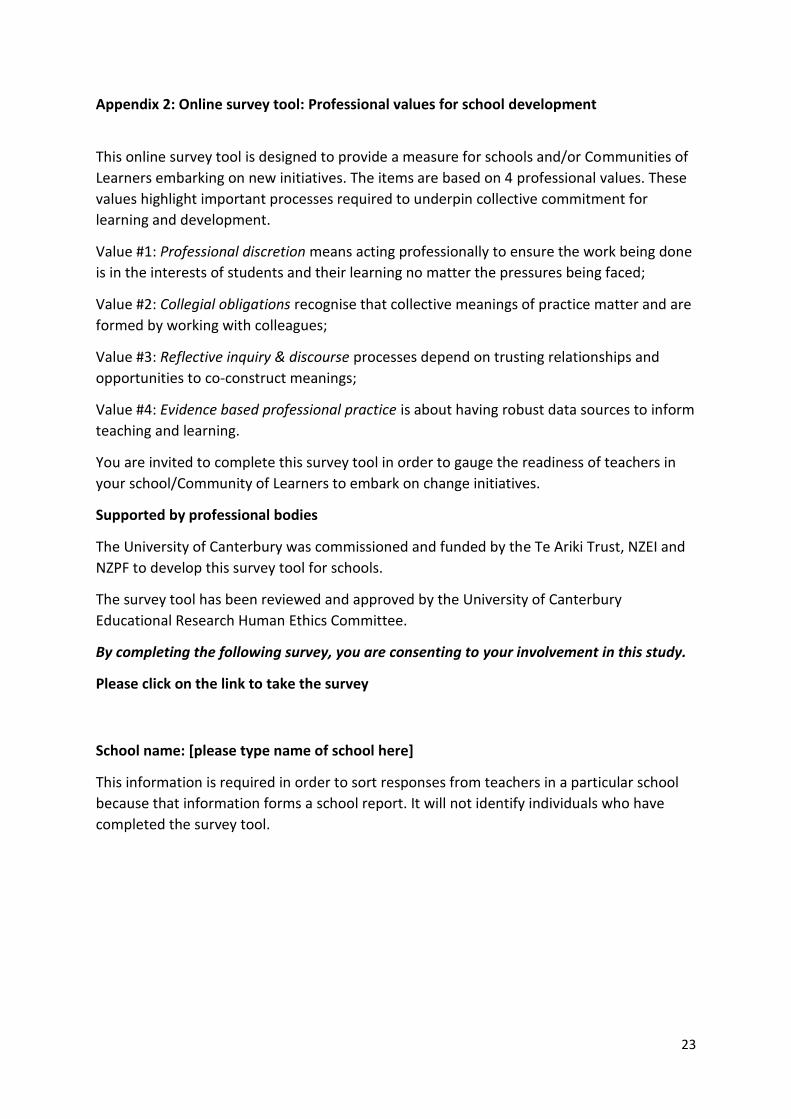
Appendix 2: Online survey tool: Professional values for school development
This online survey tool is designed to provide a measure for schools and/or Communities of
Learners embarking on new initiatives. The items are based on 4 professional values. These
values highlight important processes required to underpin collective commitment for
learning and development.
Value #1: Professional discretion means acting professionally to ensure the work being done
is in the interests of students and their learning no matter the pressures being faced;
Value #2: Collegial obligations recognise that collective meanings of practice matter and are
formed by working with colleagues;
Value #3: Reflective inquiry & discourse processes depend on trusting relationships and
opportunities to co-construct meanings;
Value #4: Evidence based professional practice is about having robust data sources to inform
teaching and learning.
You are invited to complete this survey tool in order to gauge the readiness of teachers in
your school/Community of Learners to embark on change initiatives.
Supported by professional bodies
The University of Canterbury was commissioned and funded by the Te Ariki Trust, NZEI and
NZPF to develop this survey tool for schools.
The survey tool has been reviewed and approved by the University of Canterbury
Educational Research Human Ethics Committee.
By completing the following survey, you are consenting to your involvement in this study.
Please click on the link to take the survey
School name: [please type name of school here]
This information is required in order to sort responses from teachers in a particular school
because that information forms a school report. It will not identify individuals who have
completed the survey tool.

24
Professional values for school development survey: instructions
In responding to the following statements please consider your answer thinking about your school as
a whole. Place a tick according to the column which best fits the extent to which the practices apply.
Values for school development
1 To a great extent
2 To a moderate extent
3 To a slight extent
4 Not at all
Value #1: Professional discretion To what extent do most of the staff of this school…?
1.Stick to the moral obligation to improve students’ learning no matter the pressures
2. Adopt a continuous improvement mindset for teaching practice
3. Take opportunities to deepen professional practice through partnerships or networks within & beyond the school
4. Create opportunities for teachers to lead
5. Accept that those new to leadership work need to be supported
6. Realise that collegial sharing provides new insights to practice
7. Collect and act on data to inform next steps
Value #2: Collegial obligation To what extent do most of the staff of this school…?
8. Show interest and patience for colleagues no matter their level of experience
9. Establish trusting and constructive relationships
10. Show willingness for mutual vulnerability in discussions about practice
11. Value opportunities to question, interrogate and reshape practice with colleagues
12. Blend considerations for colleagues alongside concern for task completion
13. Fulfil assigned responsibilities so others see them as credible and trustworthy
14. Trust one another’s caring intentions and show commitment to others

25
Value #3: Reflective inquiry & discourse To what extent do most of the staff of this school…?.
1 To a great extent
2 To a moderate extent
3 To a slight extent
4 Not at all
15. Take risks knowing support will be there
16. Respect the integrity, honesty and commitment of colleagues
17. Invite others to observe in one’s classroom as learners
18. Share best lessons with colleagues
19. Know the types of questions which help to make sense of practice
20. Make time for reading research & discussing insights with colleagues
21. Co-construct meanings of practice with external facilitators
Value #4: Evidence based professional practice To what extent do most of the staff of this school…?
22. Interpret & use data for improvement
23. Discern what is important & what is irrelevant
24. Show sensitivity to teachers’ feelings & competence when interrogating student data in public
25. Work with a data coach/team to build data literacy
26. Develop mutual relationships where both parties increase knowledge, skills & thinking
27. Construct new knowledge through collaborative work and social interactions
Thank you for completing this survey.