REVIEWING OF PERFORMANCE - doenets.lk 5 Scholaraship... · N E T S REVIEWING OF PERFORMANCE at...
63
Research and Development Branch National Evaluation and Testing Service Department of Examinations Curriculum Assessment & Evaluation Teaching Learning N E T S REVIEWING OF PERFORMANCE at Grade Five Scholarship Examination - 2017
Transcript of REVIEWING OF PERFORMANCE - doenets.lk 5 Scholaraship... · N E T S REVIEWING OF PERFORMANCE at...

Research and Development BranchNational Evaluation and Testing ServiceDepartment of Examinations
Curriculum
Assessment&
Evaluation
Teaching Learning
N E T S
REVIEWING OF
PERFORMANCE
at
Grade Five Scholarship
Examination - 2017

- 1 -
The message of the Commissioner General of Examinations
The Grade 5 Scholarship Examination is conducted with the intentions of giving bursaries to bright but economically disadvantaged students and providing opportunities to bright students to gain admission to popular schools.
Almost every student who is studying in Grade 5 sit this examination. Therefore, this has become a popular and competitive examination among candidates. Much pains are being taken by candidates to reach a high level of achievement at this examination and principals, teachers and parents to assist the realization of their goals.
This booklet presented to you by the Research and Development Branch of the Department of Examinations contain valuable statistical information for wider reference categorized under 5 sections; General information, Performance of candidates, Analyses of Paper I and Paper II, Item analyses of Paper I and Paper II, and Best performing schools in the island. It is attempted here to present comprehensive analyses to provide information in greater detail.
The information provided here is of great importance to teachers, principals, In- service advisors, and directors to understand the tendencies and patterns of this examination in order to develop the learning teaching process. It is equally important to researchers and other stakeholders in numerous ways to contribute to the development of Primary Education.
I wish to extend my sincere thanks to my staff at the Research and Development Branch who worked very hard to prepare this booklet for the benefit of all stakeholders in the Education sector.
B. Sanath Pujitha Commissioner General of Examinations
Research & Development Branch Department of ExaminationsPelawatta, Battaramulla09.03.2018

- 2 -
Guidance
Mr. B. Sanath Pujitha - Commissioner General of Examinations
Direction & Editing
Ms. Gayathri Abeygunasekera - Commissioner of Examinations (Research/ Development and Evaluation)
Data Analysis
Mr. L.G.S. Samarakoon - Assistant Commissioner of Examinations
Assistance
Mr. J.A.J.R. Jayakody - Deputy Commissioner of Examinations
Ms. Hasantha Kuruppu - Assistant Commissioner of Examinations
Mr. E.K. Nandakumara Edirisinghe - Computer Programmer & System Analyst Type Setting & Graphics
Ms. W.A.D. Chathurika Dissanayaka
Technical Assistance Ms. Irosha Bandara Ms. Anusha Maduwanthi Dissanayake Ms. M.H.S. Raheena Ms. Piumi Madushani Ms. O.M.D. Sewwandi Ms. S. Kanchana Ms. Madusha Dilrukshi Mr. N.N. Priyadarshana
Cover Design
Ms. Y.S. Anuradhi
ii

- 3 -
List of Contents
1. General Information ........................................................................................... 1 1.1 Objectives of the Examination ................................................................... 1 1.2 History of the Examination ........................................................................ 1 1.3 Structure of the Examination Papers .......................................................... 2
2. Performance of Candidates 2.1 Performance of Candidates from 2013 to 2017 .......................................... 3 2.2 Overall Performance of Candidates ........................................................... 4 Performance by Medium ........................................................................... 4 Performance by Gender ............................................................................ 4 Performance by Income ............................................................................ 5 2.3 Performance of Candidates by Province from 2013 to 2017 ....................... 6 2.4 Performance of Candidates by Province - 2017 .......................................... 6 2.5 Performance of Candidates by Province Arranged in Descending Order - 2017 . ............................................................................................... 7 2.6 Performance of Candidates by District from 2013 to 2017 ........................ 8 2.7 Performance of Candidates by District - 2017 ........................................... 9 2.8 Performance of Candidates by District, Arranged in Descending Order .... 11 2.9 Performance of Candidates by Province and Income Level ....................... 12 2.10 Performance of Candidates by Province and Gender .................................. 13 2.11 Performance of Candidates by Province and Medium................................. 14 2.12 Performance of Candidates by Education Zone - 2017 ............................... 15 2.13 Performance of Candidates by Education Zone Arranged in Descending Order - 2017 ................................................................................................. 17
3. Analyses of Question Papers 3.1 Comparison of Distribution of Total Marks - 2016 & 2017 ........................ 23 3.2 Distribution of Frequencies of marks for Paper I by Income Level ........... 24 3.3 Distribution of Frequencies of marks for Paper II by Income Level ......... 25 3.4 Distribution of Frequencies of Total marks by Income Level .................... 26 3.5 Distribution of Frequencies of marks for Paper I by Medium ................... 27 3.6 Distribution of Frequencies of marks for Paper II by Medium .................. 28 3.7 Distribution of Frequencies of Total marks by Medium ............................ 29 3.8 Distribution of Frequencies of marks for Paper I by Gender .................... 30 3.9 Distribution of Frequencies of marks for Paper II by Gender ................... 31 3.10 Distribution of Frequencies of Total marks by Gender ............................. 32 3.11 Mean Values of Paper I, Paper II & Total Marks by Province ................... 33
iii

- 4 -iv
4. Item Analyses of Question Papers 4.1 Item Person Map for Paper I ...................................................................... 34 4.2 Facility Indices of Question Paper I .......................................................... 35 4.3 Distractor Analysis for Paper I .................................................................. 36 4.4 Item Person Map for Paper II .................................................................... 37 4.5 Facility Indices of Question Paper II ........................................................ 38 4.6 Category Analysis for Paper II 4.6.1. Category Analysis for Short Answer Type Questions ................ 39 4.6.2. Distractor Analysis for Multiple Choice Questions ................... 40 4.7 Analysis of Paper II by theme ................................................................. 41 4.8 Analysis of Essay Question in Paper II .................................................... 41 4.8.1. Pattern of Obtaining marks for Essay Question ........................ 41 4.8.2. WeaknessesIdentifiedinEssayQuestion.................................. 42
5. Performance by School ............................................................................................. 43
6. Grade 5 Scholarship Examination - Paper I & II ...................................................... 44

- 1 -
1.1 Objectives of the Examination
1. Admission of bright students to popular schools.
2. Provision of bursaries to bright but economically disadvantaged students.
1.2 History of the Examination The examination was introduced in 1948 as Central Colleges Scholarship Examination for admission of bright students to Central Colleges. Number of students who sat the examination from 1952 to 1969 is given below.
Year Number Sat
1952 238061953 26180 1954 261801955 276261956 378201957 238061958 434841959 539291960 590291961 438551962 448861963 684391964 755621965 758751966 748421967 784011968 786041969 92030 (Jathika Navodaya Scholarships)
1. General Information

- 2 -
1.3 Structure of the Examination Papers
Ú Examination Consists of Two Question Papers:
Ú Before 1995, they were,
(i) First Language (ii) Mathematics
whichmeasured‘ProficiencyinLiteracy’and‘ProficiencyinNumeracy’.
Ú From 1995, the two question papers were restructured as, (i) Paper I (ii) Paper II
which measure the following learning abilities & potentials.
÷ Substitution÷ Interpretation÷ Prediction÷ Translation÷ Problem Solving÷ Seeing Relationships÷ IdentificationofCauseandEffect÷ Organization of Information÷ Perception÷ Observation÷ Inter-relations÷ Reasoning÷ Seeing Spatial Relationships÷ Following Instructions

- 3 -
2.1 Performance of Candidates from 2013 - 2017
Table 1 :
Figure 1 :
Grade 5 Scholarship Examinations 2013 - 2017Distribution of candidates - Number Sat the examination,
obtained marks above Cut Off, Mean Values and Standard Deviations by Year
2. Performance of Candidates
2013 2014 2015 2016 2017
322455 327648 333672 343757 350462
No. 223908 258700 254690 260130 243236
% 69.44 78.96 76.33 75.67 69.40
No. 32617 32735 31853 32646 33163
% 10.12 9.99 9.55 9.50 9.46
110.71 113.89 109.50 107.86 106.43
36.38 36.98 36.63 35.17 38.23
Year
Number Sat
Obtained marks 70 and Above (35 and above for each paper)
Above cut off (Qualified to receive bursaries and apply for schools)
Mean Value
S.D.
29118631704
69.44
78.96 76.33 75.67
69.40
0
10
20
30
40
50
60
70
80
90
100
2013 2014 2015 2016 2017
Perc
enta
ge
Year
Grade 5 Scholarship Examinations 2013 - 2017Percentage of candidates who obtained marks 70
and above (35 and above for each paper)

- 4 -
2.2 Overall Performance of Candidates by Medium, Gender & Income at the Grade 5 Scholarship Examination - 2017
Performance by Medium
Figure 2.1 Figure 2.2 Figure 2.3
Performance by Gender
Figure 3.1 Figure 3.2 Figure 3.3
Percentage distribution of candidates who sat the
examination by medium
Percentage distribution of candidates who obtained marks
above cut off by medium
Percentage distribution ofcandidates who were qualified for
bursaries by medium
It is observed that the ratio of the percentages in the ‘Percentage distribution of the candidates who sat the examination by medium (figure 2.1)’ is equivalent to the ratio of thepercentages in the ‘Percentage distribution of candidates who were qualified for bursaries bymedium(figure2.3)’.
According to the Figure 3.2, it is notable that the percentage of female candidates who obtained marks above cut off are slightly higher than the percentage of male candidates and the respective percentages are 52% and 48%.
Percentage distribution of candidates who sat the examination by Gender
Percentage distribution of candidates who obtained marks
above cut off by Gender
Percentage distribution of candidates who were qualified
for bursaries by Gender
75%25%
Number Sat
Sinhala Tamil
81%19%
Above Cut Off
Sinhala Tamil
75%25%
Qualified for Bursaries
Sinhala Tamil
75%25%
Number Sat
Sinhala Tamil
81%19%
Above Cut Off
Sinhala Tamil
75%25%
Qualified for Bursaries
Sinhala Tamil
75%25%
Number Sat
Sinhala Tamil
81%19%
Above Cut Off
Sinhala Tamil
75%25%
Qualified for Bursaries
Sinhala Tamil
75%25%
Number Sat
Sinhala Tamil
81%19%
Above Cut Off
Sinhala Tamil
75%25%
Qualified for Bursaries
Sinhala Tamil
75%25%
Number Sat
Sinhala Tamil
81%19%
Above Cut Off
Sinhala Tamil
75%25%
Qualified for Bursaries
Sinhala Tamil
75%25%
Number Sat
Sinhala Tamil
81%19%
Above Cut Off
Sinhala Tamil
75%25%
Qualified for Bursaries
Sinhala Tamil
51%
49%
Number sat
Male Female
48%
52%
Above Cut Off
Male Female
76%
24%
Qualified for Bursaries
Male Female
51%
49%
Number sat
Male Female
48%
52%
Above Cut Off
Male Female
76%
24%
Qualified for Bursaries
Male Female
51%
49%
Number sat
Male Female
48%
52%
Above Cut Off
Male Female
76%
24%
Qualified for Bursaries
Male Female
51%
49%
Number sat
Male Female
48%
52%
Above Cut Off
Male Female
76%
24%
Qualified for Bursaries
Male Female
51%
49%
Number sat
Male Female
48%
52%
Above Cut Off
Male Female
76%
24%
Qualified for Bursaries
Male Female
51%
49%
Number sat
Male Female
48%
52%
Above Cut Off
Male Female
76%
24%
Qualified for Bursaries
Male Female

- 5 -
Performance by Income
Figure 4.1 Figure 4.2 Figure 4.3
Accordingtothefigure4.2,itseemsthattheincomelevelofparentsaffectstheperformanceof candidates. Higher educational status of parents and their ability to provide children with more educational opportunities are the possible reasons for better performance of students from the familes of higher income levels.
Figure 4.3 bears out that all candidates of lower income level, who have obtained marks above cut off are given bursaries.
Percentage distribution of candidates who sat the
examination by Family Income
Percentage distribution of candidates who obtained marks above cut off by Family Income
Percentage distribution of candidates who were qualified for
bursaries by Family Income
32%
68%
Number sat
Higher Income Lower Income
55%
45%
Above Cut Off
Higher Income Lower Income
100%
Qualified for Bursaries
Higher Income Lower Income
32%
68%
Number sat
Higher Income Lower Income
55%
45%
Above Cut Off
Higher Income Lower Income
100%
Qualified for Bursaries
Higher Income Lower Income
32%
68%
Number sat
Higher Income Lower Income
55%
45%
Above Cut Off
Higher Income Lower Income
100%
Qualified for Bursaries
Higher Income Lower Income
32%
68%
Number sat
Higher Income Lower Income
55%
45%
Above Cut Off
Higher Income Lower Income
100%
Qualified for Bursaries
Higher Income Lower Income
32%
68%
Number sat
Higher Income Lower Income
55%
45%
Above Cut Off
Higher Income Lower Income
100%
Qualified for Bursaries
Higher Income Lower Income
32%
68%
Number sat
Higher Income Lower Income
55%
45%
Above Cut Off
Higher Income Lower Income
100%
Qualified for Bursaries
Higher Income Lower Income

- 6 -
2.3 Performance of Candidates by Province from 2013 - 2017
Table 2 :
Grade 5 Scholarship Examinations 2013 - 2017Distribution of number of candidates who obtained marks above
District Cut Off by Province & Year
2.4 Performance of Candidates by Province - 2017
Table 3 :Grade 5 Scholarship Examination - 2017
Distribution of candidates who sat the examination, above Cut Off, obtained marks above 100 and above 70 by Province
* Percentage is calculated based on the number sat of each Province
Number % Number % Number % Number % Number %
Western 8133 9.97 8425 10.18 8251 9.86 7651 9.06 7619 8.97
Central 2947 6.82 3014 6.91 2834 6.59 3116 7.01 2950 6.50
Southern 4702 11.67 4649 11.36 4337 10.42 4623 10.57 4732 10.82
Northern 1938 11.02 2064 11.00 2148 11.38 2025 10.49 2226 10.93
Eastern 2687 9.66 2380 8.52 2500 7.99 2649 8.01 2599 7.94
North Western 4262 11.30 4389 11.37 4149 10.51 4268 10.58 4805 11.56
North Central 2213 10.18 2134 9.72 2197 9.69 2367 10.17 2391 9.63
Uva 2229 10.05 2050 9.14 2172 9.72 2417 10.45 2274 9.45
Sabaragamuwa 3506 11.55 3630 11.84 3265 10.64 3530 11.03 3567 10.85
Island 32617 10.12 32735 9.99 31853 9.55 32646 9.50 33163 9.46
201620142013 2015Province
2017
Number % Number % Number %
1 Western 84,913 7,619 8.97 41,592 48.98 60,590 71.36
2 Central 45,350 2,950 6.50 18,968 41.83 29,962 66.07
3 Southern 43,736 4,732 10.82 23,368 53.43 32,979 75.40
4 Northern 20,370 2,226 10.93 8,253 40.52 12,735 62.52
5 Eastern 32,735 2,599 7.94 11,221 34.28 17,980 54.93
6 North Western 41,572 4,805 11.56 22,168 53.32 31,044 74.68
7 North Central 24,836 2,391 9.63 11,563 46.56 17,478 70.37
8 Uva 24,076 2,274 9.45 10,756 44.68 16,435 68.26
9 Sabaragamuwa 32,874 3,567 10.85 16,818 51.16 24,033 73.11
350,462 33,163 9.46 164,707 47.00 243,236 69.40 Island
Province Number
Sat Above Cut off
Obtained marks 100 and above (above 50
for each paper)
Obtained marks 70 and above (above 35
for each paper)

- 7 -
* Percentage is calculated based on the number sat of each Province
Province Above Cut
off %
North Western 11.56
Northern 10.93
Sabaragamuwa 10.85
Southern 10.82
North Central 9.63
Uva 9.45
Western 8.97
Eastern 7.94
Central 6.50
Island 9.46
Percentage distribution of candidates who obtained
marks above cut off by province *
Table 4.1
Percentage distribution of candidates who obtained
marks 100 and above by province *
Table 4.2
Percentage distribution of candidates who obtained
marks 70 and above by province *
Table 4.3
Province Obtained marks 100 and above (above 50 for each paper) %
Southern 53.43
North Western 53.32
Sabaragamuwa 51.16
Western 48.98
North Central 46.56
Uva 44.68
Central 41.83
Northern 40.52
Eastern 34.28
Island 47.00
2.5 Performance of Candidates by Province Arranged in Descending Order - 2017
Grade 5 Scholarship Examination - 2017
Province
Obtained marks 70 and above (above 35 for each paper)
%
Southern 75.40
North Western 74.68
Sabaragamuwa 73.11
Western 71.36
North Central 70.37
Uva 68.26
Central 66.07
Northern 62.52
Eastern 54.93
Island 69.40
Obtained marks 70 and above (above
35 for each paper) %

- 8 -
2.6 Performance of Candidates by District from 2013 to 2017
Table 5 :
Grade 5 Scholarship Examinations 2013 - 2017Distribution of number of candidates who obtained marks
above District Cut Off by District and Year
* Percentage is calculated based on the number sat of each district
No. % No. % No. % No. % No. %
Colombo 2944 9.12 3051 9.22 3049 9.17 2856 8.59 2701 8.18
Gampaha 3335 10.90 3388 11.00 3309 10.63 3040 9.72 3048 9.56
Kalutara 1854 9.92 1986 10.52 1893 9.82 1755 8.80 1870 9.34
Kandy 1637 7.38 1655 7.32 1519 6.86 1632 7.23 1508 6.51
Matale 545 6.73 616 7.44 528 6.63 599 7.36 697 8.12
Nuwara Eliya 765 5.92 743 5.84 787 6.11 885 6.44 745 5.48
Galle 1837 10.69 1876 10.73 1666 9.55 1659 9.04 1695 9.26
Matara 1438 11.20 1422 11.06 1402 10.40 1466 10.37 1494 13.77
Hambantota 1427 13.89 1351 12.78 1269 11.84 1498 13.30 1543 13.77
Jaffna 1120 12.39 1196 12.69 1261 13.41 1187 12.42 1226 13.50
Kilinochchi 159 6.84 167 6.70 194 8.05 195 7.90 225 7.25
Mannar 171 9.42 182 8.55 160 7.57 124 5.83 154 6.30
Vavuniya 357 13.10 332 11.78 331 11.69 340 11.65 351 11.56
Mullativu 131 7.79 187 9.86 202 9.57 179 7.99 270 9.97
Batticaloa 887 9.73 887 9.43 879 8.25 921 8.44 921 8.72
Ampara 1267 10.93 1042 9.04 1058 8.17 1219 8.87 1171 8.59
Trincomalee 533 7.50 451 6.43 563 7.32 509 6.06 507 5.94
Kurunegala 3211 12.43 3324 12.62 3057 11.34 3180 11.57 3712 13.34
Puttalam 1051 8.85 1065 8.68 1092 8.73 1088 8.46 1093 7.95
Anuradhapura 1483 9.86 1502 9.91 1514 9.79 1575 9.81 1597 9.32
Polonnaruwa 730 10.91 632 9.28 683 9.48 792 10.99 794 10.30
Badulla 1565 10.85 1401 9.68 1457 10.07 1556 10.66 1503 10.09
Monaragala 664 8.54 649 8.16 715 9.06 861 10.10 771 8.40
Ratnapura 2116 12.32 2081 12.07 1904 11.07 2136 11.75 2092 11.18
Kegalle 1390 10.56 1549 11.54 1361 10.09 1394 10.07 1475 10.41
Island 32617 10.12 32735 9.99 31853 9.55 32646 9.50 33163 9.46
20172016 District
2013 2014 2015

- 9 -
2.7 Performance of Candidates by District - 2017
Table 6 :
Grade 5 Scholarship Examination - 2017Distribution of candidates who sat the examination, above Cut Off,
obtained marks above 100 and above 70 by District
* Percentage is calculated based on the number sat of each district
Number % Number % Number %
1 Colombo 33,018 2,701 8.18 15,538 47.06 23,006 69.68
2 Gampaha 31,880 3,048 9.56 16,350 51.29 23,477 73.64
3 Kalutara 20,015 1,870 9.34 9,704 48.48 14,107 70.48
4 Kandy 23,166 1,508 6.51 10,423 44.99 16,103 69.51
5 Matale 8,579 697 8.12 3,977 46.36 6,037 70.37
6 Nuwara Eliya 13,605 745 5.48 4,568 33.58 7,822 57.49
7 Galle 18,309 1,695 9.26 9,354 51.09 13,448 73.45
8 Matara 14,220 1,494 13.77 7,682 56.50 10,821 77.72
9 Hambantota 11,207 1,543 13.77 6,332 56.50 8,710 77.72
10 Jaffna 9,080 1,226 13.50 4,130 45.48 5,978 65.84
11 Kilinochchi 3,102 225 7.25 1,021 32.91 1,730 55.77
12 Mannar 2,443 154 6.30 765 31.31 1,340 54.85
13 Vavuniya 3,036 351 11.56 1,253 41.27 1,995 65.71
14 Mullaitivu 2,709 270 9.97 1,084 40.01 1,692 62.46
15 Batticaloa 10,561 921 8.72 3,482 32.97 5,457 51.67
16 Ampara 13,638 1,171 8.59 5,345 39.19 8,455 62.00
17 Trincomalee 8,536 507 5.94 2,394 28.05 4,068 47.66
18 Kurunegala 27,831 3,712 13.34 16,471 59.18 22,236 79.90
19 Puttalam 13,741 1,093 7.95 5,697 41.46 8,808 64.10
20 Anuradhapura 17,127 1,597 9.32 7,899 46.12 12,005 70.09
21 Polonnaruwa 7,709 794 10.30 3,664 47.53 5,473 70.99
22 Badulla 14,895 1,503 10.09 6,899 46.32 10,350 69.49
23 Monaragala 9,181 771 8.40 3,857 42.01 6,085 66.28
24 Ratnapura 18,705 2,092 11.18 9,404 50.28 13,461 71.96
25 Kegalle 14,169 1,475 10.41 7,414 52.33 10,572 74.61
350,462 33,163 9.46 164,707 47.00 243,236 69.40 Island
District Number
Sat Above Cut off
Obtained marks 100 and above (above 50
for each paper)
Obtained marks 70 and above (above 35
for each paper)

- 10 -
Figure 5 :
-
10
20
30
40
50
60
70
80
90
100
Percentage
Dist
rict
Gra
de 5
Sch
olar
ship
Exa
min
atio
n -2
017
Dist
ribu
tion
of c
andi
date
s who
sat t
he E
xam
inat
ion,
Ab
oveCu
toff,Obtaine
dmarksabo
ve100
and
abo
ve70byDistrict
Abo
ve C
ut o
ff
100
and
abov
e
70 a
nd a
bove
0
Gra
de 5
Sch
olar
ship
Exa
min
atio
n - 2
017
Dist
ribu
tion
of c
andi
date
s who
sat t
he e
xam
inat
ion,
abo
ve C
ut O
ff,
obta
ined
mar
ks a
bove
100
and
abo
ve 7
0 by
Dist
rict

- 11 -
2.8 Performance of Candidates by District, Arranged in Descending Order
Grade 5 Scholarship Examination - 2017
Matara 13.77
Hambantota 13.77
Jaffna 13.50
Kurunegala 13.34
Vavuniya 11.56
Ratnapura 11.18
Kegalle 10.41
Polonnaruwa 10.30
Badulla 10.09
Mullaitivu 9.97
Gampaha 9.56
Kalutara 9.34
Anuradhapura 9.32
Galle 9.26
Batticaloa 8.72
Ampara 8.59
Monaragala 8.40
Colombo 8.18
Matale 8.12
Puttalam 7.95
Kilinochchi 7.25
Kandy 6.51
Mannar 6.30
Trincomalee 5.94
Nuwara Eliya 5.48
Island 9.46
District Above Cut off %
Kurunegala 79.90
Matara 77.72
Hambantota 77.72
Kegalle 74.61
Gampaha 73.64
Galle 73.45
Ratnapura 71.96
Polonnaruwa 70.99
Kalutara 70.48
Matale 70.37
Anuradhapura 70.09
Colombo 69.68
Kandy 69.51
Badulla 69.49
Monaragala 66.28
Jaffna 65.84
Vavuniya 65.71
Puttalam 64.10
Mullaitivu 62.46
Ampara 62.00
Nuwara Eliya 57.49
Kilinochchi 55.77
Mannar 54.85
Batticaloa 51.67
Trincomalee 47.66
Island 69.40
District Obtained marks 70
and above (above 35 for each paper) %
Kurunegala 59.18
Matara 56.50
Hambantota 56.50
Kegalle 52.33
Gampaha 51.29
Galle 51.09
Ratnapura 50.28
Kalutara 48.48
Polonnaruwa 47.53
Colombo 47.06
Matale 46.36
Badulla 46.32
Anuradhapura 46.12
Jaffna 45.48
Kandy 44.99
Monaragala 42.01
Puttalam 41.46
Vavuniya 41.27
Mullaitivu 40.01
Ampara 39.19
Nuwara Eliya 33.58
Batticaloa 32.97
Kilinochchi 32.91
Mannar 31.31
Trincomalee 28.05
Island 47.00
District Obtained marks 100 and above (above 50
for each paper) %
Percentage distribution of candidates who obtained
marks above cut off by District *
Table 7.1
Percentage distribution of candidates who obtained
marks 70 and above by District *
Table 7.2
Percentage distribution of candidates who obtained
marks 100 and above by District *
Table 7.3
* Percentage is calculated based on the number sat of each District

- 12 -
2.9 Performance of Candidates by Province and Income Level
Table 8 :
Figure 6 :
0
5
10
15
20
25
30
35
Per
cent
age
Province
Grade 5 Scholarship Examination - 2017Percentage distribution of number of candidates who obtained marks
above cut off by Province and Income Level
Higher Income
Lower Income
Grade 5 Scholarship Examination - 2017Percentage distribution of number of candidates who obtained marks
above cut off by Province and Income Level
Perc
enta
ge
Province
No. % No. %
Western 37267 4946 13.27 47646 2673 5.61
Central 14647 1639 11.19 30703 1311 4.27
Southern 13450 2392 17.78 30286 2340 7.73
Northern 3360 937 27.89 17010 1289 7.58
Eastern 6903 1526 22.11 25832 1073 4.15
North Western 12588 2625 20.85 28984 2180 7.52
North Central 8995 1399 15.55 15841 992 6.26
Uva 7356 1287 17.50 16720 987 5.90
Sabaragamuwa 8082 1682 20.81 24792 1885 7.60
Island 112648 18433 16.36 237814 14730 6.19
Province
Income Level
Higher Income Lower Income
No.SatAbove cut off
No.SatAbove cut off
Grade 5 Scholarship Examination - 2017Distribution of number of candidates sat the examination, number of
candidates who obtained marks above cut off by Province and Income Level

- 13 -
2.10 Performance of Candidates by Province and Gender
Table 9 :
Figure 7 :
0
2
4
6
8
10
12
14
Percentage
Province
Grade 5 Scholarship Examination - 2017Percentage distribution of number of candidates who obtained marks
above cut off by Province and Gender
Male
Female
Grade 5 Scholarship Examination - 2017Percentage distribution of number of candidates who obtained marks
above cut off by Province and Gender
Perc
enta
ge
Province
No. % No. %
Western 42866 3637 8.48 42047 3982 9.47
Central 22663 1356 5.98 22687 1594 7.03
Southern 22207 2279 10.26 21529 2453 11.39
Northern 10358 1101 10.63 10007 1125 11.24
Eastern 16521 1267 7.67 16240 1334 8.21
North Western 21000 2328 11.09 20572 2477 12.04
North Central 12557 1150 9.16 12258 1239 10.11
Uva 12083 1041 8.62 11993 1233 10.28
Sabaragamuwa 16510 1637 9.92 16364 1930 11.79
Island 176765 15796 8.94 173697 17367 10.00
Male Female
No.Sat
Province
Gender
Above cut offNo.Sat
Above cut off
Grade 5 Scholarship Examination - 2017Distribution of number of candidates sat the examination, number of
candidates who obtained marks above cut off by Province and Gender

- 14 -
2.11 Performance of Candidates by Province and Medium Table 10 :
Figure 8 :
Province
0
2
4
6
8
10
12
14
16
18
Per
cent
age
Province
Grade 5 Scholarship Examination - 2017Percentage distribution of number of candidates who obtained marks
above cut off by Province and Medium
Sinhala
Tamil
Grade 5 Scholarship Examination - 2017Percentage distribution of number of candidates who obtained marks
above cut off by Province and Medium
Perc
enta
ge
No. % No. %
Western 77476 7212 9.3 7437 407 5.5
Central 29911 2220 7.4 15439 730 4.7
Southern 42476 4692 11.0 1260 40 3.2
Northern 471 20 4.2 19894 2206 11.1
Eastern 6991 555 7.9 25770 2046 7.9
North Western 35764 4555 12.7 5808 250 4.3
North Central 22284 2277 10.2 2531 112 4.4
Uva 19633 2018 10.3 4443 256 5.8
Sabaragamuwa 28474 3338 11.7 4400 229 5.2
Island 263480 26887 10.2 86982 6276 7.2
No.SatAbove cut off
Province
Medium
Sinhala Tamil
No.SatAbove cut off
Grade 5 Scholarship Examination - 2017Distribution of number of candidates sat the examination, number of
candidates who obtained marks above cut off by Province and Medium

- 15 -
2.12 Performance of Candidates by Education Zone - 2017
Table 11 :Grade 5 Scholarship Examination - 2017
Distribution of candidates who sat the examination, above Cut Off obtained marks above 100 and above 70 by Education Zone
Number % Number % Number %
1 Colombo 13,172 915 6.95 5,526 41.95 8508 64.59
2 Sri Jayawardanapura 8,191 691 8.44 4,245 51.83 6,111 74.613 Homagama 5,540 622 11.23 2,895 52.26 4,121 74.394 Piliyandala 6,115 473 7.74 2,872 46.97 4,266 69.765 Gampaha 8,668 1,180 13.61 5,234 60.38 6,917 79.806 Kelaniya 8,369 688 8.22 3,968 47.41 5,975 71.397 Minuwangoda 6,549 746 11.39 3,639 55.57 5,029 76.798 Negombo 8,294 434 5.23 3,509 42.31 5,556 66.999 Kalutara 9,967 760 7.63 4,431 44.46 6,677 66.99
10 Matugama 3,728 349 9.36 1,925 51.64 2,768 74.2511 Horana 6,320 761 12.04 3,348 52.97 4,662 73.7712 Kandy 6,423 502 7.82 3,339 51.99 4,868 75.7913 Denuwara 2,790 163 5.84 1,222 43.80 1,976 70.8214 Gampola 4,511 298 6.61 1,751 38.82 2,835 62.8515 Teldeniya 2,363 152 6.43 1,035 43.80 1,646 69.6616 Wattegama 3,285 188 5.72 1,455 44.29 2,250 68.4917 Katugastota 3,794 205 5.40 1,621 42.73 2,528 66.6318 Matale 3,906 321 8.22 1,801 46.11 2,699 69.1019 Galewela 3,164 279 8.82 1,549 48.96 2,298 72.6320 Naula 729 39 5.35 298 40.88 504 69.1421 Wilgamuwa 780 58 7.44 329 42.18 536 68.7222 Nuwara Eliya 4,163 172 4.13 1,062 25.51 2,034 48.8623 Kotmale 1,874 125 6.67 712 37.99 1,155 61.6324 Hatton 4,078 254 6.23 1,381 33.86 2,345 57.5025 Walapane 1,782 87 4.88 656 36.81 1,131 63.4726 Hanguranketha 1,708 107 6.26 757 44.32 1,157 67.7427 Galle 7,970 799 10.03 4,180 52.45 5,934 74.4528 Elpitiya 4,088 382 9.34 2,113 51.69 3,013 73.7029 Ambalangoda 3,926 279 7.11 1,888 48.09 2,813 71.6530 Udugama 2,325 235 10.11 1,173 50.45 1,688 72.6031 Matara 5,718 634 11.09 3,080 53.86 4,336 75.8332 Akuressa 2,720 318 11.69 1,522 55.96 2,085 76.6533 Mulatiyana 2,910 352 12.10 1,753 60.24 2,369 81.4134 Morawaka 2,872 190 6.62 1,327 46.20 2,031 70.7235 Tangalle 3,048 526 17.26 1,905 62.50 2,478 81.3036 Hambantota 5,278 566 10.72 2,701 51.17 3,880 73.5137 Walasmulla 2,881 451 15.65 1,726 59.91 2,352 81.6438 Jaffna 2,999 532 17.74 1,581 52.72 2,154 71.8239 Islands 692 37 5.35 194 28.03 353 51.0140 Thenmarachchi 860 96 11.16 397 46.16 591 68.7241 Valikamam 2,786 292 10.48 1,108 39.77 1,698 60.9542 Vadamarachchi 1,743 269 15.43 850 48.77 1,182 67.8143 Kilinochchi 3,102 225 7.25 1,021 32.91 1,730 55.7744 Mannar 1,908 122 6.39 600 31.45 1,037 54.3545 Madhu 535 32 5.98 165 30.84 303 56.6446 Vavuniya South 2,384 290 12.16 1,026 43.04 1,594 66.8647 Vavuniya North 652 61 9.36 227 34.82 401 61.5048 Mullaitivu 1,933 229 11.85 838 43.35 1,255 64.9249 Thunukkai 776 41 5.28 246 31.70 437 56.3150 Batticaloa 2,120 331 15.61 968 45.66 1,391 65.61
Education ZoneNumber
Sat Above Cut off
Obtained marks 100 and above (above 50
for each paper)
Obtained marks 70 and above (above 35
for each paper)

- 16 -
Grade 5 Scholarship Examination - 2017Distribution of candidates who sat the examination, above Cut Off
obtained marks above 100 and above 70 by Education Zone
Number % Number % Number %
51 Kalkudah 2,317 125 5.39 509 21.97 911 39.3252 Paddirippu 1,685 124 7.36 562 33.35 908 53.8953 Batticaloa Central 3,231 291 9.01 1,150 35.59 1,738 53.7954 Batticaloa West 1,208 50 4.14 293 24.25 509 42.1455 Ampara 3,117 306 9.82 1,498 48.06 2,240 71.8656 Kalmunai 3,016 332 11.01 1,140 37.80 1,810 60.0157 Sammanthurai 2,057 101 4.91 619 30.09 1,093 53.1458 Mahaoya 813 39 4.80 276 33.95 515 63.3559 Dehiattakandiya 1,069 101 9.45 498 46.59 776 72.5960 Akkaraipattu 2,489 188 7.55 918 36.88 1399 56.2161 Thirukkovil 1,077 104 9.66 396 36.77 622 57.7562 Trincomalee 2,584 255 9.87 942 36.46 1,495 57.8663 Muthur 1,862 109 5.85 511 27.44 828 44.4764 Kantale 1,272 75 5.90 444 34.91 752 59.1265 Kinniya 2,307 53 2.30 347 15.04 706 30.6066 Trincomalee North 511 15 2.94 150 29.35 287 56.1667 Kurunegala 6,063 717 11.83 3,544 58.45 4,849 79.9868 Kuliyapitiya 4,908 793 16.16 3,028 61.70 4,012 81.7469 Nikaweratiya 3,709 597 16.10 2,478 66.81 3,150 84.9370 Maho 5,088 644 12.66 2,914 57.27 3,982 78.2671 Giriullla 4,561 647 14.19 2,689 58.96 3,645 79.9272 Ibbagamuwa 3,502 314 8.97 1,818 51.91 2,598 74.1973 Puttalam 7,081 504 7.12 2,569 36.28 4,121 58.2074 Chilaw 6,660 589 8.84 3,128 46.97 4,687 70.3875 Anuradhapura 5,256 474 9.02 2,415 45.95 3,667 69.7776 Thambuttegama 3,345 377 11.27 1,693 50.61 2,480 74.1477 Kekirawa 3,444 364 10.57 1,569 45.56 2,385 69.2578 Galenbindunuwewa 2,274 187 8.22 1,014 44.59 1,580 69.4879 Kebithigollewa 2,808 195 6.94 1,208 43.02 1,893 67.4180 Polonnaruwa 2,360 352 14.92 1245 52.75 1,722 72.9781 Hingurakgoda 3,246 297 9.15 1555 47.91 2,343 72.1882 Dimbulagala 2,103 145 6.89 864 41.08 1,408 66.9583 Badulla 3,063 391 12.77 1,574 51.39 2,226 72.6784 Bandarawela 3,549 419 11.81 1755 49.45 2,562 72.1985 Mahiyanganaya 2,416 219 9.06 1,055 43.67 1,679 69.5086 Welimada 3,151 303 9.62 1,472 46.72 2,176 69.0687 Passara 1,594 79 4.96 539 33.81 934 58.5988 Viyaluwa 1,122 92 8.20 504 44.92 773 68.8989 Monaragala 3,277 280 8.54 1,399 42.69 2,149 65.5890 Wellawaya 2,189 196 8.95 966 44.13 1,503 68.6691 Bibile 2,191 168 7.67 895 40.85 1,435 65.5092 Thanamalwila 1,524 127 8.33 597 39.17 998 65.4993 Ratnapura 7,027 810 11.53 3,464 49.30 5,017 71.4094 Balangoda 3,366 426 12.66 1808 53.71 2,509 74.5495 Nivitigala 3,171 271 8.55 1,427 45.00 2,116 66.7396 Embilipitiya 5,141 585 11.38 2705 52.62 3,819 74.2997 Kegalle 4,902 613 12.51 2968 60.55 4,000 81.6098 Mawanella 4,489 452 10.07 2297 51.17 3,353 74.69
99 Dehiowita 4,778 410 8.58 2,149 44.98 3,219 67.37
350,462 33,163 9.46 164,707 47.00 243,236 69.40
Education ZoneNumber
Sat Above Cut off
Obtained marks 100 and above (above 50
for each paper)
Obtained marks 70 and above (above 35
for each paper)
Island

- 17 -
2.13 Performance of Candidates by Education Zone Arranged in Descending Order - 2017
Grade 5 Scholarship Examination - 2017
Percentage Distribution of candidates who obtained marks above cut off by Education Zone *
Table 12.1
Above Cut off %
1 Jaffna 17.74
2 Tangalle 17.26 3 Kuliyapitiya 16.16 4 Nikaweratiya 16.10 5 Walasmulla 15.65 6 Batticaloa 15.61 7 Vadamarachchi 15.43 8 Polonnaruwa 14.92 9 Giriullla 14.19 10 Gampaha 13.61 11 Badulla 12.77 12 Maho 12.66 13 Balangoda 12.66 14 Kegalle 12.51 15 Vavuniya South 12.16 16 Mulatiyana 12.10 17 Horana 12.04 18 Mullaitivu 11.85 19 Kurunegala 11.83 20 Bandarawela 11.81 21 Akuressa 11.69 22 Ratnapura 11.53 23 Minuwangoda 11.39 24 Embilipitiya 11.38 25 Thambuttegama 11.27 26 Homagama 11.23 27 Thenmarachchi 11.16 28 Matara 11.09 29 Kalmunai 11.01 30 Hambantota 10.72 31 Kekirawa 10.57 32 Valikamam 10.48 33 Udugama 10.11 34 Mawanella 10.07 35 Galle 10.03 36 Trincomalee 9.87 37 Ampara 9.82 38 Thirukkovil 9.66 39 Welimada 9.62 40 Dehiattakandiya 9.45 41 Matugama 9.36 42 Vavuniya North 9.36 43 Elpitiya 9.34 44 Hingurakgoda 9.15 45 Mahiyanganaya 9.06 46 Anuradhapura 9.02 47 Batticaloa Central 9.01 48 Ibbagamuwa 8.97 49 Wellawaya 8.95 50 Chilaw 8.84
Education Zone
* Percentage is calculated based on the number sat of each Education Zone
Above Cut off %
51 Galewela 8.82
52 Dehiowita 8.58 53 Nivitigala 8.55 54 Monaragala 8.54 55 Sri Jayawardanapura 8.44 56 Thanamalwila 8.33 57 Galenbindunuwewa 8.22 58 Kelaniya 8.22 59 Matale 8.22 60 Viyaluwa 8.20 61 Kandy 7.82 62 Piliyandala 7.74 63 Bibile 7.67 64 Kalutara 7.63 65 Akkaraipattu 7.55 66 Wilgamuwa 7.44 67 Paddirippu 7.36 68 Kilinochchi 7.25 69 Puttalam 7.12 70 Ambalangoda 7.11 71 Colombo 6.95 72 Kebithigollewa 6.94 73 Dimbulagala 6.89 74 Kotmale 6.67 75 Morawaka 6.62 76 Gampola 6.61 77 Teldeniya 6.43 78 Mannar 6.39 79 Hanguranketha 6.26 80 Hatton 6.23 81 Madhu 5.98 82 Kantale 5.90 83 Muthur 5.85 84 Denuwara 5.84 85 Wattegama 5.72 86 Katugastota 5.40 87 Kalkudah 5.39 88 Naula 5.35 89 Islands 5.35 90 Thunukkai 5.28 91 Negombo 5.23 92 Passara 4.96 93 Sammanthurai 4.91 94 Walapane 4.88 95 Mahaoya 4.80 96 Batticaloa West 4.14 97 Nuwara Eliya 4.13 98 Trincomalee North 2.94 99 Kinniya 2.30
9.46
Education Zone
Island

- 18 -
Percentage Distribution of candidates who obtained marks 100 and above by Education Zone *
Table 12.2
* Percentage is calculated based on the number sat of each Education Zone
Obtained marks 100 and above (above 50 for each paper) %
1 Nikaweratiya 66.81
2 Tangalle 62.50 3 Kuliyapitiya 61.70 4 Kegalle 60.55 5 Gampaha 60.38 6 Mulatiyana 60.24 7 Walasmulla 59.91 8 Giriullla 58.96 9 Kurunegala 58.45
10 Maho 57.27 11 Akuressa 55.96 12 Minuwangoda 55.57 13 Matara 53.86 14 Balangoda 53.71 15 Horana 52.97 16 Polonnaruwa 52.75 17 Jaffna 52.72 18 Embilipitiya 52.62 19 Galle 52.45 20 Homagama 52.26 21 Kandy 51.99 22 Ibbagamuwa 51.91 23 Sri Jayawardanapura 51.83 24 Elpitiya 51.69 25 Matugama 51.64 26 Badulla 51.39 27 Hambantota 51.17 28 Mawanella 51.17 29 Thambuttegama 50.61 30 Udugama 50.45 31 Bandarawela 49.45 32 Ratnapura 49.30 33 Galewela 48.96 34 Vadamarachchi 48.77 35 Ambalangoda 48.09 36 Ampara 48.06 37 Hingurakgoda 47.91 38 Kelaniya 47.41 39 Chilaw 46.97 40 Piliyandala 46.97 41 Welimada 46.72 42 Dehiattakandiya 46.59 43 Morawaka 46.20 44 Thenmarachchi 46.16 45 Matale 46.11 46 Anuradhapura 45.95 47 Batticaloa 45.66 48 Kekirawa 45.56 49 Nivitigala 45.00 50 Dehiowita 44.98
Education ZoneObtained marks 100 and above (above 50 for each paper) %
51 Viyaluwa 44.92
52 Galenbindunuwewa 44.59 53 Kalutara 44.46 54 Hanguranketha 44.32 55 Wattegama 44.29 56 Wellawaya 44.13 57 Teldeniya 43.80 58 Denuwara 43.80 59 Mahiyanganaya 43.67 60 Mullaitivu 43.35 61 Vavuniya South 43.04 62 Kebithigollewa 43.02 63 Katugastota 42.73 64 Monaragala 42.69 65 Negombo 42.31 66 Wilgamuwa 42.18 67 Colombo 41.95 68 Dimbulagala 41.08 69 Naula 40.88 70 Bibile 40.85 71 Valikamam 39.77 72 Thanamalwila 39.17 73 Gampola 38.82 74 Kotmale 37.99 75 Kalmunai 37.80 76 Akkaraipattu 36.88 77 Walapane 36.81 78 Thirukkovil 36.77 79 Trincomalee 36.46 80 Puttalam 36.28 81 Batticaloa Central 35.59 82 Kantale 34.91 83 Vavuniya North 34.82 84 Mahaoya 33.95 85 Hatton 33.86 86 Passara 33.81 87 Paddirippu 33.35 88 Kilinochchi 32.91 89 Thunukkai 31.70 90 Mannar 31.45 91 Madhu 30.84 92 Sammanthurai 30.09 93 Trincomalee North 29.35 94 Islands 28.03 95 Muthur 27.44 96 Nuwara Eliya 25.51 97 Batticaloa West 24.25 98 Kalkudah 21.97 99 Kinniya 15.04
47.00 Island
Education Zone

- 19 -
* Percentage is calculated based on the number sat of each Education Zone
Percentage Distribution of candidates who obtained marks 70 and above by Education Zone *
Table 12.3
Obtained marks 70 and above (above 35 for each paper) %
1 Nikaweratiya 84.93
2 Kuliyapitiya 81.743 Walasmulla 81.644 Kegalle 81.605 Mulatiyana 81.416 Tangalle 81.307 Kurunegala 79.988 Giriullla 79.929 Gampaha 79.80
10 Maho 78.2611 Minuwangoda 76.7912 Akuressa 76.6513 Matara 75.8314 Kandy 75.7915 Mawanella 74.6916 Sri Jayawardanapura 74.6117 Balangoda 74.5418 Galle 74.4519 Homagama 74.3920 Embilipitiya 74.2921 Matugama 74.2522 Ibbagamuwa 74.1923 Thambuttegama 74.1424 Horana 73.7725 Elpitiya 73.7026 Hambantota 73.5127 Polonnaruwa 72.9728 Badulla 72.6729 Galewela 72.6330 Udugama 72.6031 Dehiattakandiya 72.5932 Bandarawela 72.1933 Hingurakgoda 72.1834 Ampara 71.8635 Jaffna 71.8236 Ambalangoda 71.6537 Ratnapura 71.4038 Kelaniya 71.3939 Denuwara 70.8240 Morawaka 70.7241 Chilaw 70.3842 Anuradhapura 69.7743 Piliyandala 69.7644 Teldeniya 69.6645 Mahiyanganaya 69.5046 Galenbindunuwewa 69.4847 Kekirawa 69.2548 Naula 69.1449 Matale 69.1050 Welimada 69.06
Education ZoneObtained marks 70 and above (above 35 for each paper) %
51 Viyaluwa 68.89
52 Thenmarachchi 68.7253 Wilgamuwa 68.7254 Wellawaya 68.6655 Wattegama 68.4956 Vadamarachchi 67.8157 Hanguranketha 67.7458 Kebithigollewa 67.4159 Dehiowita 67.3760 Kalutara 66.9961 Negombo 66.9962 Dimbulagala 66.9563 Vavuniya South 66.8664 Nivitigala 66.7365 Katugastota 66.6366 Batticaloa 65.6167 Monaragala 65.5868 Bibile 65.5069 Thanamalwila 65.4970 Mullaitivu 64.9271 Colombo 64.5972 Walapane 63.4773 Mahaoya 63.3574 Gampola 62.8575 Kotmale 61.6376 Vavuniya North 61.5077 Valikamam 60.9578 Kalmunai 60.0179 Kantale 59.1280 Passara 58.5981 Puttalam 58.2082 Trincomalee 57.8683 Thirukkovil 57.7584 Hatton 57.5085 Madhu 56.6486 Thunukkai 56.3187 Akkaraipattu 56.2188 Trincomalee North 56.1689 Kilinochchi 55.7790 Mannar 54.3591 Paddirippu 53.8992 Batticaloa Central 53.7993 Sammanthurai 53.1494 Islands 51.0195 Nuwara Eliya 48.8696 Muthur 44.4797 Batticaloa West 42.1498 Kalkudah 39.3299 Kinniya 30.60
69.40
Education Zone
Island
- 20 -
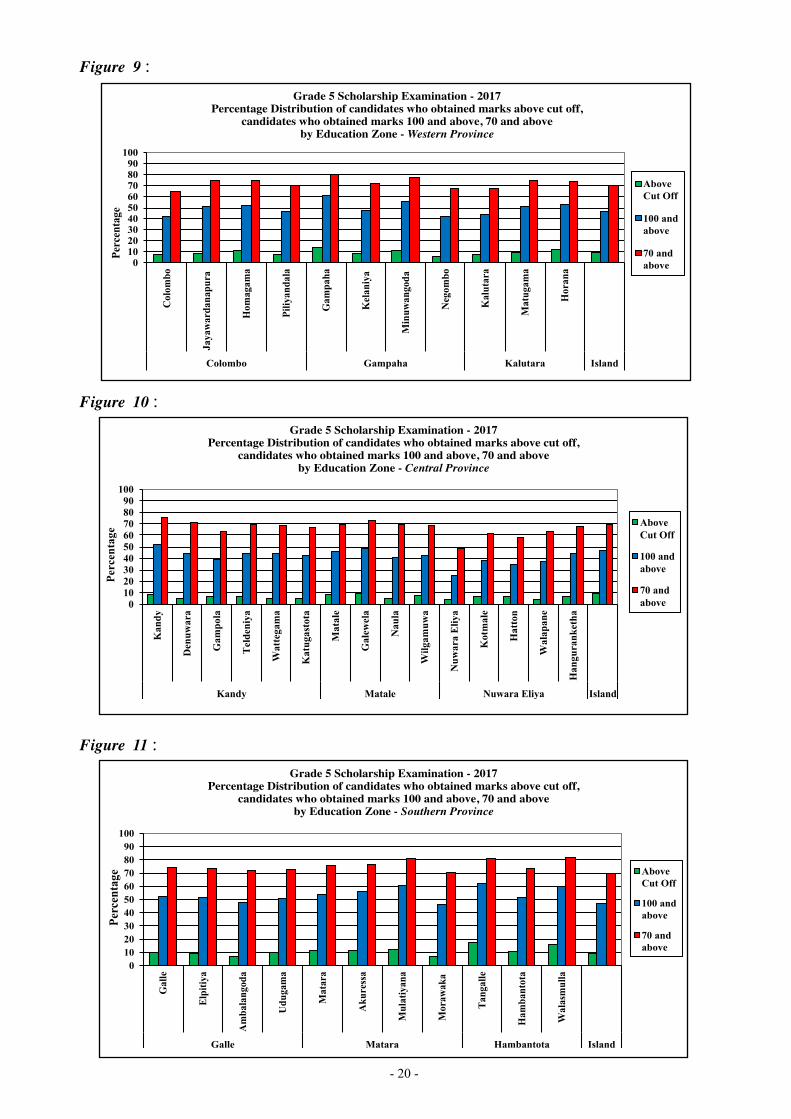
Figure 9 :
0102030405060708090
100C
olom
bo
Jaya
war
dana
pura
Hom
agam
a
Pili
yand
ala
Gam
paha
Kel
aniy
a
Min
uwan
goda
Neg
ombo
Kal
utar
a
Mat
ugam
a
Hor
ana
Colombo Gampaha Kalutara Island
Per
cent
age
Grade 5 Scholarship Examination - 2017PerformanceofCandidates
Western Province
Above Cut Off
100 and above
70 and above
Grade 5 Scholarship Examination - 2017Percentage Distribution of candidates who obtained marks above cut off,
candidates who obtained marks 100 and above, 70 and above by Education Zone - Western Province
Figure 10 :
0102030405060708090
100
Kan
dy
Den
uwar
a
Gam
pola
Tel
deni
ya
Wat
tega
ma
Kat
ugas
tota
Mat
ale
Gal
ewel
a
Nau
la
Wilg
amuw
a
Nuw
ara
Eliy
a
Kot
mal
e
Hat
ton
Wal
apan
e
Han
gura
nket
ha
Kandy Matale Nuwara Eliya Island
Per
cent
age
Grade 5 Scholarship Examination - 2017Performance of Candidates
Central Province
Above Cut Off
100 and above
70 and above
Grade 5 Scholarship Examination - 2017Percentage Distribution of candidates who obtained marks above cut off,
candidates who obtained marks 100 and above, 70 and above by Education Zone - Central Province
Figure 11 :
0102030405060708090
100
Gal
le
Elp
itiy
a
Am
bala
ngod
a
Udu
gam
a
Mat
ara
Aku
ress
a
Mul
atiy
ana
Mor
awak
a
Tan
galle
Ham
bant
ota
Wal
asm
ulla
Galle Matara Hambantota Island
Per
cent
age
Grade 5 Scholarship Examination - 2017Performance of Candidates
Southern Province
Above Cut Off
100 and above
70 and above
Grade 5 Scholarship Examination - 2017Percentage Distribution of candidates who obtained marks above cut off,
candidates who obtained marks 100 and above, 70 and above by Education Zone - Southern Province

- 21 -
Figure 12 :
0
10
20
30
40
50
60
70
80
90
100Ba
ttica
loa
Kal
kuda
h
Padd
irip
pu
Batti
calo
a-C
entr
al
Batti
calo
a-W
est
Am
para
Kal
mun
ai
Sam
man
thur
ai
Mah
aoya
Deh
iatta
kand
iya
Akk
arai
pattu
Thir
ukko
vil
Trin
com
alee
Mut
ur
Kan
tale
Kin
niya
Trin
com
alee
Nor
th
Batticaloa Ampara Trincomalee Island
Perc
enta
geGrade 5 Scholarship Examination - 2017
Performance of CandidatesEastern Province
Above Cut Off
100 and above
70 and above
Grade 5 Scholarship Examination - 2017Percentage Distribution of candidates who obtained marks above cut off,
candidates who obtained marks 100 and above, 70 and above by Education Zone - Eastern Province
Figure 13 :
0
10
20
30
40
50
60
70
80
90
100
Jaffn
a
Isla
nds
Then
mar
achc
hi
Val
ikam
am
Vad
amar
achc
hi
Kili
noch
chi
Man
nar
Mad
hu
Vav
uniy
a so
uth
Vav
uniy
a N
orth
Mul
laiti
vu
Thun
ukka
i
Jaffana Kilino. Mannar Vavuniya Mullativu Island
Perc
enta
ge
Grade 5 Scholarship Examination - 2017PerformanceofCandidates
Northern Province
Above Cut Off
100 and above
70 and above
Grade 5 Scholarship Examination - 2017Percentage Distribution of candidates who obtained marks above cut off,
candidates who obtained marks 100 and above, 70 and above by Education Zone - Northern Province
Figure 14 :
0102030405060708090
100
Kur
uneg
ala
Kul
iyap
itiy
a
Nik
awer
atiy
a
Mah
o
Gir
iulla
Ibba
gam
uwa
Put
tala
m
Chi
law
Kurunegala Puttalam Island
Per
cent
age
Grade 5 Scholarship Examination - 2017Performance of Candidates
North Westren Province
Above Cut Off
100 and above
70 and above
Grade 5 Scholarship Examination - 2017Percentage Distribution of candidates who obtained marks above cut off,
candidates who obtained marks 100 and above, 70 and above by Education Zone - North western Province
- 22 -
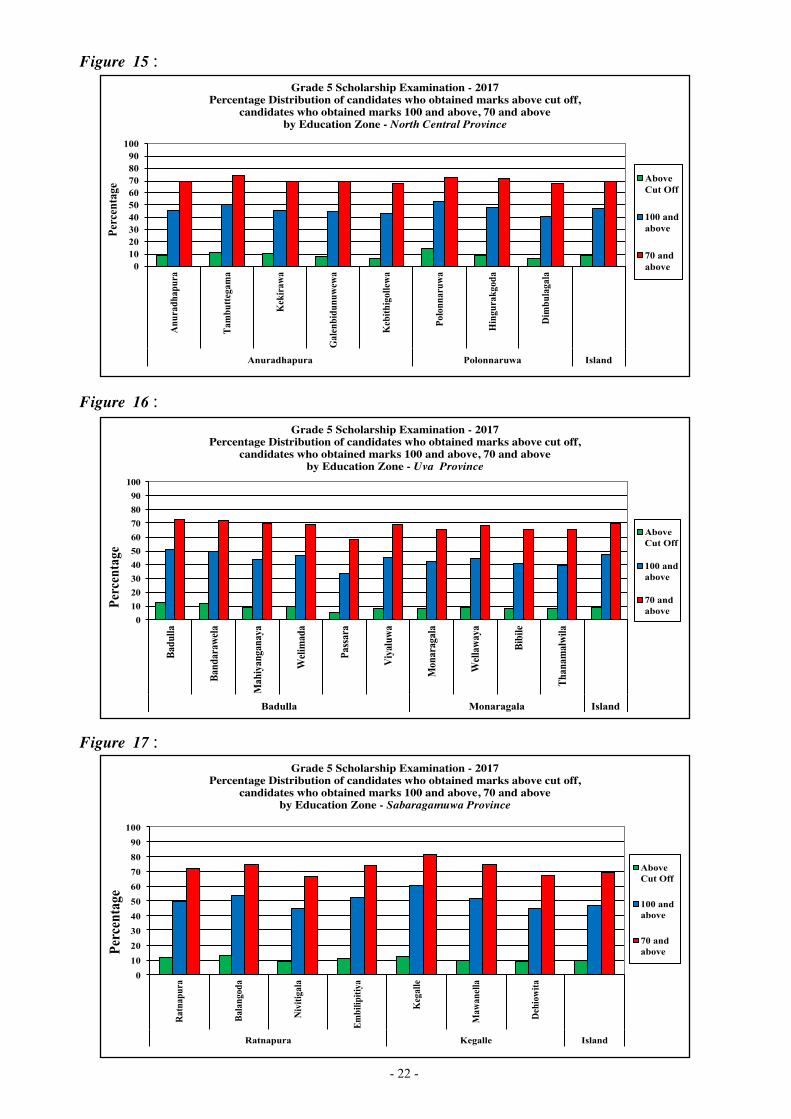
Figure 15 :
0102030405060708090
100
Anu
radh
apur
a
Tam
butt
egam
a
Kek
iraw
a
Gal
enbi
dunu
wew
a
Keb
ithi
golle
wa
Pol
onna
ruw
a
Hin
gura
kgod
a
Dim
bula
gala
Anuradhapura Polonnaruwa Island
Per
cent
age
Grade 5 Scholarship Examination - 2017PerformanceofCandidates
North Central Province
Above Cut Off
100 and above
70 and above
Grade 5 Scholarship Examination - 2017Percentage Distribution of candidates who obtained marks above cut off,
candidates who obtained marks 100 and above, 70 and above by Education Zone - North Central Province
Figure 16 :
0
10
20
30
40
50
60
70
80
90
100
Bad
ulla
Ban
dara
wel
a
Mah
iyan
gana
ya
Wel
imad
a
Pass
ara
Viy
aluw
a
Mon
arag
ala
Wel
law
aya
Bib
ile
Tha
nam
alw
ila
Badulla Monaragala Island
Per
cent
age
Grade 5 Scholarship Examination - 2017PerformanceofCandidates
Uva Province
Above Cut Off
100 and above
70 and above
Grade 5 Scholarship Examination - 2017Percentage Distribution of candidates who obtained marks above cut off,
candidates who obtained marks 100 and above, 70 and above by Education Zone - Uva Province
Figure 17 :
0
10
20
30
40
50
60
70
80
90
100
Rat
napu
ra
Bal
ango
da
Niv
itiga
la
Em
bilip
itiya
Keg
alle
Maw
anel
la
Deh
iow
ita
Ratnapura Kegalle Island
Perc
enta
ge
Grade 5 Scholarship Examination - 2017PerformanceofCandidatesSabaragamuwa Province
Above Cut Off
100 and above
70 and above
Grade 5 Scholarship Examination - 2017Percentage Distribution of candidates who obtained marks above cut off,
candidates who obtained marks 100 and above, 70 and above by Education Zone - Sabaragamuwa Province

- 23 -
F % CF % F % CF %
191 - 200 51 0.01 343757 100.00 249 0.07 350462 100.00
181 - 190 1349 0.39 343706 99.98 3793 1.08 350213 98.92
171 - 180 6548 1.90 342357 99.58 11605 3.31 346420 95.61
161 - 170 15043 4.38 335809 97.68 18329 5.23 334815 90.38
151 - 160 22755 6.62 320766 93.30 22127 6.31 316486 84.06
141 - 150 27237 7.92 298011 86.68 24062 6.87 294359 77.20
131 - 140 28962 8.43 270774 78.76 25053 7.15 270297 70.05
121 - 130 30181 8.78 241812 70.33 26221 7.48 245244 62.57
111 - 120 30820 8.97 211631 61.55 27218 7.77 219023 54.80
101 - 110 31689 9.22 180811 52.59 27827 7.94 191805 46.86
91 - 100 32807 9.54 149122 43.37 29234 8.34 163978 38.52
81 - 90 31291 9.10 116315 33.83 30610 8.73 134744 29.78
71 - 80 27575 8.02 85024 24.72 29923 8.54 104134 21.25
61 - 70 22649 6.59 57449 16.70 28446 8.12 74211 13.13
51 - 60 18021 5.24 34800 10.11 23958 6.84 45765 6.29
41 - 50 11218 3.26 16779 4.87 15530 4.43 21807 1.86
31 - 40 4140 1.20 5561 1.61 4994 1.42 6277 0.44
21 - 30 915 0.27 1421 0.40 928 0.26 1283 0.17
11 - 20 309 0.09 506 0.14 212 0.06 355 0.11
01 - 10 163 0.05 197 0.05 121 0.03 143 0.08
00 - 00 34 0.01 34 0.00 22 0.01 22 0.07
Mean 106.43107.86
2016 2017Class Interval
F : Frequency CF : Cumulative Frequency
3. Analyses of Question Papers
3.1 Comparison of Distribution of Total Marks - 2016 & 2017
Table 13 :Grade 5 Scholarship Examination - 2016 & 2017
Distribution of Frequencies of Total Marks by Year
Figure 18 :
Per
cent
age
of fr
eque
ncie
s of m
arks
Class Interval of marks
0
2
4
6
8
10
12
Perc
enta
ge o
f Fre
quen
cies
of m
arks
Class Interval of Marks
2016-2017
2016
2017
Grade 5 Scholarship Examination - 2016 & 2017Percentage Distribution of Frequencies of Total Marks by Year

- 24 -
3.2 Distribution of Frequencies of Marks for Paper I by Income Level
Table 14 :
Grade 5 Scholarship Examination - 2017Distribution of Frequencies of Marks for the Paper I by Income Level
Figure 19 :
0
5
10
15
20
25
00 -
00
01 -
09
10 -
19
20 -
29
30 -
39
40 -
49
50 -
59
60 -
69
70 -
79
80 -
89
90 -
100
Per
cent
age
of F
requ
enci
es o
f m
arks
Class Interval
Grade 5 Scholarship Examination - 2017 Percentage Distribution of Frequencies of Marks for paper I by Income
Level
Lower
Higher
All
Per
cent
age
of fr
eque
ncie
s of m
arks
Grade 5 Scholarship Examination - 2017Percentage Distribution of Frequencies of Marks for Paper I by Income Level
F : Frequency CF : Cumulative Frequency
F % CF % F % CF % F % CF %
90 - 100 6768 2.85 237810 100.00 9610 8.53 112648 100.00 16378 4.67 350458 100.00
80 - 89 17928 7.54 231042 97.15 17396 15.44 103038 91.47 35324 10.08 334080 95.33
70 - 79 26969 11.34 213114 89.62 20023 17.77 85642 76.03 46992 13.41 298756 85.25
60 - 69 36401 15.31 186145 78.27 20505 18.20 65619 58.25 56906 16.24 251764 71.84
50 - 59 49064 20.63 149744 62.97 19908 17.67 45114 40.05 68972 19.68 194858 55.60
40 - 49 54666 22.99 100680 42.34 15876 14.09 25206 22.38 70542 20.13 125886 35.92
30 - 39 35659 14.99 46014 19.35 7524 6.68 9330 8.28 43183 12.32 55344 15.79
20 - 29 9186 3.86 10355 4.35 1655 1.47 1806 1.60 10841 3.09 12161 3.47
10 - 19 973 0.41 1169 0.49 123 0.11 151 0.13 1096 0.31 1320 0.38
01 - 09 145 0.06 196 0.08 18 0.02 28 0.02 163 0.05 224 0.06
00 - 00 51 0.02 51 0.02 10 0.01 10 0.01 61 0.02 61 0.02
Class Interval
Lower Income Group Higher Income Group All Candidates

- 25 -
3.3 Distribution of Frequencies of Marks for Paper II by Income Level
Table 15 : Grade 5 Scholarship Examination - 2017
Distribution of Frequencies of Marks for Paper II by Income Level
Figure 20 :
Per
cent
age
of fr
eque
ncie
s of m
arks
0
5
10
15
20
25
00 -
00
01 -
09
10 -
19
20 -
29
30 -
39
40 -
49
50 -
59
60 -
69
70 -
79
80 -
89
90 -
100
Per
cent
age
of F
requ
enci
es o
f mar
ks
Class Interval
Grade 5 Scholarship Examination - 2017 PercentageDistributionofFrequenciesofMarksforpaperIIbyIncome
Level
Lower
Higher
All
Grade 5 Scholarship Examination - 2017Percentage Distribution of Frequencies of Marks for Paper II by Income Level
F : Frequency CF : Cumulative Frequency
F % CF % F % CF % F % CF %
90 - 100 862 0.36 237811 100.00 1610 1.43 112648 100.00 2472 0.71 350459 100.00
80 - 89 11401 4.79 236949 99.64 14754 13.10 111038 98.57 26155 7.46 347987 99.29
70 - 79 25163 10.58 225548 94.84 21971 19.50 96284 85.47 47134 13.45 321832 91.83
60 - 69 29778 12.52 200385 84.26 19512 17.32 74313 65.97 49290 14.06 274698 78.38
50 - 59 31660 13.31 170607 71.74 16528 14.67 54801 48.65 48188 13.75 225408 64.32
40 - 49 34613 14.55 138947 58.43 13887 12.33 38273 33.98 48500 13.84 177220 50.57
30 - 39 35583 14.96 104334 43.87 11140 9.89 24386 21.65 46723 13.33 128720 36.73
20 - 29 34123 14.35 68751 28.91 7903 7.02 13246 11.76 42026 11.99 81997 23.40
10 - 19 30911 13.00 34628 14.56 4852 4.31 5343 4.74 35763 10.20 39971 11.41
01 - 09 3658 1.54 3717 1.56 477 0.42 491 0.44 4135 1.18 4208 1.20
00 - 00 59 0.02 59 0.02 14 0.01 14 0.01 73 0.02 73 0.02
Class Interval
Lower Income Group Higher Income Group All Candidates

- 26 -
3.4 Distribution of Frequencies of Total Marks by Income Level
Table 16 :
Grade 5 Scholarship Examination - 2017Distribution of Frequencies of Total Marks by Income Level
F % CF % F % CF % F % CF %
180 - 200 3102 2.75 112648 100.00 1702 0.72 237814 100.00 4804 1.37 350462 100.00
160 - 179 17057 15.14 109546 97.25 14190 5.97 236112 99.28 31247 8.92 345658 98.63
140 - 159 21088 18.72 92489 82.10 25536 10.74 221922 93.32 46624 13.30 314411 89.71
120 - 139 20012 17.77 71401 63.38 31535 13.26 196386 82.58 51547 14.71 267787 76.41
100 - 119 18047 16.02 51389 45.62 37120 15.61 164851 69.32 55167 15.74 216240 61.70
80 - 99 15779 14.01 33342 29.60 44228 18.60 127731 53.71 60007 17.12 161073 45.96
60 - 79 11572 10.27 17563 15.59 46335 19.48 83503 35.11 57907 16.52 101066 28.84
40 - 59 5386 4.78 5991 5.32 32388 13.62 37168 15.63 37774 10.78 43159 12.31
20 - 39 573 0.51 605 0.54 4494 1.89 4780 2.01 5067 1.45 5385 1.54
01 - 19 27 0.02 32 0.03 269 0.11 286 0.12 296 0.08 318 0.09
00 - 00 5 0.00 5 0.00 17 0.01 17 0.01 22 0.01 22 0.01
Higher Income group All CandidatesLower Income GroupCI
Class Interval
Figure 21 :
F : Frequency CF : Cumulative Frequency
Per
cent
age
of fr
eque
ncie
s of m
arks
0
5
10
15
20
25
00 -
00
01 -
19
20 -
39
40 -
59
60 -
79
80 -
99
100
- 119
120
- 139
140
- 159
160
- 179
180
-200
Fre
quen
cy P
erce
ntag
e
Class Interval
Total Marks
Higher
Lower
All
Grade 5 Scholarship Examination - 2017Percentage Distribution of Frequencies of Total Marks by Income Level

- 27 -
3.5 Distribution of Frequencies of Marks for Paper I by Medium
Table 17 :
Grade 5 Scholarship Examination - 2017Distribution of Frequencies of Marks for Paper I by Medium
Figure 22 :
0
5
10
15
20
25
30
00 -
00
01 -
09
10 -
19
20 -
29
30 -
39
40 -
49
50 -
59
60 -
69
70 -
79
80 -
89
90 -
100
Per
cent
age
of F
requ
enci
es o
f m
arks
Class Interval
Grade 5 Scholarship Examination - 2017Percentage Distribution of Frequencies of Marks for paper I by Medium
Sinhala
Tamil
All
Grade 5 Scholarship Examination - 2017Percentage Distribution of Frequencies of Marks for Paper I by Medium
Per
cent
age
of fr
eque
ncie
s of m
arks
F % CF % F % CF % F % CF %
90 - 100 14308 5.43 263479 100.00 2070 2.38 86979 100.00 16378 4.67 350458 100.00
80 - 89 29908 11.35 249171 94.57 5416 6.23 84909 97.62 35324 10.08 334080 95.33
70 - 79 38820 14.73 219263 83.22 8172 9.40 79493 91.39 46992 13.41 298756 85.25
60 - 69 45826 17.39 180443 68.48 11080 12.74 71321 82.00 56906 16.24 251764 71.84
50 - 59 52297 19.85 134617 51.09 16675 19.17 60241 69.26 68972 19.68 194858 55.60
40 - 49 48539 18.42 82320 31.24 22003 25.30 43566 50.09 70542 20.13 125886 35.92
30 - 39 26796 10.17 33781 12.82 16387 18.84 21563 24.79 43183 12.32 55344 15.79
20 - 29 6200 2.35 6985 2.65 4641 5.34 5176 5.95 10841 3.09 12161 3.47
10 - 19 626 0.24 785 0.30 470 0.54 535 0.62 1096 0.31 1320 0.38
01 - 09 107 0.04 159 0.06 56 0.06 65 0.07 163 0.05 224 0.06
00 - 00 52 0.02 52 0.02 9 0.01 9 0.01 61 0.02 61 0.02
Class Interval
Sinhala Medium Tamil Medium All Candidates
F : Frequency CF : Cumulative Frequency

- 28 -
F % CF % F % CF % F % CF %
90 - 100 2392 0.91 263478 100.00 80 0.09 86981 100.00 2472 0.71 350459 100.00
80 - 89 23519 8.93 261086 99.09 2636 3.03 86901 99.91 26155 7.46 347987 99.29
70 - 79 39667 15.06 237567 90.17 7467 8.58 84265 96.88 47134 13.45 321832 91.83
60 - 69 39934 15.16 197900 75.11 9356 10.76 76798 88.29 49290 14.06 274698 78.38
50 - 59 38442 14.59 157966 59.95 9746 11.20 67442 77.54 48188 13.75 225408 64.32
40 - 49 37475 14.22 119524 45.36 11025 12.68 57696 66.33 48500 13.84 177220 50.57
30 - 39 33982 12.90 82049 31.14 12741 14.65 46671 53.66 46723 13.33 128720 36.73
20 - 29 26629 10.11 48067 18.24 15397 17.70 33930 39.01 42026 11.99 81997 23.40
10 - 19 18945 7.19 21438 8.14 16818 19.34 18533 21.31 35763 10.20 39971 11.41
01 - 09 2434 0.92 2493 0.95 1701 1.96 1715 1.97 4135 1.18 4208 1.20
00 - 00 59 0.02 59 0.02 14 0.02 14 0.02 73 0.02 73 0.02
Class Interval
Sinhala Medium Tamil Medium All Candidates
F : Frequency CF : Cumulative Frequency
3.6 Frequency Distribution of Marks of Paper II by Medium
Table 18 :
Grade 5 Scholarship Examination - 2017Distribution of Frequencies of Marks for Paper II by Medium
Figure 23 :
0
5
10
15
20
25
00 -
00
01 -
09
10 -
19
20 -
29
30 -
39
40 -
49
50 -
59
60 -
69
70 -
79
80 -
89
90 -
100
Per
cen
tage
of
Fre
qu
enci
es o
f m
ark
s
Class Interval
Grade 5 Scholarship Examination - 2017 Percentage Distribution of Frequencies of Marks for paper II by Medium
Sinhala
Tamil
All
Grade 5 Scholarship Examination - 2017Percentage Distribution of Frequencies of Marks for Paper II by Medium
Per
cent
age
of fr
eque
ncie
s of m
arks
0
5
10
15
20
25
00 -
00
01 -
09
10 -
19
20 -
29
30 -
39
40 -
49
50 -
59
60 -
69
70 -
79
80 -
89
90 -
100
Per
cen
tage
of
Fre
qu
enci
es o
f m
ark
s
Class Interval
Grade 5 Scholarship Examination - 2017 Percentage Distribution of Frequencies of Marks for paper II by Medium
Sinhala
Tamil
All

- 29 -
F : Frequency CF : Cumulative Frequency
3.7 Distribution of Frequencies of Total Marks by Medium
Table 19 :
Grade 5 Scholarship Examination - 2017Distribution of Frequencies of Total Marks by Medium
F % CF % F % CF % F % CF %
180 - 200 4502 1.71 263480 100.00 304 0.35 86982 100.00 4806 1.37 350462 100.00
160 - 179 27276 10.35 258978 98.29 3984 4.58 86678 99.65 31260 8.92 345656 98.63
140 - 159 38871 14.75 231702 87.94 7740 8.90 82694 95.07 46611 13.30 314396 89.71
120 - 139 42020 15.95 192831 73.19 9525 10.95 74954 86.17 51545 14.71 267785 76.41
100 - 119 43854 16.64 150811 57.24 11313 13.01 65429 75.22 55167 15.74 216240 61.70
80 - 99 44994 17.08 106957 40.59 15013 17.26 54116 62.22 60007 17.12 161073 45.96
60 - 79 37992 14.42 61963 23.52 19915 22.90 39103 44.96 57907 16.52 101066 28.84
40 - 59 20988 7.97 23971 9.10 16786 19.30 19188 22.06 37774 10.78 43159 12.31
20 - 39 2761 1.05 2983 1.13 2306 2.65 2402 2.76 5067 1.45 5385 1.54
01 - 19 203 0.08 222 0.08 93 0.11 96 0.11 296 0.08 318 0.09
00 - 00 19 0.01 19 0.01 3 0.00 3 0.00 22 0.01 22 0.01
Sinhala Medium All CandidatesTamil Medium CIClass
Interval
Figure 24 :
Per
cent
age
of fr
eque
ncie
s of m
arks
0
5
10
15
20
25
00 -
00
01 -
19
20 -
39
40 -
59
60 -
79
80 -
99
100
- 11
9
120
- 13
9
140
- 15
9
160
- 17
9
180
-20
0
Fre
qu
ency
Per
cen
tage
Class Interval
Total Marks
Sinhala
Tamil
All
Grade 5 Scholarship Examination - 2017Percentage Distribution of Frequencies of Total Marks by Medium
0
5
10
15
20
25
00 -
00
01 -
19
20 -
39
40 -
59
60 -
79
80 -
99
100
- 11
9
120
- 13
9
140
- 15
9
160
- 17
9
180
-20
0
Fre
qu
ency
Per
cen
tage
Class Interval
Total Marks
Sinhala
Tamil
All

- 30 -
3.8 Distribution of Frequencies of Marks for Paper I by Gender
Table 20 :
Grade 5 Scholarship Examination - 2017Distribution of Frequencies of Marks for Paper I by Gender
Figure 25 :
Grade 5 Scholarship Examination - 2017Percentage Distribution of Frequencies of Marks for Paper I by Gender
Per
cent
age
of fr
eque
ncie
s of m
arks
0
5
10
15
20
25
00 -
00
01 -
09
10 -
19
20 -
29
30 -
39
40 -
49
50 -
59
60 -
69
70 -
79
80 -
89
90 -
100
Per
cen
tag
e o
f F
req
uen
cies
of
ma
rks
Class Interval
Grade 5 Scholarship Examination - 2017Percentage Distribution of Frequencies of Marks for paper I by Gender
Male
Female
All
F % CF % F % CF % F % CF %
90 - 100 8500 4.81 176762 100.00 7878 4.54 173696 100.00 16378 4.67 350458 100.00
80 - 89 17014 9.63 168262 95.19 18310 10.54 165818 95.46 35324 10.08 334080 95.33
70 - 79 22426 12.69 151248 85.57 24566 14.14 147508 84.92 46992 13.41 298756 85.25
60 - 69 27197 15.39 128822 72.88 29709 17.10 122942 70.78 56906 16.24 251764 71.84
50 - 59 33673 19.05 101625 57.49 35299 20.32 93233 53.68 68972 19.68 194858 55.60
40 - 49 36459 20.63 67952 38.44 34083 19.62 57934 33.35 70542 20.13 125886 35.92
30 - 39 24202 13.69 31493 17.82 18981 10.93 23851 13.73 43183 12.32 55344 15.79
20 - 29 6462 3.66 7291 4.12 4379 2.52 4870 2.80 10841 3.09 12161 3.47
10 - 19 682 0.39 829 0.47 414 0.24 491 0.28 1096 0.31 1320 0.38
01 - 09 113 0.06 147 0.08 50 0.03 77 0.04 163 0.05 224 0.06
00 - 00 34 0.02 34 0.02 27 0.02 27 0.02 61 0.02 61 0.02
Male Female All CandidatesClass Interval
F : Frequency CF : Cumulative Frequency
0
5
10
15
20
25
00
- 0
0
01
-0
9
10
- 1
9
20
-2
9
30
- 3
9
40
- 4
9
50
- 5
9
60
- 6
9
70
- 7
9
80
- 8
9
90
- 1
00
Per
cen
tag
e o
f F
req
uen
cies
of
ma
rks
Class Interval
Grade 5 Scholarship Examination - 2017Percentage Distribution of Frequencies of Marks for paper I by Gender
Male
Female
All

- 31 -
3.9 Distribution of Frequencies of Marks for Paper II by Gender
Table 21 :
Grade 5 Scholarship Examination - 2017Distribution of Frequencies of Marks for Paper II by Gender
Figure 26 :
0
2
4
6
8
10
12
14
16
18
00 -
00
01
-09
10 -
19
20
-29
30 -
39
40 -
49
50 -
59
60 -
69
70 -
79
80 -
89
90
- 1
00
Per
cen
tage
of
Fre
qu
enci
es o
f m
ark
s
Class Interval
Grade 5 Scholarship Examination - 2017 Percentage Distribution of Frequencies of Marks for paper II by Gender
Male
Female
All
Grade 5 Scholarship Examination - 2017Percentage Distribution of Frequencies of Marks for Paper II by Gender
Per
cent
age
of fr
eque
ncie
s of m
arks
F % CF % F % CF % F % CF %
90 - 100 1050 0.59 176763 100.00 1422 0.82 173696 100.00 2472 0.71 350459 100.00
80 - 89 11696 6.62 175713 99.41 14459 8.32 172274 99.18 26155 7.46 347987 99.29
70 - 79 21450 12.13 164017 92.79 25684 14.79 157815 90.86 47134 13.45 321832 91.83
60 - 69 22759 12.88 142567 80.65 26531 15.27 132131 76.07 49290 14.06 274698 78.38
50 - 59 22571 12.77 119808 67.78 25617 14.75 105600 60.80 48188 13.75 225408 64.32
40 - 49 23154 13.10 97237 55.01 25346 14.59 79983 46.05 48500 13.84 177220 50.57
30 - 39 23723 13.42 74083 41.91 23000 13.24 54637 31.46 46723 13.33 128720 36.73
20 - 29 23630 13.37 50360 28.49 18396 10.59 31637 18.21 42026 11.99 81997 23.40
10 - 19 23562 13.33 26730 15.12 12201 7.02 13241 7.62 35763 10.20 39971 11.41
01 - 09 3112 1.76 3168 1.79 1023 0.59 1040 0.60 4135 1.18 4208 1.20
00 - 00 56 0.03 56 0.03 17 0.01 17 0.01 73 0.02 73 0.02
All CandidatesClass Interval
Male Female
F : Frequency CF : Cumulative Frequency
0
2
4
6
8
10
12
14
16
18
00 -
00
01 -
09
10 -
19
20 -
29
30 -
39
40 -
49
50 -
59
60 -
69
70 -
79
80 -
89
90 -
100
Per
cen
tage
of
Fre
qu
enci
es o
f m
ark
s
Class Interval
Grade 5 Scholarship Examination - 2017 Percentage Distribution of Frequencies of Marks for paper II by Gender
Male
Female
All

- 32 -
3.10 Distribution of Frequencies of Total Marks by Gender
Table 22 :
Grade 5 Scholarship Examination - 2017Distribution of Frequencies of Total Marks by Gender
F % CF % F % CF % F % CF %
180 - 200 2336 1.32 176765 100.00 2470 1.42 173697 100.00 4806 1.37 350462 100.00
160 - 179 14842 8.40 174429 98.68 16418 9.45 171227 98.58 31260 8.92 345656 98.63
140 - 159 21610 12.23 159587 90.28 25001 14.39 154809 89.13 46611 13.30 314396 89.71
120 - 139 24089 13.63 137977 78.06 27456 15.81 129808 74.73 51545 14.71 267785 76.41
100 - 119 25815 14.60 113888 64.43 29352 16.90 102352 58.93 55167 15.74 216240 61.70
80 - 99 29356 16.61 88073 49.82 30651 17.65 73000 42.03 60007 17.12 161073 45.96
60 - 79 31224 17.66 58717 33.22 26683 15.36 42349 24.38 57907 16.52 101066 28.84
40 - 59 23765 13.44 27493 15.55 14009 8.07 15666 9.02 37774 10.78 43159 12.31
20 - 39 3514 1.99 3728 2.11 1553 0.89 1657 0.95 5067 1.45 5385 1.54
01 - 19 198 0.11 214 0.12 98 0.06 104 0.06 296 0.08 318 0.09
00 - 00 16 0.01 16 0.01 6 0.00 6 0.00 22 0.01 22 0.01
All CandidatesCI
Male FemaleClass Interval
Figure 27 :
Grade 5 Scholarship Examination - 2017Percentage Distribution of Frequencies of Total Marks by Gender
Per
cent
age
of fr
eque
ncie
s of m
arks
0
2
4
6
8
10
12
14
16
18
20
00 -
00
01 -
19
20 -
39
40 -
59
60 -
79
80 -
99
100
- 11
9
120
- 13
9
140
- 15
9
160
- 17
9
180
-20
0
Fre
qu
ency
Per
cen
tage
Class Interval
Total Marks
Male
Female
All
F : Frequency CF : Cumulative Frequency

- 33 -
Gra
de 5
Sch
olar
ship
Exa
min
atio
n - 2
017
Mea
n Va
lues
of P
aper
I, P
aper
II &
Tot
al M
arks
by
Prov
ince
P
RO
VIN
CE
P
AP
ER
I
PA
PE
R I
I T
OT
AL
M
AR
KS
WE
ST
ER
N5
8.5
54
9.7
91
08
.34
CE
NT
RA
L5
5.6
34
5.9
91
01
.62
SO
UT
HE
RN
60
.55
52
.94
11
3.5
0
NO
RT
HE
RN
56
.78
46
.86
10
3.6
5
EA
ST
ER
N5
4.1
84
2.4
29
6.6
0
NO
RT
H W
ES
TE
RN
60
.44
52
.67
11
3.1
1
NO
RT
H C
EN
TR
AL
57
.54
49
.40
10
6.9
4
UV
A5
6.9
64
7.0
51
04
.01
SA
BA
RA
GA
MU
WA
59
.19
50
.92
11
0.1
1
ISL
AN
D
57
.88
48
.89
10
6.4
3
Gra
de 5
Sch
olar
ship
Exa
min
atio
n - 2
017
Mea
n Va
lues
of P
aper
I, P
aper
II &
Tot
al M
arks
, In
com
e Le
vel,
Gen
der
& M
ediu
m b
y Pr
ovin
ce
HIG
HE
RL
OW
ER
MA
LE
FE
MA
LE
SIN
HA
LA
TA
MIL
HIG
HE
RL
OW
ER
MA
LE
FE
MA
LE
SIN
HA
LA
TA
MIL
HIG
HE
RL
OW
ER
MA
LE
FE
MA
LE
SIN
HA
LA
TA
MIL
WE
STE
RN
64.2
054
.80
57.8
559
.38
59.6
350
.46
57.2
544
.84
47.3
052
.71
51.4
936
.98
121.
4599
.64
105.
1511
2.09
111.
1287
.44
CE
NT
RA
L61
.45
53.4
055
.00
56.3
459
.13
51.6
352
.13
43.6
544
.14
48.0
850
.78
40.5
311
3.58
97.0
599
.14
104.
4310
9.91
92.1
6
SOU
TH
ER
N68
.73
57.1
259
.61
61.7
461
.29
49.9
461
.68
49.2
750
.37
56.1
754
.27
33.9
813
0.40
106.
3910
9.98
117.
9111
5.56
83.9
2
NO
RT
HE
RN
71.3
153
.87
56.9
656
.59
59.2
056
.77
64.1
243
.41
45.3
748
.50
56.0
046
.80
135.
4397
.28
102.
3310
5.09
115.
2010
3.57
EA
STE
RN
62.7
652
.28
53.8
254
.64
56.7
053
.57
53.6
339
.93
41.1
844
.02
46.8
141
.36
116.
4092
.21
95.0
098
.66
103.
5194
.94
NO
RT
H W
EST
ER
N68
.87
57.1
259
.10
61.9
961
.69
51.7
463
.29
48.4
949
.62
56.2
054
.54
39.6
313
2.16
105.
6010
8.71
118.
1811
6.23
91.3
7
NO
RT
H C
EN
TR
AL
64.7
054
.25
57.7
357
.31
59.6
648
.91
58.3
545
.29
48.5
350
.52
52.1
138
.37
123.
0699
.54
106.
2510
7.83
111.
7787
.28
UV
A63
.84
54.5
354
.65
59.7
158
.77
51.5
755
.99
43.9
143
.18
51.6
650
.40
37.0
811
9.83
98.4
497
.83
111.
3710
9.17
88.6
6
SAB
AR
AG
AM
UW
A67
.97
56.8
658
.01
60.6
061
.41
53.0
662
.22
47.9
248
.03
54.3
753
.79
42.9
813
0.20
104.
7810
6.04
114.
9711
5.20
96.0
4
ISL
AN
D
65.3
554
.94
57.0
958
.83
60.1
952
.92
58.1
345
.25
46.6
151
.61
52.4
141
.33
123.
4810
0.19
103.
7011
0.44
112.
6094
.25
INC
OM
E L
EV
EL
GE
ND
ER
PR
OV
INC
E
PA
PE
R I
1
INC
OM
E L
EV
EL
GE
ND
ER
ME
DIU
MM
ED
IUM
PA
PE
R1
TO
TA
L M
AR
KS
INC
OM
E L
EV
EL
GE
ND
ER
ME
DIU
M
3.11
M
ean
Val
ues
of P
aper
I, P
aper
II
& T
otal
Mar
ks b
y P
rovi
nce

- 34 -
4.1 Item Person Map for Paper I
Figure 28 :
4. Item Analyses of Question Papers
================================================================================ ConQuest: Generalised Item Response Modelling Software Fri Mar 02 10:00 2012 MAP OF WLE ESTIMATES AND RESPONSE MODEL PARAMETER ESTIMATES ================================================================================ Terms in the Model (excl Step terms) +item --------------------------------------------------------------------------------------- XX| | XXX| | | | | | | | 3 | | XXXXX| | | | | | XXXXXXXX| | | | | | XXXXXXXXX| | | | 2 XXXXXXXXXXXX| | | | XXXXXXXXXXXXXX| | XXXXXXXXXXXXXXXX|22 | | | XXXXXXXXXXXXXXXX| | XXXXXXXXXXXXXXXXXXXXXXX| | |4 | XXXXXXXXXXXXXXXXXXXX| | 1 XXXXXXXXXXXXXXXXXXXXXXXXX| | XXXXXXXXXXXXXXXXXXXXXXXXXX|19 | XXXXXXXXXXXXXXXXXXXXXXXXXX|14 25 | XXXXXXXXXXXXXXXXXXXXXXXX|23 32 | XXXXXXXXXXXXXXXXXXXXXXXXX|38 | XXXXXXXXXXXXXXXXXXXXXXXXXXXXXXX|27 | XXXXXXXXXXXXXXXXXXXXXXXXXXXXXXXXXX|18 | XXXXXXXXXXXXXXXXXXXXXXXXXXXXXXXXXX|9 11 20 30 | XXXXXXXXXXXXXXXXXXXXXXXXXXXXXXXXXXXXX|5 6 10 21 | 0 XXXXXXXXXXXXXXXXXXXXXXXXXXXXXXXXXXXXX|15 36 37 39 40 | XXXXXXXXXXXXXXXXXXXXXXXXXXXXXXXXXXXXXXXX|31 | XXXXXXXXXXXXXXXXXXXXXXXXXXXXXXXXXXXXXX|29 33 35 | XXXXXXXXXXXXXXXXXXXXXXXXXXXXXXXXXXXXX|3 26 28 | XXXXXXXXXXXXXXXXXXXXXXXXXXXXXXX|1 24 | XXXXXXXXXXXXXXXXXXXXXXXXXXXXXXXXX|16 | XXXXXXXXXXXXXXXXXXXXXXXXXXXX|13 17 | XXXXXXXXXXXXXXXXXXXXXXX|34 | XXXXXXXXXXXXXXXX|12 | -1 |2 | XXXXXXXXXXX| | XXXXXXXX| | XXXX|8 | XX| | | | XX| | | | X|7 | -2 | | | | | | | | | | | | | | | | | | -3 X| | ======================================================================================= Each 'X' represents 18.9 cases =======================================================================================
Most difficult item
Items
Easiest Item
More difficult Items
Lessdifficult Items
Students with high ability
Students with low ability
Students
Student abilities are higher than the most
difficult item
Student abilities are lower than the
easiest item
Most difficult Items
Easiest Items

- 35 -
4.2 Facility Indices of Questions in Paper I
Figure 29 :
0102030405060708090100
12
34
56
78
910
1112
1314
1516
1718
1920
2122
2324
2526
2728
2930
3132
3334
3536
3738
3940
Percentage
Que
stio
n N
umbe
r
Grad
e5Scho
larshipExam
ination-2
017
Facility
ofP
aperIbyItem
Gra
de 5
Sch
olar
ship
Exa
min
atio
n - 2
017
Faci
lity
Indi
ces o
f Que
stio
ns -
Pape
r IFacility Index
0.00.1
0.2
0.3
0.4
0.50.6
0.70.8
0.9
1.0
Que
stio
n N
umbe
r
Acc
ordi
ng to
the
abov
e gr
aph
the
high
est f
acili
ty is
reco
rded
for q
uest
ion
num
ber 7
whi
ch is
87%
. The
low
est f
acili
ty is
show
n fo
r qu
estio
n nu
mbe
r 22
whi
ch is
23%
.*FacilityIndexistypicallydefinedasthepropotionofcandidatesw
hoansweredaparticularitem
correctly.Thus,if45outof50
c
andi
date
s ans
wer
ed a
par
ticul
ar it
em c
orre
ctly
, the
faci
lity
inde
x fo
r tha
t ite
m w
ould
be
45/5
0 =
0.90
, mea
ning
that
90%
of t
he
c
andi
date
s ans
wer
ed th
e ite
m c
orre
ctly
.

- 36 -
4.3 Distractor Analysis for Paper I (Multiple Choice Questions)
Table 25 : Grade 5 Scholarship Examination 2017 - Paper I
Percentage of students who responded for each option
Option 1 Option 2 Option 3 9
1 2 12.68 63.90 22.83 0.592 1 74.34 16.30 8.72 0.643 3 8.60 27.55 63.21 0.634 1 29.62 27.91 41.23 1.245 1 52.76 20.77 25.38 1.096 2 17.36 52.64 29.17 0.837 3 3.41 8.37 87.13 1.098 1 79.92 10.46 8.00 1.629 2 11.95 51.51 35.52 1.0210 3 31.38 15.40 52.34 0.8811 1 52.00 22.24 23.14 2.6212 2 10.08 74.25 14.90 0.7713 3 14.20 16.41 68.27 1.1114 2 13.55 39.19 45.57 1.6915 1 55.31 21.42 21.67 1.5916 3 13.55 16.04 67.66 2.7517 1 69.97 15.17 13.81 1.0518 3 17.77 33.63 47.88 0.7219 1 37.28 34.34 26.24 2.1420 2 25.42 50.05 23.12 1.4121 3 11.57 33.10 52.64 2.7022 1 23.06 41.14 34.76 1.0523 2 27.12 40.81 31.21 0.8524 2 19.06 65.29 14.67 0.9925 3 18.29 41.61 38.84 1.2626 2 17.56 62.90 18.62 0.9227 1 45.90 27.90 23.21 2.9928 2 17.10 63.53 17.39 1.9929 3 13.49 23.56 61.14 1.8130 1 50.62 26.21 21.14 2.0331 3 20.75 16.87 57.55 4.8332 3 18.16 37.76 40.85 3.2333 2 21.83 60.02 15.19 2.9734 1 71.01 16.79 9.91 2.2935 3 14.93 22.42 59.89 2.7536 1 55.50 22.56 19.18 2.7537 3 14.30 25.97 56.30 3.4338 2 24.48 43.63 27.58 4.3039 2 20.58 55.13 21.00 3.2940 2 22.05 56.10 18.90 2.95
Question Number
Correct Answer
Percentage of responses for each option
Missing

- 37 -
4.4 Item Person Map for Paper II
Figure 30 :
================================================================================ ConQuest: Generalised Item Response Modelling Software Fri Mar 02 13:54 2012 MAP OF WLE ESTIMATES AND RESPONSE MODEL PARAMETER ESTIMATES ================================================================================ Terms in the Model (excl Step terms) +item --------------------------------------------------------------------------------------- XXX|16 | 5 | | | | | | | | | | | | 4 | | | | | | | | | | X| | 3 XX| | XXXX| | XXXXX| | XXXXX|11.1 | XXXXXXXXXXXXXXXX| | 2 XXXXXXXX| | XXXXXXXXXXXXXXXXXX|15 28.2 | XXXXXXXXXXXXXXXXXXXXX|10 26.1 | XXXXXXXXXXXXXXXXXXXXXXXXXXXXXXXXXXX| | XXXXXXXXXXXXXXXXXXXXXXX|13 25.2 29.2 | XXXXXXXXXXXXXXXXXXXXX|17 29.1 | 1 XXXXXXXXXXXXXXXXXXXXXXXXXXXXXXXXXXXXXXX|1.2 1.3 8 11.2 26.2a 56 | XXXXXXXXXXXXXXXXXXXXXXXXXXXXXXXXXXXX|1.1 1.5 1.6 26.2b 33 42 | XXXXXXXXXXXXXXXXXXXXXXXXXXXXXXXXXXXXX|1.4 39 52 54 57 | XXXXXXXXXXXXXXXXXXXXXXXXXXXXXXXXXXXXXX|6 12.1 14 22.2 28.1 41 | XXXXXXXXXXXXXXXXXXXXXXXXXXXXXXXXXXXXXXXX|23.1 23.2 24.1 31 38 | 0 XXXXXXXXXXXXXXXXXXXXXXX|9 19 25.1 30.1 43 | XXXXXXXXXXXXXXXXXXXXXXXXXXXXXXXXXXXX|7 12.2 18 32 46 51 60 | XXXXXXXXXXXXXXXXXXXXXXXXXXXXXXXXXXX|20 24.2 | XXXXXXXXXXXXXXXXXXXXXXXXXXXXXXXXXXX|3.4 35 58 59 | XXXXXXXXXXXXXXXXXXXXXXXXXXXXXXXXXXX|21.2 27.2 34 48 | XXXXXXXXXXXXXXXXXXXXXXXXXXXXXX|30.2 36 47 53 | -1 XXXXXXXXXXXXXXXXXX|2.1 3.2 21.1 45 55 | XXXXXXXXXXXXXXXXXXXXXXXXXXXXX|22.1 40 | XXXXXXXXXXXXXXX|50 | XXXXXXXXXXXXXXXXXXXX|2.2 44 49 | XXXXXXXXXXXXXXXXXXXXX| | XXXXXXXXXXXXXXXXXXXXX|4.1 | -2 XXXXXXXXXXXXXXXXXXXXX|5.1 5.2 37 | XXXXXXXX| | XXXXXXXXXXX|3.1 3.3 27.1 | XXXX| | XXX|4.2 | -3 XX| | XX| | X| | X| | | | | | -4 | | | | | | | | | | | | -5 | | | | ======================================================================================= Each 'X' represents 18.6 cases =======================================================================================
Items
Easiest Item
More difficult Items
Lessdifficult Items
Students with high ability
Students with low ability
Students
Student abilities are lower than the
easiest item
Most difficult item Most difficult
Items
Easiest Items

- 38 -
4.5 Facility Indices of Questions in Paper II
Figure 31 :Facility Index
0102030405060708090100
Item 1.1Item 1.2Item 1.3Item 1.4Item 1.5Item 1.6Item 2.1Item 2.2Item 3.1Item 3.2Item 3.3Item 3.4Item 4.1Item 4.2Item 5.1Item 5.2
Item 6Item 7Item 8Item 9
Item 10Item 11.1Item 11.2Item 12.1Item 12.2
Item 13Item 14Item 15Item 16Item 17Item 18Item 19Item 20
Item 21.1Item 21.2Item 22.1Item 22.2Item 23.1Item 23.2Item 24.1Item 24.2Item 25.1Item 25.2Item 26.1
Item 26.2-aItem 26.2-b
Item 27.1Item 27.2Item 28.1Item 28.2Item 29.1Item 29.2Item 30.1Item 30.2
Item 31Item 32Item 33Item 34Item 35Item 36Item 37Item 38Item 39Item 40Item 41Item 42Item 43Item 44Item 45Item 46Item 47Item 48Item 49Item 50Item 51Item 52Item 53Item 54Item 55Item 56Item 57Item 58Item 59Item 60
Percentage
Item
Grad
e5Scho
larshipExam
ination-2
017
Facility
ofP
aperIIbyItem
Gra
de 5
Sch
olar
ship
Exa
min
atio
n - 2
017
Faci
lity
Indi
ces o
f Que
stio
ns -
Pape
r II
0.60.7
0.8
0.9
1.0
0.5 0.4
0.3
0.2 0.1
0.0
Que
stio
n N
umbe
r
1st L
angu
age
1st L
angu
age
Engl
ish
2nd
Lan.
Envi
ronm
ent
Mat
hem
atic
s
Acc
ordi
ng to
the
abov
e gr
aph
item
4.2
show
s the
hig
hest
faci
lity
of 8
9%. I
tem
16,
the
eass
y sh
ows t
he lo
wes
t fac
ility
of 0
9%.
*FacilityIndexistypicallydefinedasthepropotionofcandidatesw
hoansweredaparticularitem
correctly.Thus,if45outof50
c
andi
date
s ans
wer
ed a
par
ticul
ar it
em c
orre
ctly
, the
faci
lity
inde
x fo
r tha
t ite
m w
ould
be
45/5
0 =
0.90
, mea
ning
that
90%
of t
he
c
andi
date
s ans
wer
ed th
e ite
m c
orre
ctly
.
0
10
20
30
40
50
60
70
80
90
10
0
Item 1.1Item 1.2Item 1.3Item 1.4Item 1.5Item 1.6Item 2.1Item 2.2Item 3.1Item 3.2Item 3.3Item 3.4Item 4.1Item 4.2Item 5.1Item 5.2
Item 6Item 7Item 8Item 9
Item 10Item 11.1Item 11.2Item 12.1Item 12.2
Item 13Item 14Item 15Item 16Item 17Item 18Item 19Item 20
Item 21.1Item 21.2Item 22.1Item 22.2Item 23.1Item 23.2Item 24.1Item 24.2Item 25.1Item 25.2Item 26.1
Item 26.2-aItem 26.2-b
Item 27.1Item 27.2Item 28.1Item 28.2Item 29.1Item 29.2Item 30.1Item 30.2
Item 31Item 32Item 33Item 34Item 35Item 36Item 37Item 38Item 39Item 40Item 41Item 42Item 43Item 44Item 45Item 46Item 47Item 48Item 49Item 50Item 51Item 52Item 53Item 54Item 55Item 56Item 57Item 58Item 59Item 60
Percentage
Item
Grade5ScholarshipExaminatio
n-2017
Facility
ofP
aperIIb
yIte
m
0
10
20
30
40
50
60
70
80
90
100
Item 1.1Item 1.2Item 1.3Item 1.4Item 1.5Item 1.6Item 2.1Item 2.2Item 3.1Item 3.2Item 3.3Item 3.4Item 4.1Item 4.2Item 5.1Item 5.2
Item 6Item 7Item 8Item 9
Item 10Item 11.1Item 11.2Item 12.1Item 12.2
Item 13Item 14Item 15Item 16Item 17Item 18Item 19Item 20
Item 21.1Item 21.2Item 22.1Item 22.2Item 23.1Item 23.2Item 24.1Item 24.2Item 25.1Item 25.2Item 26.1
Item 26.2-aItem 26.2-b
Item 27.1Item 27.2Item 28.1Item 28.2Item 29.1Item 29.2Item 30.1Item 30.2
Item 31Item 32Item 33Item 34Item 35Item 36Item 37Item 38Item 39Item 40Item 41Item 42Item 43Item 44Item 45Item 46Item 47Item 48Item 49Item 50Item 51Item 52Item 53Item 54Item 55Item 56Item 57Item 58Item 59Item 60
Percentage
Item
Grade5ScholarshipExaminatio
n-2017
Facility
ofP
aperIIb
yIte
m
Engl
ish
1st L
angu
age
2nd L
angu
age
Envi
ronm
ent
Mat
hem
atic
s

- 39 -
4.6 Category Analysis for Paper II 4.6.1. Category Analysis for short Answer Type Questions
Table 26 : Grade 5 Scholarship Examination 2017 - Paper II
Percentage of students who obtained marks 0, 1 and 2
0 1 2 Missing
Item 1.1 1 64.05 35.04 0.91
Item 1.2 1 65.94 33.09 0.96
Item 1.3 1 67.15 31.63 1.22
Item 1.4 1 60.62 38.10 1.28
Item 1.5 1 63.56 34.93 1.51
Item 1.6 1 62.57 35.99 1.44
Item 2.1 1 30.87 68.41 0.72
Item 2.2 1 24.39 74.86 0.75
Item 3.1 1 12.20 87.20 0.60
Item 3.2 1 31.15 68.24 0.61
Item 3.3 1 13.16 86.26 0.58
Item 3.4 1 39.88 59.54 0.59
Item 4.1 1 17.49 81.69 0.82
Item 4.2 1 9.99 89.15 0.85
Item 5.1 1 16.57 82.66 0.76
Item 5.2 1 16.01 83.27 0.73
Item 6 1 54.30 42.56 3.14
Item 7 1 45.19 52.72 2.08
Item 8 1 66.53 31.75 1.72
Item 9 1 49.81 48.80 1.39
Item 10 1 76.38 21.81 1.82
Item 11.1 1 79.98 13.89 6.13
Item 11.2 1 63.08 32.04 4.88
Item 12.1 1 57.77 40.86 1.36
Item 12.2 1 46.39 52.14 1.47
Item 13 1 67.96 26.77 5.26
Item 14 1 53.46 41.14 5.40
Item 15 1 73.72 19.83 6.46
Item 17 2 68.27 66.85 30.18 1.54
Item 18 2 47.27 60.40 51.20 1.53
Item 19 2 50.87 71.03 47.25 1.88
Item 20 2 44.38 42.26 53.87 1.75
Item 21.1 1 31.26 44.14 1.89
Item 21.2 1 37.73 44.03 1.87
Item 22.1 1 27.83 56.58 1.14
Item 22.2 1 56.65 32.38 1.10
Item 23.1 1 54.44 36.36 1.42
Item 23.2 1 54.04 85.70 1.93
Item 24.1 2 51.03 60.18 46.39 2.58
Item 24.2 1 41.46 41.77 1.96
Item 25.1 2 49.10 20.64 48.91 1.99
Item 25.2 2 69.31 27.63 27.80 2.88
Item 26.1 2 75.49 49.72 21.70 2.81
Item 26.2-a 1 65.40 65.94 2.22
Item 26.2-b 1 61.17 2.47
Item 27.1 1 13.35 0.96
Item 27.2 1 38.50 1.32
Item 28.1 1 56.61 1.62
Item 28.2 1 77.17 2.19
Item 29.1 2 68.86 28.84 2.30
Item 29.2 1 70.22 2.14
Item 30.1 1 48.85 1.42Item 30.2 1 32.47 1.59
Question Number
Allocated Marks
Marks for Short Answer Type Questions

- 40 -
4.6.2 Distractor Analysis for Multiple Choice Questions
Table 27 : Grade 5 Scholarship Examination 2017 - Paper II Percentage of students who responded for each option
Option 1 Option 2 Option 3 Option 4 MissingItem 31 1 46.90 11.66 31.70 6.52 3.23Item 32 2 18.10 52.13 12.98 13.46 3.34Item 33 4 20.46 20.12 19.72 35.81 3.89Item 34 3 17.20 9.16 63.04 7.81 2.78Item 35 1 60.15 7.57 15.96 13.43 2.89Item 36 4 9.01 11.32 11.89 65.74 2.04Item 37 2 6.53 81.85 5.55 4.06 2.02Item 38 3 19.46 13.98 45.42 17.74 3.40Item 39 1 38.42 13.52 10.41 33.82 3.83Item 40 4 9.13 10.06 8.30 70.01 2.50Item 41 3 10.88 21.32 42.06 22.10 3.65Item 42 1 34.57 8.59 43.98 8.92 3.94Item 43 2 9.54 49.78 18.02 19.23 3.42Item 44 3 8.96 6.27 75.15 7.53 2.09Item 45 3 10.12 8.28 68.29 10.98 2.33Item 46 4 13.29 16.22 14.64 52.49 3.35Item 47 1 66.03 14.63 7.93 8.70 2.70Item 48 4 13.41 9.91 11.36 62.57 2.75Item 49 2 8.42 75.44 8.29 5.21 2.64Item 50 3 8.83 6.64 74.28 7.93 2.31Item 51 4 12.89 22.72 9.69 50.72 3.99Item 52 2 20.02 38.22 12.11 25.60 4.05
Item 53 1 63.70 11.90 14.48 6.73 3.19Item 54 2 15.32 39.39 17.37 23.87 4.05Item 55 3 12.23 8.19 68.87 8.36 2.34Item 56 2 30.64 34.36 12.63 18.41 3.96Item 57 4 21.94 13.95 22.09 38.21 3.81Item 58 2 13.78 58.37 11.82 13.08 2.96Item 59 1 59.69 15.63 11.10 10.81 2.77Item 60 3 10.88 20.94 52.94 12.03 3.20
Question Number
Correct Answer
Percentage of Responses for Each Option

- 41 -
4.7 Analysis of Paper II by theme
Figure 32 :
6.34
0.95
5.15
6.44
8.08
5.43 5.58
0
1
2
3
4
5
6
7
8
9
First Language Essay First Language including Essay
English Second Language
Maths Environment
Fac
ility
Ind
ex
Theme
Grade5ScholarshipExamination– 2017FacilityofPaperIIbytheme
Grade 5 Scholarship Examination - 2017Facility Indices of Paper II by Theme
0.0
0.3
0.6
0.1
0.4
0.7
0.2
0.5
0.8
0.9
Theme
Faci
lity
Inde
x
4.8 Analysis of Item 60 (Essay Question) in Paper II
4.8.1 Pattern of Obtaning marks for the Essay Question Figure 33 :
Grade 5 Scholarship Examination - 2017Analysis of Item 16 (Essay Question) in Paper IIFrequency Distribution of Marks for the Essay
84.2
1.965.85
1.03 2.65 0.53 1.07 2.7
0
10
20
30
40
50
60
70
80
90
100
0 1 2 3 4 5 6 9
ChartTitle
Marks Obtained
Freq
uenc
y Pe
rcen
tage
Missing 0 1 2 3 4 5 6

- 42 -
4.8.2 Weaknesses Identified in the Essay Question
Figure 34 :
Weaknesses
Perc
enta
ge
Grade 5 Scholarship Examination - 2017 Weaknesses Identified in the Essay
22.00
6.00
18.00
12.00
4.05
7.69
20.47
5.62
3.45
0.63
0
5
10
15
20
25
1 2 3 4 5 6 7 8 9 10
Grade 5 Examination - 2017Essay Analysis
Key 1. Complete idea is not included in the sentences written
2. Sentences do not contain at least six words
3. Subject - verb (predicate) relationship is incorrect
4. Incorrect spelling
5. Repetition of the same ideas
6. Use of colloquial language in writing
7. No relationship between the theme of the incident given and the sentences written
8. Not attempted
9. Repetition of writing of isolated letters or groups of letters meaninglessly
10. Others

- 43 -
Table 28 :Performance Indices of Paper I, Paper II & Overall
Prepared according to Stanine Scale
Forty High Performing Schools In the Island(Out of the schools where 20 or more candidates have appeared for the Exam)
5. Performance by School
NO. PROVINCE ZONE NAME SCHOOL NAMENUMBER
OF CANDIDATES
SUBJECT 1
SUBJECT 2
SCHOOL INDEX
ISLAND RANK
1 NORTH WESTERN MAHO NK/SIR HENRY OLCOT MODEL PRIMARY SCHOOL,AMBANPOLA. 47 77 77 77 1
2 NORTH WESTERN MAHO NK/ERIYAWA K.V.,EHETUWEWA. 20 75 74 75 2
3 NORTH WESTERN KULIYAPITIYA KP/VISHAKA GIRLS COLLEGE,KULIYAPITIYA 131 71 75 73 3
4 NORTH WESTERN MAHO NK/SIRIMAVO BANDARANAYAKE P.V.,GALGAMUWA. 107 72 73 73 3
5 NORTH WESTERN KULIYAPITIYA KP/ASSEDDUMA SUBHARATHI KANISHTA VIDYALAYA,KULIYAPITIYA. 297 70 72 71 5
6 NORTH WESTERN KURUNEGALA KU/ETHUGALPURA KUMARA VID.,PILESSA. 106 69 72 71 5
7 NORTHERN JAFFNA J /ST. JOHN BOSCO'S V.,JAFFNA. 216 70 70 70 7
8 NORTH WESTERN KULIYAPITIYA KP/KATUMULUWA K.V.,KANATHTHEWEWA. 21 67 72 70 7
9 NORTH WESTERN PUTTALAM PU/WAYAMBA PRESIDENT COLLEGE,ANAMADUWA. 98 69 68 69 9
10 NORTH WESTERN GIRIULLA KP/RATHNALANKARA M.V.,ALAWWA. 269 67 71 69 9
11 SABARAGAMUWA RATNAPURA R /DIPPITIGALA MAHA VIDYALAYA,LELLOPITIYA. 43 69 68 69 9
12 WESTERN GAMPAHA GM/SRI SUMEDHA M.V.,GAMPAHA. 288 67 69 68 12
13 WESTERN KALUTARA KL/ST. JOHN'S BALIKA VIDYALAYA,PANADURA. 232 68 68 68 12
14 WESTERN HORANA KL/THAKSHILA KANISHTA VIDYALAYA,HORANA. 235 66 69 68 12
15 EASTERN AMPARA AM/DUDLEY SENANAYAKE VIDYALAYA,GONAGOLLA. 84 66 67 67 15
16 UVA BADULLA BD/VIHARA MAHADEVI BALIKA MAHA VIDYALAYA,BADULLA. 204 66 67 67 15
17 WESTERN GAMPAHA GM/HIRIPITIYA PRIMARY SCHOOL,VEYANGODA. 137 64 69 67 15
18 WESTERN GAMPAHA GM/SRIBODHI VIDYALAYA,GAMPAHA. 234 65 68 67 15
19 SOUTHERN TANGALLE H /BELIATTA RUHUNU VIJAYABA PRIMARY VIDYALAYA,BELIATTA. 256 66 67 67 15
20 NORTHERN JAFFNA J /JAFFNA HINDU PRIMARY SCHOOL,JAFFNA. 241 68 65 67 15
21 NORTH WESTERN GIRIULLA KP/METIYAGANE M.V.,METIYAGANE. 86 66 67 67 15
22 WESTERN MINUWANGODA MI/HENPITAGEDARA GNANASEEHA KANISHTA V.,MARANDAGAHAMULA. 42 64 70 67 15
23 SOUTHERN AKURESSA MR/PORAMBA KANISHTA VIDYALAYA,AKURESSA. 98 65 68 67 15
24 NORTH WESTERN NIKAWERATIYA NK/MONNEKULAMA MAHA VIDYALAYA,MONNEKULAMA. 24 70 64 67 15
25 NORTH WESTERN MAHO NK/EHETUWEWA PRIMARY VID.,EHETUWEWA. 131 66 68 67 15
26 NORTH WESTERN NIKAWERATIYA NK/KATUPOTHA PRIMARY V.,KATUPOTHA. 172 65 68 67 15
27 NORTHERN VAVUNIYA SOUTH V /RAMBAIKULAM G.M.V.,VAVUNIYA. 172 67 67 67 15
28 NORTHERN VAVUNIYA NORTH V /PUTHUKULAM JUNIOR SCHOOL,PUTHUKULAM, 55 68 65 67 15
29 UVA WELIMADA BD/DHARMADEEPA PRIMARY VIDYALAYA,MIRAHAWATTA. 74 65 66 66 29
30 WESTERN PILIYANDALA HO/SOMAWEERA CHANDRASIRI V.,PILIYANDALA. 357 65 67 66 29
31 NORTHERN VADAMARACHCHI J /KARAVEDDY MANIKAVASAGAR V.,KARAVEDDY. 58 66 65 66 29
32 SABARAGAMUWA KEGALLE KG/SARIPUTHRA ADARSHA PRIMARY V.,ALAWWA. 79 64 68 66 29
33 WESTERN HORANA KL/HORANA RAJAKEEYA VIDYALAYA,HORANA. 267 65 67 66 29
34 WESTERN HORANA KL/PRAJAPATHI BALIKA V.,HORANA. 92 64 67 66 29
35 NORTH WESTERN KULIYAPITIYA KP/SRI ARIYAWANSA M.V.,KATUPOTHA. 26 64 68 66 29
36 WESTERN MINUWANGODA MI/HORAGASMULLA PRIMARY SCHOOL,DIVULAPITIYA. 179 63 69 66 29
37 WESTERN MINUWANGODA MI/REGGIE RANATHUNGA PRIMARY VIDYALAYA,MINUWANGODA. 252 65 66 66 29
38 SOUTHERN MATARA MR/UYANWATTA ADHARSHA KANISHTA V.,MATARA. 96 64 68 66 29
39 CENTRAL GALEWELA MT/DIVULGASKOTUWA PRIMARY SCHOOL,GALEWELA. 90 65 66 66 29
40 NORTH WESTERN NIKAWERATIYA NK/NELUMGALA PRIMARY VID.,VANNI RASNAYAKAPURA. 25 66 65 66 29

- 44 -
6. Grade 5 Scholarship Examination - 2017
Question Paper I & II
Paper I

- 45 -

- 46 -

- 47 -

- 48 -

- 49 -

- 50 -

- 51 -
Paper II

- 52 -

- 53 -

- 54 -

- 55 -

- 56 -

- 57 -

- 57 -
A presentation of the Research and Development BranchDepartment of Examinations