Review of the Economic Case for HS2 - RAC Foundation Review of the Economic Case for HS2 About the...
92
Review of the Economic Case for HS2 Economic evaluation London – West Midlands link Chris Castles & David Parish November 2011
Transcript of Review of the Economic Case for HS2 - RAC Foundation Review of the Economic Case for HS2 About the...

Review of the Economic Case for HS2Economic evaluation London – West Midlands link
Chris Castles & David Parish November 2011

The Royal Automobile Club Foundation for Motoring Ltd is a charity which explores the economic, mobility, safety and environmental issues relating to roads and responsible road users. Independent and authoritative research, carried out for the public benefit, is central to the Foundation’s activities.
RAC Foundation 89–91 Pall Mall London SW1Y 5HS
Tel no: 020 7747 3445 www.racfoundation.org
Registered Charity No. 1002705 November 2011 © Copyright Royal Automobile Club Foundation for Motoring Ltd
Although not commissioned by the RAC Foundation, this report has been published to inform wider debate about the issue. The report content reflects the views of the authors.

Review of the Economic Case for HS2Economic evaluation London – West Midlands link
Chris Castles & David Parish November 2011

iReview of the Economic Case for HS2
About the authorsChris Castles is a transport economist and former partner of PwC (PricewaterhouseCoopers), where he led the firm’s transport economics and policy group for some fifteen years. He began his career in transport planning working on cost–benefit analysis using transport network models. He joined Coopers & Lybrand where he carried out a wide range of international transport project appraisals for major port, rail, road and airport schemes. He has also undertaken various transport policy studies including studies on the structure of rail freight subsidy, competition within the rail industry, access arrangements and pricing for rail infrastructure, rail industry restructuring, airport slot allocation, pricing and competition studies.
Major infrastructure projects in which he has held responsibility include:
• a review for the Swiss Treasury of the Transalpine Rail Tunnels scheme;• a review and monitoring of Eurotunnel for the banks to assist in the financial
restructuring of the company;• a review of the masterplan for the long-term development of Rome airport;• a mid-term review of a railway electrification project in New Zealand;• a report to a bidder on business prospects and risks of the Channel Tunnel
Rail Link concession;• a review of forecasts prepared by another bidder for the Channel Tunnel Rail
Link;• a review of the implications of the proposed structure for the London
Underground Public Private Partnership (PPP); and• a review of the economic case for a new railway linking Pretoria and
Johannesburg.
David Parish is an economist and former partner of PwC who specialises in the evaluation of major infrastructure projects. He joined the Department of the Environment (what is now the Department for Transport) as an economist after university and worked on the development of the National Traffic Model, the forerunner of the methodology which the department applies today in project appraisal. He was responsible for the development of national traffic forecasts and their application in the appraisal of highway projects. David was also involved in analysis of potential traffic transfers from road to rail, evaluation of the impact of higher energy prices on transport and a study of interactions between taxation and transport policy.
He joined Coopers & Lybrand as an economic consultant and participated extensively in a cost–benefit analysis of the Channel Tunnel project. He also carried out a review of transport policy in Ireland and worked as a special adviser to the Irish government’s parliamentary select committee on transport policy. Subsequently, David worked on numerous international rail, road and

iiReview of the Economic Case for HS2
port projects. Since retiring from PwC in 2002, he has carried out a range of independent consultancy projects. He acts from time to time as an adviser to the RAC Foundation and the Asian Development Bank. David recently advised the Campaign for Better Transport on financing issues associated with the Mersey Gateway project.
About this reportChris Castles and David Parish were engaged as consultants by 51m, a group of 17 local authorities which has come together to challenge the evidence base for the HS2 project. They were asked to advise on the economic case for HS2 and their report to 51m was submitted to Government as part of the response to the consultation on HS2. Their support and agreement to permit the publication of this updated version of their report is gratefully acknowledged. It should be made clear that the views expressed in this report are those of the authors and they do not necessarily reflect those of 51m. The analysis in Appendix 1 to the report was also produced for 51m, by Chris Stokes, and the authors placed considerable reliance on it when reaching their conclusions. It is reproduced here with the agreement of both Chris Stokes and 51m.

iiiReview of the Economic Case for HS2
Preface by Sir Christopher FosterAlmost fifty years ago, Alec Valentine, then chairman of London Transport, asked me to look at the economic case for what is now the Victoria line. The Treasury had to be persuaded that though it would require a subsidy – not a huge one – it was worthwhile. I remember summarising the argument in two articles on The Times’ editorial pages. The Treasury was persuaded. Londoners have used the Victoria line for many years. Travel in London without it now seems unthinkable.
If only London Transport had gone onto persuade the government to let them build Valentine’s second favourite, the Hackney–Chelsea line, or a version of Crossrail had been built, say, twenty years ago, how much better off Londoners would be. But two factors, as well as economic stringency, have intervened: politics and ‘optimism bias’ – a tendency to look on the bright side that is wholly out of place in serious objective analysis.
Valentine and his staff who helped me were scrupulously and deliberately honest. Costs were never underestimated and benefits were rigorously analysed. Unfortunately, over the years political considerations and optimism bias, which can be accidental or deliberate, have played an increasing role in project appraisal of major projects. An example is the cost of the London Olympics 2012, which was grotesquely underestimated – some would say deliberately – to secure the event for Britain. Another example is Ministry of Defence procurement where, repeatedly and persistently, the costs of projects have been seriously underestimated and the benefits overestimated to the point where some have been a complete waste of money. Evidence for both comes from the National Audit Office (NAO). Not only has such wasteful expenditure over broad tracts of the British economy been misguided but, over the years, it has been a powerful contributor to the current fiscal crisis.
I doubt one could find a worse current example than High Speed 2 (HS2) of a failure to make a credible case for a major project. As a surviving pioneer in the use of cost–benefit analysis to evaluate projects I have over the years known many economists active in this field. I do not know one economist I respect who believes in the case for HS2.
I believe Chris Castles and David Parish’s admirable summary will persuade any reasonable reader why this is so. It is followed by their report which sets out clearly the arguments and evidence supporting the conclusion that there is no economic case for HS2. I have known both for many years and I often worked with them in the past. Their experience of project evaluation in many countries around the world is formidable.

ivReview of the Economic Case for HS2
Let me end by briefly explaining why HS2 is a bad project. The main reason is that it is not needed. The existing network can carry all the forecast traffic; even if one were to accept – as the report demonstrates one should not – the optimistic traffic forecasts presented by the Government. The benefits of faster journey times have been greatly exaggerated by the false assumption that time spent by business people on trains is wasted. HS2 will divert only 1% of traffic from the motorways competing on the line of route. Neither will it reduce the flights at London airports. HS2 will be at best carbon-neutral in its environmental impact. But it will generate new traffic which will harm the environment. In addition, a new line across the British countryside will have a very damaging effect on the environment wherever it is. The claims of large economic benefits to the regions are unproven, certainly exaggerated. Experience in other countries suggests it is more likely to benefit the capital London than the regions. Far greater economic development benefits could be achieved by a balanced programme of complementary investment in high-priority rail and road projects.
The overall impact of proceeding with such a misconceived scheme will be counterproductive. Now, more than ever, is the time when limited funds for public investment should be spent wisely and on the basis of a careful, transparent review and analysis of the relevant evidence. However, as the report explains, the evaluation that has been done is not only deeply flawed in the respects already shown, but it also breaches many rules laid down in the Treasury’s Green Book on project evaluation. For all these reasons the HS2 project does not live up to the claims that have been made for it. As the authors show, the costs are likely to exceed the benefits substantially. These benefits will only be realised, the Government concedes, if well over half the capital costs are met by the taxpayer. The report argues that this is a gross underestimate of the likely burden on taxpayers. Moreover, the irony of the situation is that the people likely to travel by high-speed train, which the taxpayer will be subsidising, are assessed as having average incomes of £70,000. Most will be businessmen.
The Government should recognise and face up to these shortcomings. It should explain to Parliament and the public the difference these errors make. It should cancel the project.

vReview of the Economic Case for HS2
Contents
Executive Summary vi
Making the Case for High Speed Rail in Britain 1
Economic Evaluation of HS2, London – West Midlands 9
Base Case for Comparison with HS2 12
Demand Forecasts for HS2, London – West Midlands 20
Benefits to Transport Users from HS2 30
Options for Meeting Capacity Requirements 38
Other Elements of the Economic Evaluation 44
Conclusions 53
References 56
Appendix 1 59
Appendix 2 76

viReview of the Economic Case for HS2
Executive SummaryWe carried out a review of the economic case for the proposed high-speed rail link between London and Birmingham – High Speed 2 (HS2). Our review covered only the transport user benefits, which make up 80% of the quantified economic benefits in the appraisal published by the Government as part of its consultation on the project. To address the remaining 20% of the benefits we have drawn on the arguments of others, notably Professor John Tomaney in evidence presented to the Transport Select Committee. Though we could not access the network models used to carry out the demand forecasts and to calculate the economic benefits, sufficient information was published for us to understand the structure, method of analysis and key assumptions used.
We found that the economic case for HS2 is deeply flawed and as a consequence very weak. Among the important errors made are:
• that there is no overarching strategic framework for the project. Alternative strategies to HS2 that would achieve similar objectives but involve much lower costs and risks were not considered thoroughly enough;
• an inappropriate ‘do-minimum’ base case was used for comparison with the HS2 case. This led to an unrealistic base-case scenario resulting in avoidably high levels of crowding on the West Coast Main Line (WCML), thus exaggerating the benefits HS2 would bring;
• a different base case was used for the evaluation of schemes alternative to HS2, thus preventing comparison of the results of the evaluation of those alternatives with that of HS2 on a common basis. This had the effect of understating their benefits relative to those of HS2;
• despite the above, the evaluation showed that the best alternative considered by the Department for Transport (DfT) had a better economic return than HS2. Yet the Government appears to have ignored this result and has failed to explore an optimised alternative scheme that would involve much lower costs than HS2, would be much less risky and would provide the capacity needed at the time it is required rather fifteen years from now at the earliest;
• outdated assumptions on the income elasticity of demand for forecasting rail demand were used, so that the forecasts were substantially overstated. Our estimate is that the likely traffic demand for HS2 has been overstated by at least 30%;
• the forecasting period was extended well beyond the time frame for which the relationships used to forecast demand could be considered stable;
• there are doubts over the validity of the benefits users of HS2 gain from its improved reliability;
• an incorrect value of working time for rail travellers was used, because it was assumed, contrary to known experience, that people do not use their time on trains productively;

viiReview of the Economic Case for HS2
• the very large subsidy being proposed for HS2 has not been justified, nor has the full impact of the increased subsidy which will be required on the existing network after the opening of HS2 been quantified or evaluated. As a result, the Government risks making a commitment to a substantial, untargeted and permanent increase in the level of rail subsidy without having considered the justification for, or effectiveness of, this financial commitment;
• risk and uncertainty have not been taken properly into account throughout the analysis;
• optimism bias has been incorrectly applied to the cost savings on the existing network after the opening of HS2, thus inflating this item of benefits attributed to HS2 by 41%;
• costs of HS2 are being incurred in the short term, when the climate for public spending is very difficult. However, there will be no benefits until the project opens in fifteen years’ time and most of the benefits will not be gained until thirty to forty years in the future. This is a very long-term project even by the standards of major transport infrastructure, comparable with, for example, the Channel Tunnel, the forecasts for which quickly proved wholly unreliable; and
• expanding capacity across the existing rail network and targeted improvements to the road network would provide a far greater contribution to bridging the North–South divide and could be delivered much earlier.
This long list of errors summarises why the economic case for the construction of a high-speed rail link between London and the West Midlands is seriously flawed. Our review of the reports issued with the Government’s consultation and other work on capacity and alternatives to HS2 submitted to the Transport Select Committee demonstrate that a much better and cheaper solution would be to provide additional capacity on the existing network to meet the increases in demand as they materialise. This is a far less risky and more cost-effective solution. It does not involve committing some £18 billion to construct a new line that will not be available for use until 2025 on the strength of some very uncertain demand forecasts, in order to achieve benefits from faster rail journey times that have dubious economic value, most of which will not materialise for thirty or forty years into the future.
The Government has launched its consultation assuming that it will go onto construct the ‘Y’ network extending HS2 from Birmingham to Leeds and Manchester. It believes that the case for extending the HS2 beyond Birmingham will be stronger than the economic case for the London to Birmingham line alone. But the preliminary analysis it has produced to demonstrate this appears to be very crude and no details have been released so that it can be reviewed. The economic analysis that has been carried out for the London to Birmingham line, on which the indicative estimates for the ‘Y’ network were based, is so weak that it seems very unlikely to be sufficiently

viiiReview of the Economic Case for HS2
improved when applied to the ‘Y’ network to justify committing well over £30 billion.
Furthermore, there are serious doubts that the ‘Y’ network will be viable on purely operational grounds. It will require 18 trains per hour to run in the peak hours to meet the capacity requirements for the forecast traffic. This level of operating capacity has never been achieved on any high-speed railway in the world – even ones that are totally self-contained. HS2 will not be self-contained and its capacity will be affected by imported delays from the trains running into the HS2 system, along with other operational constraints.
As the debate has continued and more information has come available, the arguments against HS2 have multiplied. The benefits claimed for the wider economy from faster journeys in the narrow intercity travel market are largely illusory, or, at best, small. HS2 is expected to generate a great deal of additional traffic which in turn will create more road trips at either end of the journey, thus increasing harm to the environment. This major new route will create noise, visual intrusion and serious severance effects across hundreds of miles of urban and rural areas. The Government is proposing that the taxpayer, rather than the user, will pay for more than half the capital costs of HS2, even though, on its own estimates, the economic case is marginal.
Our analysis has shown the economic benefits to users are much less than claimed. The risks in the demand forecasts have been considerably increased by extending the forecasting period well beyond the time frame for which the assumptions used can be regarded as reliable. Furthermore, the crowding benefits that have been claimed arise only because an unrealistic base case for comparison has been used. If the scheme was compared with a suitably optimised alternative, or with the Rail Package 2 (RP2) alternative proposed by the DfT’s own consultants, the crowding benefits would be achieved at a lower cost. We have also found that the reliability benefits of HS2 have been overstated but it is difficult to estimate by how much. Finally, the benefits of faster rail journey times to business travellers are much less than stated because the assumed value of working times saved on trains is far too high.
The effect of these adjustments, and others arising from our review, on the results of the economic appraisal of HS2 are shown in Table 1. We would emphasise that these adjustments are not sensitivity tests but are our assessment of more realistic central assumptions for the evaluation. The economic case for building HS2 is far weaker than suggested in the Government’s cost–benefit analysis and the economic costs are likely to exceed the benefits substantially.

ixReview of the Economic Case for HS2
The benefit:cost ratio (BCR)1 from the Government’s own transport user cost–benefit analysis is 1.6 for the London to Birmingham route. The adjusted BCRs shown in Table 1 are approximations to the outcome of a full reappraisal but they give a reasonable estimate of the impact of these proposed revisions. They do not include any adjustment to shorten the forecast period to within a reliable range, or for a reduction in the reliability benefits, although we believe these adjustments should be made. Neither do they make proper allowance for the high levels of risk and uncertainty in such a long-term project, for which more than half the benefits are more than forty years in the future. A combination of any two of the reasonable adjustments shown in the table eliminates the case for HS2 and the combination of all of them has a massive effect.
Table 1: BCR after adjustments to the appraisal assumptions
Adjustment to benefits Adjusted BCR from 1.6
1 Reduce demand forecasts by 29% 1.1
2 Revised base case (no crowding) 1.4
3 Value working time at commuter rate 1.2
4 Operating life 40 years 1.3
Adjustment 2 + 3 0.9
Adjustment 1 + 2 +3 0.7
Adjustment 1 + 2 +3 + 4 0.5
Source: Authors’ estimates based on data from HS2 Ltd (2010)
In other words we believe – implied by a BCR of less than 1 – that one way or another there is a high probability that the costs of HS2 will exceed its benefits even, under plausible assumptions, by as much as 100%. We therefore believe that there is a need for an independent reappraisal of the HS2 scheme in the context of a wider policy and strategic framework for the transport network as a whole. This appraisal should correct the errors in the analysis, use more realistic assumptions and take proper account of risk and uncertainty and make a direct comparison of HS2 with the best alternative scheme to determine the optimal strategy for developing the WCML route.
1 Following the practice of the Government, the term benefit:cost ratio (BCR) has been used in this report to present the results of the evaluation. But the term net benefit ratio (NBR) is the more accurate terminology (see Section 7). The BCR/NBR represents a measure of value for money for use of government subsidy. It is not the conventional measure of the ratio of total benefits to total economic costs that is normally used in appraisals. The scale of the BCR/NBR reported for HS2 should be judged in the light of an NBR of infinity that would arise for any non-subsidised, commercial project. It should also be compared with the figures achieved for other projects in the transport sector which often achieve a BCR/NBR of more than 5. The BCR/NBR reported for HS2 is less than 2 which, for a revenue-earning project to be operated on commercial lines, is low.

1Review of the Economic Case for HS2
1. Making the Case for High Speed Rail in Britain
We were commissioned to carry out a review of the economic case for High Speed 2 (HS2) that has been presented as part of the Government’s consultation on high-speed rail. Our work has focused on the analysis of the proposed high-speed rail link between London and the West Midlands, since a full economic appraisal of this line has been carried out by HS2 Ltd for this link. The Government has launched a consultation on a broader ‘Y’ network,
extending the line to Leeds and Manchester. However, an economic appraisal for this network has not yet been published and only some broad estimates have been prepared of the scale of the benefits and costs involved based on the London to Birmingham appraisal. A full economic appraisal of the ‘Y’ network is expected to be published towards the end of 2011.
Our review of the benefits of the London to West Midlands link has been largely confined to the estimates of transport user benefits and the overall appraisal framework. Transport user benefits make up 80% of total benefits. We have not reviewed the capital and operating cost estimates that have been used in the appraisal of HS2. Neither have we reviewed the environmental impacts which have been the subject of other reviews. The non-user, or wider economic, benefits that have been claimed for the project have been reviewed by Professor Tomaney and his conclusions have been reported to the House of Commons Transport Select Committee (Tomaney, 2011). We have drawn on other work submitted to the Select Committee to address the technical and operational aspects as they affect the operational capacity of HS2 and alternative ways in which rail capacity on or in the vicinity of the West Coast Main Line (WCML) route might be increased (Stokes, 2011). This work, by Chris Stokes, is also reproduced as Appendix 1 to our report.
To set the context for our review, we start by summarising the way the policy for high-speed rail in Britain has developed over time. Although this review is primarily a technical review of the economic case for HS2, we have commented on important policy issues in our report. The scale of the investment envisaged and its wider implications for the railway network make it

2Review of the Economic Case for HS2
essential to consider these policy issues as part of any review of the appraisal of HS2. We start by considering how the HS2 policy came to be adopted by the Government.
Early proposals for high-speed rail links in Britain
The first proposal to construct a new dedicated high-speed railway2 linking London with the north of Britain was made by Virgin Trains to the Strategic Rail Authority (SRA) in 2000. At that time the SRA was encouraging private sector train operators to make bold and imaginative proposals for the development of the railways. The SRA picked up the idea for high-speed rail and carried out some preliminary work during 2000. In 2001 Virgin put forward its proposal for high-speed rail on the East Coast Main Line in its bid to win the franchise, but this was rejected in favour of the bid from the incumbent operator Great North Eastern Railway.
Prior to these proposals, the idea of a high-speed rail network for domestic rail services in Britain had not been considered seriously. Until rail privatisation, passenger demand on the railways had remained broadly level for the past thirty years. A case for making very large investments to increase railway capacity by building new lines for high-speed rail services over the relatively short intercity routes in Britain did not exist. An exception was seen in the international Channel Tunnel Rail Link between London and the high-speed rail network in France. The case for High Speed 1 (HS1), as the Channel Tunnel Rail Link came to be known later, was built on the strength of demand forecasts developed using methods similar to those adopted for the appraisal of HS2. The forecasts for HS1 later proved to be wildly optimistic by a factor of about three.
The prospects for growth in rail travel changed after rail privatisation, which brought new investment, particularly in rolling stock, into the industry, together with new commercial management, improvements in service quality and marketing innovations. These factors, together with increases in personal incomes and deterioration in the competitive position of road transport, led to sustained growth in rail passenger demand after 1996, particularly for long-distance journeys. The number of journeys on long-distance rail services nearly doubled between 1995 and 2008. Growth in rail demand was encouraged by incentives within the franchise contracts for train operators to fill the train capacity available by price differentiation using yield management techniques to encourage demand in the off-peak periods.
In the same period from 1995, growth in total long-distance travel by all modes of transport grew slowly until 2003, and has since remained broadly constant. Statistical analysis has been used to try to explain the growth in rail demand
2 High speed rail is defined by the European Commission in Council Directive 96/48/EC as services with a maximum speed of at least 250 km/h on purpose-built new lines or 200 km/h on existing lines.

3Review of the Economic Case for HS2
against the pattern of the stability in the total market. However, indicators of rail service quality and competitiveness are not readily available to be included in this analysis. Therefore, it is difficult to distinguish and separate the various influences on rail demand, including rising incomes, changes in the structure of demand and changes in the relative competitiveness and attractiveness of rail travel. The primary drivers of demand growth that are used in forecasting demand for rail travel are income and relative prices, using estimates of income elasticity of demand3 and the price elasticity of demand. The estimates used for forecasting demand have been revised several times in response to changing evidence. However, income and price changes have not been the only factors causing the rapid growth in rail demand since privatisation, and uncertainty over the long-term stability of these relationships over time adds considerably to the risks in the forecasts.
In August 2001 the SRA appointed the consultants Atkins to carry out a study of the case for building high-speed rail links in Britain. The study was completed in January 2003 and made a case in favour of a new dedicated high-speed rail network, starting with a link from London to the West Midlands. Atkins forecast that growth in demand for rail travel would continue over the long term, particularly on the long-distance strategic routes, based on the new relationships between rail travel and future growth in incomes. The study concludes that limitations on the ability to increase capacity on the existing rail and road networks would make the construction of a new high-speed rail network a better option. The average rate of growth of rail traffic forecast by Atkins on the strategic WCML route was 3.6% per year over thirty years, leading to an expected tripling of demand on the route and a rise in the average train load factor from 36% to 81% by 2031, given current rail and road capacity levels.
3 The ratio of the percentage growth in demand to the percentage growth in incomes causing demand growth.

4Review of the Economic Case for HS2
After completion of the study, proponents of the scheme continued to press the case for building a high-speed railway. Greengauge 21, for example, founded in 2006 by Jim Steer, the former Director of Strategy at the SRA, and Julie Mills, who had led the Atkins study, is a non-profit public interest company that promotes the case for high-speed rail. It has published various forecasting and evaluation studies to make the case for HS2.
In the same year The Eddington Transport Study was published (Eddington, 2006), which had been commissioned by the Treasury and the Department for Transport (DfT) to investigate the long-term relationship between transport and productivity in the UK. The study proposes a different set of priorities for the development of the UK’s transport sector. It warns against concentrating scarce investment resources on large-scale schemes serving particular parts of the country. It demonstrates that much better economic returns and more beneficial impacts on the wider economy could be achieved by investment in a range of smaller schemes balanced across the transport sector. By this means, increases in capacity could be achieved sooner, in line with rising demand and at lower risk than providing large lumpy additions to capacity based on uncertain growth forecasts.
Government support for the high-speed rail project
At the Conservative Party conference in September 2008, the then Shadow Transport Secretary Theresa Villiers made a speech committing the Conservative Party to the development of a high-speed rail network. Her initiative was quickly matched by the governing Labour Party when Lord Adonis became Minister of State, and later Secretary of State, for Transport. Lord Adonis’ enthusiasm for high-speed rail was apparent, seemingly driven by examples in other countries like Japan and France that had established successful high-speed rail networks, albeit in very different economic geographies to that in Britain and with the benefit of large initial capital subsidies. He visited Japan in November 2008 and returned enthused for high-speed rail. He set up HS2 Ltd as a government-owned company in January 2009 with a remit to consider the case for building a high-speed rail network in Britain.
The institutional rationale for establishing HS2 Ltd as a government-owned company at such an early stage in the consideration of the case for high-speed rail is not clear. HS2 Ltd insists that it is not a project promoter aiming to make the case for HS2. Rather, it describes its task as evaluating the merits of the case for HS2. However, its ability to carry out an objective and balanced evaluation is restricted by its focus on HS2 as the only solution it has considered to meet the capacity requirements on the intercity rail network. The consideration of alternative solutions was carried out separately and later by the DfT and has had lower priority, less attention and fewer resources. The fact that HS2 Ltd is examining only one solution has been a crucial weakness in the way the economic case for HS2 has been appraised by the Government. The case for building HS2 is clearly a major policy question that needs to be

5Review of the Economic Case for HS2
considered in the context of all the reasonable options for addressing the capacity issues at stake. In failing to consider a range of options within a single framework, the appraisal has clearly failed to meet the Government’s own standards for appraisal as set out in the Green Book. The second step of this approach is to ‘set out clearly the desired outcomes and objectives of an intervention in order to identify the full range of options that may be available to deliver them.’
HS2 Ltd appointed Atkins to carry out its analytical work, based on the DfT’s standard New Approach to Appraisal (NATA) methodology and framework for transport project evaluations. HS2 Ltd delivered its first report on the business case for the London to the West Midlands link of the HS2 in December 2009. The report (HS2 Ltd, 2010a) was published in March 2010 alongside a White Paper on high-speed rail (DfT, 2010). HS2 Ltd (2010a) refers to work carried out by both Network Rail and Greengauge 21 on high-speed rail and to having ‘kept in close touch’ with these organisations during the study. Since the same parties were involved in earlier work, it was unlikely that HS2 Ltd’s work would bring a fresh perspective to the appraisal of the project. HS2 Ltd’s report broadly agreed with the earlier report that rail passenger demand growth would result in average load factors exceeding 80% on the WCML by 2033, based on a very similar rate of growth in rail traffic that had been forecast seven years earlier. HS2 Ltd’s cost–benefit appraisal resulted in a NATA net benefit:cost ratio (BCR) of 2.4, including only transport user benefits, and 2.7 when wider economic benefits were also included.
The Conservative and Liberal Democratic parties declared their support for high-speed rail in the run-up to the 2010 general election, mirroring Labour’s commitment to the project. The Coalition Government then made an early commitment to HS2 in the Coalition Agreement. The political appeal of HS2 is evident. It appears to be an environmentally friendly, bold strategic investment in a high technology solution to the nation’s long-term transport needs; it is also one that has been adopted by a number of other leading nations. By reducing travel time by rail between London and city centres in the north of England it might somehow bridge the ‘North–South divide’. However, none of these propositions had been properly tested at the time the political commitments were made to the project.
High Speed Rail consultation
Now that the work within Government on the business case has progressed, there are growing doubts that the evidence produced by the studies carried out by the Government supports the claims that have been made for the HS2. The economic returns shown by the latest appraisal prepared by HS2 Ltd are relatively low. It will be broadly carbon-neutral and it will impose significant environmental costs on the landscape from its visual, noise impacts and severance effects. It will divert very little traffic from road and it will not reduce the number of flights out of London. The wider economic and strategic

6Review of the Economic Case for HS2
benefits that have been claimed for the project have not been demonstrated by analysis. Nor will the proposed links to Heathrow, or to HS1, be viable or practical. The Labour Party is now re-evaluating its commitment in the light of the new circumstances and outlook for the economy.
The Government launched a consultation on HS2 and issued a large number of documents in support, including a revised and updated Economic Case for HS2 (HS2 Ltd/DfT, 2011). This new appraisal includes an initial indicative evaluation of a ‘Y’ network, which would extend the network to Leeds and Manchester from Birmingham, bringing the costs of the proposed HS2 project to some £30 billion in present value terms, including a contribution from taxpayers of £17 billion. This indicative appraisal of the ‘Y’ network is however too broad-brush to provide a basis for decision-making and the Government intends to issue a full appraisal of the ‘Y’ by the end of 2011. We have therefore concentrated on the analysis of the economic case for the London to the West Midlands link for our review, on which the estimates for the ‘Y’ network have been based.
In our opinion, the Government’s approach is seriously flawed. It is pressing ahead with work on the link from London to Birmingham before the ‘Y’ network is properly appraised, even though this section of the line can only ever be justified as part of the wider ‘Y’ network.
Revisions to the economic case for HS2
Since the initial appraisal carried out by HS2 Ltd in December 2009 and its update in March 2011, there have been a number of significant changes in the economic prospects and the assumptions underpinning the evaluation of HS2, which are summarised below and in Table 2:
• Prospects for economic growth are lower and the future has become less certain as the world economy continues to struggle with issues of insecure sovereign and private debt and low consumer confidence.
• The demand forecasts have been adjusted to recognise the Government’s policy of increasing rail fares by RPI (retail price index) +3% for the next three years. Thereafter, they assume a continuation of the policy of increasing rail fares by RPI +1%.
• Errors in Atkins’ modelling work, which had resulted in the earlier demand forecasts being inflated, have been corrected and other adjustments made to the modelling.
• Significant reductions in the cost estimates were made. Some of these were related to the reductions in the rate of growth in demand so the timing of rolling stock purchases changed accordingly.
• Various changes were made in the appraisal accounting framework.

7Review of the Economic Case for HS2
Table 2: Effect on the net value of the benefits of HS2 from changes in the evaluations – March 2010 v. February 2011
Net effect of changes in costs +£2,397 million
Net effect of changes in demand forecasts -£4,633 million
Net effect of changes in modelling -£4,515 million
Net effect changes in the appraisal methods +£264 million
Total impact on present value of net benefits -£6,487 million
Source: Calculated by authors from HS2 Ltd (2011)
The scale of the changes on the results of the appraisal is significant, reducing the benefit of HS2 by nearly a third of the current estimate of the benefits. It raises questions about the robustness of the conclusions in the report. The new demand forecasts were reduced by about 30% compared to the earlier figures. The main rationale for a new high-speed rail line had been that high forecasts of demand required significant increases in capacity that could not be achieved economically on the existing network. Faced with these reductions in the forecasts of demand, HS2 Ltd decided to extend the period of the forecast by a further ten years to 2043 before applying an assumed ‘cap’ on demand. The timing of the cap had already been extended seven years beyond that recommended in the DfT’s NATA guidelines, to 2033 in the earlier appraisals. This further extension of the forecasting period for the most recent evaluation is well outside the secure time frame for the NATA demand forecasting methodology and was a major departure from the DfT’s own guidance.
The appraisal period used for estimating the net benefits of HS2 is very long, extending sixty years beyond the planned opening date for the project of 2025. HS2 Ltd’s latest appraisal shows the NATA BCR at 1.6, down substantially on 2.4 found in the 2009 appraisal. However, this analysis is heavily dependent on the inclusion of benefits in the period between forty to eighty years into the future, which account for more than half the benefits. Given the rate and scale of social and economic change that can be expected so far into the future, this greatly increases the risks and uncertainties of the economic case of the project. The appraisal of the project has not treated the issue of risk in a systematic fashion. There is no estimation of the probability range for key variables and the sensitivity tests that have been carried out are inadequate to reveal the impact of key uncertainties. Thus, the appraisal of HS2 has not learnt the lessons from international experience of similar large-scale infrastructure projects that failed to evaluate the impact of risk on investment decisions.
Work carried out by Atkins for the DfT on alternatives to HS2 has demonstrated that the capacity of the existing network can be increased to meet growing demand for the foreseeable future. This work has been reviewed by a railway specialist as discussed above. It has demonstrated that Atkins’ proposals

8Review of the Economic Case for HS2
are not the most effective way of increasing capacity on the existing network. Much more can be achieved, at lower cost, by lengthening and reconfiguring trains and making full use of the capacity available. This work has demonstrated that the capacity for standard-class seating on the WCML can be more than tripled at relatively low cost from the 2008 base that was used for HS2 Ltd’s analysis. Thus, there is a serious question over the need for HS2.
Apart from capacity requirements, the second key justification for building a high-speed rail network is that it would provide faster journey times and hence save travel time for users. The DfT has used a conventional approach to estimating the economic value of time savings, which relies on the assumption that time spent travelling in working time is unproductive. This is a reasonable assumption for car travel, for which these estimates were first developed. But the DfT has now acknowledged that it is not a sound assumption for rail travel in working time for business users, since it is evident that they do work on trains and rail travel does not present a barrier to productive work, as assumed by the DfT in its appraisal of HS2. The DfT has now recognised that the value put on these benefits is erroneous and that estimation of the true value of time savings for business travellers requires more research and analysis.
There are therefore good reasons to carry out a review of the work that has been done to evaluate this large and costly project. With gross expenditure in prospect of £30 billion or more, including £750 million on taxpayer-funded preparatory work during the current spending review period and at a time of unusual austerity, it is right to examine the economic case rigorously.

9Review of the Economic Case for HS2
providing rail capacity in this form, and the faster journey times that will result, must be analysed and quantified in monetary terms and compared with the additional costs that will be incurred in constructing and operating HS2. This analysis must include the impact on users of other parts of the rail network and the net cost and revenue changes on the rest of the network. In addition, a large project such is this will have a number of wider impacts on the regional and national economy and on the environment. The main focus of our review is the transport user benefits, which make up about 80% of the total quantified benefits identified in the Government’s appraisal.
Key inputs to the economic appraisal
A set of network transport models, based on previous work, was developed by HS2 Ltd to forecast demand on rail and other modes and to analyse the likely amount of traffic that would use HS2. These models were also used to quantify transport user benefits. The DfT and HS2 Ltd have placed extensive documentation in the public domain for the public consultation exercise. However, the models themselves have not been made public and it is therefore not always possible to examine the detailed assumptions, operations and analysis which underlie the models. Nor were the disaggregated outputs available in a suitable form to examine the plausibility of the analysis at the detailed level.
The models have used standard network modelling techniques and the assumptions in them have been mainly drawn from the DfT’s WebTAG modules
2. Economic Appraisal of HS2 London–West Midlands
The primary reason for the Government adopting the policy of building HS2 is to meet the rail capacity needs for future growth in rail traffic on the WCML corridor. In addition, HS2 will provide the benefits of much faster train journeys between London and Birmingham and, later, to points further north. In order to assess whether building HS2 is a sound economic decision, the benefits expected to transport users from

10Review of the Economic Case for HS2
and the Passenger Demand Forecasting Handbook (PDFH), developed by the Association of Train Operating Companies. WebTAG is publicly available on the DfT’s website, but the PDFH is commercially confidential. The PDFH includes a great deal of research on the structure and trends in the railway market and the factors influencing the development of the market. The fact that this document is not publicly available when it contains some of the key material to evaluate the methods and assumptions used to justify the expenditure of large amounts of public money on railway investment appears anomalous. We understand that a Freedom of Information request has been submitted to release this document to the public and we would strongly support this request in the interests of transparency and sound analysis.
The network models used for this appraisal are complex and they have the characteristics of a ‘black box’ in that any errors within them are hard to detect, even by those using them. Any modelling exercise of this sort inevitably requires elements of judgement to be deployed at the detailed level in model development and use. The significance of these judgements is not entirely transparent to the outside reviewer. Without access to the models and the detailed outputs it is not possible for an independent review such as this to check the validity of all the results. To illustrate the point, an error was found by HS2 Ltd after a model audit in the Station Access Model due to the incorrect weighting of the access times to city centre stations. This had a substantial effect on the results of the forecasts published in 2010. Errors such as this are common in the course of this kind of modelling and can lead to significant changes in the results and it is to HS2 Ltd’s credit that it carried out the audit and publicised the errors. In our view, the speed at which the analysis was carried out was conducive to errors of this sort. With more elapsed time for the study such problems might have been avoided.
Nevertheless, most of the key assumptions and the framework and methodology of the analysis are clear from the published documents. We were also able to discuss elements of the appraisal with the DfT and HS2 Ltd.
Components of the economic appraisal
The economic appraisal of HS2 requires a number of key elements:
• development of a suitable base case describing the scenario without HS2, to be compared with the expected outcomes if HS2 is built;
• forecasts of demand for both the base case and the HS2 case, including the changes in demand across the broader transport networks;
• identification of the individual impacts of HS2 and quantification of the benefits and costs and revenue effects arising in the base year and at the end of the forecast period;
• estimation of the time stream of capital and operating costs of the railway under each of the two cases over the project life;

11Review of the Economic Case for HS2
• deciding the cost–benefit accounting framework to identify costs and benefits to the relevant parties (government, transport users, private providers and the wider society) and making appropriate adjustments, for instance in the treatment of indirect taxes;
• discounting the time stream of costs, benefits and revenue effects over the project life to present values using appropriate discount rates; and
• sensitivity tests on key assumptions to examine the vulnerability of the case to risk and uncertainty.
The issues relating to the base case for comparison of HS2 are discussed in Section 3, which also considers the issue of the justification for the large subsidy envisaged for constructing HS2. The forecasts of demand are discussed in Section 4. Transport user benefits are covered in Section 5, focusing on the value of time. Section 6 discusses the evaluation of alternatives to HS2. Section 7 covers a range of other issues including the treatment of risk and uncertainty, sensitivity tests, the impact on the rest of the rail network, the project appraisal period, the discounting of costs and benefits and wider economic benefits as well as the accounting framework and presentation of the results. Section 8 presents our conclusions.
As noted earlier, we have not addressed the issue of wider economic benefits in this paper since these have been addressed by Professor Tomaney, a recognised specialist in the field. We have, however, summarised his findings later in this report. Neither have we addressed any of the issues relating to the estimation of capital and operating costs.
12Review of the Economic Case for HS2
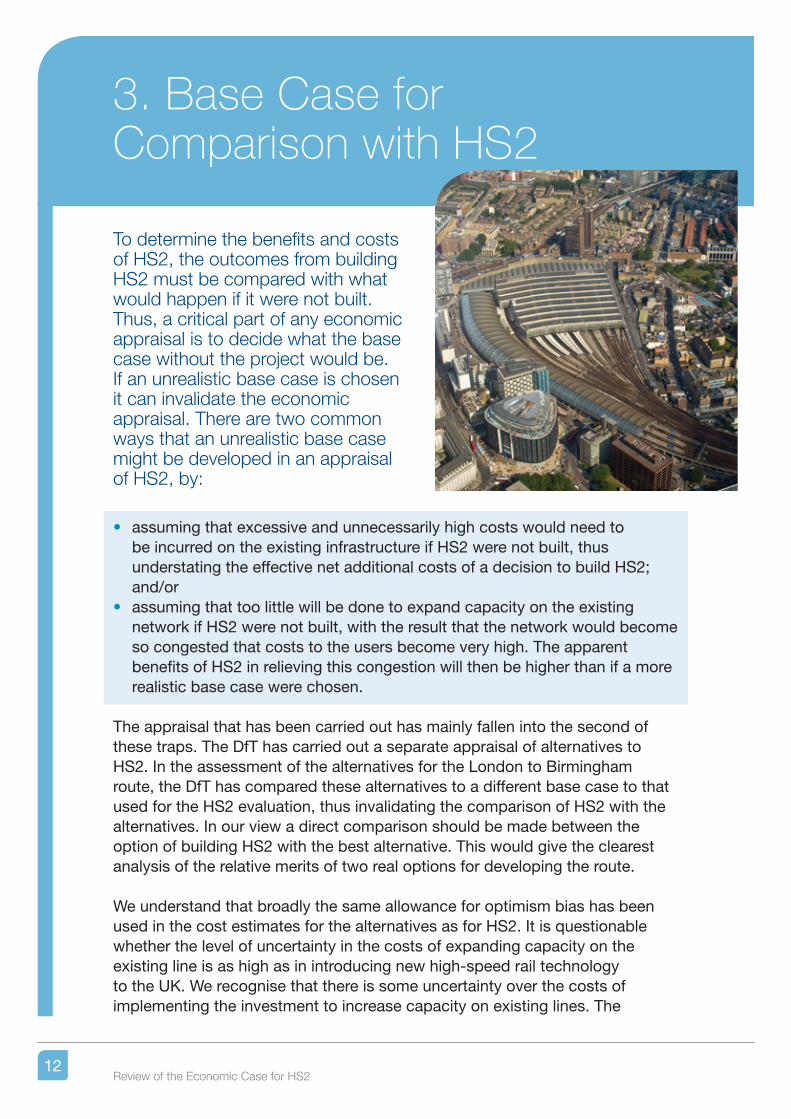
3. Base Case for Comparison with HS2
To determine the benefits and costs of HS2, the outcomes from building HS2 must be compared with what would happen if it were not built. Thus, a critical part of any economic appraisal is to decide what the base case without the project would be. If an unrealistic base case is chosen it can invalidate the economic appraisal. There are two common ways that an unrealistic base case might be developed in an appraisal of HS2, by:
• assuming that excessive and unnecessarily high costs would need to be incurred on the existing infrastructure if HS2 were not built, thus understating the effective net additional costs of a decision to build HS2; and/or
• assuming that too little will be done to expand capacity on the existing network if HS2 were not built, with the result that the network would become so congested that costs to the users become very high. The apparent benefits of HS2 in relieving this congestion will then be higher than if a more realistic base case were chosen.
The appraisal that has been carried out has mainly fallen into the second of these traps. The DfT has carried out a separate appraisal of alternatives to HS2. In the assessment of the alternatives for the London to Birmingham route, the DfT has compared these alternatives to a different base case to that used for the HS2 evaluation, thus invalidating the comparison of HS2 with the alternatives. In our view a direct comparison should be made between the option of building HS2 with the best alternative. This would give the clearest analysis of the relative merits of two real options for developing the route.
We understand that broadly the same allowance for optimism bias has been used in the cost estimates for the alternatives as for HS2. It is questionable whether the level of uncertainty in the costs of expanding capacity on the existing line is as high as in introducing new high-speed rail technology to the UK. We recognise that there is some uncertainty over the costs of implementing the investment to increase capacity on existing lines. The

13Review of the Economic Case for HS2
upgrade of the WCML illustrates these risks. Schedule 4 payments by Network Rail to train operators for revenue lost as a result of disruption can inflate the costs of upgrades significantly and are difficult to estimate. However, the majority of the capacity enhancement proposed in the alternative to HS2 set out in Appendix 1 is achieved by lengthening trains and changing the configuration between first and standard class. We consider that the risks in this investment are far lower than those associated with a technology new to the UK. Recent experiences in Edinburgh of developing a new tram link illustrate the risks of costs spiralling out of control even for a project using well-tried rail technology.
Government project appraisal guidelines
The economic case for HS2 which has been developed by HS2 Ltd and the DfT follows guidance prepared by the Treasury in the Green Book on Appraisal and Evaluation in Central Government and by the DfT in its NATA. NATA implements the Green Book for transport schemes. The approach is explained in WebTAG. The DfT has recently announced that NATA is to be dropped. We understand that the methodology used by HS2 Ltd is consistent with the latest guidance and that the detailed methodologies and assumptions set out in WebTAG will be retained and used for economic appraisal.
In general, we consider that this is good-quality guidance for the great majority of transport projects, although there are particular features of HS2 that need to be taken into account. The appraisal of HS2 has followed this guidance properly. However, in four key areas we consider that there are shortcomings where the standards of the Green Book and NATA have not been met. These are the:
• timing of the arbitrary cap placed on the demand forecasts (see Section 4);• use of a ‘do-minimum’ case as a base case in the appraisal of HS2;• failure to use the same base case in appraising HS2 and the alternatives to
HS2 for the London to West Midlands link; and• failure to look at a sufficiently wide range of options in the appraisal.
The ‘do-minimum’ case
Both the Green Book and NATA lay great stress on the ‘do-minimum’ case. The Green Book insists that it should always be considered and ‘carried forward in the shortlist, to act as a check against more interventionist action.’ WebTAG amplifies this guidance for transport schemes stating that:
‘The “do-nothing” scenario generally makes little sense as the datum against which the options are compared because it is very rare for there to be no changes at all to the present system in the pipeline. The most usual basis for the assessment of options is the “do-minimum” in which only committed changes are added to the existing system. These “committed” changes, which may apply to public transport and parking

14Review of the Economic Case for HS2
as well as roads and traffic management, should be limited to those schemes to which a genuine commitment has been made from which it would be difficult to withdraw. This includes projects for which tenders have been invited or let and projects to which Ministers have given a firm commitment (for example, road schemes in the Targeted Programme of Improvements).’
For the vast majority of small- and medium-scale schemes which are appraised using the Green Book and WebTAG, the ‘do-minimum’ will provide a suitable base case against which to evaluate proposed actions. However, for a major scheme, such as HS2, which will not be available for some fifteen years and will have a very long project life thereafter, the ‘do-minimum’ is no more realistic as a base case than the ‘do nothing’. It is inconceivable that any government, faced with further rapid increases in demand on the route from London to Birmingham, would fail to provide additional seating capacity and permit very high levels of overcrowding to develop for many decades into the future.
This possibility is recognised in both the Green Book and WebTAG, albeit in slightly different ways. The Green Book states: ‘The term “Base Case” is sometimes used to refer to the “do-minimum” option, but it is not used in this way in the Green Book.’ WebTAG says: ‘The “do-minimum” should also include minor changes which can be expected to be carried out as conditions deteriorate – signalisation of busy priority junctions, for example.’ In both cases the authors clearly recognise that the ‘do-minimum’ should not be used as a reference case for appraisals where it is clearly unrealistic. Neither the Green Book nor WebTAG fully addresses all the issues concerning the appraisal of mega projects such as HS2.
The ‘do-minimum’ case that has been used to compare the HS2 scheme has assumed that only the committed project to lengthen 31 of the 52 Pendolino trains operating on the WCML from 9 to 11 cars would be carried out and this would remain the case for the whole of the sixty-year project life to 2092. We assume that the appraisal includes allowance for the costs of replacing the units when needed over the project life, or that estimates of the annual costs of leasing rolling stock have been used throughout.
With the restricted capacity implied by this ‘do-minimum’ case, the amount of crowding that will be forecast before HS2 opens and in subsequent years grows continuously to very high levels. This in turn results in high apparent levels of benefit being attributed to HS2 by relieving this artificial level of congestion. What should have been done was to allow for further capacity increments on existing routes in the base case in order to prevent high and unrealistic levels of overcrowding being forecast during the evaluation period. As Chris Stokes demonstrates (see Appendix 1), such capacity increments can be easily implemented, at relatively low cost, by lengthening and reconfiguring trains without the need for excessively high infrastructure costs.

15Review of the Economic Case for HS2
It is certain that the benefits of HS2 have been exaggerated as a result of this error. An arbitrary cap has been applied to the demand forecasts at the point that rail traffic is forecast to double. In the initial evaluation, released by HS2 Ltd at the beginning of 2010, traffic was forecast to double by 2033. In the latest forecasts this doubling is not expected to occur until 2043. This arbitrary cap on base demand growth has conveniently ensured that the capacity of HS2 is forecast to be fully utilised at around the time that base traffic has doubled and the traffic with HS2, including additional diverted and newly generated traffic, will have tripled. It also allows a limit to be placed on the effect of excessive overcrowding in the ‘do-minimum’ case to prevent the modelling of the overcrowding function becoming unstable, as would be the case at very high train load factors. The adoption of a cap on demand at this critical point appears arbitrary. It potentially enables the results of the evaluation to be ‘backward engineered’ by setting the cap on the forecasts to match the capacity provision available on HS2 and to limit the effect of excessive crowding in the modelling.
Combining this distortion in reality with the very long operating life of sixty years assumed for HS2, together with the low discount rate adopted in Treasury guidance, has created a high degree of arbitrariness in the results of the appraisal.4
The two base cases
In any cost–benefit study it is vital to compare all alternatives against the same base case. The Green Book states: ‘Each option is then appraised by establishing a Base Case.’ The report produced by HS2 Ltd does not examine any alternatives but a separate report by Atkins for the DfT has examined a number of alternatives involving a series of improvements to the WCML (see Section 6). In carrying out this work Atkins used a different, and in our opinion much more realistic, base case which envisaged the lengthening of the whole fleet of Pendolino units and some other minor improvements in order to address overcrowding. The DfT informs us that this was due to unspecified difficulties in modelling the original base case that was used for the HS2 evaluation.
As a result of this difference in the two base cases, the results of the Atkins study of alternatives and the HS2 appraisal for the West Midlands link are not comparable. The enhancement of the base case in the analysis of alternatives will probably have resulted in depressing the BCR of the alternatives. This is because the lengthening of the additional trains in the fleet assumed in the enhanced base case would reduce the difference in train load factors, and hence the crowding relief, with the alternatives case. Despite this bias against the alternative, the most attractive alternative, RP2, achieved a BCR of 1.9 for transport user benefits which exceeds the BCR of 1.6 for HS2. Given this superior result for the alternative to HS2, it is unclear why the Government has
4 3.5% for the first thirty years and 3.0% for the remainder of the appraisal period, with a further drop to 2.5% seventy-five years from the current year, i.e. forty-five years into the appraisal period of HS2.

16Review of the Economic Case for HS2
not put more emphasis on identifying and evaluating the best alternative option to HS2 which would be both very much cheaper and could be implemented sooner, with less risk and in line with demand growth as it materialises.
There are also other distortions in the analysis. Some infrastructure costs in the Stafford area were included in the base case for the evaluation of the alternatives but were excluded from the ‘do-minimum’ for the HS2 evaluation. This has created another inconsistency in relative favour of HS2 over the alternatives. Furthermore, some of the costs that have been included in the preferred alternative scheme, RP2, are not necessary, or not attributable, to the relevant WCML services.
The DfT also released another Atkins report for the consultation entitled Strategic alternatives to the proposed ‘Y’ network (Atkins, 2011), in anticipation of the completion of the evaluation of the HS2 ‘Y’ network. It appears that the base case for this analysis will be consistent with the appraisal of the ‘Y’ network when it is released.
Failure to look at other options and to justify subsidy requirements
Both the HS2 Ltd study and the Atkins review of alternatives look at HS2 on a ‘predict and provide’ basis and lay exclusive emphasis on the BCR of the investments which they are reviewing. However, this is against the advice given in WebTAG, which states: ‘The BCR is of limited value where projects (road user charging, for example) result in significant revenues accruing to the Broad Transport Budget (for national or local government) such that the Present Value of Costs (PVC) becomes negative.’ For projects with significant revenue the appraisal should never separate the issue of investment from the issue of pricing.
However, the appraisal of HS2 does not make any attempt to examine the proposed structure and level of fares on the existing lines, prior to considering the need for investment. Infrastructure industries like railways tend to require large lumpy investments to expand capacity when certain operating limits are reached. The normal economic pricing policy in such industries is to adopt long-run marginal cost pricing principles.5 There has been no public policy discussion of the role of such pricing principles in the context of the HS2 investment. A pricing policy based on these principles would optimise the timing for investment in capacity and would ensure that all efficient incremental investment options were carried out before provision of the huge increment in capacity with HS2 is considered.
5 Long-run marginal cost prices are set at the level of the forward-looking total costs of providing the additional capacity needed to meet forecast growth over the next investment increment. This may imply a significant rise in prices towards the time that capacity limits are being reached when a major increment of investment is needed to reflect the anticipated costs of catering for this demand. The impact of higher prices on demand may in turn dampen demand and delay or obviate the need for investment, thus improving economic efficiency. On the other hand, if smaller increments of capacity can be provided efficiently it will allow lower prices and a smoother and more efficient profile of investment.

17Review of the Economic Case for HS2
Any subsidy that may be provided needs to be justified on the basis of the economic benefits generated over and above those that can be achieved without providing the subsidy. There is no evidence that this analysis has been carried out, or that the policy issues relating to subsidy have been considered. The decision to subsidise HS2 so heavily leads to circular reasoning that could cause the level of subsidy to increase almost without limit. Once the new permanent way has been installed there is then an economic case for using it to full capacity. We understand that models show that the benefits of HS2 increase if fares are lowered, leading to higher levels of traffic and hence user benefits. But once the full capacity is in use there will be pressure for a further capacity addition. This in turn would require further state subsidy.
The option of premium pricing for the much faster HS2 services was partially analysed in Appendix 2.4 of the February 2010 report by HS2 Ltd. It concludes (HS2 Ltd, 2010b) that premium pricing for high-speed services would lead to some reduction in levels of travel and some diversion of traffic to classic rail, with more impact on leisure traffic than on business traffic. The impact on overall revenue was uncertain. The analysis concludes that there is some scope for premium pricing and for using pricing as a management tool for crowding. However, the analysis of premium pricing was not carried forward into the appraisal options as a potential means of reducing the level of subsidy required for HS2. We understand that the lack of attention to pricing issues was because there was ministerial guidance under the last government that prevented further work on the issue. That guidance appears to have been retained by the present Government. However, it is a major shortcoming in the analysis and is inconsistent with the Green Book.
Without proper justification it has been assumed that a very large capital subsidy should be provided to build HS2. We understand that HS2 is expected to operate without subsidy at the operating level. However, this may depend

18Review of the Economic Case for HS2
on how competition operates with services on the existing network. The Government may be forced to require the regulator to restrict competition to avoid diversion of traffic back onto the existing line. Government policy in the past, prior to privatisation, has been to provide no subsidy for intercity rail services since this sector is competitive with road and other modes and can operate profitably using the normal classic services. Nowadays, there does not seem to be any policy on the rationale or direction of rail subsidy and subsidy levels are simply the outcome of the franchising process. The operator of the WCML receives a subsidy of 2.7p per passenger mile (DfT, 2011a). Therefore, there needs to be a clear justification as to why the Government should commit such a large subsidy in order to provide fast rail services to the small part of the transport market represented by city centre to city centre travel. Since the average income of intercity rail travellers is considerably higher than that of the average taxpayer and a high proportion are business travellers, this is an important policy questions that needs to be addressed.
The Green Book takes a firm view on pricing issues, stating: ‘Government policy is generally to set charges for goods and services sold commercially at market prices, and normally to recover full costs for monopoly services (including the cost of capital as defined in the Treasury Fees and Charges Guide).’ This is not the approach that has been taken to the HS2 review and any appraisal of HS2 should explain why the Green Book guidance has not been followed.
The appraisals by HS2 Ltd and by Atkins disregard the possibility of managing demand more effectively in a scenario without HS2, so that some traffic is moved from the peak to off-peak. This policy has been recommended to the DfT by the Public Accounts Committee (2010), which said:
‘The current round of planning relied heavily on buying extra carriages and on extending platforms to accommodate longer trains but this approach cannot go on indefinitely. Clearly, alternatives must be found to meet the capacity challenge in the future. The Department should vigorously pursue and promote smart ticketing and other demand management techniques to reduce the inefficiencies of overcrowding in peak hours and underused rolling stock at other times.’
The recently published McNulty (2011) review of value for money in the railways also placed great emphasis on the use of pricing and yield management to achieve better use of railway assets and to reduce costs. The imperative of reducing carbon emissions would also suggest that the DfT should focus on improving capacity utilisation on trains. However, no allowance has been made for policies of this sort in appraising HS2. Instead, the sole focus is on investment. An implicit assumption in the analysis is that HS2 would adopt the same level of yield management as is used in the base by the existing operators in the corridor. The increase in fares assumed throughout takes the existing structure and applies a constant increase to each fare.

19Review of the Economic Case for HS2
In its recent response to the Transport Select Committee on the issue of peak pricing the DfT (2011b) offers no justification for the disproportionately high level of implicit subsidy to the users of peak services on the WCML implied by a decision to commit to build HS2 without considering the application of peak demand management and expanding capacity incrementally at much lower cost. Against the experience in other transport industries, notably airline services, the DfT suggests that peak demand management will be relatively ineffective on the WCML. Evidence from markets in many spheres indicates that market response to price signals tend to be hard to predict. Transport markets are much less homogeneous than implied by the answers the DfT has offered on this topic. These answers rely largely on anecdotal assertions about inflexibility in work patterns. Peak pricing is aimed at influencing the marginal users to modify their travel patterns to reduce demand at peak times and this is normally highly effective. This policy should certainly be adopted before committing to spending many billions of pounds to cater for the relatively small proportion of demand for travel on the WCML that occurs at the most busy peak periods.
The Green Book stresses the importance of looking at a wide range of options when considering a project such as HS2. It states: ‘For a major programme, a wide range should be considered before shortlisting for detailed appraisal. Both new and current policies, programmes and projects should be included as options.’ By focusing only on investment options and giving much greater prominence to the HS2 option over the alternatives, the economic appraisal of HS2 has fallen short of the standards expected in the Green Book.

20Review of the Economic Case for HS2
4. Demand Forecasts for HS2, London–West Midlands
Experience of forecasting on rail projectsThe track record of traffic forecasting for major rail projects is poor, both in the UK and internationally. Bent Flyvbjerg and a group of colleagues at the University of Aalborg and elsewhere have carried out research over many years into major transport infrastructure projects (i.e. projects costing more than $100 million) (Flyvbjerg et al., 2007). They have
established a database of international projects and found evidence of systematic bias in the forecasting of costs, benefits and risks. Optimism bias tends to influence not just demand forecasts but also the entire project appraisal process. Among their key findings are:
• average cost overruns were 44.7% for 58 rail projects, 33.8% for 33 bridge and tunnel projects and 20.4% for 167 road projects, with more than 90% of projects experiencing an overrun;
• rail passenger traffic forecasts for 25 projects showed actual traffic was on average only 51.4% of the traffic forecasted;
• by contrast, in 183 road projects, traffic was underestimated by an average of 9.5%;
• the inaccuracy of demand forecasts is found across the five continents and 14 countries covered by the database, and forecasting accuracy has not improved over the thirty-year period which the study covers; and
• the errors in road traffic forecasts may be due to technical failings but other errors are best explained by psychological and political-economic factors, which may be influenced by public sentiment in favour of rail investment.
Two major rail projects in Britain are included in the Flyvbjerg database (ibid.): the Channel Tunnel and the subsequent associated rail link from London to the tunnel. They both illustrate the way these biases develop in the process of decision-making.
The Channel Tunnel traffic forecasts were prepared on behalf of a large international consortium of lending banks which provided finance for the

21Review of the Economic Case for HS2
project. They appointed traffic and revenue consultants (TRC) and also an independent reviewer of the demand forecasts. The TRC produced annual updates of their forecasts over the more than ten-year project preparation and construction period and these were independently reviewed. The annual independent review never deviated by more than 5% from the TRC’s forecasts in its assessment of their validity. The main focus of the review tended to be on macroeconomic factors rather than the factors related to competition that proved to be the most decisive.
The TRC used well-established transport planning techniques and models for forecasting demand and revenue, although arguably these were poorly suited for preparing reliable forecasts for a commercial rail shuttle link in the competitive cross-Channel market. The Channel Tunnel forecasts failed to anticipate the competitive response of the ferries to the opening of the Channel Tunnel and Eurotunnel quickly fell into financial difficulties because its revenue was only half the expected level.
The need for a rail link to strengthen the Channel Tunnel was debated for many years during the planning stage, but was delayed by uncertainty over its funding and viability. It eventually went through a competitive bidding process as a privately funded project using the revenue stream from the Eurostar trains that had already been purchased by British Railways and SNCF (France’s national state-owned railway company). The bid was won by the London and Continental Railway (LCR) consortium. It relied on demand forecasts produced using transport planning methodologies that were very similar to those that have been used for HS2. These are dependent on estimates of consumer responses to new service levels on the railway and to future changes in income and price that are expressed as elasticity of demand assumptions. Such forecasts anticipated that demand would now have reached about 25 million passengers, whereas actual traffic has grown only slowly and has now reached around 9 million, nearly fifteen years after the original forecasts.
When the LCR failed, the government appointed advisers to review the forecasts in 2001. By then there was a political predilection to provide a government-funded rescue of the LCR, rather than to leave the risks with the private sector, as had been done with Eurotunnel. The forecasts underpinning the financial rescue agreement with the Government proved no more reliable than the original forecasts. HS1 was eventually sold for £2.1 billion, well below its construction costs of £5 billion. Despite reassurances from the Government at the time when the financial rescue was mounted that there was a very low risk of it happening, this loss has been borne by the taxpayer, largely on the basis of unrealistic demand forecasts.
The shortcomings in the estimation of project costs have been recognised by the DfT for many years. A report prepared by Flyvbjerg in association with COWI (an engineering, environment science and economics consultancy) was published by the DfT in June 2004 and sets out guidance on how to make
22Review of the Economic Case for HS2
allowance for optimism bias in project costs by building in a contingency margin to cost estimates (Flyvbjerg et al., 2004). These procedures have been adopted by the DfT, and an allowance for optimism bias is incorporated in the cost estimates for HS2. However, no provision has been adopted for optimism bias in the preparation of rail traffic forecasts.
Demand forecasts for HS2
The main source of assumptions for the baseline forecasts for HS2 is the PDFH, which is produced by the organisations in the rail industry, managed by the Association of Train Operating Companies and contains the industry’s standard approach to demand forecasting. The PDFH is not publicly available, and this review has therefore relied on the information on the forecasting methodology which is available on WebTAG, in the reports on the HS2 project and in the background documents to the November 2007 rail White Paper (Steer Davies Gleave and DeltaRail, 2007).
The PDFH is not sufficient to provide full forecast data on its own as the project appraisal has to analyse the effects on demand and costs across transport networks to examine route and modal choice decisions, as well as aggregate traffic levels. The PDFH is therefore combined with four other models in order to establish detailed forecasts by route and mode. These are:
• a long-distance model which covers trips by road and air as well as rail and identifies potential diversion of trips between the three modes;
• two shorter-distance models which examine in particular rail travel in the South and the Midlands regions. The models assess the impact on passengers on the classic network if HS2 is built and the potential for using released capacity for regional and local services;
• a model that looks at the Heathrow market for passengers wishing to access international flights; and
• a station-choice model which identifies how passengers in London and Birmingham would choose to access both HS2 and classic rail services.
These models require substantial data input from a range of sources in addition to the data used by the PDFH. In particular, they take account of expected changes in land-use patterns and population. With new planning policies being put in place by the Coalition Government, the various planning assumptions are likely to have changed significantly since the forecasts for HS2 were prepared. Housing growth in the Milton Keynes area, for example, may now be at a lower level than previously expected. We consider that these components of the forecasts should be revisited.
The forecasts that these models produced are summarised in Table 3. This shows that base underlying growth in all long-distance rail travel in Britain is forecast to increase by 96% between 2008 and 2043, a rate of 1.9% per year. On the WCML section north of Milton Keynes, for which HS2 Ltd provided
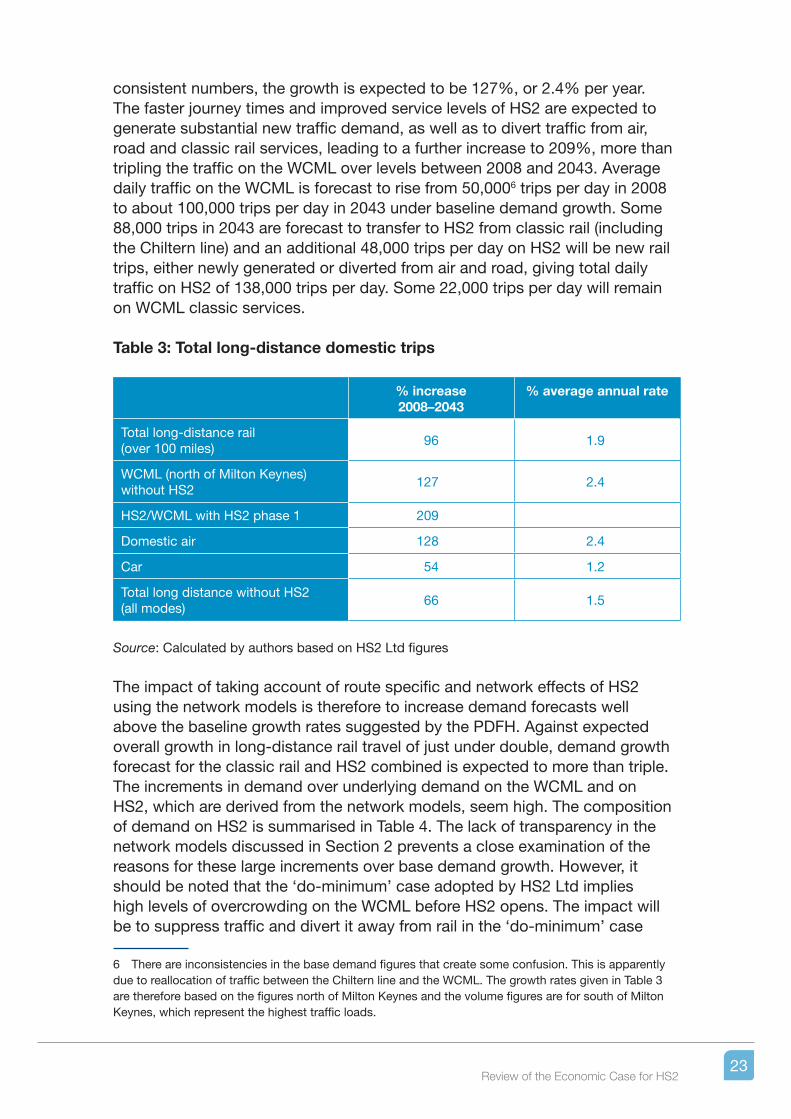
23Review of the Economic Case for HS2
consistent numbers, the growth is expected to be 127%, or 2.4% per year. The faster journey times and improved service levels of HS2 are expected to generate substantial new traffic demand, as well as to divert traffic from air, road and classic rail services, leading to a further increase to 209%, more than tripling the traffic on the WCML over levels between 2008 and 2043. Average daily traffic on the WCML is forecast to rise from 50,0006 trips per day in 2008 to about 100,000 trips per day in 2043 under baseline demand growth. Some 88,000 trips in 2043 are forecast to transfer to HS2 from classic rail (including the Chiltern line) and an additional 48,000 trips per day on HS2 will be new rail trips, either newly generated or diverted from air and road, giving total daily traffic on HS2 of 138,000 trips per day. Some 22,000 trips per day will remain on WCML classic services.
Table 3: Total long-distance domestic trips
% increase2008–2043
% average annual rate
Total long-distance rail (over 100 miles)
96 1.9
WCML (north of Milton Keynes) without HS2
127 2.4
HS2/WCML with HS2 phase 1 209
Domestic air 128 2.4
Car 54 1.2
Total long distance without HS2 (all modes)
66 1.5
Source: Calculated by authors based on HS2 Ltd figures
The impact of taking account of route specific and network effects of HS2 using the network models is therefore to increase demand forecasts well above the baseline growth rates suggested by the PDFH. Against expected overall growth in long-distance rail travel of just under double, demand growth forecast for the classic rail and HS2 combined is expected to more than triple. The increments in demand over underlying demand on the WCML and on HS2, which are derived from the network models, seem high. The composition of demand on HS2 is summarised in Table 4. The lack of transparency in the network models discussed in Section 2 prevents a close examination of the reasons for these large increments over base demand growth. However, it should be noted that the ‘do-minimum’ case adopted by HS2 Ltd implies high levels of overcrowding on the WCML before HS2 opens. The impact will be to suppress traffic and divert it away from rail in the ‘do-minimum’ case
6 There are inconsistencies in the base demand figures that create some confusion. This is apparently due to reallocation of traffic between the Chiltern line and the WCML. The growth rates given in Table 3 are therefore based on the figures north of Milton Keynes and the volume figures are for south of Milton Keynes, which represent the highest traffic loads.
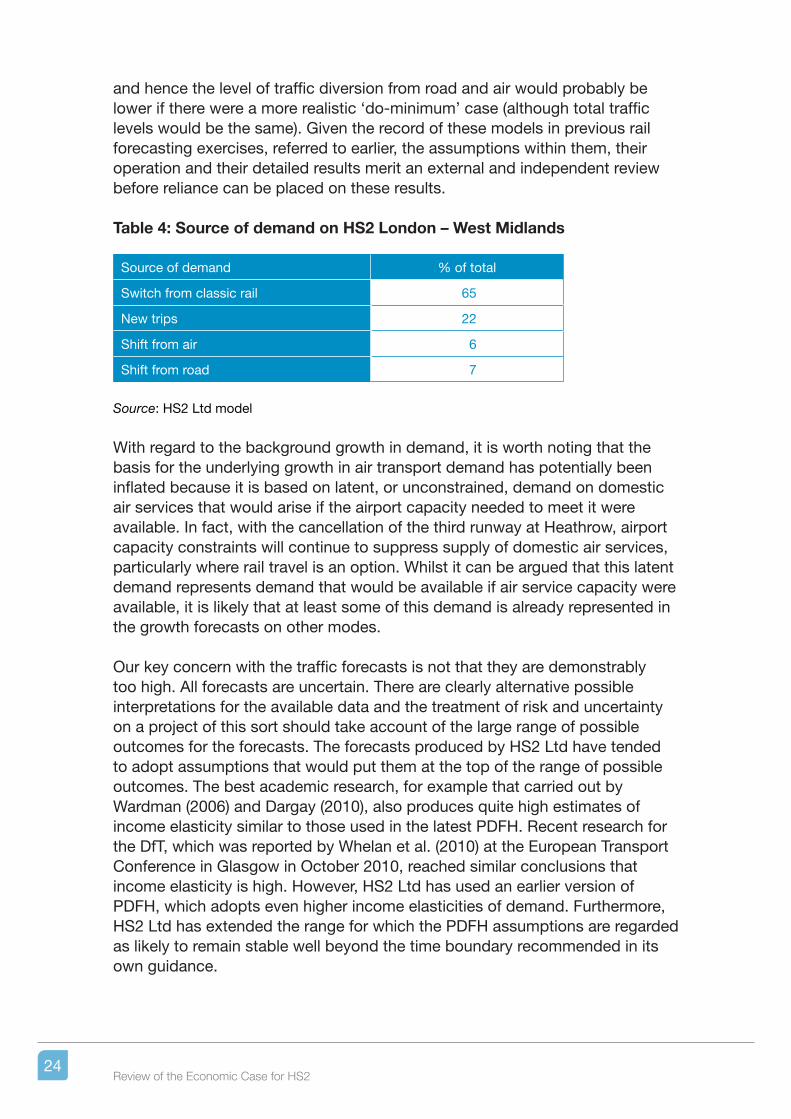
24Review of the Economic Case for HS2
and hence the level of traffic diversion from road and air would probably be lower if there were a more realistic ‘do-minimum’ case (although total traffic levels would be the same). Given the record of these models in previous rail forecasting exercises, referred to earlier, the assumptions within them, their operation and their detailed results merit an external and independent review before reliance can be placed on these results.
Table 4: Source of demand on HS2 London – West Midlands
Source of demand % of total
Switch from classic rail 65
New trips 22
Shift from air 6
Shift from road 7
Source: HS2 Ltd model
With regard to the background growth in demand, it is worth noting that the basis for the underlying growth in air transport demand has potentially been inflated because it is based on latent, or unconstrained, demand on domestic air services that would arise if the airport capacity needed to meet it were available. In fact, with the cancellation of the third runway at Heathrow, airport capacity constraints will continue to suppress supply of domestic air services, particularly where rail travel is an option. Whilst it can be argued that this latent demand represents demand that would be available if air service capacity were available, it is likely that at least some of this demand is already represented in the growth forecasts on other modes.
Our key concern with the traffic forecasts is not that they are demonstrably too high. All forecasts are uncertain. There are clearly alternative possible interpretations for the available data and the treatment of risk and uncertainty on a project of this sort should take account of the large range of possible outcomes for the forecasts. The forecasts produced by HS2 Ltd have tended to adopt assumptions that would put them at the top of the range of possible outcomes. The best academic research, for example that carried out by Wardman (2006) and Dargay (2010), also produces quite high estimates of income elasticity similar to those used in the latest PDFH. Recent research for the DfT, which was reported by Whelan et al. (2010) at the European Transport Conference in Glasgow in October 2010, reached similar conclusions that income elasticity is high. However, HS2 Ltd has used an earlier version of PDFH, which adopts even higher income elasticities of demand. Furthermore, HS2 Ltd has extended the range for which the PDFH assumptions are regarded as likely to remain stable well beyond the time boundary recommended in its own guidance.

25Review of the Economic Case for HS2
Application of PDFH income elasticities of demand
The baseline forecasts used by HS2 Ltd are produced using the PDFH version 4.1, modified to reduce the rate of growth of long-distance trips. However, there is a more recent version, PDFH 5.1, based on more recent research which recommends lower income elasticities of demand, particularly for long-distance journeys. The academic research referred to earlier uses income elasticities more closely aligned to the new version PDFH 5.1. A recent article in Local Transport Today (Forster, 2011) also argues that the income elasticities used are too high. According to WebTAG, the model for forecasting underlying rail demand takes account of a range of exogenous variables to produce its forecasts, in addition to income. These include GDP, employment, population, car ownership, and costs and journey times by car, bus and air. It also takes account of a range of endogenous variables which include fares, journey time by rail, performance and non-timetable-related service quality. The forecasts are sensitive to all these variables, but they are particularly sensitive to the income variable.
HS2 Ltd has continued to base its forecasts on the out-of-date assumptions in PDFH 4.1, which presumes that rail demand is sensitive to both income and journey length rather than the more recent research reflected in PDFH 5.1. A comparison of the figures is shown in Table 5:
Table 5: Income Elasticities from Various Sources
PDFH 4.1 HS2 PDFH 5.1
To London 2.00 + 0.0032 per mile as for PDFH 4.1, but capped at 2.8
1.9
From London 0.84 + 0.0032 per mile as for PDFH 4.1, but capped at 2.8
0.9
Source: DfT and HS2 Ltd figures tabulated by the authors
The elasticity of demand over a 100-mile journey to London according to PDFH 4.1 is 2.32 compared to 1.90 using PDFH 5.1. Over a 400-mile journey from Scotland to London, the elasticity has been capped for the HS2 forecasts at 2.8 compared with 1.9 using PDFH 5.1. Thus, the elasticities in PDFH 4.1 become implausibly high for longer journeys because of the distance term despite the reduction through capping of the longer-distance values. Using PDFH 5.1 elasticities, rather than the out-of-date figures in PDFH 4.1, is estimated to reduce the demand forecasts for HS2 by about 29%. Making the simplistic assumption that user benefits would fall pro rata to traffic levels7 the impact would be to reduce the user BCR from 1.6 to 1.1, or below.
7 In practice, the relationship between user benefits and traffic levels is likely to be non-linear, and lower traffic is likely to result in a more than proportional fall in benefits. This appears to be borne out by the sensitivity tests carried out by HS2 Ltd (see Section 7).
26Review of the Economic Case for HS2
‘Capping’ the demand forecasts
The DfT’s rail appraisal guidance, set out in NATA, for carrying out a scheme appraisal is to cap demand forecasts in 2026. The reason is that there is considerable uncertainty as to whether the relationships between the variables used for forecasting rail demand will remain stable in the long term. For projects such as the acquisition of rolling stock, demand forecasts up to 2026 are all that is usually required, from which date demand is assumed to remain unchanged at the 2026 levels. However, for a very long-term project such as HS2, which will not even open until 2026, the DfT decided that it was appropriate to extend the forecasting period by extrapolating the same relationships between rail demand, income and other variables. During the first appraisal of HS2, carried out in 2010, the forecasting period was therefore extended to 2033. Demand was expected to double by this date. This increased the level of risk in the forecasts given the uncertainty over the stability of the relationships particularly between demand and income which have changed considerably over the past thirty years or more, and may well change again in the future.
Now, with the revised forecasts in the latest evaluation, the forecasts of base rail demand fell substantially. These forecasts used lower GDP growth assumptions and recognised the Government’s policy to increase rail prices by RPI +3% for the next three years and by RPI +1% thereafter. If the DfT had used these new forecasts capped at 2033, as before, the economic case for HS2 would have disappeared. Instead, the DfT decided to extend the forecast period out a further ten years to 2043, by which time the base demand was again forecast to double. The appraisal of HS2 has therefore been based on an arbitrary assumed target for a doubling of underlying rail demand on WCML on the section south of Milton Keynes and the task of the forecasting process has been to determine when that doubling of traffic might occur. To make that estimate the DfT has had to assume that the relationship between rail demand and income growth will remain unchanged for the next thirty years.
We appreciate that a project such as HS2 should be appraised over a long period and this is consistent with the recommendations in WebTAG. WebTAG states in section 3.5.4, paragraph 5.4.2 that:
‘For most projects, formal modelling will not be practical for forecast years more than fifteen to twenty years after project opening. This is because the local data needed to ensure that results are credible is not available that far into the future. Analysts are encouraged to choose a last forecast year as far into the future as is practical.’
This guidance has encouraged HS2 Ltd to look longer term in its appraisal of HS2. But this does not justify assuming an unchanged relationship between income and rail demand over a longer period.

27Review of the Economic Case for HS2
In our opinion there is a strong case for using the elasticities from PDFH 5.1 in place of those from PDFH 4.1, and for capping the overall growth in demand at an earlier date than 2043, perhaps by retaining the previous cap at 2033. While the forecasts would then be more realistic, we consider that there would still be a strong risk of overestimation in the forecasts for two main reasons.
First, there is evidence of saturation in the demand for long-distance travel overall. Total long-distance journeys by all modes have stayed at a broadly constant level since 2003, while long-distance car journeys have fallen over that period. If the market overall is saturated, it is unsafe to assume that the railway can attract an increasing proportion of journeys over the next thirty years in the narrow segment of the market represented by city centre to city centre to city centre travel, particularly because rail already has a large share in this market.
Second, the forecasts make no assessment or allowance for changes in habits and tastes and of the potential of disruptive technologies which may reduce the necessity for some travel, and in particular business travel. We believe video technology could disrupt the travel market significantly over the next twenty years and there will be a rapid growth in technological alternatives to travel. In Appendix 2 we discuss the potential for video conferencing to illustrate one significant risk to the ‘business as usual’ assumption underlying the forecasts for HS2. The effects of technological changes of this sort may work either way in terms of their impact on travel demand. For example, technology has reduced the extent to which time on trains is wasted and hence may increase rail travel demand. But video conferencing technology is unique in its focus as an alternative to travel and we consider that there is a growing case for treating it as a travel mode in the same way as rail, road and air.
Over the past fifteen years the number of long-distance (more than 50 miles) trips taken in the UK has reached a plateau. This matches common-sense expectations, since everyone has a limit on the amount of time they can spend travelling. However, within this total there has been a shift away from road and air travel and towards rail. There are several possible explanations

28Review of the Economic Case for HS2
for the growth in rail travel compared to other modes. One is the changes in the rail industry that have accompanied privatisation, with franchisees making far greater efforts to attract passengers through incentive fares and other initiatives. A second possible explanation is the development of wireless technology, which means that time spent on trains can now be used productively. A third is the surge in investment which followed privatisation and led to improved service levels. A fourth is the growing congestion on the road network and in airports which has diverted some travellers to rail. A fifth is the growth in incomes over this period, which has attracted more passengers to the trains. The relative importance of these factors is crucial to the traffic forecasts used for HS2 and the estimation of a likely saturation level. If the main explanation for growth in rail traffic is changes in the attractiveness of rail relative to other modes in a saturated travel market then the level of demand for rail travel is likely to plateau shortly. However, if rising incomes is the key determinant of demand growth then rail traffic levels may continue to grow.
The situation over the past fifteen years is in sharp contrast to the period before rail privatisation. At that time, rail travel was broadly static while demand grew rapidly on other modes and in particular car. Income was also rising over this period. This strongly suggests that factors other than income are playing a significant role.
The Government is also alert to the possibilities. The recent White Paper on local transport stated (DfT, 2011d):
‘As well as considering packages of sustainable transport measures, consideration should be given to not travelling at all. Information and communications technology now provides the means to reduce or remove the need to travel in a number of situations, and can have a number of benefits, to the economy and to the environment.’
Some 22% of trips on HS2 are expected to come from newly generated trips that would not have otherwise taken place and these are clearly the sort of marginal trip that might be avoided.
Subsequently, the DfT has begun a consultation exercise on alternatives to travel, stating: ‘For the first time… not travelling is an element within the Ministerial portfolio.’ The consultation references options ‘ranging from teleconferencing, videoconferencing and web-conferencing, to working flexible hours, and working remotely.’ This consultation shows that the Government recognises the possibilities of substitutes for long-distance travel, but it has taken no account of them in making its forecasts of demand for HS2.
Conclusions
The Transport Select Committee investigated the failure of the Channel Tunnel Rail Link in 2006. The reasons for the massive overestimation of the demand

29Review of the Economic Case for HS2
forecasts were said to be primarily the failure to assess the impact of low-cost air carriers and the unrealistic elasticities of demand used to forecast passenger responses to Eurostar’s services. The Committee reported: ‘The Department told us that it has now learned from all this experience, and that the next time it considered undertaking a major transport project it would factor more severe downside assumptions into its business case analysis.’ It is difficult to reconcile this statement with the work that has been presented by the Government to justify HS2.
The White Paper Delivering a sustainable railway (DfT, 2007: 9) concludes: ‘Forecasts have been wrong before, and any strategy that tried to build a rigid investment programme based on fixed long-term forecasts would inevitably be wrong again.’ This is precisely what HS2 has done. There is therefore a strong likelihood that the traffic forecasts for HS2 are too high, and at the very least it should be admitted that the forecasts are highly uncertain and subject to a high margin of error. The most appropriate strategy for providing capacity in such an uncertain forecasting environment is an incremental one which builds up capacity slowly as needs develop. Instead, the HS2 project has followed the familiar path of an ambitious, attractive and visionary project that has been enthusiastically promoted as the desired solution, rather than being objectively appraised against alternative policies and strategies.
It appears that the Government has been slower than the private sector to learn the lessons implicit in the inherent unreliability of the forecasting techniques applied for railway projects. The DfT has not followed its own advice in the planning of HS2. It has relied on the same forecasting methods and assumptions and has not taken account of the risk in these forecasts in evaluating a full range of options for providing the capacity needed on the WCML. Instead, it has focused on one solution – high-speed rail – and has then adopted an approach to the evaluation which discouraged an integrated and balanced examination of all the options.
We consider that the forecasts produced to justify the HS2 project do not have a high probability of being achieved. At a minimum we suggest that the forecasts should be modified to alter the income elasticities from the PDFH 4.1 figures to the PDFH 5.1 figures, which are now recommended; this will reduce demand by about 29% and the user BCR to 1.1 or less. We also consider that the saturation level of demand is likely to be reached well before 2043. The DfT’s advice in NATA is to cap demand after fifteen years. We consider that there are sound reasons for this. These apply to HS2 as much as to other projects. There is already evidence of saturation and it is unrealistic to project continuously rising demand at the same rate beyond fifteen years. If the cap on the forecast demand were applied earlier – in 2033, as in the previous evaluation – the BCR would fall well below 1.

30Review of the Economic Case for HS2
5. Benefits to Transport Users from HS2
Summary of user benefitsThe central part of an economic evaluation is to identify and quantify the benefits of the scheme. Table 6 summarises the results of the HS2 evaluation for the individual categories of user benefit, expressed in total present-value terms over the project life. Total user benefits have been estimated at £17.9 billion, before adjustments for the effect of indirect taxes. The figures show that:
• rail journey time savings make up 41% of the benefits. These are the result of the higher speeds and shorter journey times offered by HS2;
• improved reliability of services is expected with the dedicated track for the new HS2 services, providing 13% of the benefits;
• a further 15% of the benefits will come from reduced crowding on journeys formerly taken on classic rail services;
• other rail user impacts include increased service frequency, reduced time spent at interchanges and improved station access time. They make up 20% of benefits; and
• decongestion due to diversion of traffic from the roads and other impacts, such as reduced road accidents and road noise, make up the remaining 12%.

31Review of the Economic Case for HS2
Table 6: Benefits of HS2 (London–West Midlands) to transport users (£ million, 2009 present values rounded to the nearest £100 million)
Benefit category Business Other users Total
Rail journey time savings 5,700 1,700 7,300
Improved rail reliability 1,800 500 2,300
Reduced rail crowding 700 1,900 2,600
Other rail user impacts 1,700 1,800 3,500
Road decongestion 1,200 600 1,800
Other impacts (road accidents, air quality, road noise and HSI link)
– – 400
Total benefits 11,100 6,500 17,900
Source: HS2 Ltd model analysis
The user benefits are calculated using the network models developed for the demand forecasts. Interpretation and scrutiny of the results are limited by the same constraints of lack of transparency within these complex models that were noted earlier. It is therefore not possible to question the magnitudes of the individual category of benefits without being able to examine the disaggregated results. For example, the level of road decongestion benefits appears high in comparison with the amount of traffic diverted from road to HS2. Only 7% of HS2 traffic is from road leading to just a 1% fall in motorway traffic on routes in the London to Birmingham corridor. Yet road decongestion generates 10% of the benefits. But the reason for this cannot be investigated without access to much more detailed information. We can however review the key assumptions driving the analysis and the most important assumption is the value of time of transport users.
Benefits from relief of crowding
The scale of the benefits from relief of crowding must be interpreted in the context of the artificially constrained ‘do-minimum’ case used to derive them. Had a realistic ‘do-minimum’ been used, the crowding benefits of HS2 would have been all but eliminated. As discussed in Section 6, additional capacity can be provided on the existing network, at low cost, to meet all the forecast demand without the need for crowding. Eliminating crowding benefits would reduce total benefits to £15.3 billion.
Indeed, a realistic ‘do-minimum’ case would provide additional capacity before the earliest date at which HS2 could come into operation. However, in the HS2 case the Government will be reluctant to spend money to relieve congestion in the period before 2025 in anticipation that HS2 will eventually solve the problem and because any investment in additional capacity on the existing line will be made redundant. Under this scenario there would therefore

32Review of the Economic Case for HS2
be additional congestion in the period to 2025 in the case where HS2 is built compared to the ‘do-minimum’ case. This in turn would lead to additional disbenefits of train crowding prior to opening HS2, which would occur at the beginning of the appraisal period when the effect of time discounting is low.
If it were assumed that the effect of additional crowding prior to the opening of HS2 in 2025 would generate, say, £1 billion of disbenefits and if the unnecessary crowding created by the artificial ‘do-minimum’ is eliminated, the effect would be to reduce the user benefit BCR from 1.6 to about 1.3.
Reliability improvement benefits
There are severe doubts over the scale of the reliability benefits claimed for HS2, particularly in the longer term with the extensions to create the ‘Y’ network. Improved reliability of high-speed rail services has been demonstrated where there is a completely self-contained system that does not import delay from the rest of the network. The Tokyo–Osaka Shinkansen is famed for its reliability while operating high capacity services of up to 14 trains per hour at the peak. This is achieved on a dedicated, self-contained, linear system operated under the disciplined management and organisational culture of Japan. The maximum capacity of the French system is 12 trains per hour.
HS2 will not be a self-contained system and imported delays from the classic network are inevitable. These will increase as capacity utilisation on the system is increased. The capacity required to carry the forecast demand for the ‘Y’ network requires operation at the full claimed capacity of 18 trains per hour during peak periods. However, the feasibility of reaching this is unproven and highly doubtful. No high-speed rail system has operated at this level of utilisation and HS2 Ltd has not explained how it can be achieved. In addition, the ‘Y’ will be heavily exposed to imported delays from trains connecting through the classic network, since 6 of the planned 18 trains per hour will connect between the two networks.

33Review of the Economic Case for HS2
There are therefore strong doubts about the estimates of reliability benefits for HS2. The existing classic system can be operated well within its capacity limits even with the forecast increase in traffic using the initiatives described by Atkins in the RP2 scheme, or even more effectively by the optimised alternative developed by Chris Stokes (2011). Reliability on the existing network continues to improve and it is not clear whether the base case takes account of the high levels of reliability which Network Rail is committed to delivering. Where necessary, infrastructure improvements can be made at a more modest level of cost to relieve pinch-point constraints. While such improvements are often costly, they are far cheaper than HS2.
Faster journey time benefits – value of time
The key assumption underpinning the estimates of benefits from transport investment projects is the values of time savings for the various categories of journey purpose. These values have been used to estimate the economic benefits from journey time savings. They have also been adopted in the quantification of most of the other transport user benefits shown in Table 6. The benefits from improved reliability of train services, reductions in crowding on trains and changes to service frequencies are evaluated using parameters based on the value of time. Stated preference and other research techniques have been chosen to determine the value that passengers place on service reliability and the absence of crowding on trains in terms of passengers’ willingness to pay. These values are expressed in terms of value-of-time equivalents on the modelling of reliability improvement and relief from overcrowding. Only the small items of benefits, ‘other impacts’, are not derived from the values of time. The value-of-time assumptions are therefore the most critical element of the HS2 project appraisal.
The appraisal has used the standard values of time recommended by WebTAG, which have been supported by extensive research over the years. The recommended value of time for rail commuters is £6.52 per hour and for other non-working time travellers it is £5.77 per hour. For people travelling by rail in working times the recommended value of time is £48.64 per hour. Only two categories of journey purpose have been used for the analysis – leisure trips and business trips taken in working time.
However, the commuter value of crowding relief has been used to value the effects on business travellers of crowded trains in the central case. The reason is that discomfort created by crowding affects the welfare of the traveller as an individual but it does not affect his employer, whereas time spent travelling is assumed to be a cost to the employer. Thus, to avoid double counting productivity benefits from faster travel with comfort benefits from relief of crowding, the lower commuter value of time was used by HS2 Ltd.
The non-working values of time are standard average values used for transport economic appraisal. They are based on willingness-to-pay principles for the

34Review of the Economic Case for HS2
average transport user rather than on the specific characteristics of long-distance rail passengers, whose incomes, and hence willingness to pay for time savings, tend to be higher than that of the average transport user. The Government has chosen to use a common value of non-working time for economic appraisals to avoid transport investment decisions being biased towards higher income users.
The value of working time on trains
The value of time among rail business passengers travelling in working time is intended to measure the average costs to employers of their time, on the assumption that this represents the average of the marginal rates of productivity of those employees. The cost to employers is the average hourly rate of pay, plus a 24.1% markup for non-wage costs paid by the employers. Excluding the markup, this implies that business travellers are estimated to earn an average rate of £39.19 per hour.
This value is critical because the benefits calculated using this rate make up 51% of total user benefits, although business travellers are estimated to form only 30% of rail users of the HS2 services. Assuming a 40-hour week and 45 working weeks in the year, this implies an annual average pay rate of about £70,000 in 2009 values. We understand the estimate is derived from the National Travel Survey data and is a standard appraisal value. However, it does appear high, and it is unclear whether it is supported by research on the earnings of the average rail traveller in this specific market for intercity services.
If business travellers using intercity rail services are indeed drawn from the relatively small group of people who enjoy this level of average income, it is unlikely that this high average income will be sustained in real terms over time. If the market is to grow at the rate forecast, the composition of rail business travellers will be diluted by more people at the lower end of the income range and the average income of the group will gradually move towards mean income levels for business travellers by all modes. It is unlikely that the demand forecasts for business travel by rail will be met just by increased frequency of travel by the high income group currently represented.
The appraisal of HS2 assumes that time saved on business travel provides an economic benefit equivalent to the cost to the employers of the business travellers’ time, because the time saved can be used productively at work. The implication is that business travellers’ time is unproductive while sitting in trains. This is clearly not the case, since with modern technology there are ample opportunities to work on trains and the facilities are likely to improve further in future.
It has long been recognised in the literature that this assumption is likely to be false. As long ago as 1977, Hensher developed a formula to identify the factors that would influence the value of travel time savings. The formula acknowledges

35Review of the Economic Case for HS2
a range of factors that can influence the value of working time spent travelling, including the business traveller’s own preferences (Hensher, 1977). One of these factors recognises that people may work productively while travelling. An attempt was made by an academic group from the Institute of Transport Studies to apply the Hensher formula using data from the last large-scale national value of time study in the UK (Hague Consulting Group et al., 1999). The data was based on stated preference surveys for road users only. It was found that the Hensher (1977) formula was too data hungry to establish meaningful values. The authors were inclined to use hypothetical arguments to speculate that most of the variables would tend to zero for road users, leaving MP (the marginal product of labour) as reflected in employer’s costs, as the remaining variable.
Whilst that conclusion may be a fair approximation for road users, it is most unlikely to apply to intercity rail travellers in working time. It is evident that many business travellers do work on trains and thus their time is not wasted, as assumed in the evaluation. In the last HS2 appraisal published with the consultation, the DfT has now recognised this flaw in the reasoning that at least some of business travellers’ time on trains is used productively – reading, using computers and communicating. Indeed, this is one of the reasons business people use trains rather than cars and explains the high share of rail in the city centre to city centre travel market. If this is so, time saved on train journeys cannot be valued as though it were wasted. However, HS2 Ltd has not changed the values of time used in the appraisal despite recognising the weakness of the argument.
The consequence is that there is a major question mark over a substantial portion of the benefits of HS2. There is a lack of research or empirical evidence to determine a satisfactory estimate of the true economic value of working time spent on intercity trains. However, an a priori argument can be made that the value of time of business travellers should be reduced to the personal values of non-working time. Since virtually all business travellers have the opportunity to work on trains if they choose to, it is erroneous to value time savings on rail as though travelling by rail prevents them from working. Clearly, most could work if they wanted to and, if they choose not to, it is for a reason. Perhaps they are in fact using their own leisure time in ‘out of hours’ travelling or perhaps they are refreshing their thoughts for the tasks ahead. There are many reasons why people do not work 100% of the time, just as they do not do so in the office.
If it were assumed that business travellers’ time in trains should be valued at the same rate as commuters the total user benefits would fall to £13 billion and the user BCR would fall from 1.6 to 1.2. Combining this adjustment with the overstatement of crowding benefits reduces the BCR to 0.9.
Response of the DfT to the issue of the value of working time
The DfT has sought to address this dilemma by suggesting that if business people do work on trains then they could not work on crowded trains.

36Review of the Economic Case for HS2
Therefore, the disbenefits of business travellers being prevented from working on crowded trains in the ‘do-minimum’ case should be valued at the full working time value of time to allow for this loss of productive work. The DfT also points to evidence that some business travellers choose to travel by air to save time rather than use trains, which suggests that business travellers do in fact value savings in travel time. The DfT has amplified this response in Further written evidence in August 2011 (DfT, 2011b), which includes evidence that only a proportion of people spend time working on trains. We would challenge the DfT’s arguments on a number of grounds.
Business travellers tend to pay premium fares in order to ensure that they do get a seat. Any sensible yield management system will ensure that this continues to be the case in the future, even if average load factors increase. Business travellers will therefore continue to be able to work on crowded trains in the future. It is possible that conditions will become more uncomfortable over time, particularly with the artificially constrained ‘do-minimum’ base case that has been used in HS2 Ltd’s appraisal.
Furthermore, the crowding benefits arise only because the appraisal has used an unrealistic ‘do-minimum’ comparator with the HS2 case. If a realistic alternative were used there would be far fewer crowding benefits since the alternative scheme on the classic network would have sufficient capacity to avoid crowding. A sensible policy of demand management would eliminate crowding for high income business travellers. It is therefore only the unrealistic base-case assumptions used by HS2 Ltd in its appraisal that would lead to this result.
With regard to the argument that some business travellers do value time savings as indicated by their choice of air transport, these are a self-selecting group who happen to have a high value of time. Other business travellers choose rail because of the benefits of comfort and convenience it offers and the opportunities to do productive work.

37Review of the Economic Case for HS2
Finally, whilst it is no doubt true that a substantial proportion of business travellers on trains may not be carrying out observable work tasks, the same applies in most offices. It would be interesting to carry out similar research in an office environment to determine how much time is spent on observable work. Most high-income jobs involve a considerable amount of time thinking and communicating rather than carrying out visible tasks. The relevant point is that rail travel does not create a significant barrier to carrying out work tasks for business travellers. People can work if they want to on trains.
Hence it is a folly to invest billions of pounds in order to allow faster rail travel which will save only a relatively small proportion of journey time on the flawed hypothesis that this will increase the productivity of business travellers. It is therefore surprising that the DfT (2011b) should state in its evidence to the Transport Select Committee: ‘Only once a credible alternative approach to measuring the value of time savings for business travellers across all modes has gained sufficient support would we be in a position to substitute the current values.’
This statement could be read as suggesting that the evidence that has been acknowledged – that the value working time savings on trains have been greatly overestimated – will be ignored simply because no alternative figures have been agreed. Hence, the Government will be advised to proceed with this massive investment based on a fundamentally flawed hypothesis.
If the logic of treating business time on trains as wasted is now recognised as invalid, then the basis for the appraisal that has been carried out is flawed and must be rethought, researched and reanalysed. Furthermore, the logic of the traffic forecasts also needs to be revisited now that the DfT has realised this flaw in the rationale for its methodology. The fact that many business people do use their time productively on trains will be reflected in their current choice of rail over road or air. To an extent this preference will be calibrated into the logic of the transport model’s mode choice functions and the estimates of generalised costs. But these may need to be revisited with different behavioural values of time.
HS2 Ltd recognises there is a lack of evidence for the values of time used in its evaluation and states: ‘There is not currently any robust or agreed basis for adjusting values.’ If this is the case then no robust case for building HS2 has been developed.

38Review of the Economic Case for HS2
6. Options for Meeting Capacity Requirements
Economic evaluation of alternatives to HS2In the original Atkins study in 2003 the main justification for building HS2 was that capacity on the existing line could not be increased cost-effectively to meet the growth in demand expected at the time. However, the Government appears to have given relatively little attention or resources to investigating this claim by examining options for increasing
capacity to meet demand using the existing rail network. In 2010, the Government commissioned Atkins to carry out a study of alternatives to HS2, which examined a number of options. This study was updated in February 2011 using revised forecasts of demand. Atkins (2011) considers a number of options, or ‘packages’, of investment initiatives including:
• additional train frequencies with some supporting infrastructure enhancements (RP2);
• building on RP2 by providing additional capacity on the Chiltern line to enable some fast London to Birmingham trains to be diverted from WCML, thus releasing capacity for other services (RP3);
• building on RP3 with further upgrades on the Chiltern line to reduce London–Birmingham journey times (RP4); and
• again, building on RP4 by providing additional capacity between Birmingham and Stafford to enable the diversion of some services from the North West to be diverted onto the Chiltern line (RP5).

39Review of the Economic Case for HS2
Table 7: Costs of the rail package alternatives considered (present values, £ million)
Rail package Capital cost Initial rolling
stock purchase Total
RP2 3,619 1,142 4,761
RP3 12,272 1,477 13,749
RP4 14,892 1,559 16,451
RP5 19,466 1,955 21,421
Source: Atkins Report
All of the options were designed to provide additional capacity to meet the forecast traffic, although none of the options provides as much capacity as HS2. However, the costs of the different packages vary widely. RP2 is very much cheaper than all the other options. The difference in costs with the other packages varies between a factor of 2.9 and 4.5. Yet the difference in the improvement in London to Birmingham journey times between each of the options is relatively small. RP2 gives an improvement of 12 minutes on an 85-minute journey time. RP3 improves this by only 2 minutes and RP4 and RP5 improves on RP3 by another 6/7 minutes. With these modest improvements, it is not surprising that RP2 gave a much better BCR than any of the other packages. The BCR for RP2 was 1.9 (on comparable assumptions with HS2 about the treatment of rolling stock costs), while the BCRs for the other packages were all less than 1.0 and hence they were found to be not economically viable. The fact that the BCR of RP2 is superior to the 1.6 found for HS2 has not featured in the arguments on the merits of HS2 presented by the Government. We believe that a more balanced approach to evaluating options for expanding rail capacity on the route is required.
It is questionable why so much work was devoted to costing infrastructure enhancements that achieved few additional benefits, rather than investigating a more optimised alternative strategy based on increasing train size and capacity. This strategy would increase capacity flexibly and in line with demand growth as it materialised. That would seem always to have provided a more attractive option. However, in the context of examining alternatives to the expenditure of £18 billion on HS2 to accommodate the same level of underlying demand, it is perhaps not surprising that the consultants considered significant infrastructure investment might have been needed.
In Section 3 we described how the appraisal of the alternatives carried out by Atkins used a different ‘do-minimum’ comparator case from that adopted for the appraisal of HS2. The ‘do-minimum’ case used for the appraisal of these alternatives to HS2 assumed that the whole existing fleet of 52 Pendolino trains would be lengthened from 9 to 11 cars, whereas the evaluation of HS2 presumed that only the committed project to lengthen 31 trains would be

40Review of the Economic Case for HS2
carried out in the absence of the HS2. This inconsistency invalidates the comparison of the BCR of the HS2 with those found for the alternatives. The fact that the BCR for RP2 is better than for HS2, despite this inconsistency in the base case, only emphasises even more that the alternative schemes to HS2 require proper investigation.
The effect of this inconsistency in the base case was to improve the capacity of the enhanced ‘do-minimum’ case used for the evaluation of the alternatives when compared to the different ‘do-minimum’ used to evaluate HS2. Clearly, the incremental benefits of the alternatives would be lowered by this enhanced base case compared to the result if a consistent approach had been adopted. We were told by the DfT that the reason this inconsistency arose was that there were difficulties in modelling the ‘do-minimum’ case in the way it had been done for the HS2 evaluation. The nature of the difficulties was not explained and we can only speculate as to the cause. It may have been that the crowding function in the model became unstable at high load factors with the original, unrealistically constrained ‘do-minimum’. However, that would not explain why similar difficulties were not found when the separate modelling for the ‘do-minimum’ case for the evaluation of HS2 was carried out.
The second way the analysis has been distorted was that no attempt appears to have been made to optimise the timing of the provision of the capacity in line with the growth in demand. All the new capacity is assumed to be provided in 2025, for consistency with the expected opening of the HS2 with which the alternative is being indirectly compared. However, this is not a valid way of evaluating the alternatives because it fails to reflect one of the main comparative benefits of a strategy of using the existing network, that is, that capacity can be expanded more closely in line with demand and so avoid over- or undercapacity. Nevertheless, despite these potential biases against the alternatives in the evaluation, RP2 still achieved a substantially better user BCR than HS2 – 1.9 versus 1.6. This indicates that HS2 would achieve a significantly lower BCR if it were compared with RP2 directly by using this scheme as the base case for comparison since the crowding benefits attributed to HS2 would now be met in the base case.
The HS2 strategy, by contrast, will result in growing congestion on the railway for the next fifteen years before HS2 is opened. Then there will be massive overprovision of infrastructure capacity resulting in very high unit costs of providing rail capacity. This is against the whole thrust of the proposals of the McNulty (2011) review which argues for improving asset utilisation as a key driver of cost reductions. Consequently, the level of rail subsidy will be increased beyond the already high levels that are caused by the excessively high cost base of Britain’s rail industry. An optimised alternative strategy would, by contrast, be wholly consistent with McNulty, and will help drive down costs on the railways.
There also appears to be other inconsistencies in the evaluation of HS2 and RP2. Some infrastructure expenditure in the Manchester and Stafford areas

41Review of the Economic Case for HS2
appears to have been assumed to have been carried out for other reasons in the evaluation of HS2, although it is included in the costs of RP2. This will have caused additional bias against the alternative options. In addition, according to other analysis by Chris Stokes (2011), about a third (£1.36 billion) of the infrastructure expenditure included in RP2 is not necessary to achieve the relevant objectives of the scheme.
All these factors will have depressed the estimated BCR of the evaluation of RP2. In our view there needs to be a more thorough and consistent evaluation of alternatives for providing capacity on the WCML than has been carried out by the Government so far.
Network Rail spent about £9 billion on the recently completed upgrade of the WCML and it is essential that this investment is fully utilised before considering the next huge investment in the line. The McNulty (2011) review concludes that the costs of providing railway services in the UK are about 40% higher than comparable railways and that there is scope to reduce costs by 30%. High infrastructure costs and low train utilisation are major factors in these high costs. Only by making much more effective use of existing assets can the targets for reducing rail costs set out by McNulty be achieved. The evaluation of alternatives to HS2 needs to focus on options that are based on lengthening of the trains in the first instance, to make the best use of the capacity that is available. This is the most cost-effective means of expanding capacity and this approach gives the best way to match capacity with increasing demand.
Optimised alternative
The study of alternatives carried out by Chris Stokes (2011; also shown in Appendix 1) investigates whether there are more cost-effective alternatives to increasing the capacity of the WCML to meet growth in demand. It concludes that there is potential for increasing capacity on the WCML by 215% through a range of incremental initiatives that could be introduced progressively in line with growth in demand. The background forecast demand on the WCML is for a doubling of traffic (102%) by 2043. Thus, a tripling of the capacity on the existing line would be more than adequate to meet forecast traffic in the foreseeable future. To date, no commentator has demonstrated that this finding

42Review of the Economic Case for HS2
is incorrect, and such criticism as has been made has simply tried to obfuscate the arguments. The hierarchy of options to expand capacity include:
• increasing the capacity on the Chiltern line between Birmingham and London using the recently completed Evergreen 3 upgrade. This will deliver comparable journey times to the WCML route (90 minutes to Marylebone compared with 84 minutes to Euston), and will provide the added advantage that the Chiltern line directly serves important catchment areas such as Solihull, Warwick and Leamington Spa;
• reconfiguration of rolling stock to increase seat capacity, particularly the conversion of some underutilised first-class carriages to standard class;
• more effective demand management to control peak demand;• operation of longer trains, without major infrastructure works;• selected infrastructure works to address critical bottlenecks; and• major infrastructure works.
A summary of the cumulative impact on standard-class seating capacity of applying this strategy of incremental enhancement of capacity is given below with full details in Appendix 1:
• The introduction of the current timetable following the completion of the WCML upgrade has in itself increased capacity by 38% over the 2008 timetable that was used as HS2 Ltd’s base case.
• The committed lengthening of 31 of the Pendolino fleet will achieve a further increase of capacity to 79%.
• Additional services are planned in 2013, which will increase capacity to 92% over the 2008 base.
• If 25% of the first-class carriages were reconfigured to standard class the capacity increment would reach 127%, allowing for the increased seat capacity and higher load factors in standard class. This should be able to be achieved without loss of revenue using yield management techniques.
• A further large increment of capacity to 181% over the base case could be achieved by introducing 12-car sets, except to Liverpool where infrastructure constraints prevent this.
• Additional services equivalent to 34 trains daily could be introduced if some targeted infrastructure investment costing about £2.06 billion were carried out. This would enable capacity to be increased to 215%.
• In addition to the capacity increases on WCML summarised above, Evergreen 3 would enable a capacity increase between London and Birmingham by providing longer trains to Birmingham via the Chiltern line.
The effectiveness of increased capacity will be undermined if growth in demand is disproportionally concentrated in times of peak demand. Peak demand management is an essential feature of all forms of transport on busy routes. Otherwise, the costs of providing capacity to meet very high levels of demand in just a few hours of the day become prohibitive, with low average utilisation factors for the assets used. Some degree of peak demand is inevitable. It is

43Review of the Economic Case for HS2
the size of the peak relative to the shoulder and off-peak periods that is critical. Most of the current peak demand on the WCML is caused by the fare structure, particularly on the trains from Euston just after 7 p.m. when ‘saver’ tickets become valid. As pointed out by the McNulty (2011) review, in the future greater sophistication in yield management techniques is needed, including selective use of fully reserved trains, to bring down the costs of rail travel.
Appendix 1 demonstrates that these interventions to enhance the capacity of the existing WCML are not complex and would not involve the kind of disruption that took place during the recently completed upgrade of the WCML. They are the logical extensions of that major upgrade, which are needed to make effective use of the infrastructure capacity that has already been provided and so reduce unit costs on the railway.
We therefore propose that an optimised strategy for enhancing the capacity of the WCML is developed on the basis of these initiatives. This strategy would need to take account of the needs of all traffic and not just intercity and would include freight. Once an optimised alternative scheme is identified it should be evaluated directly with the HS2 project and not just with some ‘do-minimum’ comparator. In this way the true comparative benefits of HS2 against a strategy based on utilising the existing network can be determined on a consistent basis.

44Review of the Economic Case for HS2
7. Other Elements of the Economic Evaluation
There are a number of other key elements of the economic evaluation of HS2 that need to be considered:
• The impact of HS2 on the rest of the network.• The treatment of risk and uncertainty in the evaluation.• The effect of the assumed project life and discount rates.• The accounting framework for the appraisal and the presentation of
the results.
Impact of HS2 on the rest of the network
The network models used for the demand forecasts and the economic evaluation of HS2 have the advantage that they enable a systematic and, normally, consistent approach to analysing and evaluating the total impact on demand and user benefits across the networks represented in the models. The networks represented in the Planet Long Distance model and the local rail models of the South East and West Midlands include the trunk road network, relevant domestic air services, the existing classic rail network and HS2. The station access models included more detailed local transport networks. The validity of the outputs of the network models depends, amongst other things, on how accurately the transport services on the networks are represented. Inevitably, some approximations are needed to represent the variety and complexity of train services. The models are neither simulation models, able to represent service characteristics at a detailed level, nor are they business models able to estimate the impact on costs, demand, revenues and subsidy requirements from changes in the level of demand. There are therefore limitations on the extent to which the network models used for demand forecasting for HS2 can be adapted to provide accurate estimates of all the

45Review of the Economic Case for HS2
financial impacts of HS2, including the effect of changes in the services on the classic network and hence the overall impact on subsidy to the railways.
The main objective of the models is to forecast demand and they are designed mainly for this purpose. This places severe limitations on the extent to which they are able to evaluate the impact on the business economics of the classic rail network, which will be affected by the diversion of a large proportion of its traffic to HS2. The consequential impact of this loss of traffic is difficult to foresee so far into the future. The initial impact will be to reduce drastically the traffic on the existing London to Birmingham classic intercity services, leading to a withdrawal of many of these services to match capacity closer to demand. There will then be opportunities to develop a new schedule of services. The effects are likely to involve both winners and losers. The withdrawal of services is likely to reduce the frequency of, or to eliminate, the services that stop en route between the main city centre terminals, since they depend for their viability on the base intercity demand.
The Government has said that new services will be introduced to use the capacity released on the classic network. However, these are likely to be the least profitable services and to need the most subsidy, otherwise they would already exist. The result will inevitably be a large increase in the subsidy requirements on the existing classic network. This has been the experience of all other high-speed rail services. The provision of a sudden large increment in capacity leads to redundant capacity on the existing infrastructure. Existing services become unprofitable and have to be withdrawn, or subsidy increased. Any new services introduced will require higher subsidy, since they are likely to be the most financially unattractive. Infrastructure costs remain broadly the same because the infrastructure must continue to be maintained.
The analysis that has been carried out by HS2 Ltd has not estimated the full impact on subsidy on the classic network. It has calculated the net impact of new revenue from HS2 less the loss of revenue from the classic intercity services. And it has made allowance for the cost savings from services withdrawn from the classic network (although these have been substantially inflated by the incorrect application of a 41% optimism bias uplift). But no business model of the classic network has been developed to allow the profitability, passenger benefits and subsidy needs of the services that will be operated on it after HS2 to be analysed. This is a serious omission in the analysis. If the additional annual subsidy requirements were added to the capital subsidy for HS2 it would almost certainly show the BCR to be much lower.
An attempt was made by HS2 Ltd to represent a notional set of services that might operate on the classic network when HS2 is opened in order to estimate changes in demand in the ‘with HS2’ case. But to forecast the viability of the services remaining and new services introduced requires estimates of demand and revenue on each of the services, and the costs of operation and the overall cost of fixed infrastructure. It might be argued that the case for increasing

46Review of the Economic Case for HS2
subsidy on the existing network will be determined at the time on a case-by-case basis according to the net benefits of the services provided. But much of the additional subsidy that will be needed will have been because HS2 has reduced the utilisation of the assets on the existing network and the fixed costs of the classic network are allocated to a smaller number of less remunerative services. Therefore, this increase in the annual subsidy should be attributed to HS2.
It is not possible to make a meaningful estimate of the level of this additional annual subsidy requirement on the classic network, because, for example, some of the costs now identified as fixed might be avoided once long-distance services have transferred to the HS2 route. But if, for illustration, it amounted to, say, 5% of the present annual subsidy for the whole network, or £100 million each year, to achieve the desired level of service on the classic network, this would be equivalent to a £2.6 billion increase in the present value of subsidy requirements over the project life. In practice, given the pressure to compensate for the loss of classic services after HS2 is opened, the total increase in subsidy requirements on the classic network could be considerably higher, depending on policy decisions. Having accepted the case for subsidising HS2 so heavily, further extensive subsidies can in principle be justified across the network on the basis that capacity will otherwise not be fully utilised. There may be an argument about how much is attributable to HS2 if the subsidy can be justified in its own right. Nevertheless, building the HS2 will take the Government the opposite way it wants to go with respect to the level of annual subsidy required to support Britain’s railways.
Treatment of risk and uncertainty
The appraisal that has been carried out of HS2 is very weak with regard to the treatment of risk and uncertainty. The risks associated with the HS2 policy are manifold and cannot be covered comprehensively here. The project requires a huge commitment of resources to be spent on a project that will not be ready for operation for at least fifteen years. There are major technology risks, particularly associated with the feasibility of achieving the capacity requirement of 18 trains per hour on HS2 that will be required for the ‘Y’ network to be feasible. This has not been attained on any high-speed network in the world and is reminiscent of the undelivered promise of new signalling capability on the recent upgrade of the same WCML route.
By the time HS2 is ready for use after 2025, there could be many changes in economic conditions and travel demand patterns, as technology and tastes change. As we will discuss later, the case for the project is highly dependent on benefits that will not arise for more than forty years. Thus, the time profiles of the estimated benefits and costs represent substantial risks in themselves. The relatively low discount rates recommended by the Treasury for project appraisal do not take account of time-related risk. There is therefore a case for introducing a supplement on the discount rates for this purpose. We recognise that increasing the discount rate is not an effective way of dealing with all

47Review of the Economic Case for HS2
project risks, but it can take account of time-related uncertainty for projects that have very long project lives. As with much else in this form of analysis, it is a judgement as to where any addition to the discount rate should be set.
Perhaps, the strongest argument for a more thorough treatment of the risks associated with the project is that HS2 is not needed. There is plenty of capacity available on the existing line to be able to carry three times the current levels of traffic. One of the main arguments made for HS2 when it was first considered was that capacity could not be expanded sufficiently and cost-effectively on the existing line. This is clearly not the case.
If there is no argument for HS2 on the ground of capacity needs, we have also shown in Section 5 that the benefits of faster travel are very questionable in both economic and environmental policy terms. HS2 will take the Government further from the ‘Green Agenda’ by generating a large increase in travel demand which will involve not just rail travel but also additional travel by road associated with more rail journeys.
With this range of risks it is surprising that the HS2 evaluation is so weak in this area. It relies on a number of sensitivity tests that fail to reflect the extent of uncertainty over key variables. The sensitivity tests chosen involve adjustments to specific assumptions, mainly affecting the demand forecasts. The tests undertaken by HS2 Ltd are summarised below against an expected user BCR of 1.6:
• Extending the forecasts for five more years to 2048 raises the BCR to 2.0.• Stopping growth in demand at 2026 reduces the BCR to 0.7.• Increasing the rate of growth in demand so that the ‘cap’ is reached in 2033
raises the BCR to 1.9.• Slowing the rate of growth in demand from 1.4% per year to 1.1% per year
so that cap is reached in 2055 would lower the BCR to 1.3.• Cutting the rate of growth in very long-distance trips (to Scotland) reduces
the BCR to 1.3.• Assuming no further growth in both long-distance car and air demand
beyond 2008 reduces the BCR to 1.4.• Higher carbon trading prices leading to a 37% increase in air fares by
2043 would raise the BCR to 1.8. (Note that this relatively high increment is probably due to the questionable use of latent demand for air travel in the evaluation, rather than actual capacity constrained growth.)
• Higher fuel duty to increase prices by 50% by 2043 would raise the BCR to 2.4. This large increase is mainly due to the impact on the underlying rail demand of higher fuel prices for cars.
• Rail price increases at the rate of RPI +2%, rather than RPI +1%, would reduce demand by 24% and reduces the BCR to 0.9.
• Halving the value of time for business travellers would, under the DfT’s assumptions, have little impact.

48Review of the Economic Case for HS2
As discussed in Section 5, we dispute the validity of the last test since it is based on the erroneous argument that the effect would be offset by business travellers being unable to work on crowded trains.
The sensitivity tests carried out do not reflect the range of uncertainty in the key variables. And they do not reflect the combination of risks that face this project. Sensitivity tests are a quite ‘rough and ready’ way to deal with risk and uncertainty in project appraisal. The process of dealing with risk should start at the beginning of the process when alternative strategies for dealing with the basic need for the project are considered. A shortage of capacity on the WCML can be addressed by a range of much lower risk measures, long before there is a need to consider building a complete new railway to substitute for an existing line that has just had £9 billion spent on upgrading it. It may be this mindset in the rail industry that has led to costs in the rail industry in Britain being 40% higher than in comparable countries.
The first recourse to a situation of excess demand for any product is normally to consider raising the price. If the users are currently not paying the full cost of the service and are, on average, relatively rich, as is the case on the WCML, that would seem to be a valid policy response. To an extent the Government is now doing this by the current policy of increasing rail prices by RPI +3% for the next three years. But a more targeted increase on peak-loaded trains on the WCML is likely to make a substantial impact on the problem of crowding and apparent capacity shortages.
We recognise that the economist’s suggestion of raising prices, even peak prices, is never popular politically in the public services (although commercial air services appear to be able to price according to the strength of demand). However, in the case of the WCML, peak pricing may be needed to only a relatively limited extent in order to shift the sharpest peaks causing the most problems. Furthermore, the capacity limits on the WCML have not been reached. Substantial increases in capacity can be achieved by incremental investment in higher-capacity trains and other low-cost initiatives.
The combination of peak pricing and incremental capacity increases in line with demand is a much lower risk strategy than building a complete new high-speed railway. Therefore, this option should have been the first to be considered at an early stage. Instead, the assumption was made that high-speed rail was the solution needed and the analysis has followed this conclusion. Only later was work commissioned on the alternatives and this has been narrowly based and inadequate for such a major strategic decision.
Risk and uncertainty should be taken into consideration throughout the policymaking and appraisal process and not tagged on at the end in sensitivity tests alone. The probability range of uncertainty should be recognised in all the key variables. There is a case for the use of Monte Carlo techniques to recognise the impact of combinations of risks amongst a range of key

49Review of the Economic Case for HS2
variables, especially in the demand forecasting process. Thus, rather than acknowledging each risk separately, the distribution of probability around the mean can be used to analyse the combined impact of a number of risks to different key variables. However, the adoption of such techniques is difficult in practice because it is hard to judge the probability distribution of key variables and some risks are correlated and would require extensive analysis to take into account the interrelationships involved.
Where there is a likelihood of optimism bias, it should be taken into account. Optimism bias has been allowed for in the estimation of costs but not in the demand forecasting for HS2. There may have been optimism bias in other parts of the evaluation in the choices made. Those grounded in the base case tended to favour the case for HS2. Similarly, the use of the cap on demand at a level of a doubling of underlying demand has allowed the whole benefits of HS2 at broadly its full capacity to be carried forward over the following forty years of the project life. Whilst we believe that the detailed analytical work on the project has been carried out diligently and objectively by HS2 Ltd, its focus on investigating the case for high-speed rail – rather than finding an optimal solution to capacity constraints on WCML – may have influenced the approach adopted at key junctures.
Project life and discounting
The operating life for HS2 that has been used in the cost–benefit analysis is extremely long, extending sixty years beyond 2025. It is clear that railways are capable of operating for very long periods, providing a proper allowance is made for maintenance, renewal and full replacement of assets at appropriate times, and such long appraisal periods have been used in other similar transport projects. But, when looking so far into the future, there is an arguable risk of obsolescence. The assumption of a long operating life favours the case
50Review of the Economic Case for HS2
for HS2, particularly in combination with the low discount rates in Treasury guidance.8 Once again, these rates are standard. However, the way the appraisal has been carried out, by allowing traffic demand to increase to the point when the capacity of HS2 will be broadly fully utilised, and hence the benefits are at the maximum level, and then projecting these benefits forward another forty years with real income growth allowance and a low discount rate, tends to produce a high figure for total benefits and place a high value on benefits which are obtained very far in the future. Approximately half the benefits will occur after 2043, that is, between thirty and seventy-five years in the future using these assumptions. If the project life were shortened by twenty years it would reduce the benefits by approximately 18%, lowering the BCR to 1.3. A proper analysis of risks for the HS2 project would draw attention to these points and emphasise that as a result HS2 has far greater attendant risks than plans to meet the same objectives through incremental investments.
Wider economic benefits
While we have not examined the wider economic benefits of HS2 in any detail, we have reviewed other work which has looked at these areas and in particular at the issue of the North–South divide and the role that HS2 might play in helping to improve the balance between the economies of London and the South East and those in the North. The Government has made some strong claims that HS2 will somehow bridge the North–South divide and rebalance the economy. However, it has offered no evidence or convincing arguments on how a high-speed railway providing faster journeys for passengers (but not freight) between a few city centres could have such transformative effects. The potential impact of HS2 on economic regeneration and in particular its potential for reducing the North–South divide has been examined carefully by Professor Tomaney of the University of Newcastle. His key conclusion is that: ‘It is difficult to find robust evidence that HS2 will have a transformative impact on the economic geography of the UK’ (Tomaney, 2011), although it is inevitably not feasible to preclude the possibility that it will have some impacts.
Tomaney uses the framework of New Economic Geography (Lafourcade & Thisse, 2008) to support his conclusions. This framework seeks to understand the economic processes that produce inequalities. It suggests that scale economies, labour market pooling and knowledge spillovers act in a mutually reinforcing way to improve productivity and competitiveness, which in turn explains the pull effect exerted by core cities. It explains why London and the South East continue to prosper and diverge from the rest of the country. A study by Lafourcade and Thisse (2008) shows that lower transport costs are likely to benefit core regions to the detriment of poorer peripheral ones. The positive externalities generated by agglomeration economies are mutually reinforcing and therefore the more productive cities or regions are likely to
8 3.5% for the first thirty years and 3.0% for the remainder of the appraisal period, with a further drop to 2.5% seventy-five years from the current year, i.e. forty-five years into the appraisal period of HS2.

51Review of the Economic Case for HS2
provide a more competitive business environment. As a result, when firms located in the core city compete with those located in peripheral ones the former have a comparative advantage.
Tomaney also cites a study by Rodríguez-Pose and Fratesi (2004), which uses cross-sectional and panel data to assess the impact of European Structural Funds expenditure on Objective 1 (i.e. less well-developed) regions. It shows EU investments in new infrastructure (notably roads, high-speed rail, etc.) had no noticeable impact on regional convergence. Only in the case of investments in education and human capital was it possible to identify positive and significant returns. Rodríguez-Pose and Fratesi (ibid.) consider a number of reasons for this disappointing performance but conclude that the main reason is that the relationship between infrastructure investments and regional convergence is inherently weak.
Rail in general and high-speed rail in particular tends to be patronised by higher income groups. In the UK these groups are concentrated in London and the South East. This in turn suggests that the benefits of HS2 are likely to accrue disproportionately to this part of the country, rather than other parts of the UK.
In countries such as France and Spain which have developed high-speed rail networks, the evidence suggests that the main benefits accrue to the capital cities rather than less prosperous regions. A study in France shows that travel by air and rail on the Paris–Rhone–Alps route increased by 144% for trips to Paris and 54% for trips from Paris (Albalate & Bel, 2010). A study of intra-organisational travel found an increase of 156% in trips to Paris and 21% in trips from Paris. High-speed rail also appeared to reduce the number of overnight business stays. In Spain, the first high-speed line connected Madrid to Seville, and there is evidence that the link has contributed to a greater concentration of business and population in the capital.
These conclusions have huge significance for the appraisal of HS2 because the Government and other proponents of the scheme have placed great emphasis on claims of wider economic impacts of HS2, particularly as it became clear that the quantifiable benefits to transport users are not high and the BCR for HS2 is low. But the evidence suggests that the impact of HS2 may well be to increase existing regional imbalances, with London benefiting disproportionately from any positive economic impacts. In practice, HS2 may well damage the peripheral regions that are not connected to HS2. The fact that income elasticities of demand for rail travel are higher for trips to London than for trips from London would tend to confirm the likelihood of this outcome since it suggests that the impact of HS2 is likely to be the attraction of additional business to London rather than to the regions. Also, the impact of HS2 should not be considered in isolation but in comparison with other potential interventions, either in the transport sector or elsewhere. European evidence (Rodríguez-Pose & Fratesi, 2004) suggests that investment in human

52Review of the Economic Case for HS2
capital and education has better prospects of reducing regional disparities. A package of smaller-scale rail investments to improve accessibility within regions, such as those suggested as an alternative to HS2, might well offer more positive impacts than HS2.
The appraisal accounting framework
The appraisal of HS2 places great emphasis on the BCR or net benefit ratio (NBR) of the project (the two terms are used interchangeably). This is the ratio of the gross benefits of the project to the net costs. The net costs are calculated by determining the gross costs of providing the service and then deducting the amounts that are collected in fare revenue. This approach works well for the majority of transport projects where there is no revenue and the ratio will help to identify those projects that generate the greatest benefits for the investment of a given amount of public funds. It is methodologically unsound for projects that have significant revenue and this is recognised by the DfT. WebTAG states: ‘The BCR is of limited value where projects (road user charging, for example) result in significant revenues accruing to the Broad Transport Budget (for national or local government) such that the Present Value of Costs (PVC) becomes negative.’
This is an important methodological point. For a commercial project that is expected to earn revenue, the BCR would normally be infinite as there would not be any subsidy from the public sector to bear. For HS2 the central estimate of the BCR is 1.6 without wider economic benefits. This is a very low figure for a revenue-earning project. A better way of looking at the figures is to calculate the BCR – in the way the term has been conventionally used in cost–benefit analysis – by comparing the gross costs with the gross benefits (i.e. including the revenue line in with the benefits). On this basis, on HS2 Ltd’s own figures, the true BCR is 1.26 against an NBR of 1.60.

53Review of the Economic Case for HS2
8. Conclusions
The economic case for the construction of a high-speed rail link between London and the West Midlands is flawed in a number of serious respects. Our review of the reports issued with the Government’s consultation and the analysis in Appendix 1 demonstrates that a much better solution would be to provide additional capacity on the existing network to meet the increases in demand as they materialise. This is a far less risky and more cost-effective
solution. It does not involve committing some £18 billion now to construct a new line that will not be available for use until 2025 on the strength of some very uncertain demand forecasts, to achieve benefits from faster rail journey times that have dubious economic value, most of which will not materialise for thirty or forty years into the future.
The Government has launched its consultation on the basis of constructing the ‘Y’ network of high-speed rail links, not just the London to Birmingham link. It believes that the case for extending the High Speed 2 (HS2) beyond Birmingham to Leeds and Manchester to create the ‘Y’ network will be stronger than the economic case for the link to Birmingham. But the preliminary analysis it has produced to demonstrate this appears to be very crude and no details have been released so that it can be reviewed. The economic analysis that has been carried out for the London to Birmingham link is so weak that it seems unlikely to be sufficiently improved when applied to the ‘Y’ network to justify committing well over £30 billion.
Furthermore, there are serious doubts that this scheme will be viable on purely operational grounds. The ‘Y’ network will require 18 trains per hour to be operated to meet the capacity requirements in the peak for the forecast traffic. This capacity has never been achieved on any high-speed railway in the world – even ones that are totally self-contained. HS2 will not be self-contained and capacity and reliability will be affected by imported delays from the trains running into the HS2 system, along with other operational constraints. The scheme is likely to be inoperable at the planned peak capacity level.

54Review of the Economic Case for HS2
As the debate has continued and more information has become available, the arguments against HS2 have multiplied. The claimed benefits to the wider economy of enabling faster travel in the narrow intercity travel market are largely illusory, or at best small. Expanding capacity across the existing rail network and targeted improvements to the road network would provide a far greater contribution to bridging the North–South divide and could be delivered much earlier. HS2 will not be environmentally beneficial. At best, it will be carbon-neutral. It is expected to generate a great deal of additional traffic which in turn will give rise to more road trips at either end of the journey, to harm the environment. This major new route will create noise, visual intrusion and serious severance effects across hundreds of miles of urban and rural areas.
Our analysis has shown the economic benefits to users are much less than claimed. We have shown that the traffic demand for HS2 is likely to be at least 29% lower than forecast. The risks in the demand forecasts have been considerably increased by extending the forecasting period well beyond the time frame for which the assumptions used can be regarded as reliable. Furthermore, the crowding benefits that have been claimed arise only because an unrealistic base case for comparison has been used. If the scheme were compared with the optimised alternative proposed in Appendix 1, or with the RP2 alternative proposed by the DfT’s own consultants, the crowding benefits would disappear. We have also indicated that the reliability benefits of HS2 have been overstated but it is difficult to estimate by how much. Finally, the benefits of faster rail journey times to business travellers are much less than has been assumed because working time spent on trains is not wasted as the current evaluation assumes.

55Review of the Economic Case for HS2
The effect of these adjustments, and others arising from our review, on the results of the economic appraisal of HS2 are shown in Table 8. We would emphasise that these adjustments are not sensitivity tests but are our assessment of more realistic central assumptions to the evaluation. They show that there is no economic case for building HS2. The BCR from the Government’s own transport user cost–benefit analysis is 1.6. The adjusted BCRs are approximations to the outcome of a full reappraisal but they give a reasonable estimate of the impact of these proposed revisions. They do not include any adjustment to shorten the forecast period to within the reliable range or for a reduction in the reliability benefits, although we believe these adjustments should be made in a reappraisal of the scheme. Neither do they allow for an increased level of risk over time by using a higher discount rate, as discussed in Section 7. A combination of any two of the reasonable adjustments shown in the table eliminates the case for HS2 and the combination of all of them has a massive effect.
Table 8: BCR after adjustments to the appraisal assumptions
Adjustment to benefits Adjusted BCR from 1.6
1 Reduce demand forecasts by 29% 1.1
2 Revised base case (no crowding) 1.4
3 Value working time at commuter rate 1.2
4 Operating life 40 years 1.3
Adjustment 2 + 3 0.9
Adjustment 1 + 2 + 3 0.7
Adjustment 1 + 2 + 3 + 4 0.5
Source: Authors’ own

56Review of the Economic Case for HS2
ReferencesForster, A. (2011). DfT’s high-speed rail modelling ‘unsuitable for decision-making’. Local Transport Today, 577, 12 August, 1, 36.
HS2 Ltd (2009). High Speed rail: London to the West Midlands and beyond. Retrieved 7 November 2011 from http://webarchive.nationalarchives.gov.uk/20110131042819/http://www.dft.gov.uk/pgr/rail/pi/highspeedrail/hs2ltd/technicalappendix/pdf/report.pdf
Albalate, D. & Bel, G. (2010). High Speed Rail: Lessons for Policymakers from Abroad. Working Paper 2010/3. Barcelona: Research Institute of Applied Economics, University of Barcelona.
Atkins (2010). High speed 2 strategic alternatives study: Rail interventions report. Retrieved 19 October 2011 from http://webarchive.nationalarchives.gov.uk/+/http://www.dft.gov.uk/pgr/rail/pi/highspeedrail/alternativestudy/pdf/railintervention.pdf.
Atkins (2011). High speed rail strategic alternatives study: Strategic alternatives to the proposed ‘Y’ network. Retrieved 19 October 2011 from http://highspeedrail.dft.gov.uk/sites/highspeedrail.dft.gov.uk/files/hsr-strategic-alternative.pdf.
Dargay, J. (2010). Long distance travel in Britain: Prospects in a time of uncertainty. Retrieved 19 October 2011 from www.theitc.org.uk/docs/2.pdf.
DfT (Department for Transport) (2007). Delivering a sustainable railway. Retrieved 19 October 2011 from http://www2.dft.gov.uk/pgr/rail/whitepapercm7176.
DfT (2010). High Speed Rail. Command Paper 7827. London: Department for Transport.
DfT (2011a). Rail subsidy per passenger mile. Retrieved 19 October 2011 from www.dft.gov.uk/publications/dft-business-plan-indicators-input-01/.
DfT (2011b). Further written evidence from the Department of Transport (HSR 167A) to the Transport Select Committee August 2011. Retrieved 19 October 2011 from www.parliament.uk/documents/commons-committees/transport/HSR%20167A%20DFT%20supplementary.pdf.
DfT (2011c). InterCity west coast consultation. Retrieved 19 October 2011 from www.dft.gov.uk/consultations/closed/2011–01.
DfT (2011d) Creating growth, Cutting Carbon: Making Sustainable Local Transport Happen. Retrieved 8 November 2011 from http://www2.dft.gov.uk/pgr/regional/sustainabletransport/pdf/whitepaper.pdf.

57Review of the Economic Case for HS2
Eddington, R. (2006). The Eddington Transport Study: The Case for Action. Sir Rod Eddington’s advice to Government. Norwich: HMSO.
Flyvbjerg, B. et al. (2004). Procedures for Dealing with Optimism Bias in Transport Planning: Guidance Document. London: Department for Transport.
Flyvbjerg, B. et al. (2007). Policy and planning for large infrastructure projects: Problems, causes, cures. Environment and Planning B: Planning and Design, 34: 578–97.
Hague Consulting Group et al. (1999). The Value of Travel Time on UK Roads. The Hague, Netherlands
Hensher, D. A. (1977). The Value of Business Travel Time. Oxford: Pergamon Press.
HS2 Ltd (2010a). High Speed Rail London to the West Midlands and Beyond: A Report to Government by High Speed Two Ltd. London: Department for Transport.
HS2 Ltd (2010b). HS2 Technical Appendix. Retrieved 11 November 2011 from http://webarchive.nationalarchives.gov.uk/20110131042819/http://www.dft.gov.uk/pgr/rail/pi/highspeedrail/hs2ltd/technicalappendix/pdf/report.pdf.
HS2 Ltd (2011a). A Summary of Changes to the HS2 Economic Case. London: Department for Transport.
HS2 Ltd (2011b). Further written evidence from HS2 Ltd (HSR 169A) to the Transport Select Committee August 2011. Retrieved 29 October 2011 from www.publications.parliament.uk/pa/cm201012/cmselect/cmtran/writev/rail/hsr150b.htm.
HS2 Ltd/DfT (2011). Economic Case for HS2: The ‘Y’ network and London – West Midlands February 2011. London: HS2 Ltd/Department for Transport.
Lafourcade, M. & Thisse, J.-F. (2008). New Economic Geography: A Guide to Transport Analysis. Paris: Paris School of Economics, Paris-Jourdan Sciences Economiques Laboratoire D’Economie Appliquee – INRA.
McNulty, R. (2011). Realising the potential of GB rail: Final independent report of the rail value for money study. Retrieved 19 October 2011 from http://assets.dft.gov.uk/publications/report-of-the-rail-vfm-study/realising-the-potential-of-gb-rail.pdf.
NAO (National Audit Office) (2010). Increasing passenger rail capacity (HC 33 2010–2011). Retrieved 19 October 2011 from www.nao.org.uk/publications/1011/rail_capacity.aspx.

58Review of the Economic Case for HS2
Network Rail (2010a). East Coast Main Line 2016 Capacity Review. Retrieved 8 November 2011 from www.networkrail.co.uk/browse%20documents/rus%20documents/route%20utilisation%20strategies/east%20coast%20main%20line/east%20coast%20main%20line%202016%20capacity%20review/east%20coast%20main%20line%202016%20capacity%20review.pdf
Network Rail (2010b). West Coast Main Line route utilisation strategy: Draft for consultation. Retrieved 19 October 2011 from www.networkrail.co.uk/browse%20documents/rus%20documents/route%20utilisation%20strategies/west%20coast%20main%20line/scope%20and%20draft%20for%20consultation/westcoastmainline_rus.pdf.
Network Rail (2011). West Coast Main Line route utilisation strategy July 2011. Retrieved 7 November 2011 from www.networkrailmediacentre.co.uk/imagelibrary/downloadMedia.ashx?MediaDetailsID=4675.
Public Accounts Committee (2010). Fifth Report. Increasing Passenger Rail Capacity. Retrieved 11 November 2010 from www.publications.parliament.uk/pa/cm201011/cmselect/cmpubacc/471/47102.htm.
Rodríguez-Pose, A. & Fratesi, U. (2004). Between development and social policies: The impact of structural funds in objective 1 regions. Regional Studies, 38(1): 97–113.
Steer Davies Gleave and DeltaRail (2007). Network modelling framework: Demand and assignment background documentation. Retrieved 18 October 2011 from http://webarchive.nationalarchives.gov.uk/+/http://www.dft.gov.uk/about/strategy/whitepapers/whitepapercm7176/railwhitepapersupportingdocs/nmfdemands.pdf.
Stokes, C. (2011). Optimised alternatives to HS2 – The scope for growth on the existing network. Retrieved 7 November 2011 from www.51m.co.uk/sites/default/files/uploads/ch1.pdf.
Tomaney, J. (2011). Local and regional impacts of high-speed rail in the UK. Evidence to the Transport Select Committee inquiry into HS2. Retrieved 7 November 2011 from www.51m.co.uk/sites/default/files/uploads/ch5%281%29.pdf.
Wardman, M. R. (2006). Demand for rail travel and the effects of external factors. Transportation Research Part E: Logistics and Transportation Review, 42 (3): 129–48.
Whelan, G., Harvey, A. & J. Cartmell (2010). A time series analysis of rail demand in Great Britain. Retrieved 19 October 2011 from www.etcproceedings.org/paper/a-time-series-analysis-of-rail-demand-in-great-britain.

59Review of the Economic Case for HS2
Appendix 1Optimised alternative to HS2 – The scope for growth on the existing network
Prepared by Christopher Stokes
This paper sets out a realistic ‘Optimised Alternative’, providing additional capacity on the West Coast Main Line (WCML) route on an incremental, value-for-money basis, through reconfiguration of some first-class capacity to standard class, operation of longer trains, and limited, specific infrastructure investment to ease a small number of ‘pinch points’ on the route. The additional capacity provided is fully able to meet any foreseeable future increase in demand.
Introduction
Rigorous evaluation of proposals to construct a £32 billion rail project should properly include consideration of all alternative options, with the project itself evaluated against the best alternative, rather than an artificial ‘do-minimum’ case, as has been the case with High Speed 2 (HS2).
Taking the present position as a start point, there is currently limited crowding on the WCML in standard class. This is concentrated on Friday evenings, particularly on departures immediately after 7 p.m. when cheaper ‘saver’ tickets are available. In contrast, first-class load factors are low, at about 20%.
Provision of additional capacity is already planned through the committed project for lengthening 31 out of the existing 52 Pendolino units from 9 to 11 cars by adding two standard-class cars, together with the procurement of four new 11-car trains. However, there is likely to be significant further demand growth, and it is certainly appropriate to identify options to meet this.
Options should be considered incrementally, starting with proposals which prima facie offer the best value for money. The options would include:
• effective use of the capacity provided by Chiltern Railways as a result of the Evergreen 3 project, which was completed in September 2011 and provides faster journey times between Birmingham and London;
• rolling stock reconfiguration, particularly conversion of some first-class vehicles to standard class;
• more effective demand management, including when appropriate use of obligatory reservations;
• operation of longer trains, to the extent that this is possible without major infrastructure expenditure;
• targeted infrastructure investment to clear selected bottlenecks to enable frequencies to be increased; and
• construction of new infrastructure (HS2).

60Review of the Economic Case for HS2
It should be noted that the Department for Transport (DfT) and HS2 Ltd have given no consideration to rolling stock reconfiguration and improved demand management, and have not optimised their evaluation either of train lengthening, or of incremental infrastructure investment. In addition, the Evergreen 3 project was explicitly ignored.
This submission considers these options, focusing on the WCML, and also includes brief summaries in relation to the East Coast and Midland Main Lines. The options for the WCML have been evaluated to produce an optimised alternative, a low-risk, incremental approach, with much lower costs than for HS2 and the ability to trigger incremental expenditure as and when it is required, rather than the ‘all or nothing’ approach which is unavoidable with construction of a new route.
The optimised alternative is based on the incremental interventions in Table 9 and delivers a 215% increase in standard-class seating over the DfT’s 2008 ‘base’. This increase is over twice the high ‘background growth’ figure of 102% forecast by the DfT.
The derivation of the table is detailed in Annex 1; the additional capacity provided does not take into account the completed capacity upgrade on the Chiltern route, or assume any benefits from more effective demand management.
The proposed incremental changes are considered in more detail in this chapter.

61Review of the Economic Case for HS2
Table 9: Incremental interventions for optimised alternative
InterventionsDaily trains
Daily standard-class seats
% Increase above 2008 base Comments
Train investment with no/little infrastructure investment
HS2 2008 base 59,298
Base used by the DfT for evaluation of HS2. Predates full WCML upgrade timetable.
Current timetable 286 81,924 38%Includes Voyager services (30 daily)
Evergreen 3 [64] [35,200]9 [100%]
Committed scheme – complete in 2011Illustrative numbers –excluded from totals
Committed lengthening project
286 105,924 79% Committed scheme – implemented from 2012
December 2013 additional services
306 113,769 92% Additional hourly off-peak train each way
First-class reconfiguration 306 134,379 127%One car converted from first to standard
12-car sets (except Liverpool)
306 166,908 181% Major physical constraints at Liverpool
Infrastructure investment
Additional services 336 186,648 215%34 additional daily trains following investment to relieve pinch points
Evergreen 3
The recent upgrade of the Chiltern line Marylebone–Birmingham route (Evergreen 3), completed in September 2011, has reduced fastest journey times on the route to 90 minutes, only marginally longer than the present times for the Euston route (84 minutes). In addition, the Chiltern route directly serves affluent areas to the south-west of Birmingham (Solihull, Warwick, Leamington Spa) with high levels of rail use, so will provide a very attractive alternative to the use of current railheads at Birmingham International and Coventry.
The business case for the Evergreen 3 project is predicated on Chiltern gaining a significant share of the current West Midlands–Euston market, which will
9 Illustrative Evergreen 3 figures assume Chiltern trains currently 4-car class-168 units (275 seats), lengthened to 8-car class-168 (550 seats).

62Review of the Economic Case for HS2
directly relieve any future crowding pressures on the Euston route. However, the DfT’s evaluation of HS2 takes no account of Evergreen 3.
At present, Chiltern generally operate short (3- or 4-car) trains, and capacity could be readily increased by operating longer trains without any additional infrastructure expenditure.
A combination of extra seats on the WCML and Chiltern routes is fully able to meet high growth scenarios for the London–West Midlands corridor. Taken together, these initiatives deliver 1,450 additional standard-class seats in each direction every hour, giving a total of 2,882 seats per hour, or 46,112 per day. This is more than ten times the total combined average daily demand from Birmingham New Street and Birmingham International of 4,273 each way in 2009/10 (Network Rail, 2011: 47).
Rolling stock configuration
First-class load factors are much lower than standard class currently (approx. 20% only, compared with approx. 50% in standard class) and first-class volumes have recently dropped, reflecting reductions in corporate and public sector, expenses-paid, first-class business travel as a result of the recession and public expenditure cuts. First-class yields per passenger have also declined substantially, reflecting the shift to much cheaper, train-specific advance purchase tickets.
If, conservatively, one out of the current four first-class cars in each unit is reconfigured as standard class, this would increase overall seating. For an 11-car unit, the new capacity would be 99 first/519 standard, compared with 145/444 at present. The reduction in crowding would be significantly greater, reflecting the much higher load factors in standard class; the units would have 75 additional standard-class seats, giving an overall increase in standard class of 19%. It may be that detailed analysis would show that overall capacity would be optimised by reconfiguring two first-class cars to standard class in each train. It is also possible that bidders for the new West Coast franchise will propose reconfiguration themselves.
This change could almost certainly be carried out without any reduction in revenue, as the limited number of trains on which a reduction of one first-class vehicle might cause a shortage of first-class capacity could be managed through yield management techniques.
Improved demand management
The majority of the existing overcrowding is on departures from Euston after 7 p.m. on a Friday evening, as these trains are the first for which the regulated, non-train specific ‘saver’ fares are available. Given the increases in open ticket prices since privatisation, the regulated ‘saver’ fares represent very good value,

63Review of the Economic Case for HS2
and are cheaper than advanced purchase prices in the evening peak period. But this is an artificial peak, directly caused by the fares structure, and could be reduced by changes to the structure for fares regulation.
In the medium term, the development of smarter IT will certainly enable better demand management, with flexible, fully reservable trains, enabling passengers to arrive at the last minute, and book a seat ‘on the run’, using mobile devices, provided space is available. Given the pace of IT development, it is inconceivable that such systems will not be in place by 2026 when HS2 Phase 1 is due to open.
Effective demand management would enable load factors to rise in a sustainable way without increased overcrowding; both Eurostar and French TGV services already operate at load factors of about 70%. This would also significantly improve the poor financial performance of the rail industry, as set out in the National Audit Office’s report Increasing rail capacity (NAO, 2010), which recommended: ‘The Department should … [evaluate] further the costs and benefits of demand management as well as capacity enhancement approaches to tackling peak time overcrowding.’
Operation of longer trains
The current intercity fleet comprises 52 9-car Pendolinos, each with 145 first-class and 294 standard-class seats, together with 21 5-car diesel Voyager units which are used on Euston–Chester/North Wales and Birmingham–Glasgow/Edinburgh services. The analysis of options for increasing train capacity only considers the Pendolino fleet, but it is equally possible to lengthen or reconfigure the Voyager fleet to deliver equivalent proportional capacity increases.
The existing project to lengthen 31 of the Pendolino units to 11 cars and build 4 new 11-car units will increase total standard-class capacity by 42%. Full use of the four new trains will be delivered through use of the extra path identified by the DfT in the West Coast franchise consultation document (DfT, 2011c: 52).
The DfT considered operation of 14- and 17-car trains in its review of alternatives, but both were rejected because of the major infrastructure work required, and there was no serious evaluation of full 11- or 12-car operation. However, the work carried out by Atkins for the DfT did indicate that only modest infrastructure expenditure would be required to enable 12-car operation on all routes except Liverpool, where lengthening platforms would be prohibitively expensive (Atkins, 2010: Appendix E).
A further increase in train lengths to 12 cars is therefore deliverable cost effectively except on the Euston–Liverpool route. Conservatively, it would be necessary to retain ten 11-car sets to ensure that sufficient units were reliably available for the Liverpool services, which, as a self-contained service, currently require eight units each day.

64Review of the Economic Case for HS2
Targeted infrastructure investment – short term
There is already significant overcrowding on the fast commuter services to Milton Keynes and Northampton, and passenger volumes on this route are likely to grow rapidly in line with expected population growth. Urgent action is therefore required to enable the peak fast commuter frequency to be increased, as follows:
• Construction of a grade-separated junction at Ledburn, south of Leighton Buzzard, to enable commuter trains to transfer from the fast to the slow lines without conflicting with trains in the other direction. This work was identified in ‘Rail Package 2’ (RP2), the best alternative evaluated by the DfT, at an estimated cost of £243 million. The site of the junction is remote from housing and is unlikely to present insuperable difficulties in terms of obtaining Transport and Works Act consent.
• Procurement of new, high-performance trains for operation of the fast commuter services to minimise the impact of capacity on the route south of Ledburn junction. The DfT has already considered introducing new Intercity Express Programme (IEP) trains for these services, and indeed has included equivalent units for the fast Kings Cross–Cambridge trains on the East Coast Main Line in its recently announced commitment to the IEP project. As would be the case on the WCML, the new trains will run to the same timings as the long-distance intercity services on the route, hence maximising route capacity.
Targeted infrastructure investment – medium term
As and when it becomes clear that the increased train capacity set out above will not meet realistic forecasts of demand, further work should be undertaken to mitigate pinch points north of Rugby.
Construction of a fourth line between Attleborough and Brinklow. This work would shorten the section of route north of Rugby which currently has only one northbound track which has to accommodate intercity services together with up to three freight trains an hour. Completion of the current Felixstowe–Nuneaton route upgrade will potentially allow a significant reduction in the number of freight trains on the route south of Nuneaton, but this capacity may be taken up by new flows, for example from new port developments such as London Gateway.
Both the RP2 work and independent work for this evaluation validate that this section of the route will provide sufficient capacity to allow operation of an upgraded intercity service. The estimated cost of this work is £187 million.
The ‘Stafford bypass’. There are significant capacity constraints south of Stafford and at Stafford itself:

65Review of the Economic Case for HS2
• Colwich junction, where the route to Manchester via Stoke-on-Trent leaves the main line, is not grade-separated.
• The main line from Colwich junction towards Stafford is only two track for approx. 3 miles, with a flat junction where the four-track section resumes.
• There is a flat junction with the Birmingham–Stafford route just south of Stafford.
Network Rail has been evaluating possible options for mitigating these constraints, including construction of a ‘Stafford bypass’ which would also allow some reduction in journey times. Firm proposals have not yet been developed, but it is assumed in RP2 that these pinch points can be resolved at an estimated cost of £1.23 billion.
It should be noted that HS2 Ltd’s own analysis assumes: ‘some infrastructure/signalling works have taken place in the Stafford area to alleviate this known capacity constraint’ (HS2 Ltd, 2010b: Technical Appendices, Appendix 2, para 2.20), yet HS2 makes no allowance for the costs of this work. RP2 is therefore inconsistent with this, resulting in a significant bias towards HS2 in the DfT’s evaluation.
Other works proposed by the DfT in its review of strategic alternatives (Atkins, 2010) are not necessary, either because other schemes will provide the necessary capacity (for example, the Manchester ‘Hub’ scheme will free up capacity for additional intercity trains at Manchester Piccadilly and its approaches, and is assumed to have been completed in the DfT’s evaluation of HS2 itself) or because the additional capacity is not required, as between Coventry and Birmingham.
The capital costs of the optimised alternative (£2.06 billion) are detailed in Table 10, which also gives a comparison with the DfT’s estimate of capital expenditure for RP2.

66Review of the Economic Case for HS2
Table 10: Capital expenditure: RP2 compared with optimised alternative
Scheme Scenario B (£ billion)
Optimised alternative (£ billion)
Stafford area bypass 1.230 1.230
Ledburn grade-separated junction 0.243 0.243
Euston station – 3 extra platforms 0.062 n/a
Manchester Piccadilly – 3 extra platforms 0.395 n/a
Attleborough to Brinklow – 4 tracking 0.187 0.187
Northampton Loop speed improvements 0.003 0.003
Beechwood/Stechford 4 tracking 0.903 n/a
Power supply + disruption + other items (+24%) 0.737 0.390
Total 3.759 2.062
Source: Scenario B schemes are identical to those for RP2, and are shown in Atkins (2011: 41)
Peak capacity
HS2’s supporters have argued that alternatives that deliver increased capacity on the existing network are flawed, as they do not deliver capacity when it is most needed, in peak periods. HS2 Ltd has also consistently used this argument at consultation roadshows, but has been unable to provide evidence to support this when challenged.
No detailed loading data is currently publicly available. Both 51m and HS2 Action Alliance have queried this with the DfT and HS2 Ltd, but neither has been able to provide any up-to-date information on peak loadings. This is remarkable, given that the current franchisee, Virgin Trains, certainly has detailed train-by-train loading information, and peak-period loadings are clearly a critical issue in determining whether there is a case for HS2.
The most recent publicly available data on Virgin West Coast loadings is very limited information from Network Rail’s WCML Route Utilisation Strategy (RUS) (Network Rail, 2011: 48). This shows two services daily with standing passengers on weekdays, rising to ten services on Fridays, out of a total of 287 trains daily. The RUS also confirms that standing is in fact concentrated on the first departures from Euston after 7 p.m. in the evening; this is largely an artificial peak, as these are the first trains on which the regulated ‘off-peak’ return (the previous ‘saver’) is available. ‘Open’ ticket prices have progressively been increased at a faster rate than inflation, so the regulated off-peak price is very attractive, and off-peak loadings have increased much faster than peak loadings. In addition, Virgin Trains’ pricing policy has maintained a very sharp disparity in fares before and after 7 p.m. In contrast, East Coast fares are managed to ‘smooth’ this peak much more effectively.

67Review of the Economic Case for HS2
This artificial peak is also evidenced by the posters displayed by Virgin at Euston which specifically refer to the likely overcrowding on trains departing at 7 p.m. and immediately afterwards. This peak can be managed by rationalising the pricing structure and reforming price regulation.
The DfT/HS2 Ltd should not be using the peak-capacity argument for intercity services without evidence to support it, and evaluating alternative ways of dealing with the 7 p.m. artificial peak – the latter is certainly not justification for building a £32 billion new railway.
However, as already discussed, there is an immediate and more serious overcrowding problem on peak trains between Northampton, Milton Keynes and Euston. Capacity constraints on the route currently allow operation of only a half-hourly service from London in the evening peak. All the trains are already overcrowded, with passengers standing for at least 30 minutes as far as the first stop at Leighton Buzzard, and in some cases for even longer. These services currently operate at a maximum speed of 100 mph and transfer to the ‘slow’ lines at Ledburn junction, south of Leighton Buzzard, with frequent albeit minor delays to following intercity trains as the movement to the slow lines often conflicts with southbound intercity services.
The DfT offers no prospect of relief for these already overcrowded services until HS2 is completed, in 2026 at the earliest. In contrast, the optimised alternative includes construction of a grade-separated junction at Ledburn and the introduction of new, higher performance rolling stock, enabling peak capacity on these services to be doubled in approx. five years’ time.
A detailed evaluation has been carried out of the capacity provided by the optimised alternative both against the May 2008 timetable, used by the DfT/HS2 Ltd as the ‘base’ for the evaluation of HS2, and RP2. For completeness, capacity has also been compared with the current (May 2011) timetable.
This comparison has been made against a two-hour period in the evening peak from Euston, for the period 4:30 p.m. to 6:29 p.m. This equates to the recognised peak period for northbound intercity travel if the artificial ‘7 p.m. peak’ is ignored; as discussed above, this can be readily managed through a more rational pricing policy.
Comparative frequencies are set out in Table 11.

68Review of the Economic Case for HS2
Table 11: Peak ‘Fast Line’ Departures from Euston
Intercity trains Fast commuter trains Total trains
May 2008 timetable 19 4 23
May 2011 timetable 23 4 27
RP2 26 8 34
Optimised alternative 24 8 32
Source: GB Rail Timetable (TSO)
The optimised alternative provides increased capacity in each train, with an average of 680 seats compared with 439 today, with (mostly) 12-car trains with nine standard-class cars, in contrast to four first and five standard today. Total standard-class capacity in the peak period is increased by 138% compared with the 2008 base, well above the DfT’s forecast background growth of 102%, and also higher than the 101% capacity increase for RP2. The detailed calculations are set out in Annex 2.
As with RP2, the optimised alternative proposes an increase in peak frequency over the current level. This is achieved by remodelling Ledburn junction, as described above. However, unlike RP2, the illustrative optimised alternative pattern retains some spare track capacity, significantly contributing to reliability.
Despite assuming operation of one less train an hour than in RP2, the optimised alternative provides more standard-class seats than RP2. This is as a result of using the full capacity of the route in terms of train lengths (12-car trains except for Liverpool services, where there are major physical constraints at Liverpool Lime Street station) and reconfiguring one first-class vehicle to standard class. Given the current formation (four first-class vehicles) and the existing low first-class load factors this is a conservative assumption.
Illustrative service pattern
The illustrative optimised alternative pattern also provides an attractive all-day stopping pattern, with improved journey times and intermediate journey opportunities, as shown below:
• Doubling fast commuter capacity to Milton Keynes and Northampton – these are the services for which there is an overcrowding crisis now.
• Additional capacity to Manchester and the north-west• Hourly ‘fast’ Manchester – non-stop to Wilmslow• Glasgow trains accelerated by omission of north-west stops, and alternate
trains running fast from Preston to Carlisle• New through services to Blackpool/Windermere (alternate hours)• Major improvement for Nuneaton, Tamworth and Lichfield

69Review of the Economic Case for HS2
• Improved Rugby service (almost half-hourly interval)• Watford gains a Crewe/Manchester service, giving a step change in access
to the North West
This illustrative timetable has been ‘proved’ through external expert analysis, and is robust. A schematic showing this service pattern is shown in Figure 1.
Relationship with the McNulty study
The optimised alternative is also consistent with key conclusions from realising the potential of GB rail, Sir Roy McNulty’s May 2011 report into value for money in the rail industry. One of the key conclusions was that an important factor is the lower level of train utilisation in this country, with on average fewer passengers using each train (McNulty, 2011: Executive Summary, paragraph 4; also Section 2.3.4, Figure 2.12). The report therefore recommends that there should be much better use of existing capacity: ‘There should be a move away from “predict and provide” to “predict, manage and provide”, with a much greater focus on making better use of existing system capacity’ (ibid.: Executive Summary, paragraph 23) and that: ‘There needs to be at least as much focus on train utilisation (the number of passenger km per train km) as there is on track utilisation (the number of train km per main track km)’ (ibid.: Recommendation 6.3.7).
The approach we advocate through the development of our optimised alternative is entirely consistent with Sir Roy McNulty’s recommendations, identifying low-risk, low-cost approaches which increase capacity on the existing network on an incremental basis as and when it is clear that additional capacity is needed.

70Review of the Economic Case for HS2
West Coast Main Line summary
Intercity services
• Overall, intercity standard-class capacity can be increased by 181% by rolling stock reconfiguration and train lengthening.
• A further incremental capacity uplift (giving a total increase of 211%) can be achieved by carrying out a number of specific infrastructure improvements at an estimated cost of £2.06 billion, to allow an increase in all-day frequency to 11 trains per hour (12 in peak periods).
As discussed earlier, the key issue in relation to crowding is standard-class capacity. However, we have also analysed the optimised alternative against HS2 and RP2 (see Annex 2). This shows that the optimised alternative delivers a lower overall load factor than HS2 (52% compared with 58% for HS2), and provides broadly the same capacity as RP2 at little more than half the capital cost.
There is therefore no case for construction of HS2 to meet any need for increased capacity for the foreseeable future.
Fast commuter services. There is an immediate and more serious overcrowding problem on peak trains between Northampton, Milton Keynes and Euston. Capacity constraints on the route currently allow operation of only a half-hourly service from London in the evening peak. All peak trains are already overcrowded, with passengers standing for at least 30 minutes.
Urgent action is needed to provide additional capacity on this route, and capacity could be doubled in five years by construction of the proposed grade-separated junction at Ledburn at an estimated cost of £243 million, and procurement of new, higher performance rolling stock. But construction of HS2 will delay this until 2026 at the earliest.

71Review of the Economic Case for HS2
Figure 1: Service schematic for illustrative service
Source: Passenger Transport Networks, York
Outline of proposed WCML services with Ledburn Flyover and 200 km/h units for Northampton trains running Fast Line from Euston to Ledburn
Prepared byPassenger Transport Networks. York29 Mar 11 (and revised, 23 Jun)
The timetable has been designed with the Viriato timetabling system developed by SMA of Zürich.
A solid dot on a train line signifies an intermediate call, a circle two or more calls.
Each line represents a service:Green – intercity (gold: peak only)Red – regionalBlue – suburban
The numbers represent departure and arrival minutes in each standard hour (with the arrival time closest to the station rectangle).
down evening peak

72Review of the Economic Case for HS2
Freight. Freight traffic uses the ‘slow’ lines during the daytime, and would be affected by increased intercity services only at pinch points which would be eased, as described above (1.24–1.32). In addition, the current upgrade of the Felixstowe – Nuneaton route will allow diversion of more than half the existing freight trains south of Rugby, creating significant capacity for future growth.
East Coast Main Line
Overall seating capacity can be increased by 87% by the committed frequency increase from May 2011, the introduction of planned higher capacity trains (IEP), the use of higher capacity trains on open access services, and a further timetable revision to allow an extra train per hour on the route, as envisaged in Network Rail’s East Coast Main Line 2016 Capacity Review (Network Rail, 2010a).
In the longer term, further capacity increases can be delivered with infrastructure enhancements costed at £1.159–1.615 billion. With improved demand management, the 115% background growth forecast for 2043 in the DfT’s HS2 documentation can be readily absorbed without further major infrastructure enhancements. There is therefore no case for construction of HS2 to meet any need for increased capacity on the East Coast Main Line for the foreseeable future.
Midland Main Line
Almost half the trains arriving at St Pancras during the morning peak period have standing passengers, but this is entirely due to relatively short-distance commuting from Bedford, Luton and Luton Airport Parkway – the current average all-day load factor south of Leicester is only 39%.
The Thameslink project, now under construction, will deliver a major increase in capacity south of Bedford, with train lengths extended from 8 to 12 cars – some 12-car trains are being introduced in December 2011. When this additional capacity is delivered, the Thameslink service will be a good alternative for passengers who currently use Midland Main Line trains. It is certainly not value for money to provide additional long-distance capacity solely to provide short-distance commuting capacity between Bedford and London.
The DfT’s future forecast demand growth of approx. 100% can therefore be met without any significant further infrastructure investment. This can be delivered through a combination of lengthening intercity trains and transfer of some short-distance London commuter traffic to Thameslink services, once additional capacity is available as an output of the Thameslink project.
There is therefore no justification for the service levels or scope of infrastructure work proposed by Atkins in the Alternatives study carried out for the DfT (Atkins, 2011).

73Review of the Economic Case for HS2
Conclusion
The above analysis shows that there is no case for construction of HS2 on capacity grounds. Future foreseeable growth can be met by incremental cost-effective measures, delivering earlier benefits when needed and avoiding the ‘all or nothing’ approach which is inevitable with HS2.
Derivation of Optimised Alternative capacity
Pendolino capacity Per unit % of 2008 base
Present First Standard Total Standard Total
9 car 145 294 439
Lengthening project
35x11 car 145 444 589
21x9 car 145 294 439
Total 8120 21714 29834
Average per set 145 388 533
First class reconfiguration
35x11 car 99 519 618
21x9 car 99 369 468
Total 5544 25914 31458
Average per set 99 463 562
12 car sets (except Liverpool)
10x11 car 99 519 618
46x12 car 99 594 693
Total 5544 32514 38058
Average per set 99 581 680
Voyager capacity 40 222 262 Note 1
Daily capacity
2008 Base 59298 88544 Note 2
Current timetable (286 trains daily, 256 Pendolino, 30 Voyager)
Pendolino 256 trains 37120 75264 112384
Voyager 30 trains 1200 6660 7860
Total 38320 81924 120244 138 136
Committed lengthening project
Pendolino 256 trains 37120 99264 136384
Voyager 30 trains 1200 6660 7860
Total 38320 105924 144244 179 163
Annex 1: Derivation of Optimised Alternative Capacity

74Review of the Economic Case for HS2
Daily capacity
Pendolino capacity Per unit % of 2008 base
Present First Standard Total Standard Total
December 2013 additional services
Pendolino 276 trains 40020 107019 147039
Voyager 30 trains 1200 6660 7860
Total 41220 113679 154899 192 175 First class reconfiguration
Pendolino 276 trains 27324 127719 155043
Voyager 30 trains 1200 6660 7860
Total 28524 134379 162903 227 184 12 car sets (except Liverpool)
Pendolino 276 trains 27324 160248 187572
Voyager 30 trains 1200 6660 7860
Total 28524 166908 195432 281 221 Additional services following infrastructure upgrade
Pendolino 310 trains 30690 179988 210678
Voyager 30 trains 1200 6660 7860
Total 31890 186648 218538 315 247
Notes
1. First/standard split estimated - one car flexible. No lenghtening of Voyagers assumed, although this is quite feasible. 2. Total from HS2 Alternatives Study – Baseline Report page 21 (http://webarchive.nationalarchives.gov.uk/20110131042819/http://www.dft.gov.uk/pgr/rail/pi/highspeedrail/alternativestudy/pdf/baselinereport.pdf)Standard class figure derived from total using current Pendolino first/standard split.
Annex 1 cont.

75Review of the Economic Case for HS2
Comparison of Optimised Alternative with HS2 and RP2
[HS2 figures refer to HS2 route only, excluding residual classic services]
Actual HS2 RP2 Optimised alternative
Notes
2008 Base passenger numbers
50085 1
2008 Base load factor
0.57 2
2008 Base capacity
88544 3
Current timetable 120244 Derived from above analysis
Optimised Alternative - incremental interventions
Lengthening project 144244 Optimised Alternative totalsderived from above analysis
December 2013 timetable 154899
First class reconfiguration 162903
12 car operation 195432
Additional services 218538
2043 position
Forecast passenger numbers 136103 113041 113041 4,5 RP2 forecast used for optimised alternative
Total capacity 234660 221650 218538 6,7
% increase on 2008 Base 165 150 147
Load factor 0.58 0.51 0.52 8,9
Capital expenditure £16.75bn £3.76bn £2.06bn(Infrastructure only)
Notes 10, 11
Notes
1. Strategic Alternatives to the Proposed Y Network, page 8, figure 2.1 http://highspeedrail.dft.gov.uk/sites/highspeedrail.dft.gov.uk/files/hsr-strategic-alternative.pdf2. Strategic Alternatives to the Proposed Y Network, page 9, para 2.1.4.13. HS2 Alternatives Study – Baseline Report page 21 (http://webarchive.nationalarchives.gov.uk/20110131042819/http://www.dft.gov.uk/pgr/rail/pi/highspeedrail/alternativestudy/pdf/baselinereport.pdf)4. HS2 numbers: Economic Case for HS2 page 20 http://highspeedrail.dft.gov.uk/sites/highspeedrail.dft.gov.uk/files/hs2-economic-case.pdf5. RP2 number derived from capacity and forecast load factor6. HS2 number derived form forecast passenger numbers and load factor7. RP2 number: Strategic Alternatives to the Proposed Y Network, page 17, table 4.2: combined figure minus Chiltern base 8. HS2 from Economic Case for HS2 page 219. RP2 from Strategic Alternatives to the Proposed Y Network, page 17, table 4.210. HS2: Economic Case for HS2 page 37, table 711. RP2: Strategic Alternatives to the Proposed Y Network, page 41
Annex 1 cont.

76Review of the Economic Case for HS2
Fast
Lin
e E
veni
ng P
eak
cap
acity
from
Eus
ton
(4:3
0 p
.m. t
o 6:
29 p
.m.)
Sea
ts p
er t
rain
Tota
l sea
ts%
incr
ease
on
bas
e
Firs
tS
tand
ard
Tota
lFi
rst
Sta
ndar
dTo
tal
Firs
tS
tand
ard
Tota
l
All
fast
line
tra
ins
HS
2 E
valu
atio
n ‘B
ase’
(May
200
8 tim
etab
le)
18x9
car
Pen
dol
inos
145
294
439
2610
5292
7902
1x10
car
Voy
ager
8044
452
480
444
524
4x12
car
cla
ss 3
50*
7267
274
428
826
8829
76
2978
8424
1140
2
May
201
1 tim
etab
le
21x9
car
Pen
dol
inos
145
294
439
3045
6174
9219
2x10
car
Voy
ager
8044
452
416
088
810
48
4x12
car
cla
ss 3
50*
7267
274
428
826
8829
76
3493
9750
1324
317
.3%
15.7
%16
.1%
‘RP
2’
24x1
1 ca
r P
end
olin
os14
544
458
934
8010
656
1413
6
2x10
car
Voy
ager
8044
452
416
088
810
48
8x12
car
cla
ss 3
50*
7267
274
457
653
7659
52
4216
1692
021
136
41.6
%10
0.9%
85.4
%
‘Op
timis
ed A
ltern
ativ
e’
18x1
2 ca
r P
end
olin
os99
594
693
1782
1069
212
474
4x11
car
Pen
dol
inos
9951
961
839
620
7624
72
2x10
car
Voy
ager
8044
452
416
088
810
48
8x12
car
cla
ss 3
50*
7267
274
457
653
7659
52
2914
1903
221
946
-2.1
%12
5.9%
92.5
%
Ann
ex 2
: Ana
lysi
s o
f P
eak
Cap
acit
y
* M
ilton
Key
nes/
Nor
tham
pto
n fa
st c
omm
uter
ser
vice
s

77Review of the Economic Case for HS2
Ann
ex 2
co
nt.
Fast
Lin
e E
veni
ng P
eak
cap
acity
from
Eus
ton
(4:3
0 p
.m. t
o 6:
29 p
.m.)
Sea
ts p
er t
rain
Tota
l sea
ts%
incr
ease
on
bas
e
Firs
tS
tand
ard
Tota
lFi
rst
Sta
ndar
dTo
tal
Firs
tS
tand
ard
Tota
l
‘Inte
rCity
’ tra
ins
only
HS
2 E
valu
atio
n ‘B
ase’
(May
200
8 tim
etab
le)
18x9
car
Pen
dol
inos
145
294
439
2610
5292
7902
1x10
car
Voy
ager
8044
452
480
444
524
2690
5736
8426
May
201
1 tim
etab
le
21x9
car
Pen
dol
inos
145
294
439
3045
6174
9219
2x10
car
Voy
ager
8044
452
416
088
810
48
3205
7062
1026
719
.1%
23.1
%21
.8%
‘RP
2’
24x1
1 ca
r P
end
olin
os14
544
458
934
8010
656
1413
6
2x10
car
Voy
ager
8044
452
416
088
810
48
3640
1154
415
184
35.3
%10
1.3%
80.2
%
‘Op
timis
ed A
ltern
ativ
e’
18x1
2 ca
r P
end
olin
os99
594
693
1782
1069
212
474
4x11
car
Pen
dol
inos
9951
961
839
620
7624
72
2x10
car
Voy
ager
8044
452
416
088
810
48
2338
1365
615
994
-13.
1%13
8.1%
89.8
%

78Review of the Economic Case for HS2
Appendix 2Potential for videoconferencing as a substitute for business travel
Videoconferencing and the wider use of the Internet have been touted as an alternative to business travel for the past twenty years. However, it is difficult to see significant impacts so far on levels of business travel as a result of these technologies. In fact, it is quite possible that internet technologies have encouraged additional business travel as companies and entrepreneurs look further afield for customers, suppliers and contacts.
The main take-up of the equipment to date has therefore been in large international companies which can afford the costs and see significant savings in international air travel as a result. Indeed, the equipment is often marketed as an alternative to air travel. Technology companies, keen to be seen to practise what they preach to customers, have also been in the vanguard. The rate of take-up has been considerably higher in the United States than in Europe.
There are a number of reasons why use of videoconferencing has not become mainstream:
• High cost of equipment• Technical complexity of the equipment, so that it was not user friendly but
often required a dedicated technician to be on hand to support its operation• Lack of eye contact between participants, disjointed conversations and
general poor feel of the meeting• Limited number of companies with multiple international locations that could
obtain the network benefits of the technology• Difficulty of linking more than two locations in a single videoconference
However, those companies which have adopted the technology see significant benefits. The two main manufacturers of videoconferencing equipment, Cisco and Hewlett Packard, both moved quickly to take advantage of its potential. Cisco reduced its annual travel budget from $740 million to $240 million. Hewlett Packard reduced its travel budget by 30%. Other technology companies have also reported significant benefits. Microsoft reported an initial annual saving of $90 million. In the UK, BT reported savings of £135 million in travel costs in 2006/07, with almost a million face-to-face meetings replaced. Easynet achieved a 20% cost reduction in travel costs and achieved cost recovery on its investment in less than a year.
The use of videoconferencing is not restricted exclusively to technology companies. Multinationals such as Procter and Gamble and Deloitte have both adopted the technology and reported benefits. But a recent survey by Easynet reported that two thirds of European businesses have not considered videoconferencing, even though 87% could see the potential for saving money.

79Review of the Economic Case for HS2
Key concerns were the cost of the technology and the lack of personal touch in meetings. Moreover, some businesses that had adopted the technology were not using it to the full potential.
The scope for significantly greater market penetration is clear and there are a number of reasons to expect it to be achieved in the next decade. They include:
• the costs of using videoconferencing are falling steadily as both IT equipment and communications become progressively cheaper. The application of Moore’s law, whereby the number of transistors on a chip doubles every ten months to two years as the cost halves is having a significant impact on the cost of new installations;
• as increasing numbers of companies adopt the technology, the network benefits of becoming a user increase. This is supplemented by the growing numbers of service providers who offer videoconferencing facilities for short-term hire;
• improvements in ease of use of the equipment and in the ‘feel’ of videoconferences. More modern videoconferencing facilities give a better feeling of being in a normal meeting, such that the term video-presence is often used to describe them. There is far better eye contact with other users and participants can be based in multiple locations;
• pressure on companies to reduce their carbon footprint. Most companies which have adopted the technology emphasise the reduction in carbon emissions alongside financial savings;
• changing procedures in companies for approving travel. In some cases companies now review travel requests more searchingly to assess whether video- or audioconferencing can be used instead; and
• the continuing search for productivity gains and the needs of regular business travellers, who often prefer the new technology to the pressures of continuous travel.
The main application of videoconferencing at present is in the business market. However, its use is spreading into the leisure market. The recent acquisition by Microsoft of Skype is said to have been heavily influenced by Skype’s videoconferencing capability. Young people are now the fastest-growing group of Skype users and activities such as having a virtual drink with friends is becoming more common. In the longer term, this will have knock-on effects in the business market, since users who have become familiar with the technology while they are at school will have no difficulty adapting to its use in the world of business.

80Review of the Economic Case for HS2
Designed and printed by The Javelin Partnership Ltd Tel: 0118 907 3494
Produced on paper from a managed sustainable source, using pulp that is ECF, also FSC certified as containing 50% recycled waste. Printed using vegetable soya based inks.
The Royal Automobile Club Foundation for Motoring Limited is a charity which explores the economic, mobility, safety and environmental issues relating to roads and responsible road users. Independent and authoritative research, carried out for the public benefit, is central to the Foundation’s activities.
RAC Foundation 89–91 Pall Mall London SW1Y 5HS
Tel no: 020 7747 3445 www.racfoundation.org
Registered Charity No. 1002705 November 2011 © Copyright Royal Automobile Club Foundation for Motoring Limited