High Speed Two Phase 2b Strategic Outline Business Case · 2. The case for HS2 13 Our assessment of...
54
July 2017 High Speed Two Phase Two Economic Case Moving Britain Ahead
Transcript of High Speed Two Phase 2b Strategic Outline Business Case · 2. The case for HS2 13 Our assessment of...

July 2017
High Speed Two Phase Two
Economic Case
Moving Britain Ahead

The Department for Transport has actively considered the needs of blind and partially sighted people in accessing this document. The text will be made available in full on the Department’s website. The text may be freely downloaded and translated by individuals or organisations for conversion into other accessible formats. If you have other needs in this regard please contact the Department.
Department for Transport Great Minster House 33 Horseferry Road London SW1P 4DR Telephone 0300 330 3000 Website www.gov.uk/dft General enquiries: https://forms.dft.gov.uk
© Crown copyright 2017
Copyright in the typographical arrangement rests with the Crown.
You may re-use this information (not including logos or third-party material) free of charge in any format or medium, under the terms of the Open Government Licence. To view this licence, visit http://www.nationalarchives.gov.uk/doc/open-government-licence/version/3/ or write to the Information Policy Team, The National Archives, Kew, London TW9 4DU, or e-mail: [email protected]
Where we have identified any third-party copyright information you will need to obtain permission from the copyright holders concerned.

3
Contents
1. Our assessment of HS2 4
Purpose 4
Introduction and Scope 4
How we assess the case 5
The appraisal framework 5
2. The case for HS2 13
Our assessment of the HS2 economic case 13
Strategic goals of HS2 14
3. The case for Phase 2a 16
Our assessment of the Phase 2a economic case 16
4. Alternatives to Phase 2a 18
Introduction 18
Approach at OBC 18
Results 20
Conclusions 24
Robustness of results/key issues 25
5. The case for Phase 2b 26
Our assessment of the Phase 2b economic case 26
Comparison with the Meadowhall Route 27
Alternatives to Phase 2b 29
6. Robustness of the assessment 30
7. Value for money 33
How we assess value for money 33
Extending our appraisal 37
8. Alternative train service options 39
Annex A: Modelled train service specification 43
Annex B: Costs of alternatives to Phase 2a 48
Annex C: Long term benefits 54

4
1. Our assessment of HS2
Purpose
The Economic Case sets out the value for money of the High Speed Two (HS2) programme and procurement strategy. This includes consideration of a range of alternative options that deliver the same strategic objectives.
Recognising that each phase of the HS2 programme is at a different stage of its life cycle, this document sets out for:
• Phase 2a – The Economic Case at Outline Business Case (OBC) stage to support the Government’s decision to deposit the hybrid Bill in Parliament
• Phase 2b – An update to the Strategic Outline Business Case (SOBC) Economic Case1 (November 2016). This supports the Secretary of State for Transport's Phase 2b route decision and response to the Route Refinement Consultation2 (November 2016).
In line with the HM Treasury Green Book guidelines, this document forms part of a five part business case. The five cases are:
• Strategic Case
• Economic Case
• Financial Case
• Commercial Case
• Management Case
Introduction and Scope
HS2 is a new high speed rail network for the UK, connecting London with major cities in the Midlands and the north of England. It is a Y shaped network that will be delivered in several stages. Trains will also run beyond the Y network to serve places such as Liverpool, Preston, Newcastle and Scotland.
Phase One of HS2 will see a new high speed line constructed from Euston to north of Birmingham, where it will re-join the existing West Coast Main Line (WCML). New high speed trains will serve Birmingham city centre and an interchange station designed to serve the wider West Midlands. At Old Oak Common in West London a new interchange will be built connecting HS2 with Crossrail and the Great Western Main Line. Passenger services are planned to commence on the Phase One route in 2026.
1 https://www.gov.uk/government/publications/hs2-phase-2b-economic-case 2 https://www.gov.uk/government/consultations/hs2-crewe-to-manchester-west-midlands-to-leeds-route-refinement-consultation-2016

5
In November 2015 the Government announced its intention3 to accelerate the delivery of the section of Phase Two between the West Midlands and Crewe (Phase 2a). At the northern end it will connect with the WCML to the south of Crewe to allow HS2 services to join the WCML and call at Crewe station. Passenger services are planned to commence on the Phase 2a route in 2027 subject to parliamentary approval of the Phase 2a hybrid Bill.
In November 2016 the government confirmed the majority of its preferred route for Phase 2b of HS2, which will complete the full Y network. The southern end of the Western Leg connects to Phase 2a (south of Crewe) and goes onto Manchester with a connection back to the WCML south of Wigan. The Eastern Leg connects to the Phase One route and goes onto Leeds, with a connection back to the ECML at Church Fenton. Passenger services are planned to commence on the Phase 2b route in 2033 subject to parliamentary approval of the Phase 2b hybrid Bill.
How we assess the case
This Economic Case is intended to support investment decisions to proceed with Phase 2a and Phase 2b.
The Phase 2a investment decision is to proceed with seeking powers for the HS2 route to Crewe, so it can be fully operational by 2027. The Phase 2a case assumes Phase One of the scheme is in place and hypothetically, the remainder of Phase Two is not built. This is termed the “Phase 2a incremental case”.
To provide a complete assessment of the scheme’s value for money, we present the case for Phase 2a alongside a range of alternative options. All of these are compared to one common scenario that allows us to assess the incremental economic, social, environmental and public accounts impacts that each package of transport interventions may bring about.
The Phase 2b case assumes that Phase 2a of the scheme is in place and is termed the “Phase 2b incremental case”. Phase 2b has been compared against a range of alternatives analysed in previous publications.
This report draws on modelling and economic analysis undertaken by HS2 Ltd.4
The appraisal framework
Methodology
Our appraisal aims to capture all of the impacts – positive and negative – as well as the associated risks and uncertainty, so that the decision maker is provided with a full assessment of the pros and cons of different courses of action. Where possible, these impacts are expressed in units of money, and it is from these monetary valuations that the benefit cost ratio (BCR) – a measure of the return on the investment – is calculated.
Benefits
A wide range of benefits are quantified in monetary terms, ranging from direct benefits to transport users from travel time savings, reductions in crowding and improvements in reliability, to wider economic impacts (WEIs) and environmental impacts, such as
3 https://www.gov.uk/government/publications/hs2-phase-two-east-and-west-the-next-steps-to-crewe-and-beyond 4 HS2 Ltd 2017, HS2 Phase Two Economic Case Advice, https://www.gov.uk/hs2

6
noise and air quality. There are also non-monetised impacts where we make a qualitative assessment of impacts of HS2 on aspects such as heritage and townscape, to inform the value for money decision in Chapter 7.
The range of monetised and non-monetised impacts of HS2 follow WebTAG principles and are set out in Figure 1.
Initial BCR: robust, monetised impacts
Adjusted BCR: less robust, monetised impacts
Monetised impacts not included in the BCR
Non-monetised, qualitative impacts
Travel Time Savings Crowding Benefits Noise Carbon Impact Accidents Indirect Tax Revenue Reliability Air Quality
Wider Economic Impacts (WEIs) - Agglomeration - Labour Supply
Impacts - Imperfect
competition
Landscape
Townscape and Landscape Heritage Biodiversity Water Environment Severance Physical Activity Accessibility Journey Ambience Option Values
Figure 1 Monetised and non-monetised impacts of HS2
The PLANET Framework Model (PFM) is the tool used to assess changes in behaviour as a result of HS2. It is a complex model that provides a strategic view of the road, rail and air markets, drawing on detailed information on passenger travel from ticket sales and other data. PFM assesses the impact of HS2 on the behaviour of existing travellers who may now use a different mode, switch to HS2 or make a different trip. It also assesses the extent to which HS2 and the associated capacity released on the existing network attracts new travel demand. The outputs from PFM therefore form the basis of the benefits and revenue assessments.
WEIs are estimated using the Department for Transport’s (DfT) Wider Impacts in Transport Appraisal (WITA) tool. This aims to capture the benefits of knowledge sharing in agglomeration, as well as some benefits from higher employment and higher output by businesses.
There are other impacts which are not assessed as the techniques to do so need further development and in some cases there is insufficient information on their likely scale. These impacts largely constitute second order transformational effects, i.e. those impacts which are not a direct result of the transport investment – such as travel time savings. These can include:
• Higher foreign investment into the UK, as it is a more attractive investment location due to better transport
• Dynamic clustering, where businesses relocate to be closer together, forming clusters around well-connected places and benefiting from knowledge sharing5
• Workers moving to more productive jobs, in response to changes in transport costs, to areas that have higher productivity due to a variety of factors such as agglomeration and capital
5 Note that static clustering, which is the result of businesses effectively being closer together due to better transport links without actually moving, is already monetised in the appraisal.
7
• Dependent development, where property developers may react to the transport improvements from HS2 by upgrading housing stock, which could lead to regeneration
Benefits and costs are valued across the British rail network as a whole rather than solely focusing on HS2. For example, the analysis captures the benefits to those passengers who may not use HS2 services but benefit from services that could use some of the capacity HS2 releases on the existing network. The benefits as described above are combined with the net costs to Government to derive a BCR.
As with previous HS2 economic cases, we have not included a quantification of potential freight benefits that could arise from the spare capacity generated by HS2. Freight services are not included in PFM.
Costs
Our assessment of the costs incorporates the expected costs to Government of the HS2 scheme. This includes the capital costs of building the scheme and procuring rolling stock, and operating costs of running the railway once opened. It is from this that the revenue arising from additional rail passengers is deducted.
Capital cost estimates originate from HS2 Ltd, who undertake detailed cost estimation exercises and supplement this with an allowance to reflect the risks and uncertainties associated with those estimates. The estimation of capital costs and the level of optimism bias (OB) applied are set out in the Financial Case. These are in line with the 2015 Spending Review settlement, which sets out that Phase 2a will cost approximately £3.7bn and Phase 2b will cost approximately £24.8bn (both are inclusive of 40% OB for infrastructure)6. Also set out in the Financial Case is a budget transfer between Phase 2a and 2b following a decision to build a longer tunnel under Phase 2b that extends further south of Crewe. To reflect this, this Economic Case assumes that the cost of Phase 2a is £3.48bn and Phase 2b is £25.07bn.
For the purpose of appraisal, these costs are inflated with construction cost inflation for the first five years from the start of the appraisal and then kept constant in real terms thereafter. These costs are then discounted to present values and converted to market prices7.
To estimate operating costs we combine a series of assumptions on the operational characteristics of HS2 and the existing rail network with our knowledge of the cost of operating rail services.
Train service specification
The results presented in this Economic Case are modelled from one potential train service specification (TSS) that could be operated with HS2 in place. They are intended to give the Government sufficient confidence in the intentions and outputs of the project to proceed, but will continue to be refined and may change as the project develops and indeed as decisions are made on Crewe Hub.
The central case TSS used for modelling purposes is shown diagrammatically in Annex A.
Updating our appraisal framework
A number of updates have been made to improve our modelling and appraisal framework, ensuring we are using the most up-to-date information and are consistent
6 DfT 2017, High Speed Two Phase Two Financial Case, https://www.gov.uk/hs2 7 The market price adjustment reflects the way in which costs are perceived by consumers, which includes the indirect taxation. Further detail of this adjustment can be found in WebTAG unit A1.1 Cost-Benefit Analysis.

8
with the latest guidance in rail scheme appraisal. HS2 Ltd has produced a full report8 on the changes we have made to our analysis for this Economic Case. Since the 2016 economic case the full Y BCR has decreased from 2.7 to 2.3 and from 3.1 to 2.6 for Phase 2b (all with WEIs and based on the M18 alignment and Loop, connecting services back on to the high speed line north of Sheffield).
Over time, the full Y BCR has been relatively stable and consistently above 2 including WEIs, as show in Figure 2.
Figure 2 Full Y network BCRs over time
A step-through of changes in the Full Y BCR is presented in Figure 3. The starting point for this step-through is the full Y assuming the Meadowhall alignment.
Figure 3 Step-through of changes to the full Y BCR last published in 20169
8 HS2 Ltd July 2017, Summary of Key Changes to the Economic Case Since 2016, https://www.gov.uk/hs2 9 HS2 Ltd 2017, PFMv7.1 Step-Through Report, https://www.gov.uk/hs2
0
0.5
1
1.5
2
2.5
3
2012 2013 2015 2016 2017
Bene
fit-C
ost R
atio
(BCR
)
Comparison of full Y network central case BCRs
Without WEIs With WEIs
Value for Money
Category
High
Medium
Low
Poor
2.62.3
0 0.2 0
0.50.1
0.3
0.0
0.5
1.0
1.5
2.0
2.5
3.0
Nov 16(Meadowhall)
ModelUpdates
ConventionalRail Update
High-SpeedRail Update
ForecastDemandChange
EconomicAppraisalUpdate
BenefitsExtrapolation
July 17 (M18Loop)
Chan
ge in
Ben
efit-
Cost
Rat
io (B
CR)
Step through of changes in full Y network BCR
9
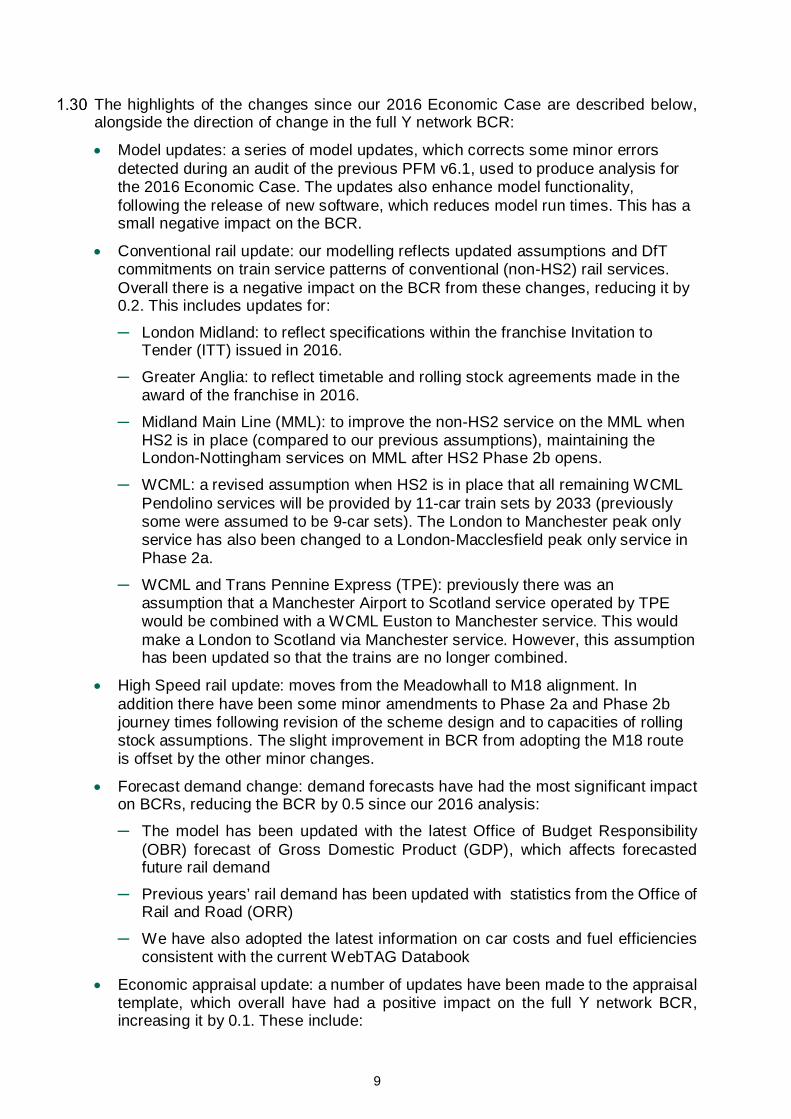
The highlights of the changes since our 2016 Economic Case are described below, alongside the direction of change in the full Y network BCR:
• Model updates: a series of model updates, which corrects some minor errors detected during an audit of the previous PFM v6.1, used to produce analysis for the 2016 Economic Case. The updates also enhance model functionality, following the release of new software, which reduces model run times. This has a small negative impact on the BCR.
• Conventional rail update: our modelling reflects updated assumptions and DfT commitments on train service patterns of conventional (non-HS2) rail services. Overall there is a negative impact on the BCR from these changes, reducing it by 0.2. This includes updates for:
─ London Midland: to reflect specifications within the franchise Invitation to Tender (ITT) issued in 2016.
─ Greater Anglia: to reflect timetable and rolling stock agreements made in the award of the franchise in 2016.
─ Midland Main Line (MML): to improve the non-HS2 service on the MML when HS2 is in place (compared to our previous assumptions), maintaining the London-Nottingham services on MML after HS2 Phase 2b opens.
─ WCML: a revised assumption when HS2 is in place that all remaining WCML Pendolino services will be provided by 11-car train sets by 2033 (previously some were assumed to be 9-car sets). The London to Manchester peak only service has also been changed to a London-Macclesfield peak only service in Phase 2a.
─ WCML and Trans Pennine Express (TPE): previously there was an assumption that a Manchester Airport to Scotland service operated by TPE would be combined with a WCML Euston to Manchester service. This would make a London to Scotland via Manchester service. However, this assumption has been updated so that the trains are no longer combined.
• High Speed rail update: moves from the Meadowhall to M18 alignment. In addition there have been some minor amendments to Phase 2a and Phase 2b journey times following revision of the scheme design and to capacities of rolling stock assumptions. The slight improvement in BCR from adopting the M18 route is offset by the other minor changes.
• Forecast demand change: demand forecasts have had the most significant impact on BCRs, reducing the BCR by 0.5 since our 2016 analysis:
─ The model has been updated with the latest Office of Budget Responsibility (OBR) forecast of Gross Domestic Product (GDP), which affects forecasted future rail demand
─ Previous years’ rail demand has been updated with statistics from the Office of Rail and Road (ORR)
─ We have also adopted the latest information on car costs and fuel efficiencies consistent with the current WebTAG Databook
• Economic appraisal update: a number of updates have been made to the appraisal template, which overall have had a positive impact on the full Y network BCR, increasing it by 0.1. These include:

10
─ Latest WebTAG databook, which has updated GDP deflator and annual GDP growth forecasts reflecting updates by OBR. In particular, these are used to forecast growth in values of time, from which benefits are calculated. The databook also includes revised fuel cost parameters and fuel costs, revised wait and walk time weightings, population growth rates and vehicle fleet proportions.
─ Other appraisal updates include changing the discount year from 2016 to 2017 and the final forecast year to 2037, in line with WebTAG Rail Appraisal guidance.
─ Costs have been updated including removal of sunk costs prior to the appraisal year and updates to operating costs in line with appraisal changes, the most recent WebTAG annual parameters, and latest train km assumptions. The resulting increase in operating costs can be primarily explained by the updated annual parameters which show higher real terms growth.
• Benefits extrapolation: following the publication of a forthcoming change to DfT’s rail appraisal guidance, this appraisal replaces the previous ‘demand cap’ with the assumption that demand increases in line with future long-term population projections after 2037. This has a positive impact on the BCR of around 0.3 and is discussed further in Annex C.
Although BCRs (including the full Y network BCR) have declined since 2016 for the reasons given above, the incremental Phase 2a BCR was last assessed and published in 2015. The net change in the Phase 2a BCR compared to the 2015 SOBC has been an increase from 1.3 to 1.9. Highlights of these changes from 2015 on the Phase 2a BCR include:
• An update in the TSS, which now routes all three London to Manchester services via Crewe. Previously, one of these three services was routed via Stoke-on-Trent. This leads to some additional journey time benefits
• Since the 2015 Phase 2a SOBC, there has been an update to the price base. Phase 2a results are now presented in 2015 prices
• In 2016, the demand model was updated to reflect observed growth in rail demand as recorded by the ORR. This led to a significant increase in the demand for travel in the base year (2014/15)
• Updates to Values of Time in 2016 across different passenger groups had a positive impact on the BCR
• The cost of Phase 2a has decreased compared with 2015. This is because the extension of the south Crewe tunnel in Phase 2b has resulted in a transfer of £240m of cost and budget from Phase 2a to Phase 2b, increasing the Phase 2a BCR
Risk and uncertainty Our appraisal of HS2 requires a number of assumptions to be made about factors that will influence the assessment of benefits, revenues and costs. Where we have a statistical understanding of the probabilistic distribution of factors, their ranges have been used to produce ‘risk analysis’ of the HS2 scheme: a spread of BCR values and their likelihood of occurring. The factors considered in the risk analysis include

11
economic growth, values of travel time savings, construction costs for Phase One and rolling stock costs.10
For influential factors, we present a number of scenarios that vary the assumptions used in estimating benefits and costs, to explore the potential impact on the value for money case for Phase 2a, Phase 2b and the full Y network.
Rail demand forecast
Over the last couple of decade’s long distance rail demand (number of passenger journeys) has grown at an annual average rate of around 4.5%11. Our background forecast for long distance rail demand in a world without HS2 is relatively conservative in comparison at 1.9% per annum to 2037.
Figure 4 shows historic passenger numbers on long distance rail franchised operators from 1994 to 2016. It also shows a forecast of long distance rail demand (in terms of passenger numbers boarding all long distance rail services) from the PFM tool used in the appraisal of HS2. PFM produces specific demand forecasts for the network without HS2, and for each phase of the HS2 scheme, for two specific future years, namely 2026 and 2037. These forecasts are used to produce the data in Figure 4 by interpolating between data points, as follows:
• The model is used to produce a forecast of long distance rail demand in a world without HS2 (represented by the green dashed line) in Figure 4 to 2037.
• The 2026 forecast with HS2 (represented by the orange dashed line) represents passenger demand after the introduction of Phase 1. In our appraisal we assume demand grows more slowly in a ramp up period in the early years of operation, although this ramp up is not represented in Figure 4.
• The forecast from 2027 to 2032 represents passenger demand after the opening of Phase 2a.
• The forecast from 2033 to 2037 represents long distance rail demand after Phase 2b opens and all planned HS2 train services are in operation. As with the Phase 1 forecast, we might expect a slower ramp up period in the first few years of operation but this ramp up is not represented in Figure 4.
• 2037 is the final modelled year in terms of demand forecasts and modelling the impacts of HS2. After this point demand is assumed to grow in line with national ONS population projections (between 0.3% and 0.4% per year). This population based extrapolation replaces our previous ‘demand cap’ and is explained further in Annex C.
The capacity and increased connectivity HS2 provides could enable a significant increase in long distance rail use. However, the demand forecasts used in our economic appraisal could be seen as relatively prudent in the sense they are well below the historic growth rate in long distance rail demand observed over the last 20 years.
10 HS2 Ltd 2017, Risk analysis for the HS2 economic case – Technical documentation, https://www.gov.uk/hs2 11 Office of Rail and Road (ORR) franchised long distance rail operators passenger journeys numbers, 1994 to 2016

12
Figure 4 Long distance rail demand forecast12
12 It should be noted that the forecasts relate to estimates of boarding on long distance services, and not estimates of ‘end to end’ journeys. If the latter were considered, the relative increase in demand between the HS2 scenario and the base year would be reduced, but would still represent a significant uplift from the ‘without HS2’ forecast.
0
50
100
150
200
250
300
1994
1996
1998
2000
2002
2004
2006
2008
2010
2012
2014
2016
2018
2020
2022
2024
2026
2028
2030
2032
2034
2036
2038
2040
2042
Inde
xed
grow
th (2
014=
100)
Year
Indexed actual and forecasted long distance rail growth - 1994 to 2043 (2014 = 100)
Franchised long distance rail passenger journeys (ORR Statistics)
Extrapolation of demand using the growth rate since original HS2 base year -2010 (3.3%)Forecast of long distance rail passenger boarders without HS2 (PFM)
Forecast of long distance rail passenger boarders with HS2 (PFM)

13
2. The case for HS2
Our assessment of the HS2 economic case
In Figure 5 below, we provide the benefits, revenues and costs of HS2. The full network is expected to generate significant levels of benefits totalling £92.2bn (present value (PV) 2015 prices).
PV, £bn2015 prices Full Y network
1 Net transport benefits 74.6
2 Wider Economic Impacts (WEIs) 17.6
3 Net benefits including WEIs = (1) + (2) 92.2
4 Capital costs 55.8
5 Operating costs 27.6
6 Total costs = (4) + (5) 83.4
7 Revenues 43.6
8 Net costs to Government = (6) - (7) 39.8
9 BCR without WEIs (ratio) = (1)/(8) 1.9
10 BCR with WEIs (ratio) = (3)/(8) 2.3 Figure 5 Benefit Cost Ratio (BCR) components of full Y Network
The case for HS2 was last presented as part of the Phase 2b SOBC in November 2016.
A key driver of the benefits shown above are the improved journey times that a fully high speed network aims to deliver, as well as improved reliability.
The WEIs for HS2 are estimated at around £17.6bn. The breakdown of WEIs shown in Figure 6 below indicates that the majority of benefits can be attributed to agglomeration (around 60%).
PV, £m 2015 prices Full Y network
Agglomeration 11.0
Imperfect competition 6.1
Labour market impact 0.5
Total WEIs 17.6 Figure 6 Wider economic impacts of full Y (may not add due to rounding)
The full Y network is shown to have a central BCR of 2.3 with WEIs. This has fallen since the 2016 Economic Case estimate of 2.7 including WEIs. As shown in Figure 3,

14
the key driver is revisions to forecasts of annual GDP growth, which underlies demand for long distance rail services. A number of model updates outlined in Chapter 1 also contribute towards its revision.
As explained in Chapter 1 we also examine the robustness of these BCR results by undertaking risk analysis: the likelihood of the BCR including WEIs for HS2 taking any particular value due to variation in a small number of factors for which we have probabilistic distributions. The factors considered in the risk analysis include economic growth, values of travel time savings and some costs.
The risk analysis for the full Y network is shown in Figure 7 below.
Figure 7 Risk analysis of full Y network
The graph indicates that there is a 68 per cent chance of HS2 having a BCR above 2 and a 92 per cent chance of a BCR above 1.5.
Strategic goals of HS2
As set out in the Strategic Case for Phase Two, the strategic objectives of HS2 are to improve capacity and connectivity, and therefore support economic growth. Phase 2a has the potential to contribute to unlocking growth and regeneration across the UK and this increases when Phase 2b completes the HS2 Y network.
The economic benefits of providing additional capacity are assessed through the services we assume to run in the future, on both HS2 and the conventional network through released capacity.
We assess the economic benefits of connectivity by looking at the value of improving journey times – not just to London, but also connecting northern cities to the Midlands.
HS2 Phase 2a and Phase 2b have the potential to generate significant benefits for the real economy through bringing firms and people closer together to:
• Share knowledge and best-practice (‘agglomeration benefits’)
• Reduce transport and production costs (‘business user benefits‘) and increase output (in markets with imperfect competition)
• Improve access to jobs and encourage labour market participation
In line with the approach taken within the HS2 business case in November 2016, we present an estimate of how the welfare benefits of HS2 translate into impacts on economic output.
Y
15
DfT guidance13 provides a simple equation which can be applied to the business user benefits and WEIs in the Economic Case to estimate the impact of HS2 on the UK economy.
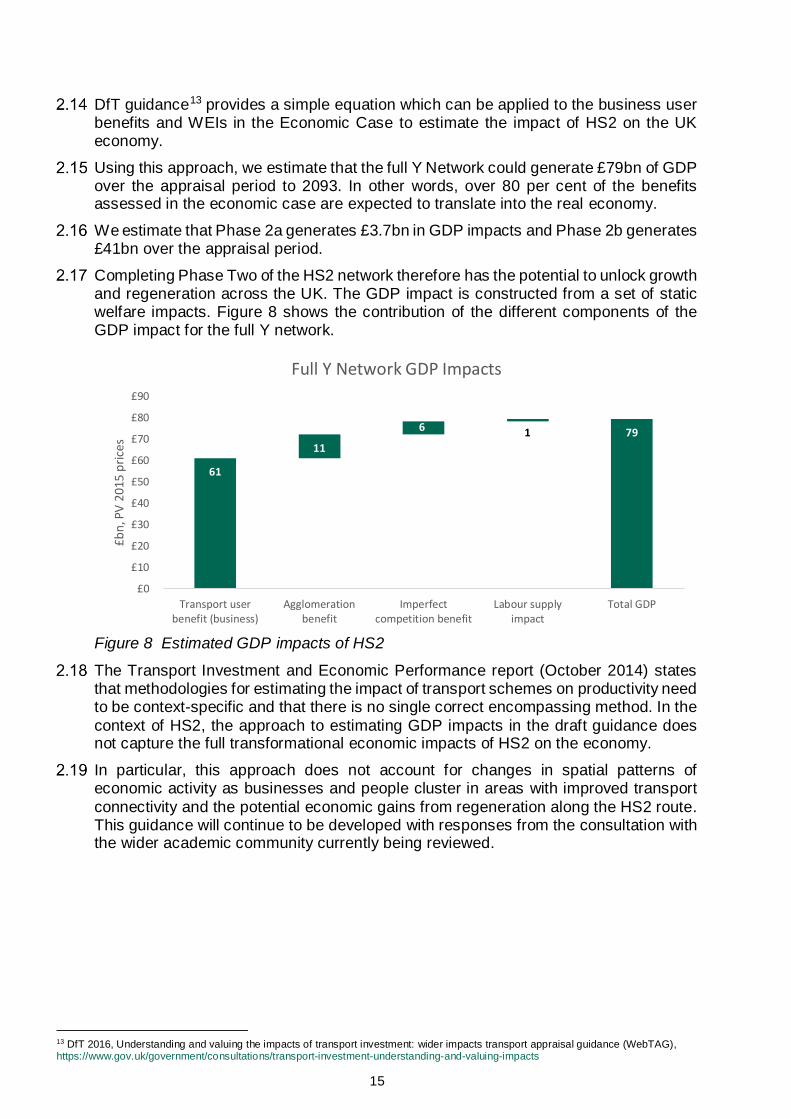
Using this approach, we estimate that the full Y Network could generate £79bn of GDP over the appraisal period to 2093. In other words, over 80 per cent of the benefits assessed in the economic case are expected to translate into the real economy.
We estimate that Phase 2a generates £3.7bn in GDP impacts and Phase 2b generates £41bn over the appraisal period.
Completing Phase Two of the HS2 network therefore has the potential to unlock growth and regeneration across the UK. The GDP impact is constructed from a set of static welfare impacts. Figure 8 shows the contribution of the different components of the GDP impact for the full Y network.
Figure 8 Estimated GDP impacts of HS2
The Transport Investment and Economic Performance report (October 2014) states that methodologies for estimating the impact of transport schemes on productivity need to be context-specific and that there is no single correct encompassing method. In the context of HS2, the approach to estimating GDP impacts in the draft guidance does not capture the full transformational economic impacts of HS2 on the economy.
In particular, this approach does not account for changes in spatial patterns of economic activity as businesses and people cluster in areas with improved transport connectivity and the potential economic gains from regeneration along the HS2 route. This guidance will continue to be developed with responses from the consultation with the wider academic community currently being reviewed.
13 DfT 2016, Understanding and valuing the impacts of transport investment: wider impacts transport appraisal guidance (WebTAG), https://www.gov.uk/government/consultations/transport-investment-understanding-and-valuing-impacts
61
11
6 1 79
£0
£10
£20
£30
£40
£50
£60
£70
£80
£90
Transport userbenefit (business)
Agglomerationbenefit
Imperfectcompetition benefit
Labour supplyimpact
Total GDP
£bn,
PV
2015
pric
es
Full Y Network GDP Impacts

16
3. The case for Phase 2a
Our assessment of the Phase 2a economic case
In Figure 9 below, we provide the benefits, revenues and costs of the Phase 2a increment. The Phase 2a increment assumes that Phase One of HS2 is built and the rest of the network is not built. Phase 2a is expected to generate significant levels of benefits totalling £3.9bn (present value (PV) 2015 prices).
PV, £bn 2015 prices Phase 2a increment
1 Net transport benefits 3.2
2 Wider Economic Impacts (WEIs) 0.7
3 Net benefits including WEIs = (1) + (2) 3.9
4 Capital costs 4.0
5 Operating costs 0.2
6 Total costs = (4) + (5) 4.2
7 Revenues 2.1
8 Net costs to Government = (6) – (7) 2.0
9 BCR without WEIs (ratio) = (1)/(8) 1.6
10 BCR with WEIs (ratio) = (3)/(8) 1.9 Figure 9 Benefit-Cost Ratio (BCR) components of Phase 2a
The appraisal of Phase 2a assumes that demand for rail travel no longer grows 20 years after the appraisal year (in 2037). While this can be perceived as a conservative assumption, we have on this occasion kept the demand cap in place. Further detail on our rationale can be found in Annex C.
Since the 2015 Economic Case, when Phase 2a analysis was published to support the SOBC, the capital costs associated to this phase have been further developed and refined. They are consistent with Government’s recent publication to adopt several route refinements that were consulted on in 2016.
Of the benefits of Phase 2a shown above, a key driver is the improvement in journey times, which have improved further since November 2015. The remaining benefits are attributed to other impacts including reliability and wider economic benefits.
The WEIs of Phase 2a are estimated at around £0.7bn (PV, 2015 price). The breakdown of WEIs shown in Figure 10 below indicates that agglomeration benefits account for just over half of the WEIs for Phase 2a.

17
PV, £bn 2015 prices Phase 2a increment
Agglomeration 0.4
Imperfect competition 0.3
Labour market impact 0.0
Total WEIs 0.7 Figure 10 WEIs of Phase 2a (does not add due to rounding)
The Phase 2a increment is shown to have a central BCR of 1.9 with WEIs. This has increased from the 2015 Economic Case estimate of 1.3 including WEIs. There are several drivers of this change. These include changes in the assumed TSS, which now routes all trains to Manchester through Crewe, where previously one train per hour was routed via Stoke-on-Trent. It is also the result of various model updates outlined in Chapter 1.
The risk analysis for the Phase 2a increment is shown in Figure 11 below.
Figure 11 Risk analysis of Phase 2a
Figure 11 indicates that there is an 85 per cent chance of Phase 2a having a BCR above 1.5, and a 38 per cent chance of Phase 2a having a BCR above 2.
The above analysis all assumes, hypothetically, that Phase 2b is not built. We presented in the 2015 Economic Case that if Phase 2a is viewed as an acceleration of infrastructure from 2033 to 2027 then this represents very high value for money.

18
4. Alternatives to Phase 2a
Introduction
The DfT and HS2 Ltd have previously considered a number of alternatives to a fully high speed Phase 2a scheme. This work showed that in terms of the full Y network, the Phase 2a design is the best way to meet the strategic objectives of HS2.
Scope of rail alternatives
This chapter briefly describes the alternative options considered, as well as outlining the costs and benefits of each. It should be read in conjunction with Chapter 6 of the Phase Two Strategic Case which assesses in more detail how well the alternatives meet the objectives of HS2, which are:
• Providing sufficient capacity to meet long term demand and to improve resilience and reliability across the network
• Improving connectivity by delivering better journey times and making travel easier
• To be a catalyst for sustained and balanced economic growth across the UK It is required that any solution should:
• Minimise disruption to the existing network
• Use proven technology that we know can deliver the required results
• Be affordable and represent good value to the taxpayer
• Minimise impacts on local communities and the environment
Whichever option is chosen also needs to support the delivery of the rest of Phase Two. As a result, the preferred option will also need to meet the following specific objectives of:
• Improving connectivity and journey times for cities north of Birmingham
• Delivering benefits to northern cities sooner than previously envisaged for Phase Two
• Enabling the efficient delivery of the rest of Phase Two
• Providing greater capacity and connectivity between West Midlands and Crewe
Approach at OBC
The 2015 Economic Case described the work carried out by the DfT’s technical advisers, Atkins. At that stage nine options were developed, of which three were taken forward for detail consideration, fully appraised and presented alongside the preferred Phase 2a option.

19
Since then, no significant scope changes have been made to the preferred Phase 2a design that would require a further set of alternatives to be considered. However, for the purposes of this OBC, we have undertaken an update of the alternative options identified at SOBC.
Despite the alternatives being at an earlier stage of development than the design of Phase 2a they have been assessed using consistent methods and assumptions wherever appropriate.
The methodology to derive costs is set out in Annex B. This also provides a step-by-step breakdown of how the costs of the alternatives have changed from their previous assessment in 2015.
The benefits and revenues of the alternative options have been updated using the same model as the preferred Phase 2a design to ensure consistency and comparable assessment.
Shortlisted alternatives
The three options which were considered in detail are as follows:
• Low Cost: this option is known as the Colwich cut-off and Stafford bypass, which was previously examined by DfT as part of the West Coast route modernisation programme which concluded in 2009. This involves a new 140mph (225kph) capable train line for 4.2 miles (6.8km) which joins onto the existing line at Stone via a grade separated junction. This section of the Stone line would be upgraded to allow trains to operate at 140mph (225kph). This would subsequently connect onto 6.7 miles (10.8km) of new 140mph (225kph) alignment which would finally connect into the WCML north of Norton Bridge. This option requires three flat junctions and one grade separated junction with the WCML
• Medium Cost: this involves around one-third (9.2 miles or 15.2km) of the Phase 2a alignment from Streethay Junction to Great Haywood. This would then connect to a 3 mile (4.8km) high speed ‘spur’ to the Stone line. The Stone line would be upgraded to 140mph (225kph) for 4 miles (6.5km) with a new 6.7 mile (10.8km) long 140mph (225kph) alignment to the WCML near Norton Bridge. This option requires construction of three flat junctions
• High Cost: this involves around two-thirds (26.4 miles or 42.5km) of the Phase 2a alignment from Streethay Junction joining the WCML 11.4 miles (18.3km) south of Crewe at a junction onto the WCML. At this point, HS2 trains which are capable of operating on the existing network would then run along the WCML for 11.4 miles (18.3km) to Crewe
• Further technical detail on these three options can be found in a report published by DfT’s technical advisors, Atkins14.
Figure 12 summarises the journey time reduction of these options when compared with Phase One of HS2. These journey time savings are all lower than the saving expected from the Phase 2a proposal.
14 Atkins 2015, Rail Alternatives to HS2 Phase 2a, https://www.gov.uk/government/publications/hs2-rail-alternatives-to-phase-2a

20
Option Journey time improvement
Phase 2a 13 minutes15
High 10.5 minutes
Medium 7.5 minutes
Low 5.5 minutes
Figure 12 Journey time savings assumed for appraisal of Phase 2a and alternatives
The assessment framework
Each alternative option has been assessed against two network scenarios that are exactly analogous to how Phase 2a has been assessed (all consistent with the 2a central case):
• The full Y network incorporating the alternative option. In this scenario, the alternative option opens in 2027 between the end of Phase One and Crewe, with the rest of the Y network north of Crewe then opening in 2033. Under this scenario the alternative option forms part of the long term Y network
• The alternative option as an increment to Phase One. Under this scenario the alternative option is examined as an increment to Phase One but not part of the full Y network. For appraisal purposes this assumes that the alternative option opens in 2027
The analytical approach, assumptions and methodology for assessing the alternative options has been kept as consistent as possible with that adopted by HS2 Ltd for the assessment of Phase 2a.
Results
Benefits Forecast benefits are a function of the connectivity improvements. As the alternative options all deliver lower connectivity improvements than Phase 2a, this means that the magnitude of benefits for each option is also lower.
Figure 13 sets out the benefits of the full Y network with the alternatives between Birmingham and Crewe, assuming that the alternatives become part of the long term Y network and the remainder of Phase Two is delivered by 2033. Net transport benefits for the full Y including the alternative options are lower than under Phase 2a - by £0.8bn for the high cost option, £2.3bn for the medium cost option and £3.3bn for the low cost option (all including WEIs).
15 For purposes of modelling and appraisal, a 12 minute journey time saving has been conservatively assumed for Phase 2a. Where there is a range in the journey time to/from London, the Economic Case by convention takes a conservative approach and adopts the slowest of these times. The Strategic Case quotes the northbound journey time saving (13 minutes).

21
PV, £bn 2015 prices
Full Y incorporating Phase 2a
Full Y incorporating the High Cost Option
Full Y incorporating the Medium Cost Option
Full Y incorporating the Low Cost Option
Net Transport Benefits (PVB)
74.6 73.9 72.6 71.8
WEIs 17.6 17.5 17.2 17.0
Net Benefits including WEIs
92.2 91.4 89.8 88.8
Figure 13 Benefits of the full Y network with the rail alternatives between Birmingham and Crewe
Figure 14 sets out the incremental benefits of each of the alternative options relative to a baseline where Phase One is built and in the hypothetical scenario that the remainder of Phase Two is not built. The High Cost option has £0.5bn less benefits than Phase 2a, the Medium Cost option has £1.3bn less and the Low Cost option has £1.9bn less (all including WEIs).
PV, £bn 2015 prices
Incremental Phase 2a
Incremental High Cost Option
Incremental Medium Cost Option
Incremental Low Cost Option
Net Transport Benefits (PVB)
3.2 2.9 2.1 1.6
WEIs 0.7 0.6 0.4 0.3
Net Benefits including WEIs
3.9 3.5 2.6 2.0
Figure 14 Benefits of rail alternative options between Birmingham and Crewe (does not add due to rounding)
The decrease in benefits as we move from Phase 2a to the alternative options is lower under the incremental appraisal than when assessed as part of the full Y network for the following reasons:
• In the assumed central case TSS, six high speed trains per hour use Phase 2a when it opens while ten operate on the western leg under the full Y network. The number of services thus impacted by longer journey times in the alternative scenarios is much less under the incremental assessment than under the full ''Y'' assessment
• The number of passengers travelling on Phase 2a is much lower than when the full Y network opens. This is a result of the lower service level and longer journey times to destinations such as Manchester and Scotland in the standalone scenario. The impact of having longer journey times on these alternatives therefore affects fewer people in the incremental scenario

22
Costs to Government
As with Phase 2a, each of the alternatives will generate both capital costs and costs from operating and managing the new railway.
Capital costs are calculated using a consistent methodology to Phase 2a, as far as possible using central case assumptions.
The construction costs of the alternative options have been updated with more detail and depart from the methodology used by Atkins in its assessment in 2015. Further explanation of how the capital costs have been derived is set out in Annex B, which also provides a comparison to the methodology used previously by Atkins.
Operating costs are calculated using a consistent methodology to Phase 2a and are offset against savings from running a reconfigured train service on the conventional network.
In estimating the net cost to Government of a transport scheme, the capital and operating costs need to be offset by the additional revenues generated by the scheme. Revenues for each of the alternative options have been calculated using a consistent methodology to HS2. Figure 15 and Figure 16 summarise the capital and operating costs, revenues generated and subsequently the net cost to Government.
PV, £bn 2015 prices
Full Y incorporating
Phase 2a
Full Y incorporating the High Cost
Option
Full Y incorporating
the Medium Cost Option
Full Y incorporating the Low Cost
Option
Capital costs 55.8 55.4 55.1 54.5
Operational costs 27.6 27.6 27.8 27.8
Total costs 83.4 83.1 82.9 82.3
Revenues 43.6 43.1 42.3 41.7
Net Costs to Government (PVC)
39.8 39.9 40.6 40.5
Figure 15 Costs of rail alternative option, full Y network (does not add due to rounding)

23
PV, £bn 2015 prices
Incremental Phase 2a
Incremental High Cost
Option
Incremental Medium Cost
Option
Incremental Low Cost Option
Capital costs 4.0 3.4 3.0 2.4
Operational costs 0.2 0.3 0.4 0.4
Total costs 4.2 3.6 3.4 2.8
Revenues 2.1 1.9 1.4 1.1
Net Costs to Government (PVC)
2.1 1.8 2.0 1.8
Figure 16 Costs of rail alternative options, incremental case
Since their assessment in November 2015, the difference in the costs of the alternatives compared to Phase 2a has narrowed. This is largely attributed to the following reasons:
• The proposed tunnel under Crewe has now been extended south, so that the portal is south of the A500. This reduces the scope of Phase 2a and its associated capital cost
• We have used HS2 Ltd’s cost models to assess the operational costs associated with the alternative options. The costs of operating the alternatives are slightly higher compared with Phase 2a. This is driven by greater on-train staff requirements, resulting from the longer journey times and the assumption that staff are paid by the hour.
Further explanation of the change in costs is detailed in Annex B.
Benefit Cost Ratios (BCRs)
When assessed as part of the full Y network, all of the alternative options deliver very similar BCRs to Phase 2a. On an incremental basis, the High Cost option provides higher value for money relative to all the options assessed, but only slightly compared to Phase 2a (to 2 decimal places). The results of the assessment can be found in Figure 17 and Figure 18.

24
Full Y incorporating
Phase 2a
Full Y incorporating the High Cost
Option
Full Y incorporating
the Medium Cost Option
Full Y incorporating the Low Cost
Option
BCR without WEIs
1.9 1.9 1.8 1.8
BCR with WEIs 2.3 2.3 2.2 2.2
Figure 17 Central case BCRs for rail alternative options, full Y network
Incremental Phase 2a
Incremental High Cost
Option
Incremental Medium Cost
Option
Incremental Low Cost Option
BCR without WEIs
1.6 1.6 1.1 0.9
BCR with WEIs 1.9 2.0 1.3 1.1
Figure 18 Central case BCRs for rail alternative options, incremental case
Conclusions
The Government has considered strategic alternatives to Phase One, Two and the full Y network. We have previously considered that only a dedicated high speed network could deliver the step change in capacity and connectivity that the UK needs.
The Government is committed to a fully integrated high speed network. None of the alternatives allow this vision to be realised as they would require some reliance on the existing WCML to run services.
To ensure we get best value for money for the taxpayer, we have looked at alternative rail investments which could relieve the capacity bottlenecks between West Midlands and Crewe. On a standalone basis, were we not building the full Y HS2 network, only the High Cost option could provide a marginally better value for money option compared to Phase 2a to alleviate existing capacity bottlenecks on the WCML.
However, Phase 2a is an integrated part of the HS2 network, so each alternative should be considered in the context of the full Y network. When assessed as part of the full Y network (assumed completed in 2033), the alternatives deliver lower benefits than Phase 2a and also a higher cost to Government (in PV terms) (see Figure 17).
The Government believes that Phase 2a offers the right solution as none of the alternative options are consistent with our vision for a dedicated high speed network from London to Birmingham, Manchester, Leeds and beyond.
As set out in the Phase Two Strategic Case, the alternative options also do not meet the DfT's objectives in the same way as Phase 2a, namely that they:
• Do not provide the same level of connectivity benefits for the major cities of the Midlands and the North due to lower journey time improvements

25
• Do not provide as much additional or released capacity to meet the long term needs for the north-south railway as Phase 2a
• Offer a less robust solution to the problem of resilience and performance, particularly on the WCML which experiences relatively high levels of unreliability
• Could have a greater impact on services on existing lines as construction work is carried out (Medium and Low cost options only)
Robustness of results/key issues
As set out above, we have examined the impact of each option using a consistent methodology to that used for Phase 2a. This means that the results are estimated with a similar level of robustness and subject to the same risks and limitations as the central case results for Phase 2a (see Chapter 2). While we have thoroughly examined the costs and benefits of alternative ways of meeting our strategic objectives, this analysis has not been tested to the same level of detail as the 2a option.

26
5. The case for Phase 2b
Our assessment of the Phase 2b economic case
Figure 19 below shows the benefits, revenues and costs of the Phase 2b incremental scheme. Completing the full Y network generates benefits of £48.9bn (present value (PV) 2015 prices).
PV, £bn 2015 prices Phase 2b increment
1 Net transport benefits 39.0
2 Wider Economic Impacts (WEIs) 10.0
3 Net benefits including WEIs = (1) + (2) 48.9
4 Capital costs 24.3
5 Operating costs 17.9
6 Total costs = (4) + (5) 42.1
7 Revenues 23.5
8 Net costs to Government = (6) - (7) 18.6
9 BCR without WEIs (ratio) = (1)/(8) 2.1
10 BCR with WEIs (ratio) = (3)/(8) 2.6 Figure 19 Benefit Cost Ratio (BCR) components of Phase 2b
The capital cost shown for Phase 2b contains both rolling stock capital costs and the PV discounted infrastructure capital cost from the 2015 Spending Review funding allocation with the Crewe tunnel transfer, shown in the Phase Two Financial Case. As set out in Chapter 1, 40 per cent optimism bias (OB) has been applied to construction costs.
Our assessment of Phase 2b’s benefits and revenues reflect a change in appraisal assumption whereby benefits and revenues now grow in line with population from the final modelled year in 2037 to the end of the appraisal period. This was presented as a scenario in the 2016 Economic Case to support the Phase 2b SOBC. This methodology is discussed further in Annex C.
A key driver in the change in the BCR from the 2016 Economic Case are lower demand forecasts, which rely on the latest forecasts of Gross Domestic Product (GDP) by the Office for Budget Responsibility (OBR).
The WEIs of Phase 2b are estimated at around £10bn. The breakdown of WEIs shown in Figure 20 indicates that agglomeration benefits account for just over half of the WEIs for Phase 2b.
27
PV, £bn 2015 prices Phase 2b increment
Agglomeration 6.6
Imperfect competition 3.1
Labour market impact 0.3
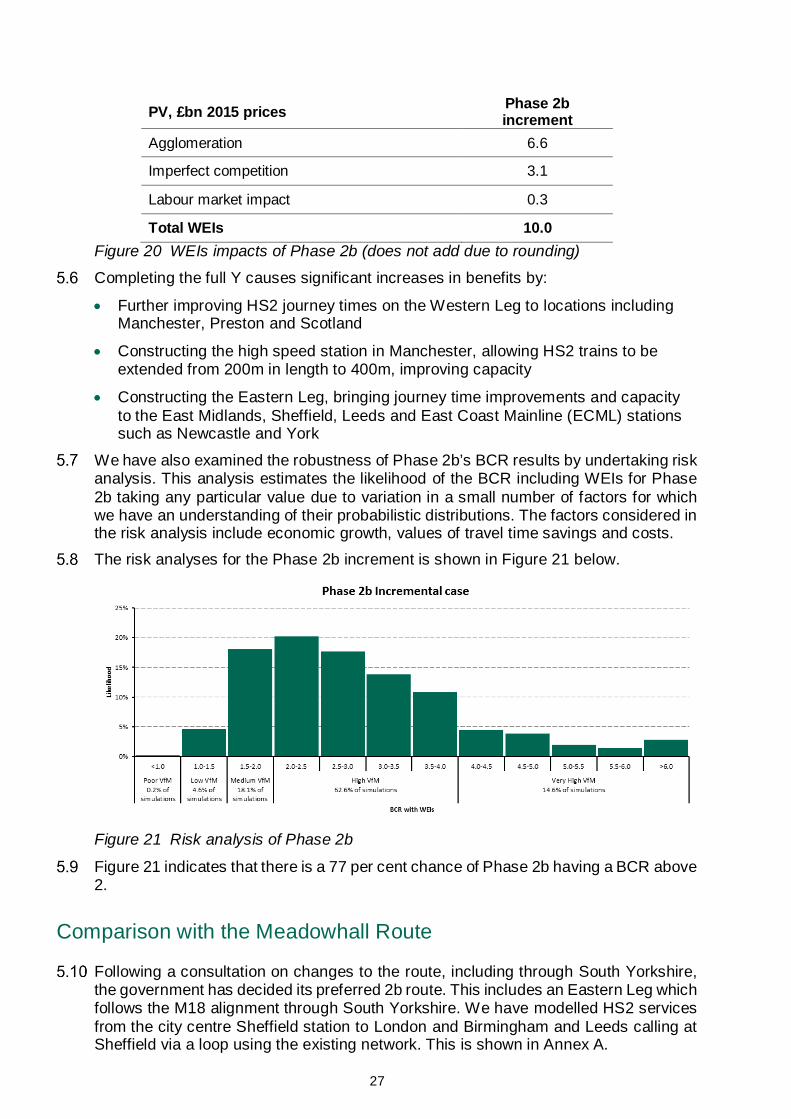
Total WEIs 10.0 Figure 20 WEIs impacts of Phase 2b (does not add due to rounding)
Completing the full Y causes significant increases in benefits by:
• Further improving HS2 journey times on the Western Leg to locations including Manchester, Preston and Scotland
• Constructing the high speed station in Manchester, allowing HS2 trains to be extended from 200m in length to 400m, improving capacity
• Constructing the Eastern Leg, bringing journey time improvements and capacity to the East Midlands, Sheffield, Leeds and East Coast Mainline (ECML) stations such as Newcastle and York
We have also examined the robustness of Phase 2b’s BCR results by undertaking risk analysis. This analysis estimates the likelihood of the BCR including WEIs for Phase 2b taking any particular value due to variation in a small number of factors for which we have an understanding of their probabilistic distributions. The factors considered in the risk analysis include economic growth, values of travel time savings and costs.
The risk analyses for the Phase 2b increment is shown in Figure 21 below.
Figure 21 Risk analysis of Phase 2b
Figure 21 indicates that there is a 77 per cent chance of Phase 2b having a BCR above 2.
Comparison with the Meadowhall Route
Following a consultation on changes to the route, including through South Yorkshire, the government has decided its preferred 2b route. This includes an Eastern Leg which follows the M18 alignment through South Yorkshire. We have modelled HS2 services from the city centre Sheffield station to London and Birmingham and Leeds calling at Sheffield via a loop using the existing network. This is shown in Annex A.

28
The previous route followed an alignment closer to Sheffield, with Sheffield served by HS2 services to the Meadowhall station. In the most recent analysis, the BCR of the M18 route remains higher than for the Meadowhall route on the modelling assumptions made.
The M18 route generates an infrastructure cost saving compared to the Meadowhall route. The Phase Two Financial Case accompanying this Economic Case shows that the infrastructure cost saving of adopting the M18 route is £1.2bn including OB. The Economic Case assesses this saving in PV terms and at market prices, and includes rolling stock and operating cost impacts16. As set out in the November 2016 consultation, the infrastructure cost saving assumes the cost of delivering a junction in the Clayton area north of Sheffield back onto the HS2 mainline, but not the costs of electrification of the Midland Main Line (MML) between Clay Cross and Sheffield Midland or electrification of the existing railway from Sheffield to Clayton (and any signalling renewal at Sheffield). The Phase 2b route decision document17 explores the impact of different assumptions on the route decision.
Serving Sheffield city centre increases benefits as passengers who want to reach Sheffield city centre do not need to change trains at Meadowhall. The benefits, revenues and costs of both routes is set out in Figure 22. Though the BCRs of the M18 and Meadowhall route both round to 2.6, adopting the M18 route has increased the BCR. The net benefits of the M18 option (including WEIs) are £1.5bn higher for the M18 route.
The net operating cost position (revenues minus operating costs) is higher for the M18 option than the Meadowhall option. This is because the M18 option assumed service pattern adds 1,056 seats per hour out of Euston on HS2 compared to that assumed for Meadowhall. The train service options are set out in Annex A. Train services are assumed for the purpose of modelling but actual decisions will be taken nearer the point of opening taking account of how demand has grown. On this basis, the net cost to Government is similar and the present value of the M18 route (net benefits including WEIs minus net costs to Government) is £1.5bn higher than for Meadowhall.
16 Economic case rolling stock capital costs vary between the M18 and Meadowhall options, to take into account train service changes to London. This brings the M18 rolling stock fleet size in line with what was assumed at Spending Review 2015. However, it is expected that a further two units of rolling stock are required over the Spending Review assumption for Birmingham to Leeds services to be routed via Sheffield. 17 DfT 2017, Phase 2b Route Decision, https://www.gov.uk/government/consultations/hs2-crewe-to-manchester-west-midlands-to-leeds-route-refinement-consultation-2016

29
PV, £bn 2015 prices Phase 2b increment M18 loop
Phase 2b increment Meadowhall
Net transport benefits excluding WEIs 39.0 37.5
Net benefits including WEIs 48.9 47.4
Capital Costs 24.3 25.2
Operating Costs 17.9 16.1
Total Costs 42.1 41.3
Total Revenues 23.5 22.7
Net costs to Government 18.6 18.6
BCR without WEIs (ratio) 2.1 2.0
BCR with WEIs (ratio) 2.6 2.6 Figure 22 Comparison of BCR components of Phase 2b M18 alignment and Meadowhall alignment
Alternatives to Phase 2b
The 2016 Economic Case set out the most recent analysis on the alternatives to Phase 2b18. This updated previous alternatives analysis published in 2013 to take into account recent developments in the rail industry. We have not re-evaluated the alternatives as we do not expect the relative value for money of the alternatives compared to the Phase 2b scheme to have changed significantly due to the change in methodology and appraisal assumptions detailed in Chapter 1.
There were no alternatives to Phase 2b that could deliver the same level of benefit for the country, stand the test of time and provide the same level of capacity, connectivity and service that Phase 2b does in pursuit of our strategic objectives.
Alternatives will be assessed again as part of the Phase 2b Outline Business Case.
18 High Speed Two Phase 2b Strategic outline business case: economic case, https://www.gov.uk/government/publications/hs2-phase-2b-economic-case

30
6. Robustness of the assessment
In line with DfT WebTAG guidance, our appraisal of the impacts of HS2 extends for 60 years after scheme completion (until 2087 for Phase 2a and until 2093 for Phase 2b). It is important to take this long term view for infrastructure that will be long-lived and which could continue to deliver benefits well beyond the end of the appraisal period. However, accurately forecasting benefits and costs such a long way into the future is inherently challenging and subject to significant uncertainties and unknowns. It is important therefore to understand the robustness of the Economic Case to changes in those factors in the appraisal which have the largest impact on the results.
A spread of Benefit Cost Ratios (BCRs) have been shown in Figure 7, Figure 11 and Figure 21 to account for variations in the probability of different events occurring (known as 'risk analysis’).
It is important to note that in deriving these results all other scenario assumptions for which we do not have a probabilistic representation of uncertainty are kept constant. As such, when taken in isolation they only offer a partial view of the uncertainty around the HS2 BCRs. In order to derive a better understanding of uncertainty, the risk analysis has been combined with a number of discrete sensitivity tests around key scenario variables, presented in this chapter.
These sensitivities test the robustness of our results in response to a change in some of our key assumptions on costs, demand and appraisal. We have reported the impact on the median BCR taken from risk analysis spreads (which can be found in HS2 Ltd’s Economic Case analysis).
Cost assumption: Optimism bias and efficiency savings targets
In the results in chapters 3 and 5 we have assumed an optimism bias (OB) factor of 40 per cent added to Phase 2a and Phase 2b construction costs. As set out in the Financial Case, this assumption is in line with WebTAG and HMT Green Book Supplementary Guidance19 and has also been validated using a reference class forecasting method which compares the outturn cost and estimated cost of similar historic projects.
In the case of Phase 2a, 40 per cent OB is further supported by initial work that HS2 Ltd has undertaken on developing a Quantitative Cost Risk Analysis (QCRA), which Phase 2a will adopt in future assessments.
Nevertheless, a sensitivity test of a higher OB assumption of 50 per cent has also been considered. Assuming 50 per cent OB on Phase 2a and Phase 2b infrastructure costs reduces the median BCR for Phase 2a by 0.2 and for Phase 2b by 0.2.
We have also assessed the effect of achieving infrastructure benchmark costs of £55m/km for Phase 2a and £65m/km for Phase 2b. The targets are designed to be below the total funding envelope to incentivise HS2 Ltd to deliver the project within its
19 HMT 2013, Green Book supplementary guidance: optimism bias, https://www.gov.uk/government/publications/green-book-supplementary-guidance-optimism-bias

31
available funding and their rationale is set out in the Financial Case. If these target costs were met, the median BCR of Phase 2a would increase by 0.2 and the median BCR of Phase 2b would increase by 0.4.
Demand assumption: Gross Domestic Product (GDP) growth
One of the largest drivers of rail demand forecasts is the assumption made about GDP growth. We have examined the impact on the BCRs for Phase 2a and the Phase 2b of increasing or decreasing the Office for Budget Responsibility’s forecast GDP growth rate by 10 per cent in each year. For example, a 2 per cent rate of growth in the central GDP forecast would become 2.2 per cent in the high GDP scenario.
The results indicate that increasing GDP growth beyond current projections would increase the median BCR of Phase 2a by 0.3 and increase the median Phase 2b BCR by 0.9. The low GDP test reduces the median Phase 2a BCR by 0.2 and the Phase 2b BCR by 0.7.
Demand assumption: Population growth
Another important assumption in our appraisal is the approach taken to extrapolating benefits and revenues beyond our final modelled year in 2037. For Phase 2a, the level of demand is capped in 2037 and values of time are forecast to increase in line with GDP per capita. For Phase 2b and the full Y network, benefits and revenues continue to increase at the population growth rate after 2037. This is discussed further in Annex C.
If Phase 2b benefits and revenues were not extrapolated with population growth, the Phase 2b incremental BCR with wider economic impacts (WEIs) would be 2.3 and the full network BCR with WEIs would be 2.0.
Appraisal assumption: Fares policy
The relationship between rail fares and the Economic Case for HS2 is complex. It is relevant to note that the results presented here assume the same fares are charged across both the HS2 network and the existing rail network. The Economic Case for HS2 is not predicated on higher fares being charged for HS2.
Our central assumption is that fares rise at a rate equivalent to growth in the Retail Price Index (RPI) until 2020 and thereafter fares are assumed to rise at RPI plus one per cent until 2037 (an assumption commonly applied in the appraisal of rail schemes).
We have examined the impact on the median BCR for Phase 2a and Phase 2b of varying the assumption on fares for both HS2 and conventional services after 2020. Our low fares test looks at the resulting BCRs if all rail fares were to continue to rise in line with RPI after 2020. We have also looked at a high fares test in which all rail fares rise in line with RPI plus two per cent after 2020.
The low fares test is shown to reduce the median BCR of Phase 2a to 1.8 and increases the median BCR of Phase 2b to 3.7. The high fares test is shown to increase the median BCR of Phase 2a to 2.1 and decrease the median BCR of Phase 2b to 1.9.
Increasing fares has two effects on revenue:
• The number of passengers travelling by rail falls as the cost of rail travel is higher
• Revenue per passenger (for remaining passengers) increases as fares are higher Benefits also fall when fares are increased as fewer people travel.
In Phase 2a, the high fares scenario increases the BCR as the effect of higher per passenger revenue is dominating other effects. In Phase 2b, the high fares scenario

32
reduces the BCR as the reduction in the number of passengers dominates. Fares have a larger effect on passenger numbers in Phase 2b as certain HS2 trains are lengthened to 400 metres, giving more capacity for increases in passengers.
Appraisal assumption: Reliability benefits
It is expected that HS2 will result in an improvement in the reliability of rail services. However, until the line is operational and therefore the full extent of the interactions between HS2 services and the existing rail network become known, the scale of reliability benefits is uncertain. Reliability benefits currently account for around 17 per cent of the benefits of HS2. We are undertaking further work to improve our modelling of HS2 performance which may refine these numbers in future.
We have examined the effect on the BCR results for the whole HS2 network of removing any reliability benefits from the modelling, assuming that HS2 is no more reliable than the existing network. This extreme sensitivity test reduces the median BCR for Phase 2a to 1.3 and the median BCR for Phase 2b to 2.0.
Summary
In summary, Figure 23 presents the impact of each sensitivity test on the median Phase 2a and Phase 2b BCRs. The schemes’ BCRs and value for money category is resilient across a number of downside sensitivity scenarios. For Phase 2a the BCR is likely to tip into the high value for money category should annual GDP growth be revised upwards or if fares were to increase. The Phase 2a BCR is sensitive to the extreme case scenario producing no reliability benefits, where the value for money category of Phase 2a would change from medium to low. Meanwhile, the median Phase 2b BCR would change from high to medium only in a higher fares scenario.
Median Phase 2a BCR with WEIs
Median Phase 2b BCR with WEIs
Central assessment 1.9 2.7
Higher cost – 50% OB 1.7 2.5
Lower cost 2.1 3.1
10% lower GDP growth rate 1.6 2.0
10% higher GDP growth rate 2.2 3.6
Lower fares 1.8 3.7
Higher fares 2.0 1.9
No reliability 1.3 2.0
Figure 23 Summary of impacts of sensitivities on median BCRs
33
7. Value for money
How we assess value for money
The Economic Case needs to reach a conclusion on whether the scheme represents value for taxpayers’ money. The analysis in Chapters 2 and 4 quantified the economic impacts of Phase 2a and Phase 2b against a “without scheme” scenario, in order to assess the economic, social, environmental and public accounts impact of the transport interventions. This quantified analysis of the impacts forms the basis of any value for money assessment of the scheme proposed.
There are limits to the ability of a single benefit cost ration (BCR) to generate informative conclusions on value for money. To reflect the long-term forecasting horizon required when considering such a project combined with its inherent scale and complexity, it is appropriate therefore, to consider how robust the value for money of HS2 remains across a range of possible future scenarios. This analysis was also outlined in Chapter 6.
To compare across schemes, WebTAG specifies value for money categories within which schemes can be placed, and Figure 24 below describes these categories. When categorising a scheme it is relevant to not only take account of the BCR but also the associated risks and uncertainty.
Value for Money Category BCR Poor Less than 1.0
Low Between 1.0 and 1.5
Medium Between 1.5 and 2.0
High Between 2.0 and 4.0
Very High Greater than 4.0 Figure 24 Value for money categories
The results set out in Chapter 4 showed that the Phase 2a incremental case has a central BCR of 1.9 with wider economic impacts (WEIs) and 1.6 excluding WEIs. This indicated that the scheme on a stand-alone basis provides medium value for money. Chapter 5 shows that the Phase 2b incremental scheme has a central BCR of 2.6 with WEIs and 2.1 excluding WEIs. This indicated that Phase 2b provides high value for money as a stand-alone scheme. As part of an integrated high speed network, Phases 2a and 2b demonstrate high value for money, contributing to a full network BCR of 2.3 with WEIs and 1.9 excluding WEIs.
The risk analysis indicates that when varying factors in our modelling that have a probability of taking a range of values, Phase 2a has an 85 per cent chance of having a BCR of at least 1.5 and therefore would be reliably considered to be medium value for money. The likelihood of Phase 2a having a BCR less than 1.0 was estimated at less than 1 per cent. Phase 2b has a 77 per cent likelihood of having a BCR above 2.

34
It is worth noting that only a small number of variables in our modelling have these probability distributions, and in deriving the risk analysis results, all other assumptions are kept constant. As such, when taken in isolation they only offer a partial view of the uncertainty around the HS2 BCR.
The sensitivity tests set out in Chapter 6 show that the BCR for Phase 2a and Phase 2b can vary with the assumptions used, with assumptions such as high GDP, and lower costs having a positive impact on the BCR. The largest positive impact is shown to be the high GDP assumption, which increases the median BCRs of Phase 2a to 2.2 and Phase 2b to 3.6.
Conversely, there are a number of assumptions which are shown to have a negative impact on BCRs. No reliability benefits has the largest impact on Phase 2a, reducing the median Phase 2a BCR to 1.3. For Phase 2b, higher fares has the largest impact, reducing the Phase 2b BCR to 1.9. Only in these instance, would the value for money of Phase 2a and 2b change. In all other scenarios, the value for money of Phase 2a and Phase 2b is considered to be robust to variations in the assumptions on demand, costs and appraisal examined.
As explained in Chapter 1, there are also impacts of HS2 that are not included as part of the BCR appraisal. These are outlined in the following sections on non-monetised impacts and landscape impacts of Phase 2a and Phase 2b.
Despite uncertainty in some of these factors potentially worsening value for money, there are also reasons to believe that our assessment is conservative. We apply demand growth forecasts which are lower than recent trends. We do not assume any land use change resulting from the improvements in connectivity of HS2 which may make businesses alter their location decisions, and which could lead to further benefits from regeneration and people moving to more productive jobs.
Potential opportunities exist to improve the train service specification (TSS) operating on the HS2 route to Crewe by rerouting trains to optimise services and potentially increasing services. These are discussed further in Chapter 8. These potential opportunities could improve the BCR for the incremental Phase 2a, Phase 2b and full network cases.
The economic analysis described in this document will be updated again in future and we will continue to keep changes to the BCR methodology under review.
Non-monetised impacts
DfT’s guidance, set out in WebTAG, requires consideration of impacts that cannot be translated into monetary values. This is done by undertaking a qualitative appraisal based on the inputs of experts from the relevant fields. The results of this appraisal for Phase 2a are summarised in Figure 25 and the results for Phase 2b are summarised in Figure 26.
The appraisal considers the permanent impacts arising from the scheme’s construction and operation on the natural and social environment around the proposed route and on passenger experience – beyond the already monetised benefits20.
There are also likely to be temporary impacts on noise and air quality that occur during construction of the route. These have not been appraised at this stage of scheme design.
20 No assessment has been made of security or personal affordability impacts at this stage of the project.

35
The Phase 2a non-monetised appraisal is based on the Environmental Impact Assessment (EIA)21 prepared to support the hybrid Bill that will enable construction. The Phase 2b appraisal is similarly based on its Sustainability Statement, which is based on the route as presented as part of the Phase 2b Strategic Outline Business Case (SOBC) in November 201622. The appraisals are intended to complement the EIA and Sustainability Statement rather than be seen as alternatives or replacements.
Consideration of the additional environmental and social impacts is not believed to alter the value for money category of HS2. We will continue to review our appraisal of non-monetised impacts as the HS2 scheme design progresses. Impact Assessment Comment
Landscape & Townscape Neutral Route does not significantly affect urban environments
Heritage Moderate Adverse Removal of uncommon archaeological remains and effects on several Grade II listed structures and settings
Biodiversity Slight Adverse Moderate adverse effects on ancient woodland and other habitats. Extensive mitigation for affected species and beneficial effects from tree planting initiative
Water Environment Slight Adverse Minor groundwater, springs and water course impacts
Security Not Assessed No stations or other sensitive environments affected
Accessibility Slight Beneficial Improved travel horizons due to improved journey times
Personal Affordability Not Assessed Fares not assumed to change
Severance Slight Adverse Multiple public rights of way diverted
Option Values Slight Beneficial Improvement of HS2 journey option (comprises marginal benefit for large affected population)
Physical Activity Neutral Unlikely to be significant
Journey Quality Slight Beneficial People travelling on newer HS2 trains and HS2 infrastructure
Figure 25 Non-monetised impacts of Phase 2a
21 HS2 Ltd 2017, HS2 Phase 2a Environmental Impact Assessment, https://www.gov.uk/hs2 22 HS2 Phase 2b: Sustainability Statement 2016, https://www.gov.uk/government/publications/hs2-phase-2b-sustainability-statement-2016. Note that the Sustainability Statement has assessed the impacts of the Phase 2b route with a southern spur into Sheffield Midland and a possible location of a northern junction, and has not considered any additional impacts of services using the northern junction to run between Sheffield and Leeds.

36
Impact Assessment Comment
Landscape & Townscape Moderate Adverse
Some sections of route will have major impacts on landscape character and wider countryside. Regeneration of areas around stations may ultimately improve townscape impacts
Heritage Moderate Adverse Some heritage sites will be adversely affected and 6 Grade II buildings may be demolished
Biodiversity Moderate Adverse
Potential for some significant impacts to regionally important and locally designated sites. More minor impacts to nationally designated sites. Impacts are subject to further review and potential mitigation
Water Environment Moderate Adverse Major waterways diverted, flood risk and minor potential
ground water impacts
Accessibility Slight Beneficial Potential to improve with new stations
Severance Slight Adverse 212 dwellings could experience a degree of severance although where the route crosses roads and paths access is intact in the vast majority of cases
Option Values Slight Beneficial Improves possible journey options, potentially allowing passengers more choice of routes to their destinations
Physical Activity Neutral Unlikely to have significant impact
Journey Quality Slight Beneficial New rolling stock and new stations expected to improve journey experience
Figure 26 Non-monetised impacts of Phase 2b
Landscape impacts
The assessment of landscape impacts has been undertaken on a quantitative basis, with the appraisal based on the value to society of the different types of less developed land traversed by HS2 and the current scope of mitigations.
The appraisal applies DfT’s value for money assessment guidance23. This approach has the benefit of providing a monetary assessment but is based on very high-level data and limited categorisation of landscape types.
The quantitative approach uses monetised values for categories of landscape type on either side of the line of route to estimate the change in the monetary value of the land due to the scheme, accounting for mitigations.
The impact on townscape, which overlaps with landscape appraisal, is assessed as a non-monetised benefit. Assessments of townscape are less rigorous as they inherently contain subjective and uncertain valuations of an area’s character. For this reason, the appraisal is carried out as a qualitative exercise.
Two types of adjustment are applied: firstly for any existing loss of land value from current infrastructure such as roads, motorways and rail lines, and secondly for any mitigations applied to the line itself such as tunnels and cuttings.
Our monetised estimates of the dis-benefits of landscape impacts for each Phase are presented in Figure 27. Two values are shown reflecting different approaches to the period over which this impact is subjected to appraisal. The methodology to assess the
23DfT 2013, Value for money assessment: advice note for local transport decision makers, https://www.gov.uk/government/publications/value-for-money-advice-for-local-transport-decision-makers

37
value of underdeveloped land has recommended valuing landscape impacts in perpetuity24. However, the typical appraisal period for a transport project is 60 years after scheme opening (2087 for Phase 2a and 2093 for Phase 2b), beyond which uncertainty around future conditions prevents us from forecasting benefits and costs.
Appraisal period (PV, £bn 2015 prices)
Phase 2a Indicative landscape dis-benefit
Phase 2b Indicative landscape dis-benefit
To 2087 0.24 N/A
To 2093 N/A 0.88
In perpetuity 0.55 1.98
Figure 27 Landscape impacts of HS2
The value of landscape dis-benefit to 2087 (consistent with our 60 year appraisal) would reduce the central BCR for Phase 2a by 0.1. The value of landscape to dis-benefit to 2093 would reduce the central BCR for Phase 2b by less than 0.1. However, the extent to which we can incorporate an estimate accurately into our value for money assessments is restricted by the inherent limitations of the methodology applied. DfT makes every effort to be as thorough and rigorous as possible by using methods outlined in its guidance to quantify landscape impacts, though there remains inherent uncertainty and subjectivity applied in the assessment.
Landscape valuation is dependent on forecast growth in GDP per capita. Changes to these estimates partly reflect the revised growth forecasts assumed within this Economic Case. Changes to the route itself have been relatively modest - consisting mainly of the extension and transfer of scope of the Crewe tunnel from Phase 2a to Phase 2b, and the removal of the Crewe depot spur. Both of these adjustments reduce the overall value of the network’s landscape impact.
Extending our appraisal
The supporting analysis provided by HS2 Ltd to this Economic Case also highlights a number of factors that are not currently included in our appraisal. The modelling approach currently does not have an endogenous demand response to improvements in service prior to HS2, which would generate more demand. This could provide a larger number of potential passengers for HS2, but also potentially increases levels of crowding in some locations.
Our modelling also does not take account of businesses moving to more productive locations, and the benefits that this can ultimately bring to workers through higher employment and to consumers through lower prices. It does not include the potential benefits of property developers upgrading housing stock in reaction to improved transport links, leading to regeneration. An initial investigation into each of these areas indicates there could be significant benefits which are not yet modelled.
There are however, factors which are not included that would worsen the appraisal, such as the welfare impacts of disruption during construction of HS2. Costs of rail disruption have been included in the cost estimates using the standard industry
24ODPM, 2001: Valuing the external benefits of undeveloped land, Annex 3, http://webarchive.nationalarchives.gov.uk/20050111222833/http:/www.odpm.gov.uk/stellent/groups/odpm_planning/documents/page/odpm_plan_606459.hcsp

38
approach of looking at compensation to rail operating companies during line closures. As set out above, due to the lack of a robust methodology, the monetary estimates of landscape impacts are omitted from the BCR estimates and have only been considered as a sensitivity.

39
8. Alternative train service options
Serving Stoke-on-Trent and enabling a Crewe Hub
In November 2016, Government announced its intention to explore how HS2 services could be extended to Stoke-on-Trent.
The results of that work found that the best way to serve Stoke-on-Trent would be a service via Handsacre junction. The work also found that some additional interventions at Crewe station, namely lengthening of platforms to accommodate longer trains, would provide greater flexibility around the train service that can be operated in future.
Government has also supported the vision of a Crewe Hub and we are launching a consultation on the concept of a Crewe Hub. Specific interventions currently being explored are a junction north of Crewe to allow trains calling at Crewe to re-join the HS2 mainline and 400m platforms at Crewe to allow longer trains to operate to Crewe as well as the splitting and joining of HS2 services.
While technical work is progressing, this Chapter sets out what value for money these interventions might provide.
The assessment framework
To assess the case for platform lengthening, we have made an assessment against the benefits and revenues of the central case for the full Y network, taking the full Y network as given and presuming the interventions can be delivered from 2027 and can be exploited from 2027 and/or their capability is not fully exploited until 2033.
To assess the case for the junction north of Crewe, we have made an assessment against the central case for the full Y network. This assumes the junction will be delivered as part of Phase 2b and operational from 2033.
The results are presented as an incremental change in benefits and revenues, on the full Y network central case. As capital costs of the platforms and junction are still in development, we present the incremental change in operational cost and rolling stock cost.
The analytical approach, assumptions and methodology for assessing the impacts of the interventions is consistent with that adopted by HS2 Ltd for the assessment of Phase 2a.
The respective train service specification (TSS) assumed in the scenarios below are presented in Annex A.

40
Extending Crewe station platforms
Extension of platforms at Crewe gives the opportunity of splitting and joining services travelling from and to London at Crewe.
Splitting and joining one train per hour – Scenario 1
Changes from the central case Train Service Specification (TSS) include joining the planned HS2 London - Preston and London - Liverpool services and splitting these at Crewe to reach both destinations. This frees up a path on the Phase One route which could be used to serve Stoke-on-Trent through HS2 services, which continue on to the existing network. This means an additional path would not be required on the HS2 London-Birmingham core route.
A further potential benefit of this scenario is that the HS2 stop at Stafford, which is currently proposed on the London-Liverpool service in the central case TSS, could be transferred to the Stoke-on-Trent service outlined above. Both of the HS2 Liverpool services can run using the Phase 2a line rather than the West Coast Main Line (WCML) between Birmingham and Crewe, and improve journey times on the second Liverpool service.
Figure 28 presents the results of the scenario.
Present Value (PV), £bn 2015 prices Services resuming from 2027
Services resuming from 2033
Net transport benefits 1.0 0.8
WEIs 0.2 0.2
Net benefits including WEIs 1.1 1.0
Operating costs 0.7 0.6
Rolling Stock Cost 0.1 0.1
Revenues 0.5 0.4 Figure 28 Scenario 1 - Incremental change in BCR components of splitting and joining one train per hour
Splitting and joining two trains per hour – Scenario 2
Changes from the central case TSS includes joining a London-Preston and London-Liverpool service and splitting these at Crewe. This enables a HS2 service running on to the existing network via Handsacre junction that is able to serve Stafford, Stoke-on-Trent and Macclesfield. The platform lengthening also allows us to join another two trains travelling from London. If both of the Liverpool services were to be run as 400m trains and split/join at Crewe, there is in effect a further (200m) HS2 train compared to the central case TSS of which one train unit carries on to Liverpoool and a spare unit is left at Crewe. This unit could also serve a range of other northern destinations, subject to business case, capacity on the existing rail network and further understanding of any infrastructure required (e.g. electrification) on the current network.
Figure 29 presents the results of the scenario.

41
PV, £bn 2015 prices Services resuming from 2027
Services resuming from 2033
Net transport benefits 1.8 1.6
WEIs 0.4 0.3
Net benefits including WEIs 2.2 1.9
Operating costs 1.3 1.1
Rolling Stock cost 0.2 0.2
Revenues 1.0 0.8 Figure 29 Scenario 2 - Incremental change in BCR components of splitting and joining two trains per hour
Extending services via a junction north of Crewe – Scenario 3
Combined with the option to split and join two trains described above, this scenario would see Crewe receive five HS2 trains per hour from the south and up to seven trains per hour from the north (seven as a result of splitting and joining).
Changes from the central case TSS for this scenario assume joining a London-Preston and London-Liverpool service and splitting these at Crewe. The platform lengthening which allows a second Liverpool service travelling from London to be lengthened as set out in paragraph 8.14 also allows one unit to carry on to Liverpool. For illustrative purposes we have assumed the additional unit from this second Liverpool service is sent to Lancaster via the proposed junction north of Crewe.
The combined impact of the northern junction and platform lengthening are presented in Figure 30.
PV, £bn 2015 prices Services resuming from 2033
Net transport benefits 2.7
WEIs 0.7
Net benefits including WEIs 3.4
Operating costs 1.3
Rolling Stock cost 0.3
Revenues 1.4 Figure 30 Scenario 3 - Incremental change in BCR components of exploiting northern junction capability
Robustness of results and key issues
As set out above, we have examined the impact of each option using a consistent methodology to that used for Phase 2a, Phase 2b and the full network. This means that the results are estimated with a similar level of robustness and subject to the same risks and limitations as the central case results (see Chapter 6). However, this analysis has not been tested to the same level of detail as the current central case. Some important limitations include:

42
• The interventions necessary to deliver these services are not included or funded within the current scope of the HS2 programme. DfT is consulting on stakeholder views on these possible interventions.
• The interventions are subject to a full operability assessment to assess the deliverability of these services. As part of this, we will need to understand the capacity and availability of the infrastructure to enable these services.
• The results are based on indicative journey time estimates, which are subject to change once the full feasibility of any services via these routes has been undertaken.
• The results have not factored in further infrastructure spend that might be needed in response to an increase in passenger demand at Crewe.

43
Annex A: Modelled train service specification Central case indicative train service specification (ITSS) of full Y network and Phase 2b

44
Central case Phase 2a ITSS

45
Phase 2b Meadowhall ITSS - Eastern Leg
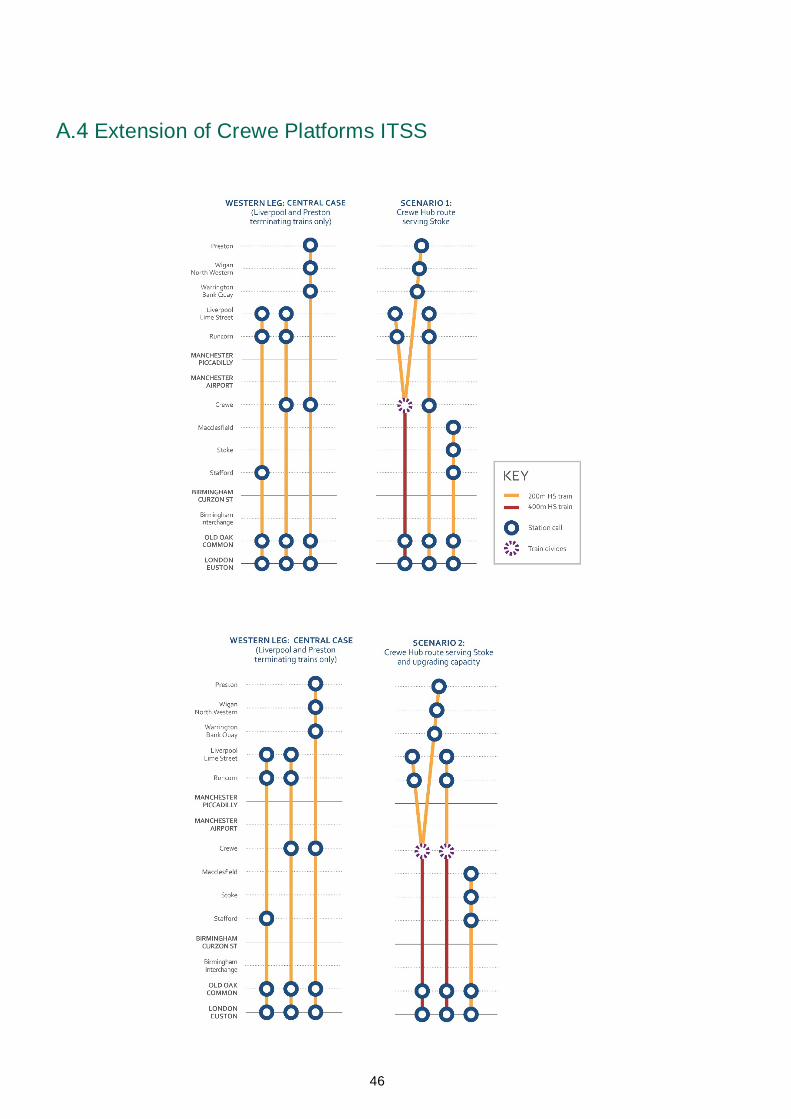
46
Extension of Crewe Platforms ITSS
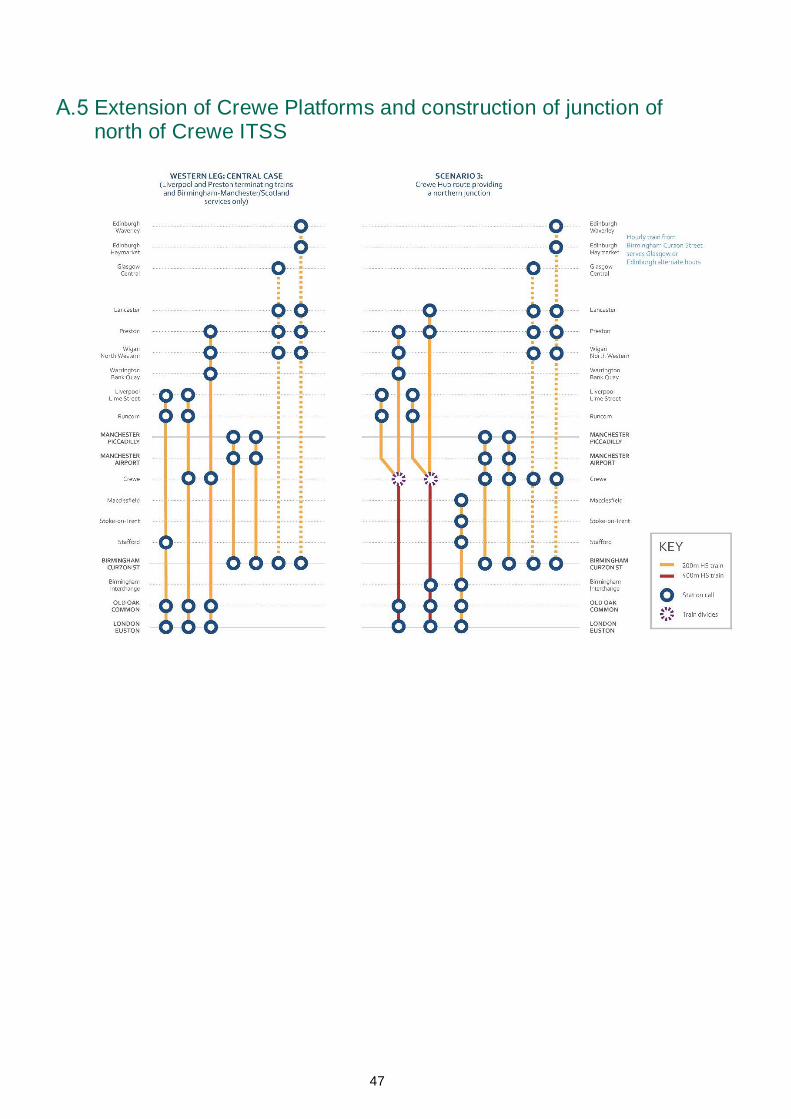
47
Extension of Crewe Platforms and construction of junction of north of Crewe ITSS

48
Annex B: Costs of alternatives to Phase 2a Introduction
B.1 This Annex should be read alongside Atkins’ previously published report on the Phase 2a rail alternatives25. Their report details the development of the three options shortlisted for assessment.
B.2 For the OBC, we have provided a more detailed bottom-up cost estimate of the alternatives. Throughout this work, the analytical approach, assumptions and methodology for assessing the alternative options has been kept as consistent as possible with that used by HS2 Ltd for their assessment of HS2 Phase 2a.
B.3 We describe below the approach taken and where it departs from the previous methodology.
Construction Costs
B.4 As much as possible, the derivation of both the capital and operating costs were estimated using the same assumptions and approach as used by HS2 Ltd for the assessment of HS2 Phase 2a. Figure 31 provides a summary of the infrastructure associated with each of the alternatives.
High Cost Medium Cost Low Cost
HS2 Infrastructure
HS2 Track 41.8km 15.9km 0km
HS2 Infrastructure Depot & Railhead at Stone
included included included
Crewe tunnel portal included included included
Non HS2 Infrastructure
New 250mph alignment 1.4km 4.8km 17.6km
New 140mph alignment 0km 10.8km 0km
Upgraded WCML alignment
0km 6.5km 6.5km
Grade separated junction 0 junction 0 junction 1 junction
Flat junction 1 junction 3 junctions 3 junctions
Figure 31 Infrastructure requirements of alternatives
HS2 Infrastructure Costs included within the alternatives
B.5 In Atkins’ assessment in 2015, the construction costs of the alternative options were calculated on a unit rate basis, with the unit rates determined in reference to the costs of HS2 Phase 2a. As part of the OBC, we have identified the sections of the HS2 scheme that would be built under each alternative option and included the cost of that section as provided by HS2 Ltd. As per the assessment of HS2 Phase 2a by HS2 Ltd, an optimisim bias (OB) uplift of 40% has been applied to the base unit cost.
25 Atkins 2015, Rail alternative to HS2 Phase 2a, https://www.gov.uk/government/publications/hs2-rail-alternatives-to-phase-2a
49
B.6 The costs of Phase 2a also include the cost of a large depot and railhead at Stone, previously at Crewe, for supporting the track maintenance of both Phase 2a and from 2033, the rest of Phase 2 north of Crewe. Given that a significant proportion of the depot is to support the rest of Phase 2, the full depot costs have therefore also been included in the assessment of all the alternative options, even if the alternatives have much less new infrastructure to maintain.
B.7 We have not undertaken a detailed review of how the infrastructure maintenance depot requirements might change for the alternative options. In line with HS2 Phase 2a, the OB for the depot and railhead is 40%.
B.8 The costs of Phase 2a include the costs of building a tunnel portal for the start of a tunnel under Crewe that is then completed as part of the rest of Phase 2. The costs of these enabling works for the rest of Phase 2 are also included in the costs of all the alternative options, with the same level of OB as has been applied in Phase 2a.
Non-HS2 Infrastructure Costs included within the alternatives
B.9 As the alternatives are at an earlier stage of development, a higher level of OB is applied to the costs at a rate of 66%, consistent with HMT Green Book guidance26 as well as Atkins’ assessment in 2015.
B.10 The alternatives require some new high speed alignment that is able to accommodate 250mph trains. This cost is based on the unit rate calculated from the capital costs and distances of the southern section of HS2 Phase 2a from Pyford South Embankment to Checkley North Embankment.
B.11 Atkins previously determined the unit rate for upgrading the existing WCML to allow running at 140mph, the unit rate of new alignment designed for conventional line speeds (140mph) and the construction of grade separated and flat junctions.
B.12 The basis and assumptions used to calculate these rates have been updated and are consistent with the unit rates used by Atkins in their analysis of the Phase 2b rail alternatives27. These have been reviewed by the Department’s independently appointed Project Representative28.
B.13 Note that the junction costs are for the costs of the junctions only, as the cost of alignment needed to reach the junctions is included within the alignment costs above.
B.14 As with the HS2 Phase 2a central case, no allowance has been made for network enhancements north of Crewe.
B.15 In Figure 32, we present the initial costs and OB rates used within the analysis.
26 HMT 2013, Green Book supplementary guidance: optimism bias, https://www.gov.uk/government/publications/green-book-supplementary-guidance-optimism-bias 27 Atkins 2016, Strategic alternatives to HS2 Phase 2b, https://www.gov.uk/government/publications/strategic-alternatives-to-hs2-phase-2b 28 DfT Project Representative (P-Rep) monitors HS2 Ltd’s approach to risk management; providing monthly reports to the DfT Project Sponsor, including a section on risk; and providing an independent assessment and reports on key risks in the programme

50
Infrastructure type Source Unit rate (2015 prices)
OB
HS2 Phase 2a alignment – High Cost HS2 Ltd £902m 40%
HS2 Phase 2a alignment – Medium Cost
HS2 Ltd £400m 40%
New 250mph alignment Atkins £30m/km 66%
New 140mph alignment Atkins £27m/km 66%
Upgraded WCML Atkins £16m/km
Grade separated Junction Atkins £105m 66%
Flat Junction Atkins £13m 66%
Infrastructure Maintenance Depot and Railhead
HS2 Ltd £82m 40%
Crewe Tunnel Portal HS2 Ltd £401m 40%
Figure 32 Unit rates associated with infrastructure costs
B.16 The capital costs of each option were calculated from the rates outlined in the table above and the specification of each option outlined in Figure 33. The total costs in Figure 33 below are presented in Q1 2015 prices as per HS2 Ltd’s assessment of HS2 Phase 2a costs.
2015 prices Phase 2a High Cost Option
Medium Cost Option
Low Cost Option
Increment over Phase One
£3.9bn £3.3bn £3.0bn £2.5bn
Full Y Network £55.8bn £55.4bn £55.1bn £54.5bn
Figure 33 Capital cost of construction and renewals
B.17 Figure 33 demonstrates that the high cost option is approximately £400m cheaper than Phase 2a, the medium cost option is £700m cheaper and the low cost option is £1.3bn cheaper.
B.18 At this early stage of the alternative options design, the cost estimates are necessarily unit rate based and high level. Although, where possible many of the unit rates and assumptions have been derived from those used by HS2 Ltd and previous strategic alternative studies, the application of those unit rates may not be entirely applicable to the particular design requirements and local geography of each option.
B.19 As the alternatives are subject to a degree of inherent uncertainty, a higher level of OB has been applied to the alternative options’ cost estimates than that which has been applied by HS2 Ltd to Phase 2a. However, with more detailed option design and costing, it is possible that the costs of the alternative options could be higher or lower than the estimates presented in Figure 33.
B.20 Nonetheless, since the publication of the analysis in November 2015, the difference between the costs is narrower. This partly reflects the change in methodology and in part due to the lower cost associated with Phase 2a, which is now shorter due to the design including a longer tunnel at Crewe to be built as part of Phase 2b.

51
Infrastructure, Operations, Maintenance and Renewal Costs
B.21 The infrastructure operating, maintenance and renewal (OMR) costs for new high speed alignment has been calculated on a per kilometre unit rate basis using the same assumptions as that used for the OMR costs of Phase 2a. The infrastructure OMR costs for the existing WCML or for new conventional speed (140mph) alignment have been determined within the calculation of rolling stock operating costs.
B.22 The rolling stock operating costs include operating cost charges per kilometre (such as Variable Track Access Charges – VTAC) that are applied to any service using the conventional infrastructure. These charges implicitly include infrastructure OMR costs. The overall approach and assumptions for assessing the OMR of the conventional WCML running is entirely consistent with that used for the assessment of Phase 2a. Overall the approach means that the full infrastructure operations, maintenance and renewal costs for all sections of each alternative option, whether operating on existing lines, or new high speed or conventional lines, have been included in the assessment of costs.
Rolling Stock Costs
B.23 The capital cost of rolling stock needed to operate the full Y network with an alternative option in place of Phase 2a, has been assessed using the same rolling stock unit cost and OB assumptions as used by HS2 Ltd.
B.24 For the period between 2027 and 2033, the rolling stock requirements are the same as those for Phase One. The main difference between Phase One and Phase 2a are the journey times to destinations north of Birmingham on the Western Leg of the HS2 route.
B.25 In the case of the full Y network, the rolling stock requirements would be different in the case where an alternative option is built rather than the proposed Phase 2a. The main difference being that the alternative options would travel along the WCML, which would require conventional compatible trains along the operation of the entire Western Leg. In comparison, the Phase 2a design means that some services operating on the Western Leg may be delivered by captive trains.
B.26 This would not change the overall fleet size, only the fleet mix, although as HS2 Ltd assume that conventional compatible rolling stock is slightly more expensive then captive rolling stock, this would increase the overall rolling stock purchase costs.
B.27 Figure 34 summarises our assessment of the rolling stock requirements for the alternative options taking into account that more conventional compatible stock is required under the alternatives, as they would be required to run on conventional track for some duration of the journey on the Western Leg of the full Y network.

52
Base cost of 200m train set (2015 prices)
Train sets required for
Phase One and 2a and
alternatives options
Train sets required for Full Y with Phase 2a
Train sets required for Full Y with alternative
options
Captive fleet £19.6m 0 70 45
Conventional compatible fleet £20.1m 60 95 120
Figure 34 Rolling stock cost and requirements for alternatives
Operating Costs
B.28 Operating costs for the alternative options have been calculated using the operating cost model and assumptions developed by HS2 Ltd to assess Phase 2a operating costs. They are based on the total distance travelled on conventional line and the new high speed line. The operating costs are different to those in the assessment made by Atkins in 2015. The key differences are explained below.
• Rolling stock maintenance costs. Previously, Atkins assumed this should be the same for the alternatives as the distance operated by HS2 rolling stock is broadly the same under the alternative options as assumed in Phase 2b. However, within HS2 Ltd’s operating cost model, the conventional line network is assumed to require a greater level of maintenance than a new high speed line. As the alternatives travel a greater distance on the conventional network rather than the high speed network, the rolling stock maintenance costs are higher for the alternatives than for Phase 2a.
• Electricity Costs. These now use the same assumptions as used by HS2 Ltd, which are calculated based on the distance travelled on high speed and conventional line. The consumption rate on high speed alignment is assumed to be higher in comparison to conventional line alignment. This results in comparatively higher costs compared with Phase 2a in the high cost option as the overall total distance travelled is higher than Phase 2a. While, the total distance travelled in the medium and low cost options is higher than Phase 2a, a larger proportion of this is travelled on conventional line alignment, as opposed to high speed. Consequently, the medium and low cost options have lower electricity costs compared to Phase 2a.
• Office and station staff costs. These have also been revised in line with the operating cost model assumptions. The staff costs attributed to the alternatives is higher compared to Phase 2a. This is due to the requirements of on-train staff, which was not previously taken into consideration in Atkins’ assessment in November 2015. As the alternatives have longer journey times, the per hour staff requirements are higher and therefore the costs are higher compared to Phase 2a.
• Other costs of operating HS2 services. These are the costs of operating on either the existing WCML or new conventional alignment, which are adjusted to account for the different lengths of conventional line route that the HS2 services operate over within the alternative options. These costs include Network Rail’s VTAC,

53
capacity charges, station access charges and rolling stock insurance. These costs are higher for the alternatives compared to Phase 2a as they tend to use conventional line alignment more than the new high speed alignment and therefore are subject to greater usage costs.
• Testing and commissioning costs. These costs are calculated based on a fixed proportion of the total operating costs in the first full year of operation. As the overall operational costs of the alternatives are higher than Phase 2a, these costs are also higher.
• Conventional line savings. These are the cost savings from running the conventional line residual non-HS2 timetable, which are the same for all the alternative options as assumed for Phase 2a.
B.29 The operating costs for each alternative option is shown in Figure 35.
B.30 It should be noted that compared to the capital costs, the differences in operating costs between Phase 2a and the alternative options are relatively small, and that therefore any uncertainty attached to the derivation of operating costs is unlikely to have an impact on the appraisal of options.
PV, 2015 prices Phase 2a High Cost Option
Medium Cost Option
Low Cost Option
Increment over Phase One
£0.22bn £0.29bn £0.39bn £0.4bn
Full Y £27.6bn £27.7bn £27.8bn £27.8bn
Figure 35 Operating costs
Change in costs from 2015
B.31 Overall the difference in costs between the alternative options and Phase 2a is smaller than when previously assessed in 2015. The differences are described above, the methodology is more detailed than previously in 2015.

54
Annex C: Long term benefits
C.1 In July this year the Department for Transport issued an update (a forthcoming change) to part of its transport appraisal guidance. The update is to WebTAG Unit A5.3 (rail appraisal) on assumptions that should be made for forecasting demand and benefits beyond the final forecast year. The final forecast year is currently 2037, twenty years from the appraisal year.
C.2 Previously demand and benefits in the economic appraisal were capped after the final forecast year. In other words we assumed absolutely no further growth in demand would occur beyond 2037, just 4 years after the full Y network opens.
C.3 The previous demand cap has been replaced with an approach where, beyond the final forecast year, the magnitude of impacts associated with the level of demand should be extrapolated in line with national population growth. Office for National Statistics (ONS) national population projections implies an increase in benefits and revenues of around 8% between 2037 and the end of the appraisal period, 2093.
C.4 This is a relatively simple assumption that assumes benefits per capita remain fixed at levels estimated in the final forecast year, but that journeys (and therefore total benefits) continue to increase as population increases. This assumption implies a constant amount of travel per person and is consistent with assumptions made about long-term per capita travel in the National Trip End Model which forecasts future travel demand.
C.5 In addition, the elasticity of demand with respect to population used in rail demand forecasting is 1. We believe it is reasonable to assume that this elasticity remains broadly constant over time and that population growth will continue to be a driver of growth in travel demand.
C.6 However, the use of population growth to extrapolate demand, and hence scheme impacts, is not intended to replicate a model forecast, but is a pragmatic approach that allows longer-term impacts to be better captured in appraisal based on transparent assumptions.
C.7 In line with the forthcoming change to WebTAG we have considered whether any capacity constraints will reduce or curtail the magnitude of benefits over the extrapolation period. Our analysis included consideration of likely all-day average and peak time loadings along with UK and international benchmarks. UK and international benchmarks (including evidence from Central Japan Railway’s Shinkhansen services) indicates a network-wide, all-day average load factor of around 70% would be a stretching, but reasonable, level for a complex high speed network such as HS2 (with a comparable figure for the peak between 80 and 90%).
C.8 Our analysis of load factors suggests that for the full Y network, it is reasonable to apply the updated guidance for the duration of the appraisal period. This has been done for the central BCR in this updated Economic Case. This has the effect of increasing the full Y network BCR from 2 (if the previous demand cap is applied) to 2.3 using the current population based approach.
C.9 Meanwhile, for Phase 2a on its own (assuming that the full Y network is not completed and therefore additional capacity is not delivered), modelling suggests that HS2 services would be relatively full by the final forecast year (2037). We have therefore concluded it would be prudent to retain the previous demand cap for Phase 2a incremental appraisal.