Review of Plume VolumeReview of Plume Volume Molar Ratio ... · Review of Plume VolumeReview of...
27
Review of Plume Volume Review of Plume Volume Molar Ratio Method (PVMRM) and Ozone Limiting Method (OLM) for Predicting Short-term NO 2 I t Impacts Elizabeth Hendrick CCM Epsilon Associates Inc Elizabeth Hendrick, CCM Epsilon Associates, Inc. Vincent Tino, CCM Epsilon Associates, Inc. Dr. Bruce Egan, CCM Egan Environmental Inc. Dr. Steven Hanna, CCM Hanna Consultants Preliminary Findings 3/30/11 Presented at the EPA Regional/State/Local Modelers Workshop - June 9, 2011 Preliminary Findings – 3/30/11 SPONSORED BY API
Transcript of Review of Plume VolumeReview of Plume Volume Molar Ratio ... · Review of Plume VolumeReview of...
Review of Plume VolumeReview of Plume Volume Molar Ratio Method (PVMRM) and Ozone Limiting Method (OLM) for Predicting Short-term NO2I tImpacts
Elizabeth Hendrick CCM Epsilon Associates IncElizabeth Hendrick, CCM Epsilon Associates, Inc. Vincent Tino, CCM Epsilon Associates, Inc. Dr. Bruce Egan, CCM Egan Environmental Inc.Dr. Steven Hanna, CCM Hanna Consultants
Preliminary Findings 3/30/11
Presented at the EPA Regional/State/Local Modelers Workshop - June 9, 2011
Preliminary Findings – 3/30/11SPONSORED BY API
Topics for DiscussionTopics for Discussion
ISC and AERMOD PVMRM and OLM code review
Improving plume models based on scientific principles
Data sets for PVMRM and OLM model evaluations
Conclusions
2
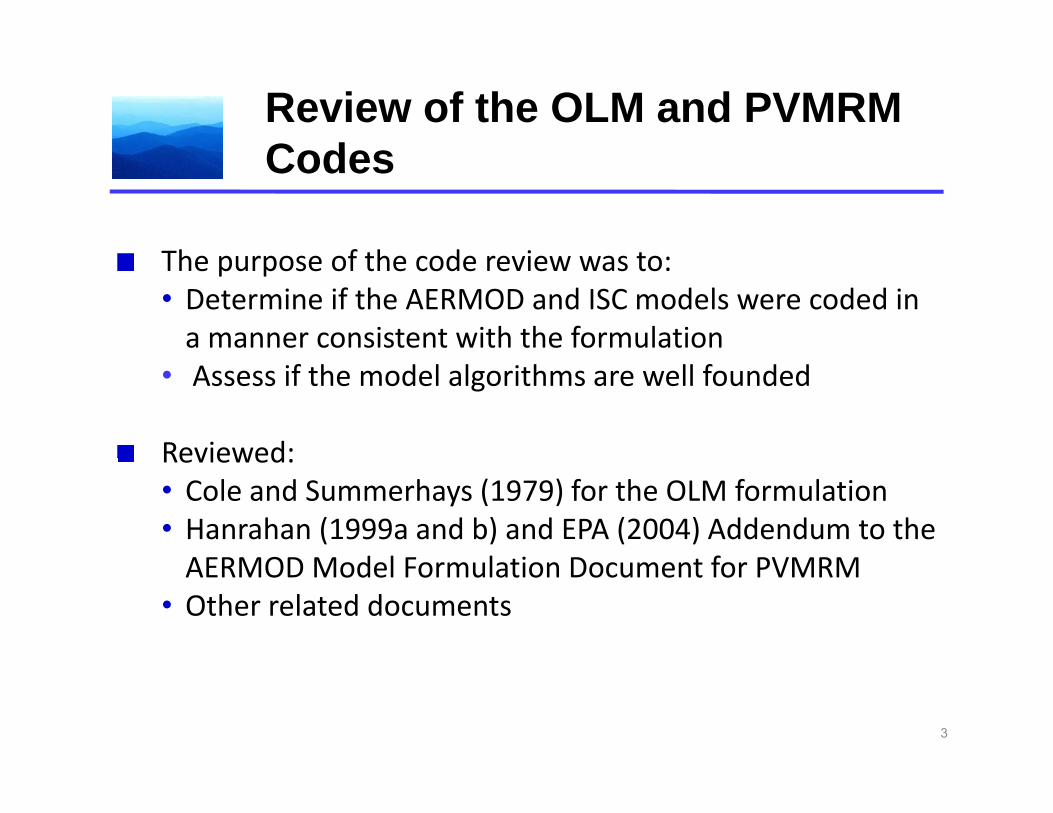
Review of the OLM and PVMRM C dCodes
Th f th d i tThe purpose of the code review was to:• Determine if the AERMOD and ISC models were coded in a manner consistent with the formulation
• Assess if the model algorithms are well founded
Reviewed:Reviewed: • Cole and Summerhays (1979) for the OLM formulation • Hanrahan (1999a and b) and EPA (2004) Addendum to the AERMODM d l F l ti D t f PVMRMAERMOD Model Formulation Document for PVMRM
• Other related documents
3
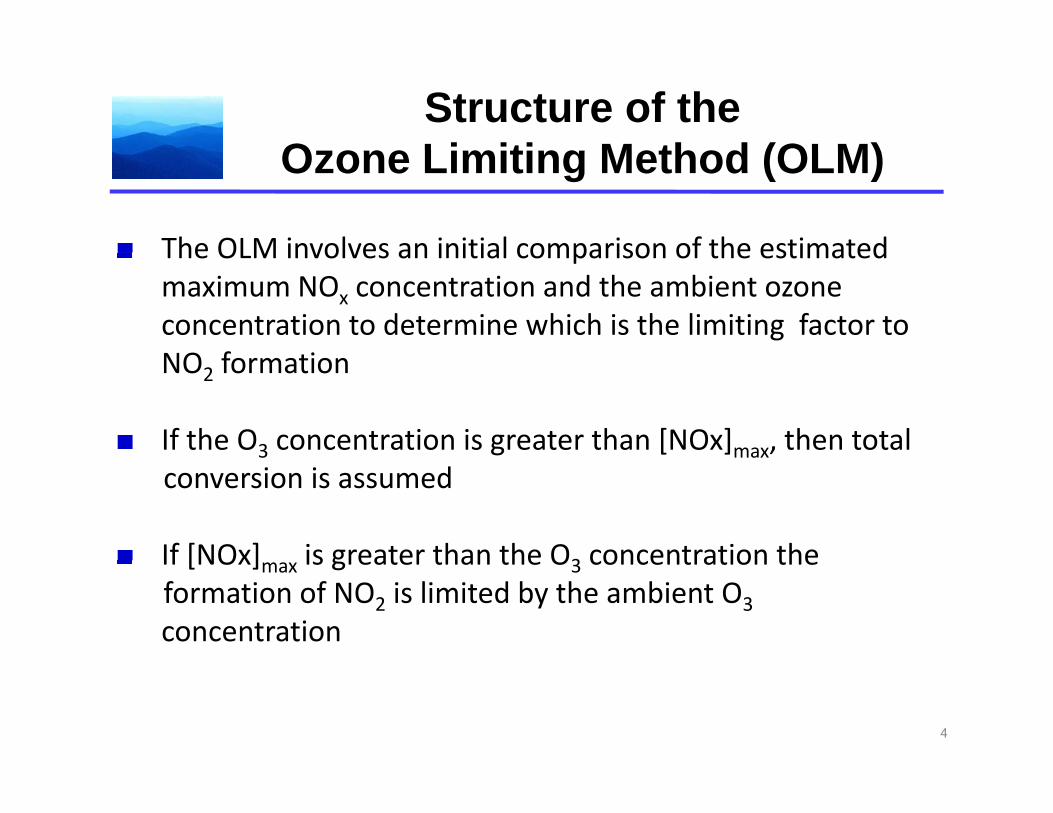
Structure of the O Li iti M th d (OLM)Ozone Limiting Method (OLM)
The OLM involves an initial comparison of the estimatedThe OLM involves an initial comparison of the estimated maximum NOx concentration and the ambient ozone concentration to determine which is the limiting factor to NO f tiNO2 formation
If the O3 concentration is greater than [NOx]max, then totalconversion is assumed
If [NOx] is greater than the O3 concentration theIf [NOx]max is greater than the O3 concentration theformation of NO2 is limited by the ambient O3concentration
4
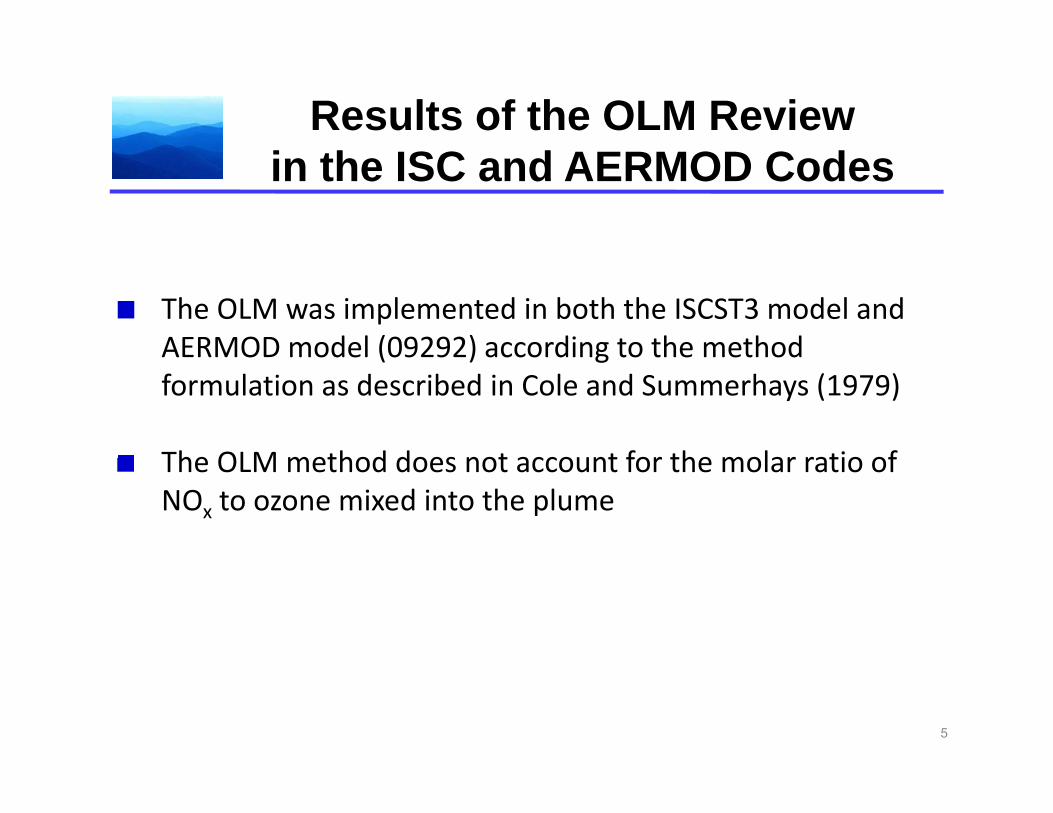
Results of the OLM Review SC O Cin the ISC and AERMOD Codes
The OLM was implemented in both the ISCST3 model and AERMOD model (09292) according to the methodAERMOD model (09292) according to the method formulation as described in Cole and Summerhays (1979)
The OLM method does not account for the molar ratio ofThe OLM method does not account for the molar ratio of NOx to ozone mixed into the plume
5
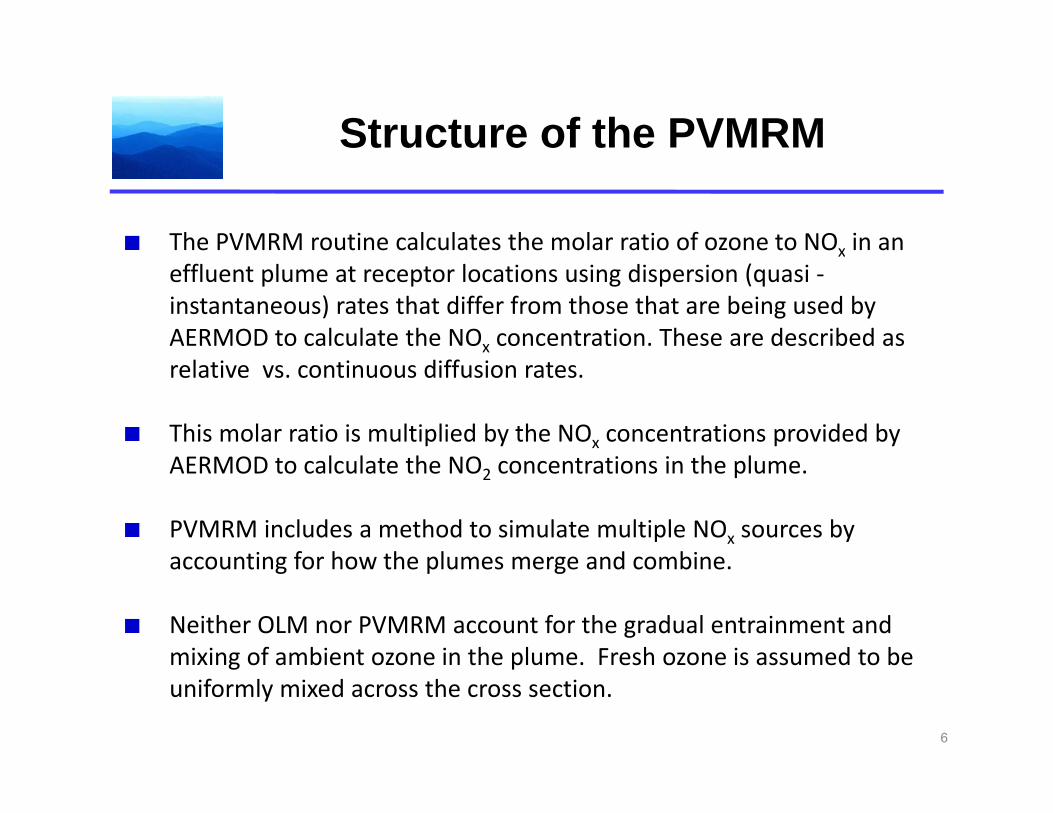
Structure of the PVMRM
The PVMRM routine calculates the molar ratio of ozone to NOx in an xeffluent plume at receptor locations using dispersion (quasi ‐instantaneous) rates that differ from those that are being used by AERMOD to calculate the NOx concentration. These are described as relative vs. continuous diffusion rates.
This molar ratio is multiplied by the NOx concentrations provided by AERMOD t l l t th NO t ti i th lAERMOD to calculate the NO2 concentrations in the plume.
PVMRM includes a method to simulate multiple NOx sources by accounting for how the plumes merge and combineaccounting for how the plumes merge and combine.
Neither OLM nor PVMRM account for the gradual entrainment and mixing of ambient ozone in the plume. Fresh ozone is assumed to bemixing of ambient ozone in the plume. Fresh ozone is assumed to be uniformly mixed across the cross section.
6
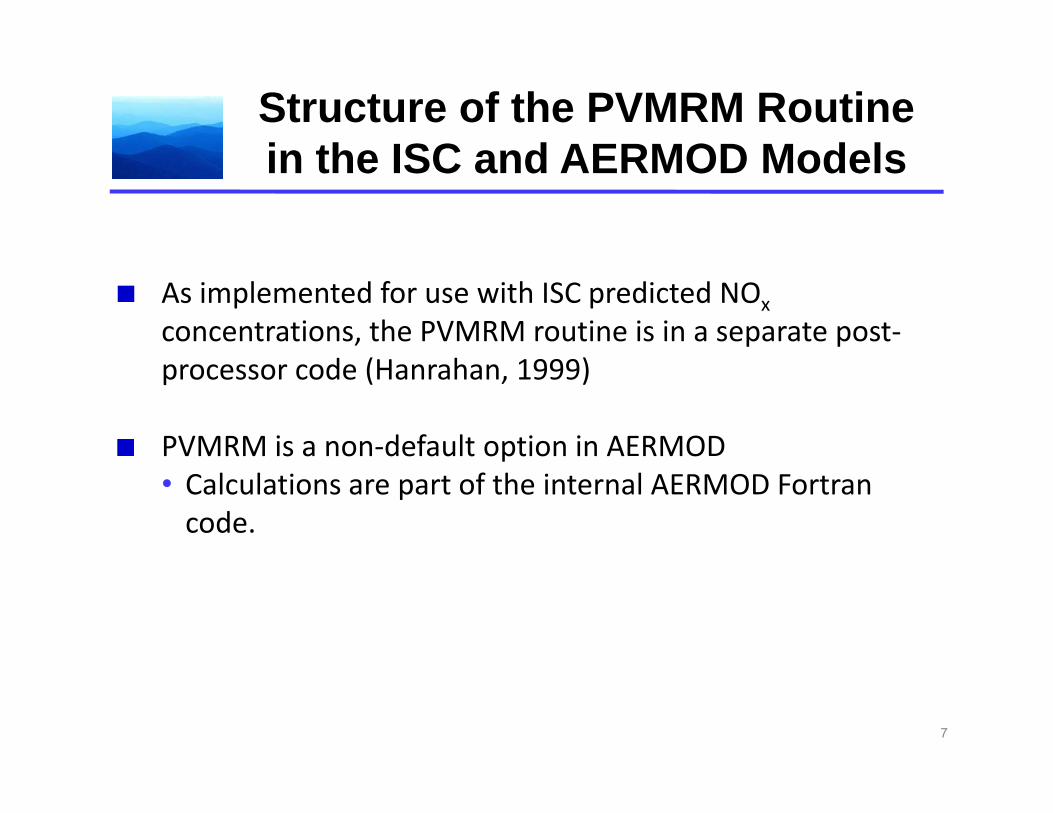
Structure of the PVMRM Routine i th ISC d AERMOD M d lin the ISC and AERMOD Models
As implemented for use with ISC predicted NOxconcentrations, the PVMRM routine is in a separate post‐processor code (Hanrahan, 1999)
PVMRM is a non‐default option in AERMOD p• Calculations are part of the internal AERMOD Fortran code.
7
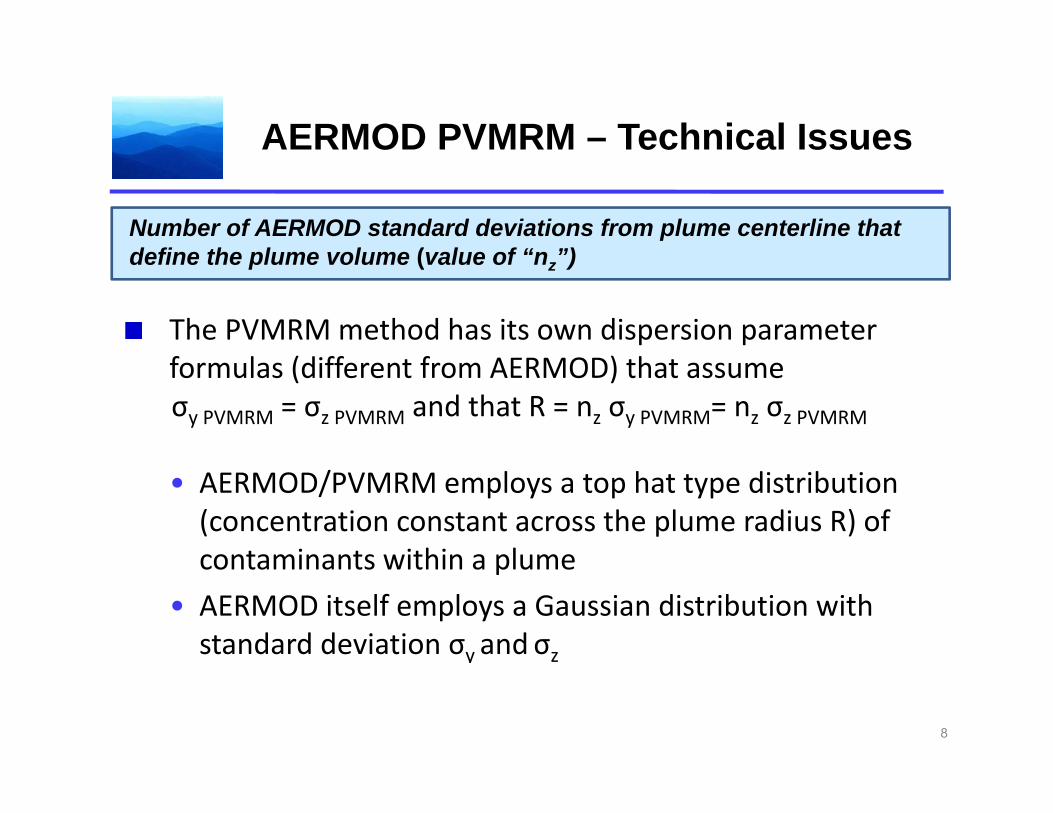
AERMOD PVMRM – Technical Issues
Number of AERMOD standard deviations from plume centerline that define the plume volume (value of “n ”)
The PVMRM method has its own dispersion parameter
define the plume volume (value of “nz”)
formulas (different from AERMOD) that assume σy PVMRM = σz PVMRM and that R = nz σy PVMRM= nz σz PVMRM
• AERMOD/PVMRM employs a top hat type distribution (concentration constant across the plume radius R) of contaminants within a plumecontaminants within a plume
• AERMOD itself employs a Gaussian distribution with standard deviation σy andσz
8
AERMOD PVMRM – Technical Issues
Number of AERMOD standard deviations from plume centerline that define the plume volume (value of “n ”)
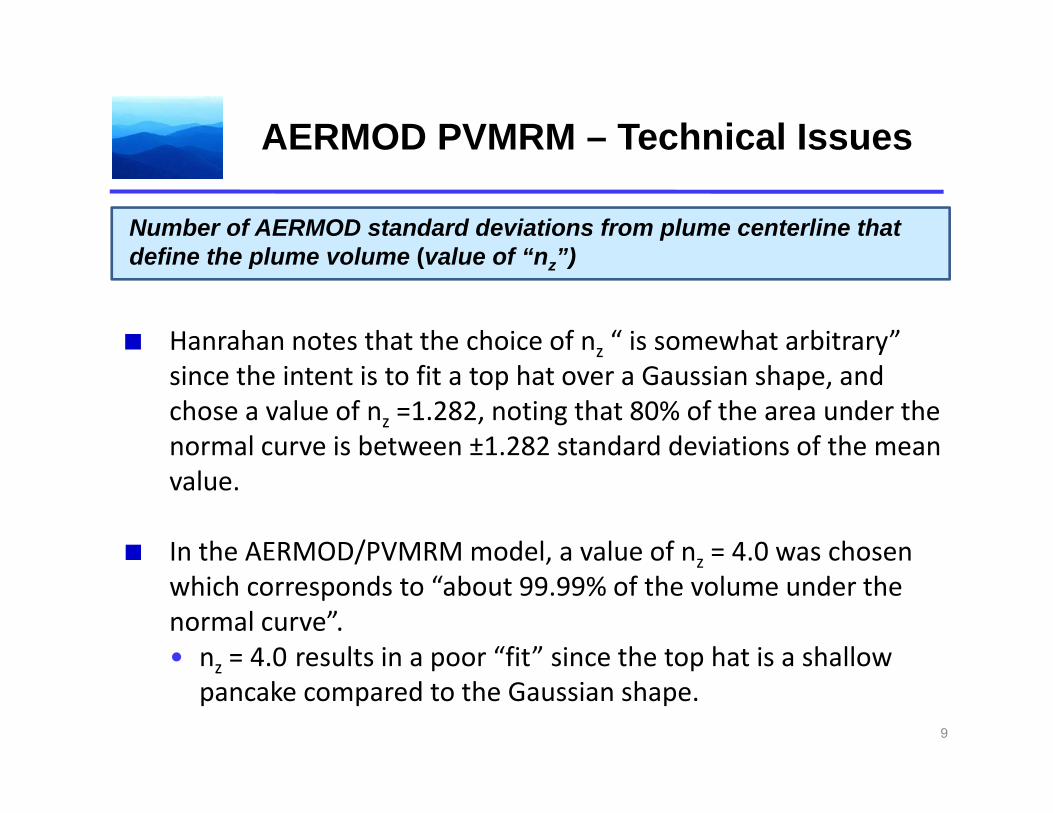
Hanrahan notes that the choice of nz “ is somewhat arbitrary”
define the plume volume (value of “nz”)
zsince the intent is to fit a top hat over a Gaussian shape, and chose a value of nz =1.282, noting that 80% of the area under the normal curve is between ±1.282 standard deviations of the mean value.
In the AERMOD/PVMRM model, a value of nz = 4.0 was chosen In the A RMO /PVMRMmodel, a value of nz 4.0 was chosenwhich corresponds to “about 99.99% of the volume under the normal curve”. • n = 4.0 results in a poor “fit” since the top hat is a shallownz 4.0 results in a poor fit since the top hat is a shallow
pancake compared to the Gaussian shape. 9
AERMOD PVMRM – Technical Issues
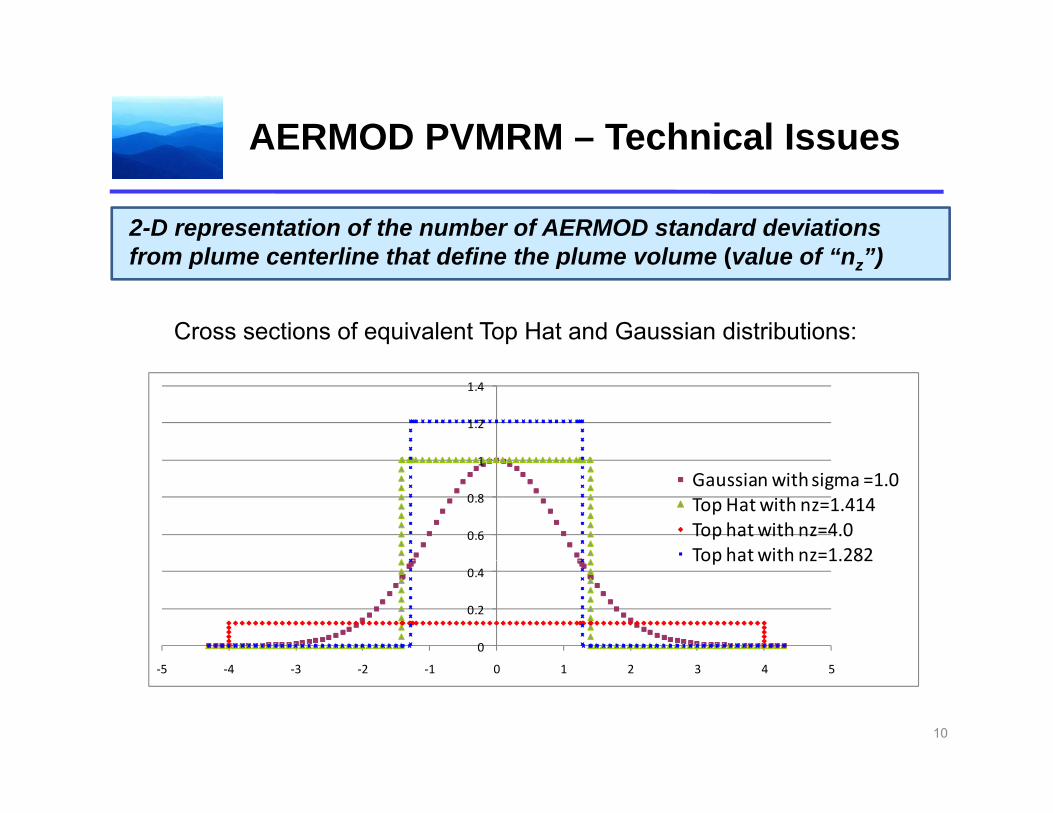
2-D representation of the number of AERMOD standard deviations from plume centerline that define the plume volume (value of “n ”)from plume centerline that define the plume volume (value of “nz”)
Cross sections of equivalent Top Hat and Gaussian distributions:
1
1.2
1.4
0.6
0.8
1
Gaussian with sigma =1.0Top Hat with nz=1.414Top hat with nz=4.0Top hatwith nz=1.282
0
0.2
0.4Top hat with nz 1.282
10
‐5 ‐4 ‐3 ‐2 ‐1 0 1 2 3 4 5
AERMOD PVMRM – Technical Issues
Number of AERMOD standard deviations from plume centerline that define the plume volume (value of “n ”)
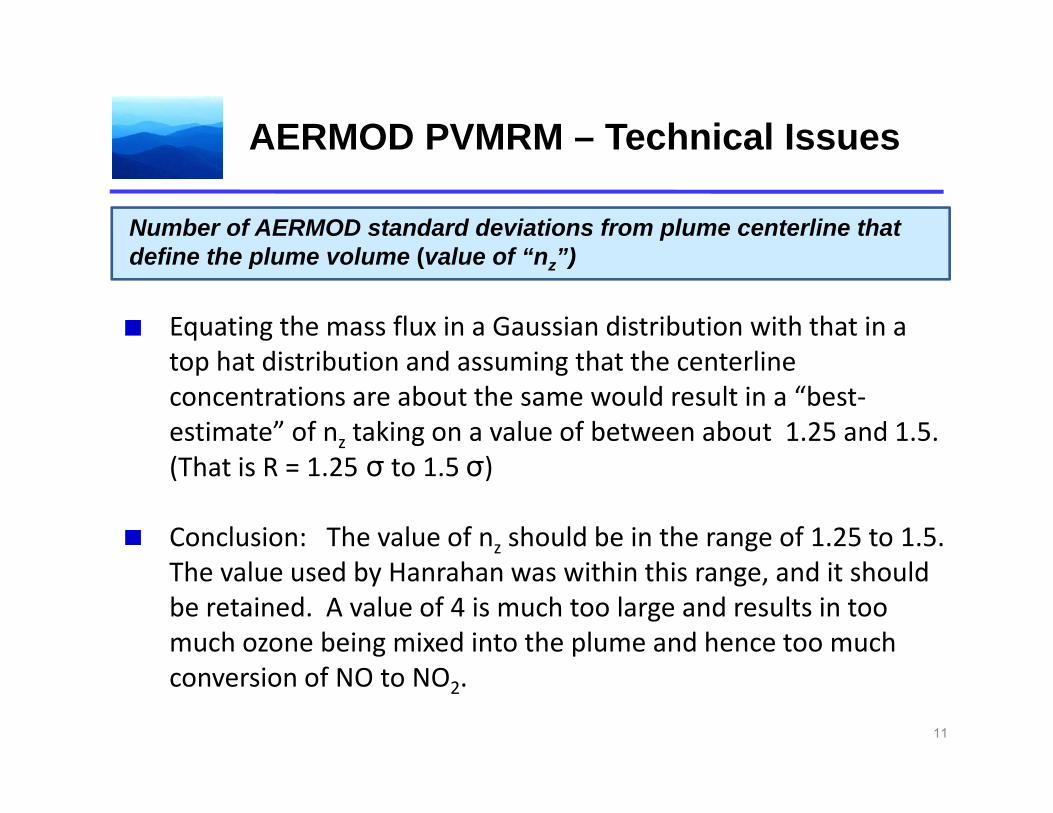
Equating the mass flux in a Gaussian distribution with that in a t h t di t ib ti d i th t th t li
define the plume volume (value of “nz”)
top hat distribution and assuming that the centerline concentrations are about the same would result in a “best‐estimate” of nz taking on a value of between about 1.25 and 1.5. (Th i R 1 25 1 5 )(That is R = 1.25 σ to 1.5 σ)
Conclusion: The value of nz should be in the range of 1.25 to 1.5. The value used by Hanrahan was within this range, and it should be retained. A value of 4 is much too large and results in too much ozone being mixed into the plume and hence too much conversion of NO to NO2.
11
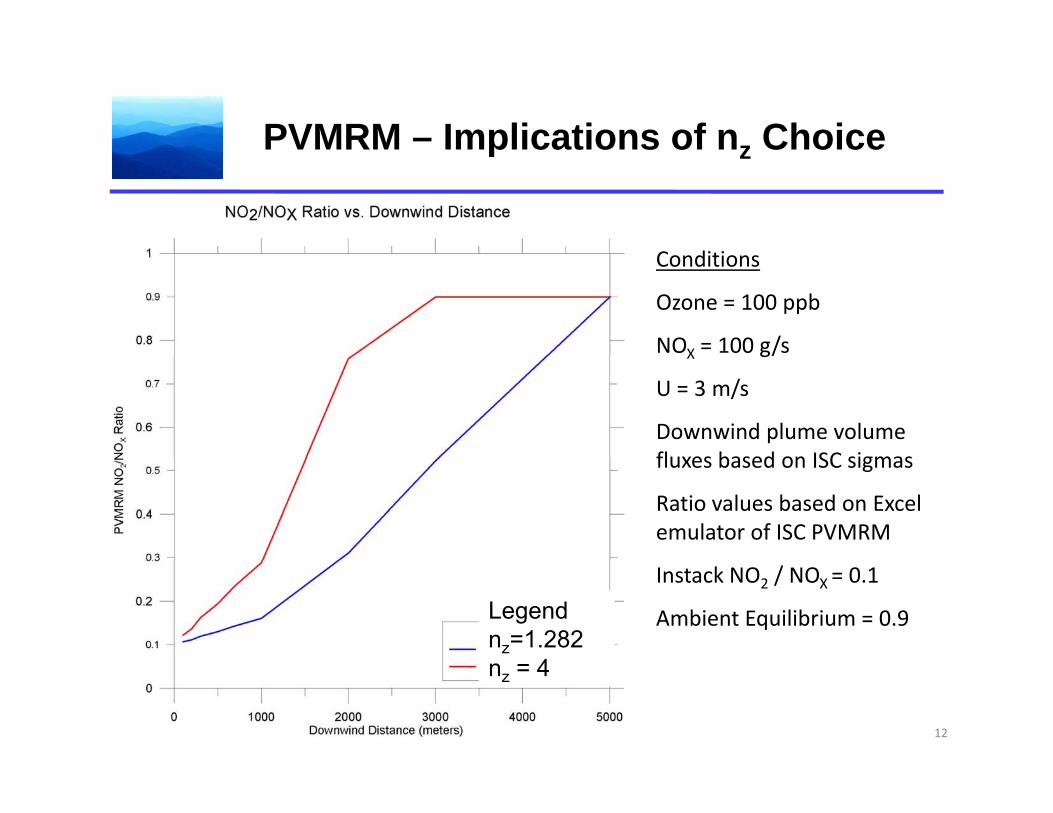
PVMRM – Implications of nz Choicep z
C ditiConditions
Ozone = 100 ppb
NOX = 100 g/sX g/
U = 3 m/s
Downwind plume volume fluxes based on ISC sigmasfluxes based on ISC sigmas
Ratio values based on Excel emulator of ISC PVMRM
Instack NO2 / NOX = 0.1
Ambient Equilibrium = 0.9Legendnz=1.282
4
12
nz = 4
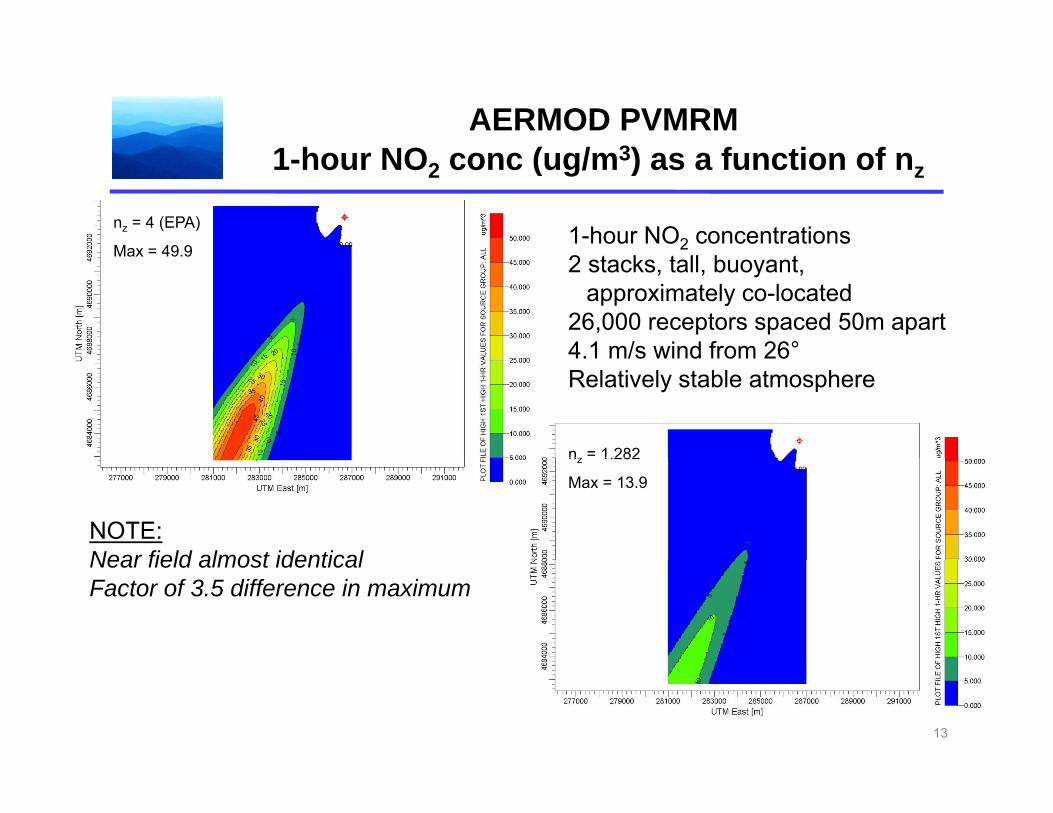
AERMOD PVMRM 1 h NO ( / 3) f ti f1-hour NO2 conc (ug/m3) as a function of nz
nz = 4 (EPA)
Max = 49 91-hour NO2 concentrations
Max = 49.9 2 stacks, tall, buoyant, approximately co-located
26,000 receptors spaced 50m apart4 1 m/s wind from 26°
nz = 1.282
4.1 m/s wind from 26Relatively stable atmosphere
nz 1.282
Max = 13.9
NOTE:Near field almost identicalNear field almost identicalFactor of 3.5 difference in maximum
13
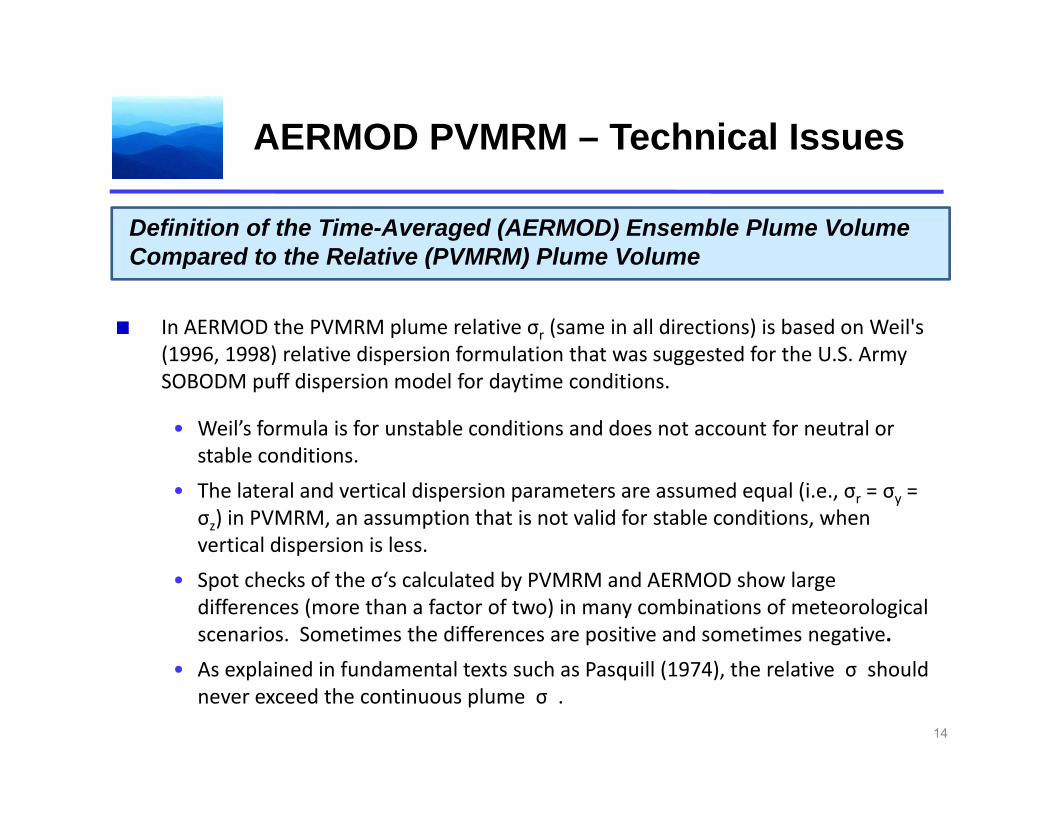
AERMOD PVMRM – Technical Issues
Definition of the Time-Averaged (AERMOD) Ensemble Plume Volume Compared to the Relative (PVMRM) Plume Volume
In AERMOD the PVMRM plume relative σr (same in all directions) is based on Weil's (1996 1998) relative dispersion formulation that was suggested for the U S Army
Compared to the Relative (PVMRM) Plume Volume
(1996, 1998) relative dispersion formulation that was suggested for the U.S. Army SOBODM puff dispersion model for daytime conditions.
• Weil’s formula is for unstable conditions and does not account for neutral or stable conditionsstable conditions.
• The lateral and vertical dispersion parameters are assumed equal (i.e., σr = σy = σz) in PVMRM, an assumption that is not valid for stable conditions, when vertical dispersion is less.
• Spot checks of the σ‘s calculated by PVMRM and AERMOD show large differences (more than a factor of two) in many combinations of meteorological scenarios. Sometimes the differences are positive and sometimes negative.
A l i d i f d l h P ill (1974) h l i h ld• As explained in fundamental texts such as Pasquill (1974), the relative σ should never exceed the continuous plume σ .
14
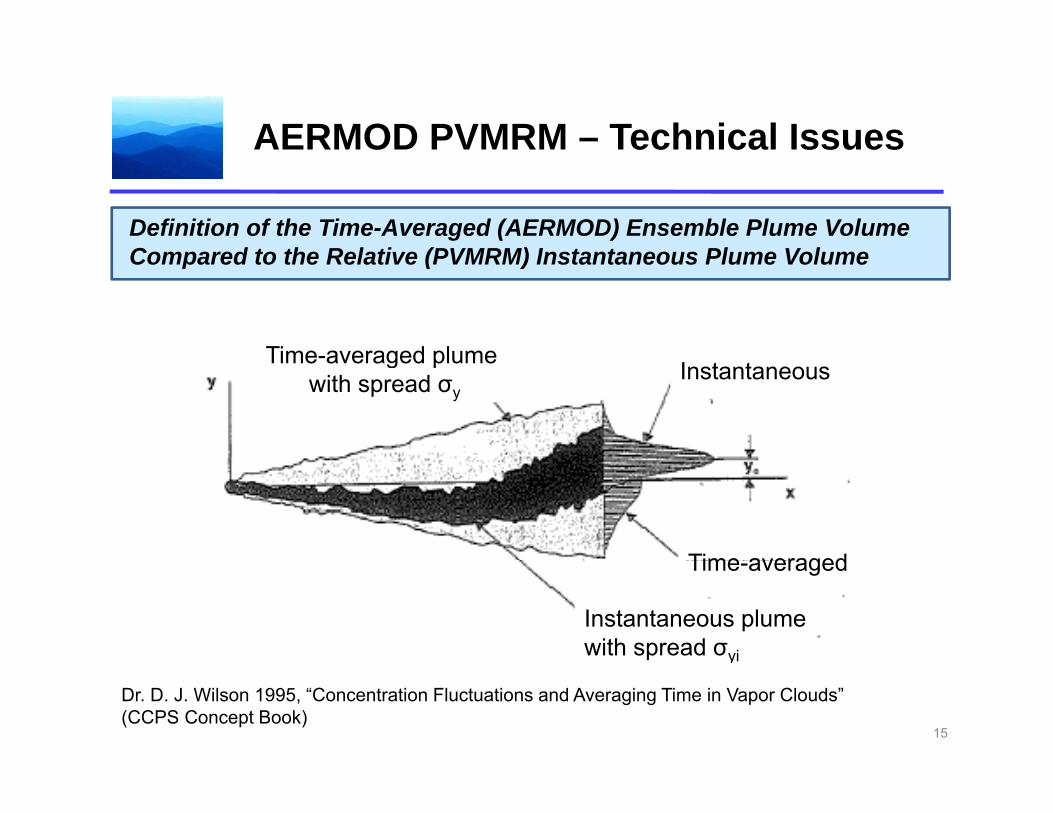
AERMOD PVMRM – Technical Issues
Definition of the Time-Averaged (AERMOD) Ensemble Plume Volume Compared to the Relative (PVMRM) Instantaneous Plume VolumeCompared to the Relative (PVMRM) Instantaneous Plume Volume
Time averaged plumeTime-averaged plume with spread σy
Instantaneous
Time averaged
Instantaneous plumewith spread σyi
Time-averaged
15
Dr. D. J. Wilson 1995, “Concentration Fluctuations and Averaging Time in Vapor Clouds” (CCPS Concept Book)
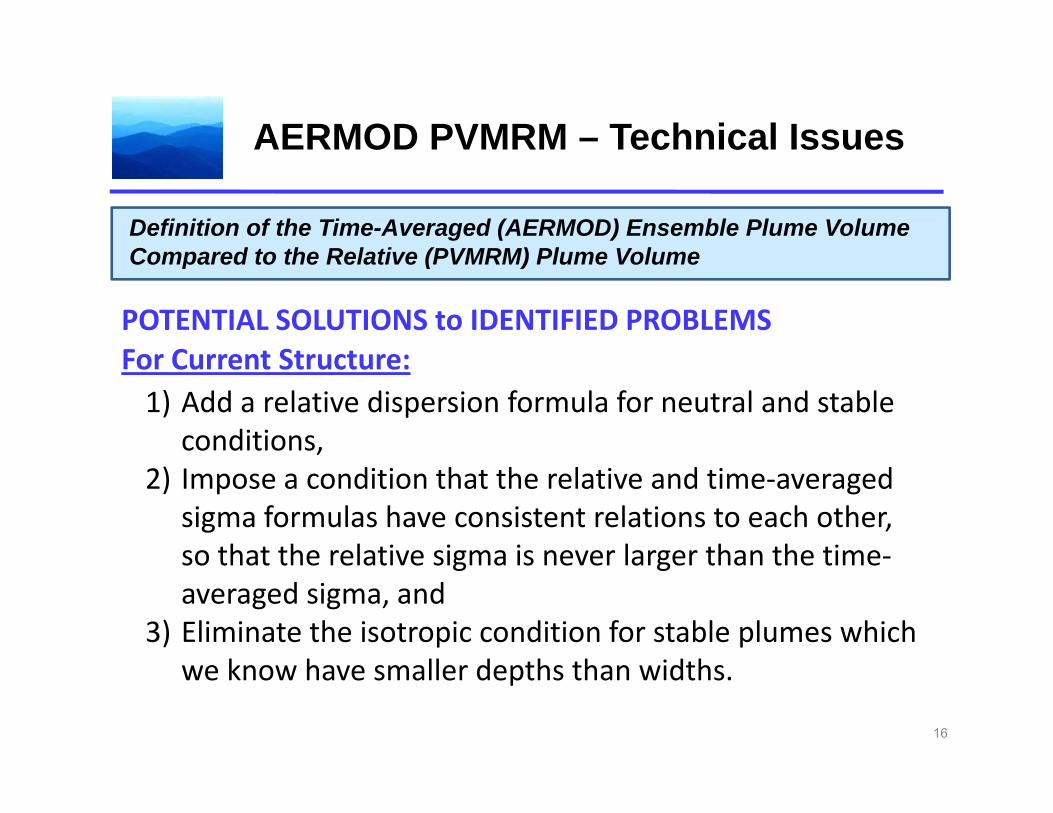
AERMOD PVMRM – Technical Issues
Definition of the Time-Averaged (AERMOD) Ensemble Plume Volume Compared to the Relative (PVMRM) Plume Volume
POTENTIAL SOLUTIONS to IDENTIFIED PROBLEMS For Current Structure:
Compared to the Relative (PVMRM) Plume Volume
For Current Structure:1) Add a relative dispersion formula for neutral and stable
conditions,2) Impose a condition that the relative and time‐averaged
sigma formulas have consistent relations to each other, so that the relative sigma is never larger than the time‐so that the relative sigma is never larger than the timeaveraged sigma, and
3) Eliminate the isotropic condition for stable plumes which k h ll d th th idthwe know have smaller depths than widths.
16
AERMOD PVMRM – Technical Issues
Definition of the Time-Averaged (AERMOD) Ensemble Plume Volume Compared to the Relative (PVMRM) Plume Volume
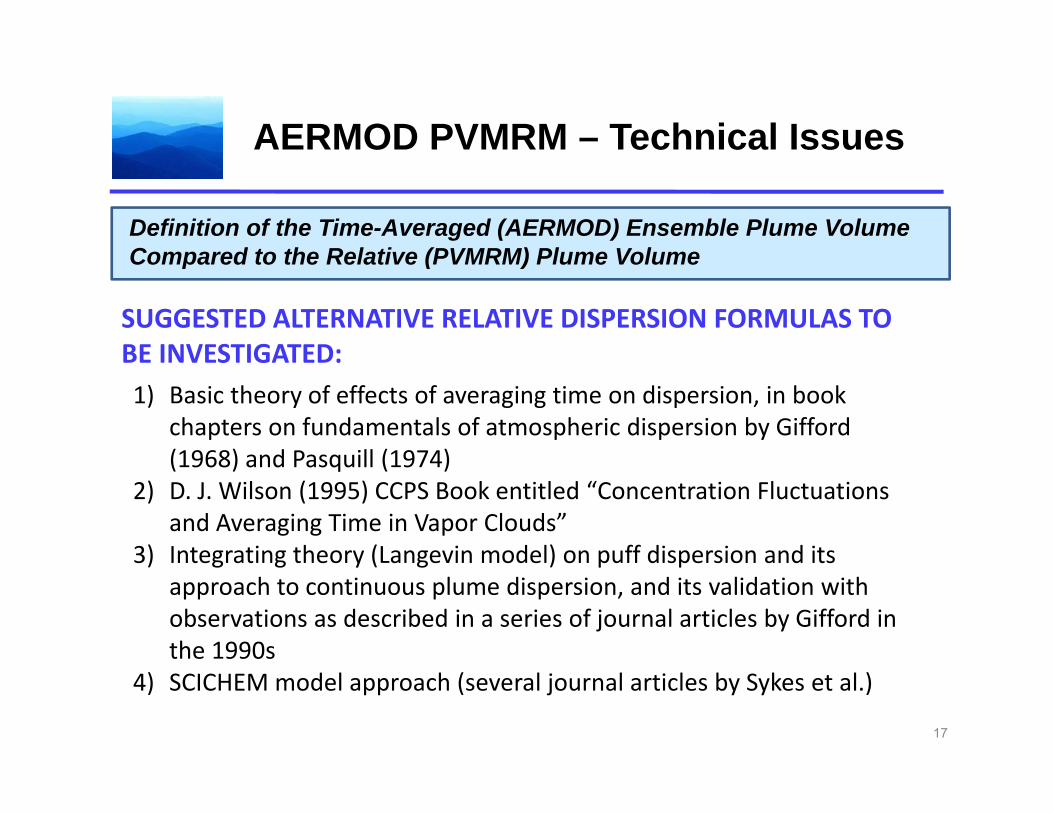
SUGGESTED ALTERNATIVE RELATIVE DISPERSION FORMULAS TO BE INVESTIGATED:
Compared to the Relative (PVMRM) Plume Volume
BE INVESTIGATED:1) Basic theory of effects of averaging time on dispersion, in book
chapters on fundamentals of atmospheric dispersion by Gifford (1968) and Pasquill (1974)(1968) and Pasquill (1974)
2) D. J. Wilson (1995) CCPS Book entitled “Concentration Fluctuations and Averaging Time in Vapor Clouds”
3) Integrating theory (Langevin model) on puff dispersion and its3) Integrating theory (Langevin model) on puff dispersion and its approach to continuous plume dispersion, and its validation with observations as described in a series of journal articles by Gifford in the 1990s
4) SCICHEM model approach (several journal articles by Sykes et al.)
17
AERMOD PVMRM – Other IssuesAERMOD PVMRM Other Issues
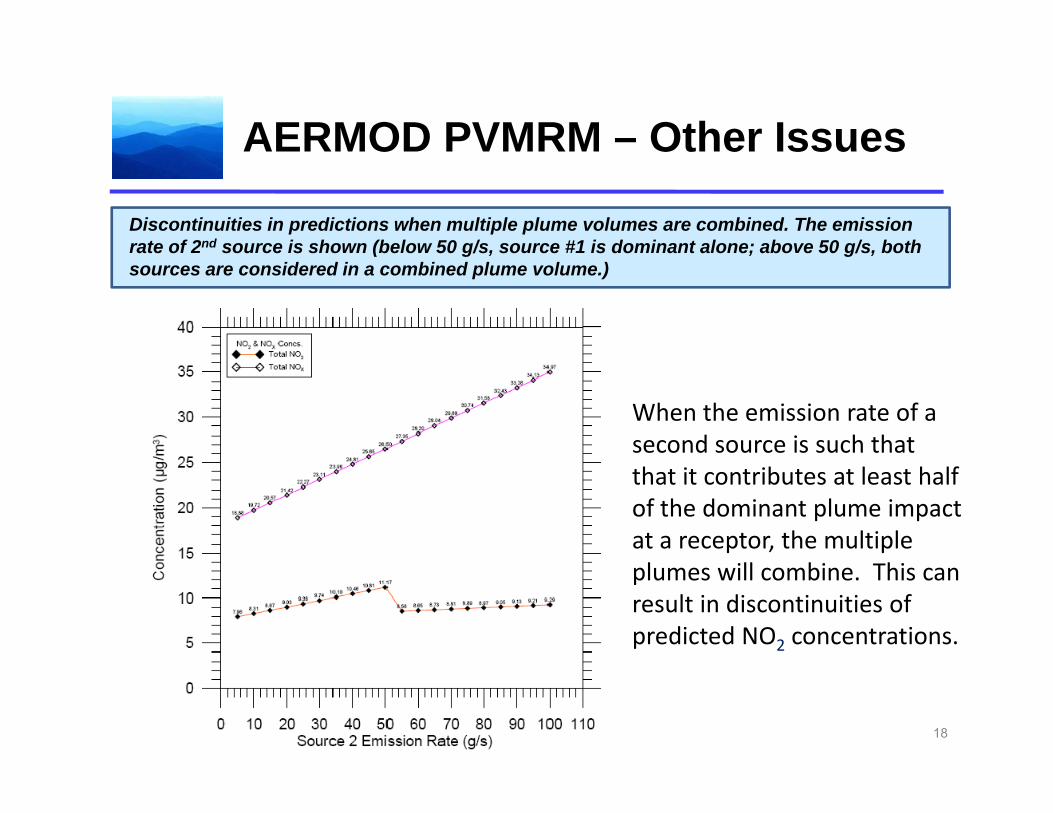
Discontinuities in predictions when multiple plume volumes are combined. The emission rate of 2nd source is shown (below 50 g/s, source #1 is dominant alone; above 50 g/s, bothrate of 2 source is shown (below 50 g/s, source #1 is dominant alone; above 50 g/s, both sources are considered in a combined plume volume.)
When the emission rate of a second source is such that that it contributes at least half of the dominant plume impact at a receptor, the multiple plumes will combine. This can result in discontinuities of predicted NO2 concentrations.
18
AERMOD PVMRM – Other IssuesAERMOD PVMRM Other Issues
Downwash Conditions
PVMRM does not appear to adjust the plume σr to account for pp j p rdownwash. Downwash should be considered in both the relative diffusion and total diffusion categories because it occurs close to the source.
Net effect would be more entrainment of ambient ozone and hence more production of NO2
Downwash is already considered in the AERMOD main plume model (i.e., total diffusion)
19
Possible Modification to Plume Model to Better A t f Pl Ed Eff tAccount for Plume Edge Effects
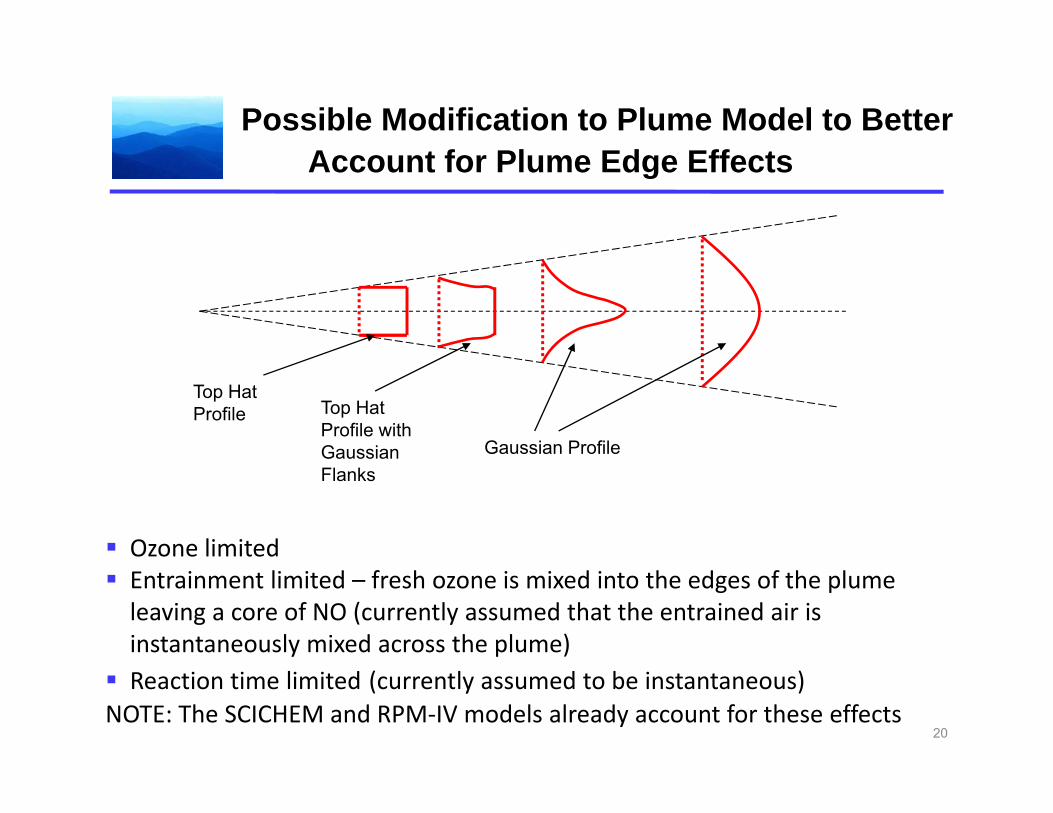
Top Hat Profile Top Hat
Profile with Gaussian Gaussian ProfileGaussian Flanks
Ozone limited Entrainment limited – fresh ozone is mixed into the edges of the plume leaving a core of NO (currently assumed that the entrained air is instantaneously mixed across the plume)
Reaction time limited (currently assumed to be instantaneous)NOTE: The SCICHEM and RPM‐IV models already account for these effects
20
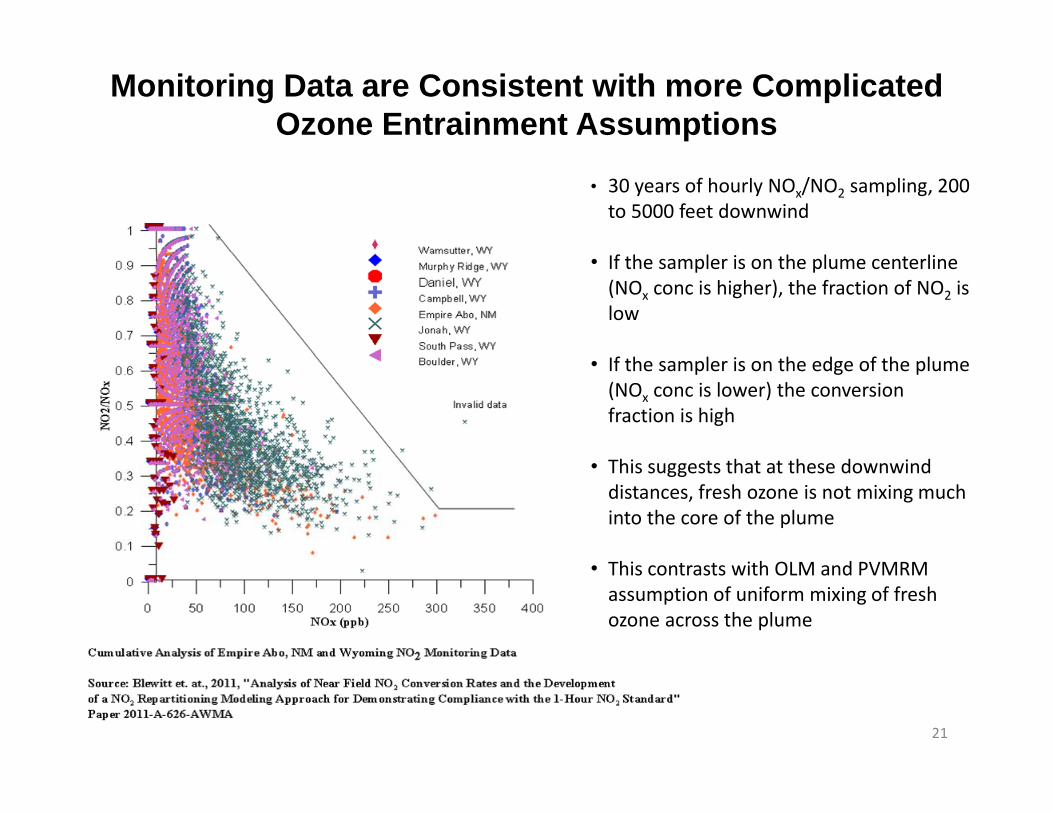
Monitoring Data are Consistent with more Complicated Ozone Entrainment Assumptions
• 30 years of hourly NOx/NO2 sampling, 200 to 5000 feet downwind
• If the sampler is on the plume centerline (NOx conc is higher), the fraction of NO2 is low
• If the sampler is on the edge of the plume (NOx conc is lower) the conversion fraction is high
• This suggests that at these downwind distances, fresh ozone is not mixing much into the core of the plume
• This contrasts with OLM and PVMRM assumption of uniform mixing of fresh ozone across the plume
21
Data Sets for OLM and PVMRM E l tiEvaluation
To conduct an appropriate model evaluation, one needs complete emissions and source parameters ambient pollutant monitoring data
Limited number of data sets used by EPA for OLM and PVMRM 1‐hr
emissions and source parameters, ambient pollutant monitoring data and meteorology
evaluations:• Empire Abo, NM ‐ gas plant (emissions are based on PTE; no data on hourly
load or fuel consumption)P l HI il fi d t bi (d t t t i ti k )• Palaau, HI – oil fired turbine (data set uncertainties unknown)
We would like to perform an independent evaluation of the above data sets
Potential data sets we are investigating:• KEMA ‐ Aircraft measurements, Arellano and Bange (source parameters were
estimated)• Alaskan Power Plant• Alaskan Power Plant• San Juan, NM Power Plant • Others? Please help us find other data bases.
22
New Model Evaluation Data Set –Al k P Pl tAlaskan Power Plant
Remote location: small village north of the arctic circleRemote location: small village north of the arctic circle
Ambient monitoring station measuring hourly NOX, NO2 and O3 concentrations and meteorological parameters (wind speed, wind direction, temperature)direction, temperature)
Local Power Plant located approximately 500 meters from the ambient monitoring station
The power plant consists of 5 diesel generators (3 CAT 3508 and 2 CAT The power plant consists of 5 diesel generators (3 CAT 3508 and 2 CAT 3512). Each generator is vented through its own stack.
Hourly operators logs are available that specify which engines are operating and the kilowatt output from each engine for each hour Anoperating and the kilowatt output from each engine for each hour. An hourly emissions file and stack parameters have been generated based on the operator logs and the Caterpillar engine performance data.
Li it ti N t k t ti h b d t d Limitations ‐ No stack testing has been conducted.
23

Potential Model Evaluation Data S t S J NM P Pl tSet – San Juan, NM Power Plant
l d l f d l Isolated coal fired power plant near Farmington, NM
Large stack height
Titl IV f ilit CEMS d t f NO Title IV facility – CEMS data for NOX
Monitored NO, NO2, NOX and O3 data
Monitored NO concentrations can be traceable to the Monitored NO2 concentrations can be traceable to the facility
Meteorological data available from State of New Mexicog
Modeling files (downwash analysis) provided by State of New Mexico
24
ConclusionsConclusions
There are some technical issues and some inconsistencies in the AERMOD PVMRM formulation for short term NO2 modeling:
• The number of AERMOD standard deviations from the plume centerline that define the plume volume (value of “nz”) is too high by about a factor of 3 or moremore
• No relative dispersion formulas are provided for stable and neutral conditions
• Currently, the relative (instantaneous) σ can exceed the continuous plume (time‐averaged) σ.(time averaged) σ.
• Discontinuities in concentration can occur for multiple plumes, with the magnitude depending on the scenario modeled
• Downwash is not consideredDownwash is not considered
OLM and PVMRM do not address the fact that ambient ozone is entrained at the edges of the plume and is not immediately mixed to the center of the plume.
We have suggested approaches to address some of these issues
25
RecommendationsRecommendations
Additional complete data sets should be evaluatedAdditional complete data sets should be evaluated
‐ One of the field data sets previously used for EPA 1‐hr evaluations is missing key inputs such as detailed stack emissions and stack dimensionsdimensions
External and independent peer review of the model science, field data sets and evaluations should be completedsets and evaluations should be completed
Other currently‐available models and approaches should be evaluated for short term NO modeling s ch as SCICHEM RPM IV and the Monitoredshort‐term NO2 modeling such as SCICHEM, RPM‐IV, and the Monitored Ratio Method/Ambient Ratio Method 2
26
Want More Information?Want More Information?
API welcomes your feedback or partnership in
For more information about air modeling projects supported by API go to:
API welcomes your feedback or partnership in supported modeling studies
For more information about air modeling projects supported by API go to:
http://mycommittees.api.org/rasa/amp/default.aspx
Final technical report for the OLM and PVMRM code review (to be posted by 7/31/2011)posted by 7/31/2011)
Information on the Ambient Ratio Method 2 Study – Use of ambient monitoring data to empirically predict NO2/NOx ratio based on NOxconcentrationconcentration
AERMOD Low Wind Speed Study ‐ Final Report
or
Contact Cathe Kalisz at [email protected] 202.682.8318
27