
Review of final results - MEGAPOLI project: Answers on ...MEGAPOLI main partners & collaborators...
31
Review of final results - MEGAPOLI project: Answers on Science Questions A. Baklanov (1), M. Lawrence (2), S. Pandis (3), R. Sokhi (4), A. Mahura (1), H. Denier van der Gon (5), M. Beekmann (6), J. Theloke (7) and MEGAPOLI Team (8) (1) Danish Meteorological Institute, (2) Max-Planck-Institute for Chemistry, Mainz, Germany, (3) FORTH, University of Patras, Greece, (4) CAIR, University of Hertfordshire, UK, (5) TNO, The Netherlands, (6) CNRS, France, (7) University of Stuttgart, Germany, (8) the MEGAPOLI team: Sandro Finardi (ARIANET), Nicolas Moussiopoulos (AUTH), Jean Sciare, Paolo Laj, Laurent Gomes, Jean-Luc Jaffrezo (CNRS), Agnes Borbon, Isabelle Coll (LISA), Valerie Gros, Jean Sciare (LSCE), Jaakko Kukkonen, Mikhail Sofiev (FMI), Stefano Galmarini (JRC), Filippo Giorgi (ICTP), Sue Grimmond (KCL), Igor Esau (NERSC), Andreas Stohl, Bruce Denby (NILU), Urs Baltensperger (PSI), Peter Builtjes, Dick van den Hout, Bill Collins (MetO), Heinke Schluenzen (Uham), Markku Kulmala, Sergej Zilitinkevich (UHel), Rainer Friedrich, Ulrike Kummer (UStutt), Liisa Jalkinen (WMO), Tomas Halenka (CUNI), Alfred Wiedensholer (IfT), John Pyle, W. B. Rossow (UCam) MEGAPOLI Web-site: http://megapoli.info Presenting author email: [email protected] NASA LCLUC Spring Science Team Meeting 2012 April 3-5, Hilton Washington DC/Rockville, USA
Transcript of Review of final results - MEGAPOLI project: Answers on ...MEGAPOLI main partners & collaborators...

Review of final results - MEGAPOLI project:
Answers on Science Questions A. Baklanov (1), M. Lawrence (2), S. Pandis (3), R. Sokhi (4), A. Mahura (1), H. Denier
van der Gon (5), M. Beekmann (6), J. Theloke (7) and MEGAPOLI Team (8)
(1) Danish Meteorological Institute, (2) Max-Planck-Institute for Chemistry, Mainz, Germany, (3) FORTH,
University of Patras, Greece, (4) CAIR, University of Hertfordshire, UK, (5) TNO, The Netherlands, (6) CNRS,
France, (7) University of Stuttgart, Germany,
(8) the MEGAPOLI team: Sandro Finardi (ARIANET), Nicolas Moussiopoulos (AUTH), Jean Sciare, Paolo Laj,
Laurent Gomes, Jean-Luc Jaffrezo (CNRS), Agnes Borbon, Isabelle Coll (LISA), Valerie Gros, Jean Sciare
(LSCE), Jaakko Kukkonen, Mikhail Sofiev (FMI), Stefano Galmarini (JRC), Filippo Giorgi (ICTP), Sue
Grimmond (KCL), Igor Esau (NERSC), Andreas Stohl, Bruce Denby (NILU), Urs Baltensperger (PSI), Peter
Builtjes, Dick van den Hout, Bill Collins (MetO), Heinke Schluenzen (Uham), Markku Kulmala, Sergej
Zilitinkevich (UHel), Rainer Friedrich, Ulrike Kummer (UStutt), Liisa Jalkinen (WMO), Tomas Halenka (CUNI),
Alfred Wiedensholer (IfT), John Pyle, W. B. Rossow (UCam)
MEGAPOLI Web-site: http://megapoli.info
Presenting author email: [email protected]
NASA LCLUC Spring Science Team Meeting 2012
April 3-5, Hilton Washington DC/Rockville, USA

Megacities: Emissions, Impact on Air Quality and
Climate, and Improved Tools for Mitigation
Assessments (MEGAPOLI) EC 7FP project for: ENV.2007.1.1.2.1. Megacities and regional hot-
spots air quality and climate
Project duration: 2008 – 2011
27 European research organisations from 11 countries are involved
Coordinator: A. Baklanov (DMI)
Vice-coordinators: M. Lawrence (MPIC) and S. Pandis (FORTH)
(Project web-site: http://megapoli.info )
The main aim of the project is
(i) to assess impacts of growing
megacities and large air-pollution
“hot-spots” on air pollution and
feedbacks between air quality,
climate and climate change on
different scales, and
(ii) to develop improved integrated
tools for prediction of air pollution
in cities.
• Urban (and Regional and Global and some Street) Scale Modelling
• Available and New Observations
• Tool Application and Evaluation
• Mitigation
• Policy • Regional (and Global and
some Urban) Modelling
• Available Observations
• Implementation of Integrated Tools
• Global Modelling
• Satellite studies
Paris, London,
Rhine-Ruhr, Po Valley
Moscow, Istanbul, Mexico City, Beijing, Shanghai, Santiago, Delhi,
Mumbai, Bangkok, New York, Cairo, St.Petersburg, Tokyo
All megacities: cities with a population > 5 Million
1st
Level
2nd
Level
3rd
Level

MEGAPOLI main partners & collaborators (blue – 27 teams from 11 countries EC funded, green/red - external partners/end-users
• Sister EC FP7 project CityZen
• Daughter Russian project Megapolis
• A number of collaborating projects in US (eg
LCLUC, MILAGRO), Europe (eg PBL-PMES), etc
• French co-project and many international volunteer
partners for Paris campaign
• WMO GURME, IGAC, IPCC, COST programs and
networks

Connections between Megacities,
Air Quality and Climate
• Science - nonlinear
interactions and feedbacks
between urban land cover,
emissions, chemistry,
meteorology and climate
• Multiple spatial and
temporal scales
• Complex mixture of
pollutants from large sources
• Scales from urban to global
• Interacting effects of urban
features and emissions
• Integrated UAQIFS for
megacities
• 11 scientific questions and
tasks

Task 1: Develop and evaluate integrated methods to
improve megacity emission data
SQ4: How accurate are the current emission
inventories for megacities in Europe and around the
world? What are the major gaps?

MEGAPOLI Emission Inventories
TNO: Denier van der Gon et al.
Ile de France emissions of PM10
0
5000
10000
15000
20000
25000
Energ
y indu
stry
Res
iden
tial c
ombu
stion
Indu
stria
l com
bustion
Indu
stria
l pro
cess
es
Fugitive
s
Solve
nt use
Roa
d tra
nspo
rt
Oth
er tr
ansp
ort
Was
te
Agricultu
re
Nat
ural /
Other
SNAP
Em
iss
ion
(to
n)
TNO_MP_2005
AirParif
• In MEGAPOLI a state-of-the-art (global and) regional European (6x7km) emission data base was combined and cross-checked with bottom-up emission inventories (1x1km) for Paris, London, Rhine-Ruhr area (Germany) and the Po-valley (Italy).
• The allocation of the emission in the regional down-scaled inventory can deviate substantially (up to a factor of 4) from the MC bottom-up inventories.
• The major discrepancies caused by e.g. residential combustion and industry sectors were documented and explained.
• Emission inventories are not consistent across scales and this is likely to have significant impact on predicted air pollution and exposure levels.
• New method for determination of megacity NOx emissions and lifetimes from satellite measurements was developed (Beirle et al., Science, 333, 2011)
• Anthropogenic heat flux (AHF) model was developed and used to compute the AHF inventories for globe, Europe and London.

What are the major gaps in MC emissions?
• Compared 3 global EIs and 2 city-level inventories: large differences (factor of 2)
• GEIs underestimate emissions from European and Chinese MCs and overestimate emissions in LA and in Asia (except China)
• MCs in Europe and N & S America, transport is dominating for CO and NOx; in Asia and Africa: CO - dominated by residential biofuel use, NOx - industrial emissions
Key gaps in our knowledge:
• initial process of developing emissions databases
• variation in fuels, its quality and appliance types between MC and country
• identifying which emissions should be associated with MCs
• notable differences in per capita emissions from the various MCs: reasons?
=> Recommendations for how to reduce or minimize emissions in MCs
(Butler et al., Atmos. Env., 42, 2008)
Average emission of Black Carbon varies from 0.4 kg/capita
in MCs of Europe to 1.2 kg/capita in Asian MCs, respectively
H. Denier van der Gone, TNO

Task 2: Investigate physical and chemical processes
starting from the megacity street level, continuing to
the city, regional and global scales
SQ3: What are the major physical and chemical
transformations of air pollutants as they are moving
away from megacities? What happens to the organic
particulate matter, volatile organic compounds, etc?

Main achievements: • The pollution plume was still well defined at more than 100 km downwind from the agglomeration, which
gives a clear framework for studying SOA build-up in the plume.
• Significant new particle formation events were frequently observed during the campaigns.
• During the winter campaign, large PM levels were observed both due to a strong local wood burning source
and due to continental advection.
• Database for model studies and validation is available
• Special issue of ACP is focusing on the MEGAPOLI Paris study results
(Courtesy of Monica Crippa et al.; PSI Team)
Paris Measurement Campaigns
• Aim: Provide new experimental data to better quantify sources of pri-mary and secondary carbonaceous aerosol in a megacity and its plume
• Summer – 1-31 Jul 2009, Winter – 15Jan-15Feb 2010 • 30 research institutions from France and other European conutries, both
MEGAPOLI Teams and Collaborators
Lead by M. Beekmann, CNRS & U. Baltensperger, PSI

Major transformations of air pollutants in MC plume
Physical changes:
• Dilution: reduces rapidly (10s km) passive concentrations;
Paris plume for BC and VOCs could up to 150 km
• UHI increases urban BL height and effects MC plume mixing
• Evaporation of semi-volatile particulate matter components
• Rapid dry deposition of nitric acid, etc.; wet deposition
Chemical changes:
• Formation of ozone, sulfates, and secondary PM; max O3 and
SO4 downwind of MCs
• Organic PM exported by MCs is quite different chemically
from that emitted by the sources inside MC
• Aged organic PM is a lot more hygroscopic and less volatile
than the original PM
Comparisons of OA, NO3, SO4, NH4, BC from
measurement (left) and CHIMERE (right), July 16
LISA contribution
Average fine particulate nitrate
concentrations in and around Mexico
City (210x210 km) during MILAGRO .
The secondary peak (about 10% of
max peak in city center) within 50 km
from Center due to a combination of
dilution, evaporation, and rapid dry
deposition of nitric acid.
FORTH contribution

Task 3: Assess regional and global impacts of megacity
plumes, including: atmospheric transport (local pollution
build-up and its regional/global transport) and chemical
transformation of gas and aerosol pollutants emitted in
megacities
SQ2: How do megacities affect air quality on regional and
global scales? What is the range of influence for major air
pollutants (ozone, particulate matter, etc.)?
SQ7: What is the impact of large-scale dynamic processes on
air pollution from megacities?

How do megacities affect air quality on regional and global scales?
What is the range of influence for major air pollutants?
• MC impacts are quite variable in space and time and are often in directions
different than that of the average prevailing winds.
• Average transport distance for elemental carbon and other primary fine PM
components are around 100-200 km for MCs examined.
• Secondary PM species were found to be transported the furthest with sulfate
and secondary organic aerosol often transported on average over 350 km.
• Maximum transport distances are significant higher, with secondary
particulate matter impacts reaching as far as 2000 km away from MC.
• MC impacts on atmospheric composition of surrounding regions can be
substantial, esp. for primary pollutants (> 50% increases NOx).
• MCs tend to cause a decrease of O3 mixing ratios in cities, while increasing
O3 downwind of the cities (by up to 10 ppb).
• Globally MCs impacts on total burdens of directly emitted gases are
comparable to their relative contribution to the global total emissions (several
%), while the impact on global O3 is much smaller (< 1%).
• European MCs (St.Petersburg, Moscow, Ruhr Valley) are most significant
contributors to deposition of aerosols in Arctic.
• Significant impact of Boston – New York – Washingt on the atmospheric
chemistry of Europe was not found to be the case.
07h
13h
19h
Simulated CHIMERE urban OA
Paris plume on July 16 2009 at
different times. Courtesy to Q;J.
Zhang CNRS-LISA, from Del. 3.6.

Task 4: Determine the main mechanisms of regional
meteorology/climate forcing due to megacity plumes
Task 5: Assess global megacity pollutant forcing on
climate
SQ5: How large is the current impact of megacities on
regional and global climate/meteorology?
SQ6: How will the growth of megacities affect future
climate at global and regional scales?

SQ5: How large is the current impact of MCs on local
and regional climate?
• MCs have strong UHI, due to differences in surface properties and waste heat from anthropogenic
activity, and can be warmer than surrounding rural environments by up to 10°C.
• Anthropogenic heat fluxes for megacities can be very high: up to 50-500 W/m2, locally reaching
1500 W/m2.
• MCs impacts the local environment directly and affects the regional air circulation due to UHI,
increased roughness and urban aerosol forcing.
<= Anthropogenic heat flux
(AHF) for Europe and
London. (D1.4 Rep: L Allen et
al., KCL, 2010)
RegCM study for all aerosol
(AER) and MCs only (MEG)
Average JJA 2001-2010. =>
(ICTP contribution, F.Solmon)

How large is current impact of MCs on global climate?
MCs contribute a global warming of over 0.2 K after 100 years, with nearly 90% of this being due to
carbon dioxide emissions, and most of the rest due to methane.
MCs impact by NOx, VOC and aerosols on global climate under present time (2005) includes 4
main direct radiative forcing impacts of megacity pollutants:
• Ozone production: +5.7±0.02 mW/m2
• Reduction of the methane lifetime due to OH radical production: -2.1±0.13 mW/m2
• Short-wave direct forcing from aerosols: -6.1±0.21 mW/m2
• Long-wave direct forcing from aerosols: +1.5±0.01 mW/m2
Combined effect of all of these individual terms is a rather small negative forcing, that is a cooling,
of -1.0±0.32 mW/m2 under present-day conditions.
(a) (b)
Global distribution of - (a) short-wave, SW all-sky and (b) long-wave, LW clear sky - top-of-atmosphere (TOA) radiative
forcing due to aerosols from megacities /Forcing is denoted in W/m2
MetO: Folberth et al., 2010

Task 6: Examine feedback mechanisms including effects
of climate change on megacity air quality
SQ8: What are the key feedbacks between air quality,
local climate and global climate change relevant to
megacities? For example, how will climate change affect
air quality and microclimate in megacities?
SQ9: How should megacities (emissions, processing
inside megacities, meteorology) be parameterised in
regional and global models?

MP hierarchy of urban canopy schemes for
different type and scale models:
• Simple modification of land surface schemes
(AHF+R+A)
• Medium-Range Forecast Urban Scheme (MRF-
Urban)
• Building Effect Parameterization (BEP)
• Town Energy Budget (TEB) scheme
• Soil Model for Sub-Meso scales Urbanised version
(SM2-U)
• UM Surface Exchange Scheme (MOSES)
• Urbanized Large-Eddy Simulation Model (PALM)
•CFD type Micro-scale model for urban environment
(M2UE)
Main types of UC schemes:
• Single-layer and slab/bulk-type UC schemes,
• Multilayer UC schemes,
• Obstacle-resolved microscale models
Strategy to urbanize different models
D2.4 report - Mahura & Baklanov, 2011
Scales
Urban Modules
Local
Street DistrictStreet District
SM2-U
BEP
MRF-UrbanMOSES
PALM
AHF+R+A
Urban
City/ MegacityCity/ Megacity
Regional
Megacity/ Large Metropolitan AreaMegacity/ Large Metropolitan Area
Global
Climate-Meso-LES-
≤0.1km 10-15km 25-50km3-5km1-3km0.1-1km
Computational time (1 urban grid cell)Computational time (1 urban grid cell)
TEB
M2UE

Observations vs. Modeling Results
NOx concentration in the street canyon
on 5 Sep 2011, 15:00 LST
(observations from
http://www2.dmu.dk/atmosphericenvironme
nt/byer/forside.htm) DMI MACC report by Nuterman et al., 2011

• Direct effect decrease solar/ thermal-IR radiation and visibility; warming: GHGs, BC, OC, Fe, Al, polycyclic/nitrated aromatic compounds
cooling: water, sulfate, nitrate, most OC
(scattering, absorption, refraction, etc.)
• Semi-direct effects affect PBL
meteorology and photochemistry;
• First indirect effect affect cloud
drop size, number, reflectivity, and
optical depth via CCN;
• Second indirect effect affect cloud
liquid water content, lifetime, and
precipitation;
• All aerosol effects (nonlinear interaction)
High-resolution on-line models with a detailed description of the PBL
structure are necessary to simulate such effects
On-line integrated models are necessary to simulate correctly the effects
involved 2nd feedbacks
Urban Aerosol Effects on Atmospheric Processes

What are the key feedbacks between air quality, local
climate and global climate change relevant to megacities?
• Direct impact of climate change on air quality in MCs is significant due to temperature (BVOC fluxes, wild fires, deposition, O3, CH4, SOA, pSO4, pNO3), radiation (photolysis), clouds, precipitation change.
• In changing climate O3 concentrations will further increase if no emission reduction measures take place, however expected O3 emission reduction gives stronger decrease of O3 concentrations.
• Coastal megacities climate change-induced increase in the temperature gradient between land and sea resulting in more intensive and frequent sea breeze events and associated cooler air and fog.
• The impact of the direct aerosol effect was found to be substantial with regard the turbulent characteristics of the flow near the surface.
• Aerosol indirect effects can significantly modify meteorological parameters, such as daytime temperatures and PBL height, while NO2 concentrations are moderately affected.
• Compared to the direct and indirect aerosol feedbacks, urban feedbacks exhibit the same order of magnitude effects on mixing height, but with strong sensitivity of chemistry and a strong non linearity.
Indirect aerosol effects by EnviroHIRLAM:
Monthly averaged CCN number concentration
(x107 m-3) at 850 hPa, Korsholm et al, DMI
AUTH comparison timeseries of PM10 concentra-
tions calculated by taking into account (“coupled”)
or without (“baseline”) the direct aerosol effect.
Difference plots for 2 m temperature (ºC) for
Paris metropolitan area between outputs of the
urbanized vs. control runs of Enviro-HIRLAM
on 21.07.2009 at 6 UTC, Gonzalez et al, DMI

Task 7: Develop integrated tools for prediction of
megacity air quality
Task 8: Evaluate these integrated tools and use them
in case studies
Q10: What type of modelling tools should be used for
the simulation of multi-scale megacity air quality -
climate interactions?

Methodology and Research Tools Multi-scale modelling Chain / Framework: from Street to Global
• Land-use characteristics and scenarios
• Anthropogenic heat fluxes
• Emission inventories and scenarios
• Atmospheric processes model down- and up-scaling
Two-way Nesting, Zooming, Nudging, Parameterizations, Urban increment methodology (AUTH)
Temporal and spatial scales and ways of integration: • Level 1 – Spatial: One way (Global -> regional -> urban -> street);
• Level 2 – Spatial: Two way (Global <=> regional <=> urban);
• Level 3 – Time integration: Time-scale and direction; Direct and Inverse modelling.
ACT, Meteorology, Climate Models
Global: ACT: MPIC, MACC; GCM: UKMO;
Regional: ACTM Ensemble, RCM: RegCM, ..
Megacity: Enviro-HIRLAM, MEMO, METRAS,
PMCAMx, …;
Street: LES, M2UE, MIMO, MITRAS, …

Schematic diagram of the offline and online
coupled ACT & NWP/CC modelling approaches
Online coupling can be archived through the use of various available coupling tools or through directly
inlining the chemical and aerosol modules into the NWP models.
Order of integration and complexity:
• Order A – off-line coupling, meteorology / emissions -> chemistry; Models: All.
• Order B – partly online coupling, meteorology -> chemistry & emission; Models: UKCA, M-SYS, UM/WRFChem,
SILAM.
• Order C – fully online integrated with two-way feedbacks, meteorology <=> chemistry & emissions; Models: UKCA,
WRF-Chem, Enviro-HIRLAM, EMAC (former ECHAM5/MESSy).

Task 10: Develop a methodology to estimate the impacts of
different scenarios of megacity development on human health
and climate change
Task 11: Propose and assess mitigation options to reduce the
impacts of megacity emissions
SQ11: Which policy options are available to influence the
emissions of air pollutants and greenhouse gases in megacities
and how can these options be assessed?
SQ1: What is the change of exposure of the overall population to
the major air pollutants as people move into megacities? What
are the health impacts of this exposure?
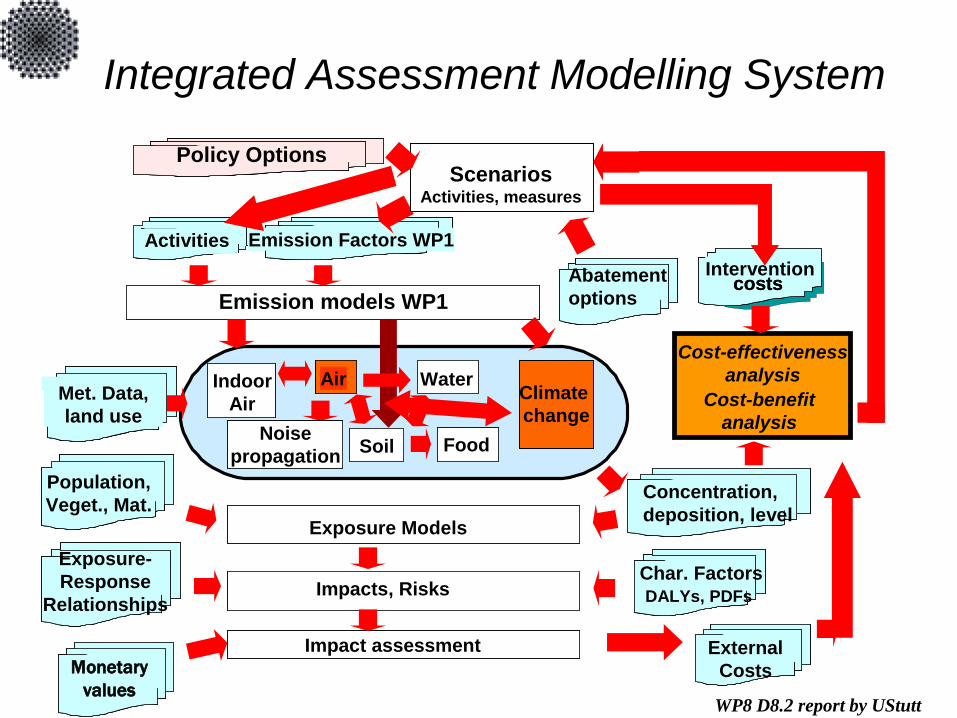
Integrated Assessment Modelling System
Population,
Veget., Mat.
ActivitiesActivities Emission Factors WP1Emission Factors WP1
Exposure Models
Exposure-
Response
Relationships
Emission models WP1
Cost-effectiveness
analysis
Cost-benefit
analysis
Indoor
Air
Air
Soil
Water
Impacts, Risks
Impact assessment
Interventioncosts
Interventioncosts
Interventioncosts
Monetary
values
Char. Factors
DALYs, PDFs
Policy OptionsPolicy Options
Met. Data,
land use
Met. Data,
land use
Food
Climate
change
ScenariosActivities, measures
ScenariosActivities, measures
Noise
propagation
External
Costs
Abatement
options
Concentration,
deposition, level
WP8 D8.2 report by UStutt

SQ11: Which policy options are available to influence the
emissions of air pollutants and greenhouse gases in megacities
and how can these options be assessed?
• MCs present a major challenge for the
regional and global environment.
• Adaptation by humans to significant climate
change in major MC areas is possible.
• Well-planned, densely populated settlements
can reduce the need for land conversion and
provide proximity to infrastructure and
services, but sustainable development must
also include:
(i) appropriate air quality management plans;
(ii) adequate access to clean technologies;
and
(iii) improvement of data collection and
assessment.
• Successful result will be to arrive at
integrated control and mitigation strategies
that are effectively implemented and
embraced by the public.
0
10000
20000
30000
40000
50000
60000
To
tal fi
nal en
erg
y c
on
su
mp
tio
n [
PJ]
Others (Methanol,Hydrogen)
Waste
Renewables
Heat
Electricity
Gas
Petroleum products
Coal
Development of the total final energy consumption for
EU-30 in the baseline scenario. UStutt contribution

Considered Measures and Policy Options • Energy sector (LCP) =>2 measures
• Energy sector (Small combustion) =>5 measures
• Industry =>4 measures
• On-road => 9 measures
• Off-road => 4 measures
Pollutants: GHG, NOx, SO2, NMVOC, NH3, PM10, PM2.5
0
5000
10000
15000
SC
P_
001
SC
P_
005
RT
3
SC
P_
002
IND
_00
3
OT
1
RT
2
RT
6
DA
LY
Avoided DALYs (Paris Area)
2030 2050
0
500
1000
1500
2000
SC
P_
001
OT
3
RT
3
LC
P_0
01
SC
P_
004
IND
_00
2
RT
2
RT
6
DA
LY
Avoided DALYs (London Area)
2030 2050
0
5000
10000
15000
IND
_00
1
SC
P_
001
RT
9
LC
P_0
01
RT
7
IND
_00
3
RT
2
RT
1
DA
LY
Avoided DALYs (Po Valley)
2030 2050
The measures with the most avoided DALYs for the whole European domain for 2030 are:
• Replacement of solid fuels fired small combustion plants with efficient combustion techniques (SCP1)
• Combined climate protection measures in cement industry (IND1)
• Energy-efficient modernisation of old buildings (SCP3)
For 2050 the energy efficient modernization of old building becomes more effective than the cement
industry measures.
Ranking of the measures with the most avoided DALYs (disability adjusted life years)
WP8 D8.3 report by J. Theloke et al., UStutt

MEGAPOLI Dissemination
• MEGAPOLI public web-site: http://megapoli.info
• MEGAPOLI Newsletter (12 issues and Volume)
• MEGAPOLI Sci. Reports (>50)
• Several Books published by Springer, etc.
• 3 Science Journal Special Issues
• A number of scientific papers (>70 and rising)

After MEGAPOLI:
• COST Action ES1004: EuMetChem - European Framework for Online Integrated Modelling (http://eumetchem.info)
• GURME WMO program - The GAW Urban Research Meteorology and Environment (http://mce2.org/wmogurme/)
• FP7 EC PEGASOS: Atmospheric chemistry and climate change interaction (http://pegasos.iceht.forth.gr/)
• FP7 EC TRANSPHORM - Transport related Air Pollution and Health impacts – Integrated Methodologies for Assessing Particulate Matter (http://transphorm.eu)
• FP7 EC MACC - Monitoring of Atmosphere Composition and Climate (http://www.gmes-atmosphere.eu/)
• FP7 EC UHI - Urban Heat Island studies within the OP Central Europe Project UHI
SUBMIT YOUR PAPER NOW!
http://ees.elsevier.com/uclim/