Review of Coal Fired Power Stations: Attachment C
33
EPA 2018P0702 NSW Environment Protection Authority Review of Coal Fired Power Stations Air Emissions and Monitoring Attachment C: Compliance with Air Emission Limits, Monitoring and Reporting Requirements
Transcript of Review of Coal Fired Power Stations: Attachment C

EPA 2018P0702
NSW Environment Protection Authority Review of
Coal Fired Power Stations Air Emissions and
Monitoring
Attachment C:
Compliance with Air Emission Limits, Monitoring and Reporting
Requirements

Contents Purpose ................................................................................................................................................................ 1
1) Overview of Power Station Regulatory Requirements ................................................................................ 2
1.1 Protection of the Environment Operations Act (1997) ....................................................................... 2
1.2 POEO (Clean Air) Regulation ................................................................................................................ 2
1.3 Regulatory Air Emission Limits ............................................................................................................ 5
2) Compliance with EPL Monitoring Requirements ......................................................................................... 6
2.1 Pollutants Sampled and Sampling frequency ...................................................................................... 6
2.2 Emission Testing Companies and Accredited Laboratories ............................................................... 12
2.3 Sampling Methods ............................................................................................................................. 12
3) Compliance with EPL Air Emission Limits .................................................................................................. 13
3.1 EPL Air Emission Limits – Identified non‐compliances ...................................................................... 15
3.2 Bayswater Non‐Compliance: Total Fluoride ...................................................................................... 17
3.3 Mount Piper Non‐Compliance: Sufuric Acid Mist .............................................................................. 20
4) Compliance with Regulatory Reporting Requirements ............................................................................. 26
4.1 Annual Returns .................................................................................................................................. 26
4.2 Published Monitoring Data ................................................................................................................ 27
4.3 EPL Reporting Limits .......................................................................................................................... 28
4.4 EPL Reporting Limits ‐ Non‐Compliance reports ............................................................................... 29
4.5 EPL Reporting Limits – Non‐Compliances .......................................................................................... 29
4.6 Liddell Reporting Limit Exceedances ................................................................................................. 30
Attachment C: Compliance with Air Emission Limits, Monitoring and Reporting Requirements Page | 1
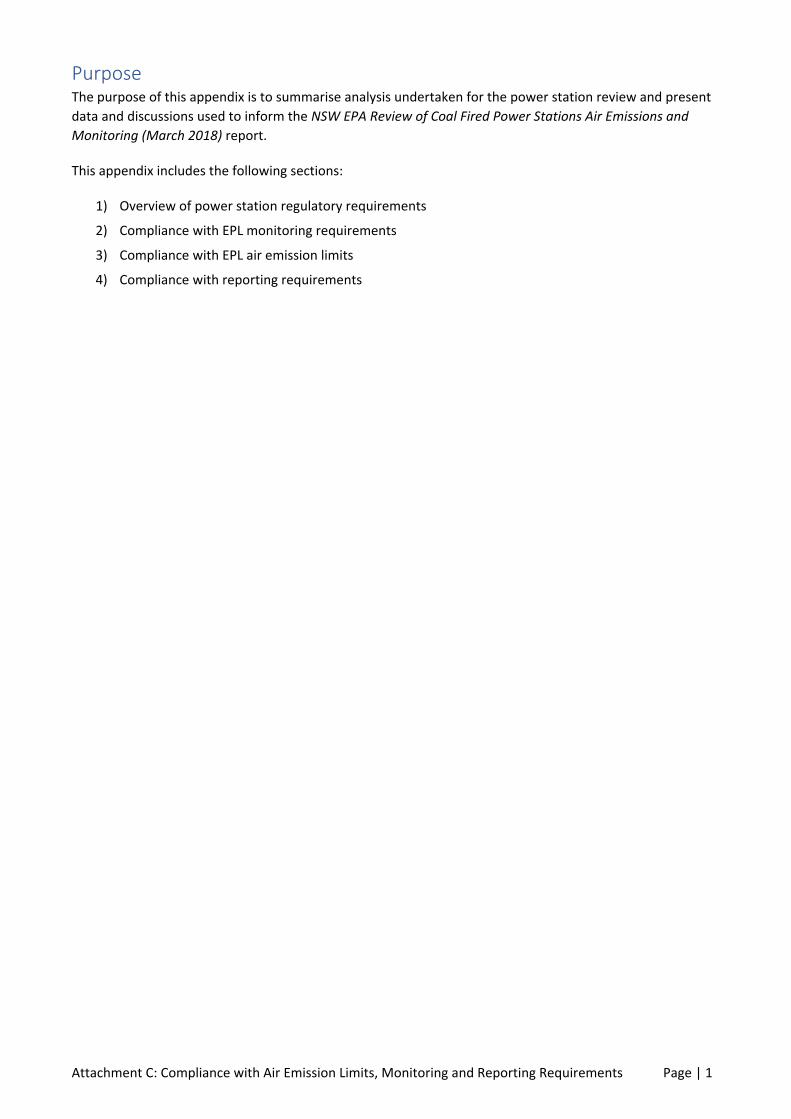
Purpose The purpose of this appendix is to summarise analysis undertaken for the power station review and present
data and discussions used to inform the NSW EPA Review of Coal Fired Power Stations Air Emissions and
Monitoring (March 2018) report.
This appendix includes the following sections:
1) Overview of power station regulatory requirements
2) Compliance with EPL monitoring requirements
3) Compliance with EPL air emission limits
4) Compliance with reporting requirements

Attachment C: Compliance with Air Emission Limits, Monitoring and Reporting Requirements Page | 2
1) Overview of Power Station Regulatory Requirements
1.1 Protection of the Environment Operations Act (1997) The Protection of the Environment Operations (POEO) Act 1997 (the Act) is the principal piece of
environment protection legislation administered by the EPA. It establishes the NSW environmental
regulatory framework including licensing.
Section 128(1) of the Act prescribes that:
The occupier of any premises must not carry on any activity, or operate any plant, in or on the
premises in such a manner as to cause or permit the emission at any point specified in or determined
in accordance with the regulations of air impurities in excess of:
(a) the standard of concentration and the rate, or
(b) the standard of concentration or the rate,
prescribed by the regulations in respect of any such activity or any such plant.
Clause 38 of the Protection of the Environment Operations (Clean Air) Regulation 2010 (the Regulation)
prescribes that:
For the purposes of section 128 (1) of the Act, the prescribed standards of concentration for
emissions of air impurities are:
(a) in relation to any plant referred to in Schedule 2, the standards of concentration specified
in that Schedule in relation to that plant, and
(b) in relation to any activity or plant specified in Schedule 3 in respect of a particular
purpose, the standards of concentration specified in Schedule 3 in relation to that activity or
plant and that purpose, and
(c) in relation to any activity or plant specified in Schedule 4 (other than those covered by
Schedule 2 or 3), the standards of concentration specified in Schedule 4 in relation to that
activity or plant.
1.2 POEO (Clean Air) Regulation The Regulation sets emission limits for electricity generation in NSW. The Regulation limits are set based on
reasonably available control technology.
Regulation limits for plant and equipment differ according to the general grouping of the activity and plant.
Grouping is classified according to the plant vintage, with Group 1 plant being the oldest and Group 6 being
the newest. The Regulation prescribes more stringent limits for newer activities and plant. Table 1
summarises the regulatory grouping of NSW power stations.

Attachment C: Compliance with Air Emission Limits, Monitoring and Reporting Requirements Page | 3
Table 1: POEO (Clean Air) Regulation (2010) groupings for NSW coal fired power stations.
Station Commission Date POEO Grouping
Bayswater 1985‐1986 Group 3
Liddell 1971‐1973 Group 5*
Mount Piper 1993 Group 4
Eraring 1982 Group 3
Vales Point 1978 Group 5* *In accordance with clause 35 of the Protection of the Environment Operations (Clean Air) Regulation 2010, any activity or plant that, prior to 1 January 2012, belonged to Group 2 (including any activity or plant previously in Group 1) is taken to belong to Group 5. In accordance with clause 35 Liddell and Vales Point were granted an exemption from Group 5 for the emission of nitrogen oxides.
The Regulation sets emission limits as standards of concentration, typically expressed as milligrams per cubic
metre (mg/m3), based on reasonably available control technology applicable to the vintage of the plant and
equipment. The Regulation lists the standards of concentrations for electricity generation for standard and
non‐ standard fuels in Schedule 3: Standards of concentration for scheduled premises: activities and plant
used for specific purposes. A copy of the schedule 3 is presented in Table 2 over page.
Schedule 4 of the Regulation prescribes concentration limits for general activities and plant, for pollutants
including metals, chlorine and sulfuric acid. The Regulation also restricts the use of high sulfur liquid fuels.
A standard fuel, as defined in the Regulation, means any unused and uncontaminated solid, liquid or gaseous fuel that is:
(a) a coal or coal‐derived fuel (other than any tar or tar residues), or (b) a liquid or gaseous petroleum‐derived fuel, or (c) a wood or wood‐derived fuel, or (d) bagasse.
A non‐standard fuel means any fuel other than a standard fuel.

Attachment C: Compliance with Air Emission Limits, Monitoring and Reporting Requirements Page | 4
Table 2: POEO (Clean Air) Regulation (2010) Schedule 3: Standards of concentration for electricity generation Electricity generation
Air impurity Activity or plant Standard of concentration
Solid particles (Total) Any activity or plant using a liquid or solid
standard fuel or a non‐standard fuel
Group 1 400 mg/m3
Group 2, 3 or 4 250 mg/m3
Group 5 100 mg/m3
Group 6 50 mg/m3
Any crushing, grinding, separating or materials
handling activity
Group 1 400 mg/m3
Group 2, 3 or 4 250 mg/m3
Group 5 100 mg/m3
Group 6 20 mg/m3
Nitrogen dioxide (NO2) or nitric
oxide (NO) or both, as NO2
equivalent
Any boiler operating on a fuel other than gas,
including a boiler used in connection with an
electricity generator that forms part of an
electricity generating system with a capacity of 30
MW or more
Group 1, 2, 3 or 4 2,500 mg/m3
Group 5 800 mg/m3
Group 6 500 mg/m3
Any turbine operating on gas, being a turbine
used in connection with an electricity generating
system with a capacity of 30 MW or more
Group 1, 2, 3 or 4 2,500 mg/m3
Group 5 or 6 70 mg/m3
Any turbine operating on a fuel other than gas,
being a turbine used in connection with an
electricity generating system with a capacity of 30
MW or more
Group 1, 2, 3 or 4 2,500 mg/m3
Group 5 150 mg/m3
Group 6 90 mg/m3
Fluorine (F2) and any compound
containing fluorine, as total fluoride
(HF equivalent)
Any activity or plant using a liquid or solid
standard fuel or a non‐standard fuel
Group 1 100 mg/m3
Group 2, 3, 4, 5 or 6 50 mg/m3
Type 1 substances (in aggregate) Any activity or plant using a non‐standard fuel Group 1, 2 or 3 20 mg/m3
Group 4 10 mg/m3
Group 5 or 6 —
Type 1 substances and Type 2
substances (in aggregate)
Any activity or plant using a non‐standard fuel Group 1, 2, 3 or 4 —
Group 5 5 mg/m3
Group 6 1 mg/m3
Cadmium (Cd) or mercury (Hg)
individually
Any activity or plant using a non‐standard fuel Group 1, 2 or 3 —
Group 4 3 mg/m3
Group 5 1 mg/m3
Group 6 0.2 mg/m3
Dioxins or furans Any activity or plant using a non‐standard fuel
that contains precursors of dioxin or furan
formation
Group 1, 2, 3, 4 or 5 —
Group 6 0.1 ng/m3
Volatile organic compounds (VOCs),
as n‐propane equivalent
Any activity or plant using a non‐standard fuel Group 1, 2, 3, 4 or 5 —
Group 6 40 mg/m3 VOCs or
125 mg/m3 CO
Smoke Any activity or plant using a liquid or solid
standard fuel or a non‐standard fuel
Group 1, in approved circumstances Ringelmann 3 or
60% opacity
Group 1, in other circumstances Ringelmann 2 or
40% opacity
Group 2, 3, 4, 5 or 6, in approved
circumstances
Ringelmann 3 or
60% opacity
Group 2, 3, 4, 5 or 6, in other
circumstances
Ringelmann 1 or
20% opacity

Attachment C: Compliance with Aim Emission Limits, Monitoring and Reporting Requirements Page | 5
1.3 Regulatory Air Emission Limits Each of the coal fired power stations in NSW are required to comply with the following limits:
i. Protection of the Environment Operations (Clean Air) Regulation 2010
ii. Environment protection licence – Air Concentration Limits
iii. Environment protection licence – Reporting Limits
The regulatory air emission limits, applicable to the NSW coal fired power stations, are summarised in Table 3. If an EPL does not specify a concentration limit for a
pollutant, the Regulation limit applies (green cells). As the EPL cannot be less stringent than the Regulation, EPL limits were used to determine compliance. Emission
limits, specific to electricity generation, are prescribed in Schedule 3 of the Regulation.
Table 3: Summary of applicable regulatory air emission limits for NSW coal fired power stations. Environment Protection Licence Concentration Limits POEO (2010) EPL Reporting Limits
Solid
particles (To
tal) (mg/m
3)
Total Fluoride (m
g/m
3)
Type 1 & 2 Substan
ces (M
etals)
(mg/m
3)
Cad
mium (mg/m
3)
Mercury (mg/m
3)
NOx as Equivalen
t NO
2 (m
g/m
3)
Dioxins & Furans ((mg/m
3)
Sulfuric Acid M
ist (H
2SO
4 as SO
3)
(mg/m
3)
Hyd
rogen Chloride (m
g/m
3)
Chlorine (m
g/m
3)
Volatile Organ
ic Compounds
(mg/m
3)
Coal Sulfur Content Limit
(% weigh
t)
Cad
mium (mg/m
3)
Smoke (Opacity)
NOx as Equivalen
t NO
2 (m
g/m
3)
Sulfur Dioxide (m
g/m
3)
Smoke (Opacity)
Bayswater 100 50 5 1 1 1500 ‐ 100 100 200 ‐ ‐ ‐ 20% ‐ 1760 ‐
Liddell 100 50 5 1 1 1500* ‐ 100 100 200 ‐ 1.0 ‐ 20% 1438 1760 20%
Eraring 50 50 1 0.2 0.2 1100 ‐ 100 100 200 ‐ 0.5 ‐ 20% ‐ 1760 ‐
Mount Piper 50 50 1 ** 0.2 1500 0.1 100 100 200 40 ‐ 3 20% ‐ ‐ ‐
Vales Point 100 50 5 1 1 1500* ‐ 100 100 200 ‐ 0.5 ‐ 20% ‐ 1760 ‐
*In accordance with clause 35 of the Protection of the Environment Operations (Clean Air) Regulation 2010, Liddell and Vales Point were granted an exemption from Group 5 for the emission of nitrogen oxides.
** Cadmium is included in Type 1 and Type 2 Substances in aggregate.

Attachment C: Compliance with Aim Emission Limits, Monitoring and Reporting Requirements Page | 6
2) Compliance with EPL Monitoring Requirements This section of the review provides an overview of the methods used by EPA to determine compliance with
the following specific EPL monitoring conditions:
i. Specific pollutants sampled and sampling frequency
ii. Emission testing companies and accredited laboratories
iii. Sampling methods used
2.1 Pollutants Sampled and Sampling frequency Each power station is required to monitor, by sampling and obtaining results by analysis, the concentration
of each pollutant discharged, as specified in their EPL. Sampling frequency and units of measure are also
prescribed. A summary of monitoring requirements is provided in table 5 (over page).
A review of 108 test reports identified two instances of failure to complete required testing:
Liddell Power Station did not perform sampling on Unit 1 in 2014 – occurred due to unplanned
boiler outages.
Liddell Power Station did not sample for VOC emissions between 2011 and 2014 – occurred due
to an oversight in the sampling program.
Liddell power station reported each of the non‐compliances to the EPA in Annual Returns, as per the
reporting requirements of their EPL. A summary of the reported non‐compliances is provided in Table 4.
Table 4: Summary of Liddell power stations non‐compliance reports
Location Annual Return
Summary Cause
Liddell Power Station
86566
Monitoring of VOC concentrations on points 2 & 4 were not carried out after change in requirements. Unit 1 out of service for major outage until 24/9/14. Unit was put back in service at this time and was scheduled to be emission tested on 2/12/14. The unit suffered a catastrophic failure on 18/11/14 and has been out of service since this time so was not tested.
Due to an oversight.
Liddell Power Station
86998
No VOC monitoring was completed during the reporting period, or the previous year, due to an oversight in the monitoring regime. The next monitoring event is scheduled for October 2014 and is to incorporate VOC monitoring.
An oversight in the monitoring regime.
Attachment C: Compliance with Aim Emission Limits, Monitoring and Reporting Requirements Page | 7
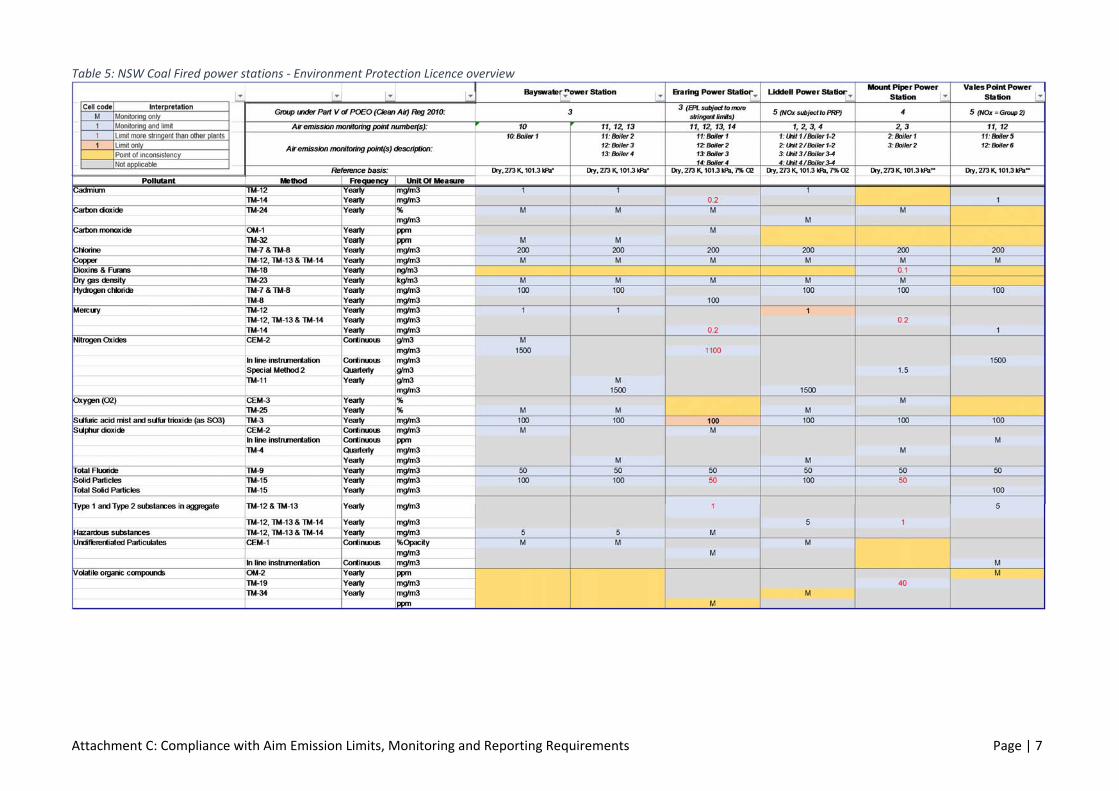
Table 5: NSW Coal Fired power stations ‐ Environment Protection Licence overview

Attachment C: Compliance with Aim Emission Limits, Monitoring and Reporting Requirements Page | 8
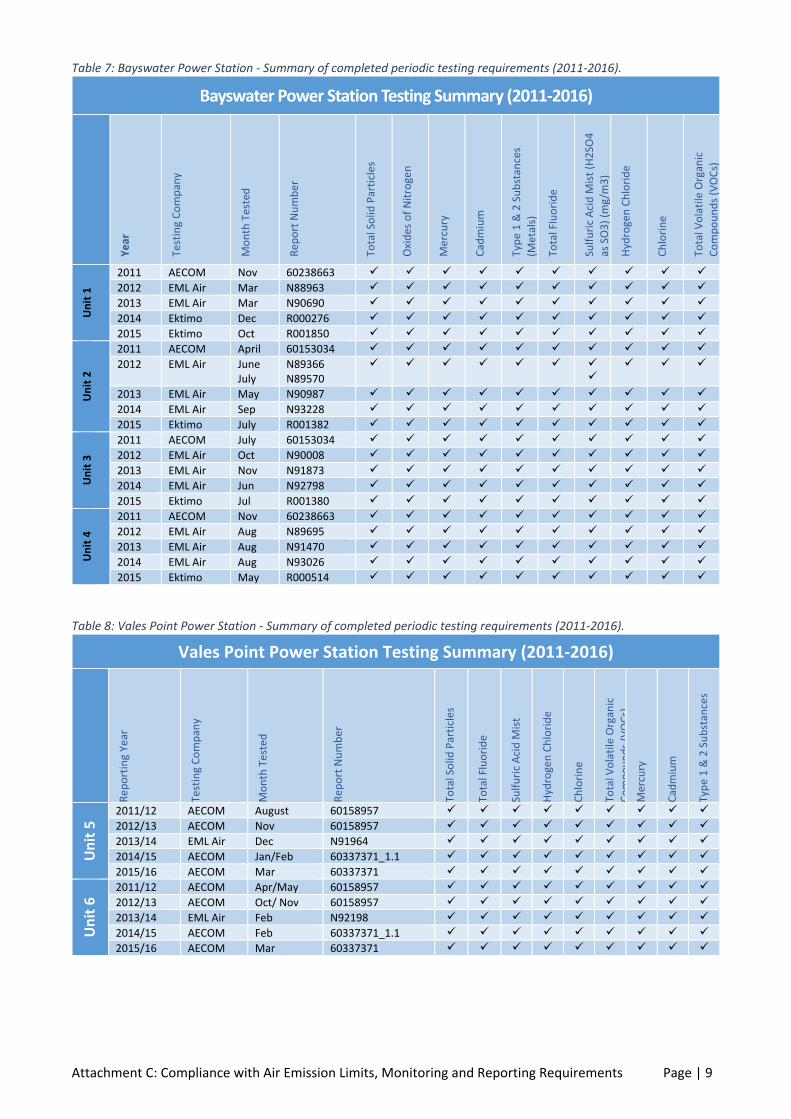
Tables 6 – 10 show the periodic testing completed at each power station between 2011‐2016.
Table 6: Liddell Power Station ‐ Summary of completed periodic testing requirements (2011‐2016).
Liddell Power Station Testing Summary (2011‐2016)
Reporting Ye
ar
Test Period
Testing Compan
y
Rep
ort Number
Total Solid
Particles
Total Fluoride
Cad
mium
Sulfuric Acid M
ist
Sulfur Dioxide
Type 1 & 2 Substan
ces
Total O
xides of Nitrogen
Hyd
rogen Chloride
Chlorine
Total V
olatile Organ
ic
Compounds(VOCs)
Mercury
Unit 1
2011/12 Mar‐12 EML Air N88907 ×
2012/13 Jul‐12 EML Air N89572 ×
2013/14 Dec‐13 EML Air N92004 ×
2014/15 ‐ ‐ ‐ × × × × × × × × × × × 2015/16 Sep‐15 Ektimo R001526
Unit 2
2011/12 Apr‐12 EML Air N89101 ×
2012/13 Mar‐13 EML Air N90665 ×
2013/14 May‐14 EML Air N92641 ×
2014/15 Sep‐14 EML Air N93227 ×
2015/16 Sep‐15 Ektimo R001528
Unit 3
2011/12 Feb‐12 EML Air N88719 ×
2012/13 Nov‐12 EML Air N90222 ×
2013/14 Oct‐13 EML Air N91777 ×
2014/15 Dec‐14, Apr‐13
Ektimo R000274/ R000983
×
2015/16 Jun‐16 Ektimo R002265
Unit 4
2011/12 Mar‐12 EML Air N88907 ×
2012/13 Feb‐13 EML Air N90538 ×
2013/14 May‐14 EML Air N92641 ×
2014/15 May‐15 Ektimo R000495
2015/16 Jan‐16 Ektimo R002267
Attachment C: Compliance with Air Emission Limits, Monitoring and Reporting Requirements Page | 9
Table 7: Bayswater Power Station ‐ Summary of completed periodic testing requirements (2011‐2016).
Bayswater Power Station Testing Summary (2011‐2016)
Year
Testing Compan
y Month Tested
Rep
ort Number
Total Solid
Particles
Oxides of Nitrogen
Mercury
Cad
mium
Type 1 & 2 Substan
ces
(Metals)
Total Fluoride
Sulfuric Acid M
ist (H2SO
4
as SO3) (m
g/m3)
Hyd
rogen Chloride
Chlorine
Total V
olatile Organ
ic
Compounds (VOCs)
Unit 1
2011 AECOM Nov 60238663 2012 EML Air Mar N88963 2013 EML Air Mar N90690 2014 Ektimo Dec R000276 2015 Ektimo Oct R001850
Unit 2
2011 AECOM April 60153034 2012 EML Air June
July N89366 N89570
2013 EML Air May N90987 2014 EML Air Sep N93228 2015 Ektimo July R001382
Unit 3
2011 AECOM July 60153034 2012 EML Air Oct N90008 2013 EML Air Nov N91873 2014 EML Air Jun N92798 2015 Ektimo Jul R001380
Unit 4
2011 AECOM Nov 60238663 2012 EML Air Aug N89695 2013 EML Air Aug N91470 2014 EML Air Aug N93026 2015 Ektimo May R000514
Table 8: Vales Point Power Station ‐ Summary of completed periodic testing requirements (2011‐2016).
Vales Point Power Station Testing Summary (2011‐2016)
Reporting Ye
ar
Testing Compan
y
Month Tested
Rep
ort Number
Total Solid
Particles
Total Fluoride
Sulfuric Acid M
ist
Hyd
rogen Chloride
Chlorine
Total V
olatile Organ
ic
Compounds(VOCs)
Mercury
Cad
mium
Type 1 & 2 Substan
ces
Unit 5
2011/12 AECOM August 60158957 2012/13 AECOM Nov 60158957 2013/14 EML Air Dec N91964 2014/15 AECOM Jan/Feb 60337371_1.1 2015/16 AECOM Mar 60337371
Unit 6
2011/12 AECOM Apr/May 60158957 2012/13 AECOM Oct/ Nov 60158957 2013/14 EML Air Feb N92198 2014/15 AECOM Feb 60337371_1.1 2015/16 AECOM Mar 60337371

Attachment C: Compliance with Air Emission Limits, Monitoring and Reporting Requirements Page | 10
Table 9: Eraring Power Station ‐ Summary of completed periodic testing requirements (2011‐2016).
Eraring Power Station Testing Summary (2011‐2016)
Reporting Ye
ar
Test Period
Rep
ort Number
Testing Compan
y
Solid
Particles
Mercury
Cad
mium
Type 1 & 2 Substan
ces
Total Fluoride
Sulfuric Acid M
ist (H
2SO
4 as SO
3)
Hyd
rogen Chloride
Chlorine
Total V
olatile Organ
ic
Compounds (VOCs)
Unit 1
2011/12 Feb‐12 210261 Aurecon
2012/13 Nov‐12 210261 Aurecon
2013/14 Feb‐14 210261 Aurecon
2014/15 Feb‐15 60331358 AECOM
2015/16 Apr‐16 60331358 AECOM
Unit 2
2011/12 May‐12 210261 Aurecon
2012/13 May‐13 210261 Aurecon
2013/14 May‐14 210261 Aurecon
2014/15 Aug‐14 60290356 AECOM
2015/16 Jan‐ 16 60331358 AECOM
Unit 3
2011/12 Nov‐11 210261 Aurecon
2012/13 Aug‐12 210261 Aurecon
2013/14 Aug‐13 210261 Aurecon
2014/15 May, Aug‐15 60331358 AECOM
2015/16 Jun‐16 60331358 Aurecon
Unit 4
2011/12 Aug‐11 210261 Aurecon
2012/13 Jan‐13 210261 Aurecon
2013/14 Oct‐13 210261 Aurecon
2014/15 Nov, Dec, Feb‐
14 60331358 AECOM
2015/16 Nov‐15, Jun‐16 60331358 AECOM

Attachment C: Compliance with Air Emission Limits, Monitoring and Reporting Requirements Page | 11
Table 10: Mount Piper Power Station ‐ Summary of completed periodic testing requirements (2011‐2016).
Mount Piper Power Station Testing Summary (2011‐2016) Unit
Rep
orting Ye
ar
Testing Compan
y
Test Period
Rep
ort Number
Solid
Particles
Sulfur trioxide as SO3
Total Fluoride
Hyd
rogen Chloride
Chlorine as Cl2
Copper
Mercury
Type 1 & 2 Substan
ces
Volatile Organ
ic
Compounds
Dioxins an
d Furans
Nitrogen Oxides
Sulfur Dioxide
1 2011 EML Air Feb‐11 86925 1 2011 EML Air Feb‐11 86870
1 2011 EML Air May‐11 87667
1 2011 EML Air Jul‐11 87916
1 2011 EML Air Oct‐11 88355
1 2012 EML Air Feb‐12 N88756 1 2012 EML Air May‐12 N89474
1 2012 EML Air Jul‐12 N89515 1 2012 EML Air Nov‐12 N90182 1 2013 EML Air Feb‐13 N90367 1 2013 EML Air May‐13 N91005 1 2013 EML Air Jul‐13 N91300 1 2013 EML Air Nov‐13 N91743 1 2014 EML Air Feb‐14 N92159 1 2014 EML Air May‐14 N92612 1 2014 EML Air Jul‐14 N92972 1 2014 EML Air Jul‐14 N93009 1 2014 EML Air Oct‐14 N93310 1 2015 Ektimo Mar‐15 R000778 1 2015 Ektimo May‐15 R001085 1 2015 Ektimo Jun‐15 R001229a 1 2015 Ektimo Aug‐15 R001461 1 2015 Ektimo Oct‐15 R001748 1 2016 Ektimo Jan‐16 R002263 1 2016 Ektimo Apr‐16 R002528 1 2016 Ektimo Aug‐16 R003249 1 2016 Ektimo Dec‐16 R003428 2 2011 EML Air Feb‐11 86870 2 2011 EML Air May‐11 87667
2 2011 EML Air May‐11 87666 2 2011 EML Air Jul‐11 87916
2 2011 EML Air Oct‐11 88355 2 2012 EML Air Feb‐12 N88795 2 2012 EML Air May‐12 N89474 2 2012 EML Air Jul‐12 N89515 2 2012 EML Air Nov‐12 N90182 2 2013 EML Air Feb‐13 N90367 2 2013 EML Air Jun‐13 N91005 2 2013 EML Air Jul‐13 N91300 2 2013 EML Air Nov‐13 N91743 2 2014 EML Air Feb‐14 N92159 2 2014 EML Air Apr‐14 N92464 2 2014 EML Air Jul‐14 N92972
2 2014 EML Air Oct‐14 N93310 2 2015 Ektimo Mar‐15 R000778 2 2015 Ektimo Apr‐15 R000965 2 2015 Ektimo Jun‐15 R001234 2 2015 Ektimo Aug‐15 R001461 2 2015 Ektimo Oct‐15 R001748 2 2016 Ektimo Jan‐16 R002263 2 2016 Ektimo Apr‐16 R002528 2 2016 Ektimo Apr‐16 R002529 2 2016 Ektimo Aug‐16 R003249 2 2016 Ektimo Dec‐16 R003428

Attachment C: Compliance with Air Emission Limits, Monitoring and Reporting Requirements Page | 12
2.2 Emission Testing Companies and Accredited Laboratories Sampling and analysis of air emissions must be performed in accordance with test methods contained in the publication Approved Methods for the Sampling and Analysis of Air Pollutants in NSW (2007) (Approved Methods Sampling)1. Section 3 of the Approved Methods Sampling states: “Analysis should be carried out by a laboratory accredited to perform them, by an independent accreditation body acceptable to the EPA, such as the National Association of Testing Authorities (NATA)”.
The review found all analysis of samples collected from coal fired power stations was conducted by NATA
accredited companies. A list of all testing companies contracted to perform sampling or analysis at NSW power
stations between 2011 and 2016 is provided in Table 11.
Table 11: Summary of testing companies used to sample and analyse air emissions (2011‐2016)
Testing Company / Laboratory Name NATA #AECOM 2778
AURECON (sampling at Eraring pre‐2015)
Australian Laboratory Services (ALS) 825
Ektimo 2732
EML (Chem) 2731
EML Air 2732
Envirolab Services 2901
Leeder Consulting 2562
Micro Analysis Australia (Particle sizing only – No regulatory requirement)
SGS Environmental 2562
Steel River Testing 18079
2.3 Sampling Methods Sampling of power station air emissions must be performed using the sampling method listed in the
licensees EPL and in accordance with the Approved Methods Sampling.
The review found the sampling methods used by sampling consultants, as reported in stack testing reports,
are consistent with EPL and Approved Methods Sampling requirements. A summary of stack test reports
reviewed is provided in Table 12.
The review identified the following two points for further discussion:
1) The sampling planes for all power stations have been identified as non‐ideal in accordance with
Australian Standards 4323.1. As the sampling planes are non‐ideal, all power stations measure stack gas
flow rates using USEPA Method 1, in place of AS4323.1. This is in accordance with the approved
circumstances of section 2: Sample collection and handling, of the NSW Approved Methods for Sampling.
2) The EPL for Mount Piper power station incorrectly references TM‐19 as the sampling method for Volatile
Organic Compounds (VOCs). Test Method 19 (TM‐19) is the NSW Approved sampling method for Volatile
Organic Liquids. The correct NSW Approved Method that should be referenced in the EPL is TM‐34. Stack
testing reports have referenced the correct sampling method (TM‐34) for the period included in the
review.
1 Approved Methods Sampling: http://www.environment.nsw.gov.au/resources/air/07001amsaap.pdf

Attachment C: Compliance with Air Emission Limits, Monitoring and Reporting Requirements Page | 13
3) Compliance with EPL Air Emission Limits To determine if the power stations are compliant with their EPL air emission limits, five consecutive years
(2011‐2016) of stack test reports were reviewed for each power station – totalling 108 reports. Table 12
provides a list of reports reviewed.
Table 12: Summary of 108 stack sampling reports included in the power station review. Year Month Report # Published By Year Month Report # Published By
Baysw
ater
2011 November 60238663 AECOM 2013 October N91470 EML Air
2011 May 60153034 AECOM 2013 December N91873 EML Air
2011 August 60153034 AECOM 2014 January N92115 EML Air
2012 January 60238663 AECOM 2014 July N92798 EML Air
2012 April N88963 EML Air 2014 September N93026 EML Air
2012 July N89366 EML Air 2014 October N93228 EML Air
2012 August N89570 EML Air 2015 January R000276 Ektimo
2012 October N89695 EML Air 2015 July R000514 Ektimo
2012 November N90008 EML Air 2015 August R001380 Ektimo
2012 October N90039 EML Air 2015 August R001382 Ektimo
2014 October N90690 EML Air 2015 November R001850 Ektimo
2013 June N90987 EML Air
Eraring
2011 August 201261 Aurecon 2014 August 60290356/1.9_Report 1 AECOM
2011 November 201261 Aurecon 2014 November 60331358/02.01.01_Report 1 AECOM
2012 February 210261 Aurecon 2014 December 60331358/02.01.01_Report 2 AECOM
2012 May 210261 Aurecon 2014 February 60331358/02.01.01_Report 3 AECOM
2012 August 210261 Aurecon 2015 February 60331358/02.01.02_Report 1 AECOM
2012 November 210261 Aurecon 2015 May 60331358/02.01.03_Report 1 AECOM
2013 January 210261 Aurecon 2015 August 60331358/02.01.04_RPT AECOM
2013 May 210261 Aurecon 2015 November 60331358/02.01.05_RPT AECOM
2013 August 210261 Aurecon 2016 January 60331358_02.01.06 AECOM
2013 October 210261 Aurecon 2016 April 60331358_02.01.07 AECOM
2014 February 210261 Aurecon 2016 June 60331358_02.01.0 AECOM
2014 May 210261 Aurecon
Liddell
2012 February N88719 EML Air 2014 June N92641 EML Air
2012 March N88907 EML Air 2014 October N93227 EML Air
2012 April N89101 EML Air 2015 January R000274 Ektimo
2013 February N90538 EML Air 2015 June R000495 Ektimo
2012 July N89572 EML Air 2015 May R000983 Ektimo
2013 March N90665 EML Air 2015 November R001526 Ektimo
2012 November N90222 EML Air 2015 November R001528 Ektimo
2013 October N91777 EML Air 2016 July R002265 Ektimo
2013 December N92004 EML Air 2016 March R002267 Ektimo
Vales Point 2011 September 60158957 AECOM 2014 February N92198 EML Air
2012 June 60158957 AECOM 2015 July 60337371 AECOM
2013 February 60158957 AECOM 2016 June 60337371 AECOM
2013 December N91964 EML Air
Mount Piper
2011 May N87667 EML Air 2014 may N92621 EML Air
2011 May N87666 EML Air 2014 April N92464 EML Air
2011 July N87916 EML Air 2014 July N92972 EML Air
2011 October N88355 EML Air 2014 October N93310 EML Air
2012 July N88756 EML Air 2015 March R000778 Ektimo
2012 July N88795 EML Air 2015 April R000965 Ektimo
2012 March N88873 EML Air 2015 may R001085 Ektimo
2012 February N88796 EML Air 2015 June R001234 Ektimo
2012 may N89474 EML Air 2015 June R001229a Ektimo
2012 July N89515 EML Air 2015 June R001236 Ektimo
2012 November N90182 EML Air 2015 August R001461 Ektimo
2013 February N90367 EML Air 2015 October R001748 Ektimo
2013 February N90367 EML Air 2016 January R002263 Ektimo
2013 may N91005 EML Air 2016 January R002263 Ektimo
2013 June N91005 EML Air 2016 April R002528 & R002527 Ektimo
2013 July N91300 EML Air 2016 April R002528 & R002529 Ektimo
2013 November N91743 EML Air 2016 August R003249 Ektimo
2014 February N92159 EML Air 2016 December R003428 Ektimo

Attachment C: Compliance with Air Emission Limits, Monitoring and Reporting Requirements Page | 14
Reported emission concentrations were graphed to assist with the identification of any high concentrations
of pollutants. A sample of graphs that were used in the review are provided in Figure 1 below, the EPL
emission limits are identified by the blue line.
The review identified a number of pollutants routinely measured at levels appreciably below EPL emission
limits. For example:
• Solid particles are routinely measured below 20 mg/m3 at Bayswater and Vales Point power stations
– approximately 20% of the EPL limit.
• Chlorine concentrations are routinely reported below 10 mg/m3 – approximately 5% of the
200mg/m3 EPL limits.
• Cadmium and Mercury concentrations are routinely measured far below EPL emission limits.
Based on historical data trends and reported concentrations of emissions, there may be opportunities for
the EPA to review current licence limits and consider revising limits which are more reflective of achievable
levels informed by proper and efficient operation of the plant.
Figure 1: Sample graphs selected from 2017 review of power station compliance review.

Attachment C: Compliance with Air Emission Limits, Monitoring and Reporting Requirements Page | 15
3.1 EPL Air Emission Limits – Identified non‐compliances To investigate if the power stations are compliant with EPL emission limits, reported pollutant
concentrations from stack test reports were compared to EPL emission concentration limits.
As per Table 3, EPL limits are equal to or more stringent than the Regulation limits. Compliance with EPL
limits was used to determine compliance with the Regulation.
Of the 108 test reports reviewed (refer to Table 12), two exceedances of EPL air emission concentration
limits were identified:
1. Bayswater had a single exceedance of the EPL air emission limit for total fluoride in June 2012.
2. Mount Piper had a single exceedance of the EPL air emission limit for sulfuric acid in April 2014.
A summary of the two EPL concentration limit exceedances identified in this review is provided in Table 13.
Further information and discussion regarding each exceedance is presented in Section 3.2 and 3.3 below.
Table 13: Summary of licence limit exceedances ‐ Periodic sampling results (2011‐2016).
Summary of Licence Limit Exceedances – From Stack Sampling Results
Exceedance No.
Station EPL No. Reporting Year
Parameter Licence Limit Reported Value
1 Bayswater 779 2012/2013 Total Fluoride
50 mg/m3 54 mg/m3
2 Mount Piper 13007 2013/2014 Sulfuric Acid Mist as SO3
100 mg/m3 120 mg/m3
A summary of the results is provided in Table 14 over page.

Attachment C: Compliance with Aim Emission Limits, Monitoring and Reporting Requirements Page | 16
Table 14: EPL emission limits vs measured concentrations of air pollutants from NSW Coal Fired power stations (2011‐2016)
Solid
particles (To
tal) (mg/m
3)
Total Fluoride (m
g/m
3)
Type 1 & 2 Substan
ces (M
etals)
(mg/m
3)
Cad
mium (mg/m
3)
Mercury (mg/m
3)
Total O
xides of Nitrogen (NOx as
Equivalen
t NO
2) (m
g/m
3 )
Dioxins & Furans (ng/m
3)
Total V
olatile Organ
ic Compounds
(VOCs) (mg/m
3 )
Sulfuric Acid M
ist (H
2SO
4 as SO
3)
(mg/m
3)
Hyd
rogen Chloride (m
g/m
3)
Chlorine (m
g/m
3)
Bayswater
Licence Limit 100 50 5 1 1 1500 ‐ ‐ 100 100 200
Average 15 13 0.13 0.0004 0.0014 659 ‐ 1.5 13 13 18.8
Max 68 54 1.30 0.0017 0.0053 940 ‐ 2.9 55 24 200.0
Liddell
Licence Limit 100 50 5 1 1 1500 ‐ ‐ 100 100 200
Average 24 11 0.22 0.0015 0.0004 724 ‐ 0.03 9 14 0.04
Max 58 17 1.80 0.0260 0.0015 930 ‐ 0.1 58 28 0.2
Eraring
Licence Limit 50 50 1 0.2 0.2 1100 ‐ ‐ 100 100 200
Average 9 10 0.04 0.0067 0.0010 415 ‐ 2.8 11 4 0.4
Max 19 32 0.31 0.0580 0.0022 593 ‐ 5.7 68 13 1.8
Mount Piper
Licence Limit 50 50 1 3 0.2 1500 0.1 40 100 100 200
Average 11 6 0.10 0.0002 0.0010 770 0.019 0.2 21 1 1.3
Max 39 11 0.66 0.0008 0.0019 1200 0.071 1.0 120 2 13.0
Vales Point
Licence Limit 100 50 5 1 1 1500 ‐ ‐ 100 100 200
Average 2 3 0.04 0.0069 0.0012 881 ‐ 0.6 15 4 1.1
Max 7 12 0.21 0.0310 0.0078 1099 ‐ 2.2 42 8 3.8
Note: 1 Results highlighted in red indicate an exceedance of EPL concentration limit.

Attachment C: Compliance with Air Emission Limits, Monitoring and Reporting Requirements Page | 17
3.2 Bayswater Non‐Compliance: Total Fluoride The emission monitoring requirements for Bayswater Power Station are detailed in EPL 779. The EPL
requires Bayswater to periodically monitor total fluoride emissions to air and report the concentration. The
concentration limit for total fluoride at Bayswater is 50 milligrams per cubic metre (mg/m3) ‐ reported at
reference conditions.
The review of periodic stack sampling conducted at Bayswater found measured in‐stack concentrations of
total fluoride exceeded the 50 mg/m3 limit on 5th June 2012. The result was 54 mg/m3, measured from boiler
Unit 2, Duct B. The result was reported in EML Air report N893662. The exceedance was not reported in
Bayswater’s Annual Return for the reporting period.
Retesting was conducted by EML Air on 24 July 2012. The results of the testing measured in‐stack total
fluoride concentrations of 6.9 mg/m3 from Unit 2, Duct A and 9.1 mg/m3 from Unit 2, Duct B, for an average
result of 8 mg/m3. Results were reported in EML Air report N895703.
The periodic test results of total fluoride, measured at Bayswater power station are displayed in Figure 2.
The licence limit is indicated by a blue line.
Figure 2: Fluoride reported air emission concentrations, from stack tests, at Bayswater Power Station (2011‐2016).
To investigate if the reported concentration is representative of actual in‐stack concentrations at the time of
sampling, EPA reviewed coal analysis data and stack sampling records.
3.2.1 Coal Fluorine vs In‐Stack Fluoride Concentrations The fluorine content of coal and the in‐stack measured fluoride concentrations were reviewed to determine
if a simple relationship could be identified.
Coal is supplied to Bayswater by the following mines: Wilpinjong, Mount Arthur, Mangoola, Bengalla and
Ravensworth. On arrival at the station the coal is directed to either the Unit 1/2 end or Unit 3/4 end of the
station via two parallel conveyor trains located in the centre of the station, between Units 2 and 3.
2 EML Air Pty Ltd: BAYSWATER POWER STATION Emission Testing Report ‐ JUNE 2012. Reference N89366 (4 July 2012). 3 EML Air Pty Ltd: BAYSWATER POWER STATION Emission Testing Report ‐ JULY 2012. Reference N89570 (28 Aug 2012).

Attachment C: Compliance with Air Emission Limits, Monitoring and Reporting Requirements Page | 18
Accredited laboratories are used to analyse “as‐fired” fuel samples taken at Bayswater power station.
Samples are analysed monthly for fluorine content. As‐fired samplers are located on each of the two
conveyors i.e. two for boiler Unit 1/2 (1A and 1B) and two for boiler Unit 3/4 (2A and 2B).
Table 15 provides a 12 month summary of the fluorine content (mg/kg) in coal used at Bayswater power
station. Table 15 shows:
In June 2012, the as‐fired coal fluorine content, burnt in Boiler 2, was the highest concentration
measured in 2012 at 156 mg/kg. Stack sampling results for Boiler 2 in June 2012, reported in‐stack
fluoride concentrations of 54 mg/m3.
In July 2012, the as‐fired coal fluorine content, was the lowest concentration measured in 2012, at
18.7 mg/kg. Stack sampling results collected in July, reported average in‐stack fluoride
concentrations of 8.0 mg/m3.
Table 15: Comparison of fluoride content in coal, Bayswater power station.
Average Daily As-Fired Coal Fluorine Content mg/kg
Month Year Boiler Unit 1 and 2 Analysis Results
from Samplers 1A/B
Boiler Unit 3 and 4 Analysis Results
from Samplers 2A/B
December 2011 147.38 140.46
January 2012 108.46 151.45
February 2012 130.08 78.42
March 2012 80.04 72.89
April 2012 141.59 139.85
May 2012 122.65 141.68
June 2012 155.66 179.29
July 2012 18.69 37.50
August 2012 140.31 145.54
September 2012 92.20 61.22
October 2012 141.21 127.08
November 2012 104.18 88.06
December 2012 117.83 99.53
Data sourced from Bayswater as fired coal analysis data sheet “Coal Analysis Data 2012‐2013 ‐ HRL.xlsx”.
Paired coal fluorine content and stack test results, for the period March 2011 ‐ October 2015, were reviewed
to further investigate the June 2012 fluoride exceedance. Table 16 contains a summary of stack test results
and monthly, as fired coal fluorine concentrations.
The data shows that from March 2011 to November 2011, coal fluorine content was routinely measured at
concentrations above 156 mg/kg, ranging from 171 – 232 mg/kg. Stack testing for the same period,
measured in‐stack total fluoride concentrations between 0.96 to 31 mg/m3.

Attachment C: Compliance with Air Emission Limits, Monitoring and Reporting Requirements Page | 19
Table 16: Bayswater Fluoride stack test results compared with coal fluorine concentration. Fluoride Stack test result mg/m3 Coal Fluorine
Content (mg/kg)Date Sampled Unit 1 Unit 2 Unit 3 Unit 4
Mar‐11 15 171
Mar‐11 31 171
Mar‐11 7.1 142
Apr‐11 15 232
Jul‐11 4.5 180
Jul‐11 13 180
Jul‐11 16 185
Nov‐11 0.96 174
Dec‐11 7.7 140
Mar‐12 16 80
Jun‐12 54 156 Jul‐12 8 19 Aug‐12 5.5 146
Oct‐12 24 127
Mar‐13 16 99
May‐13 6.5 104
Aug‐13 16 104
Nov‐13 12 132
Aug‐14 9.5 130
Sep‐14 8.3 141
Dec‐14 3.2 130
May‐15 11 119
Jul‐15 13 107
Jul‐15 16 107
Oct‐15 9.3 93
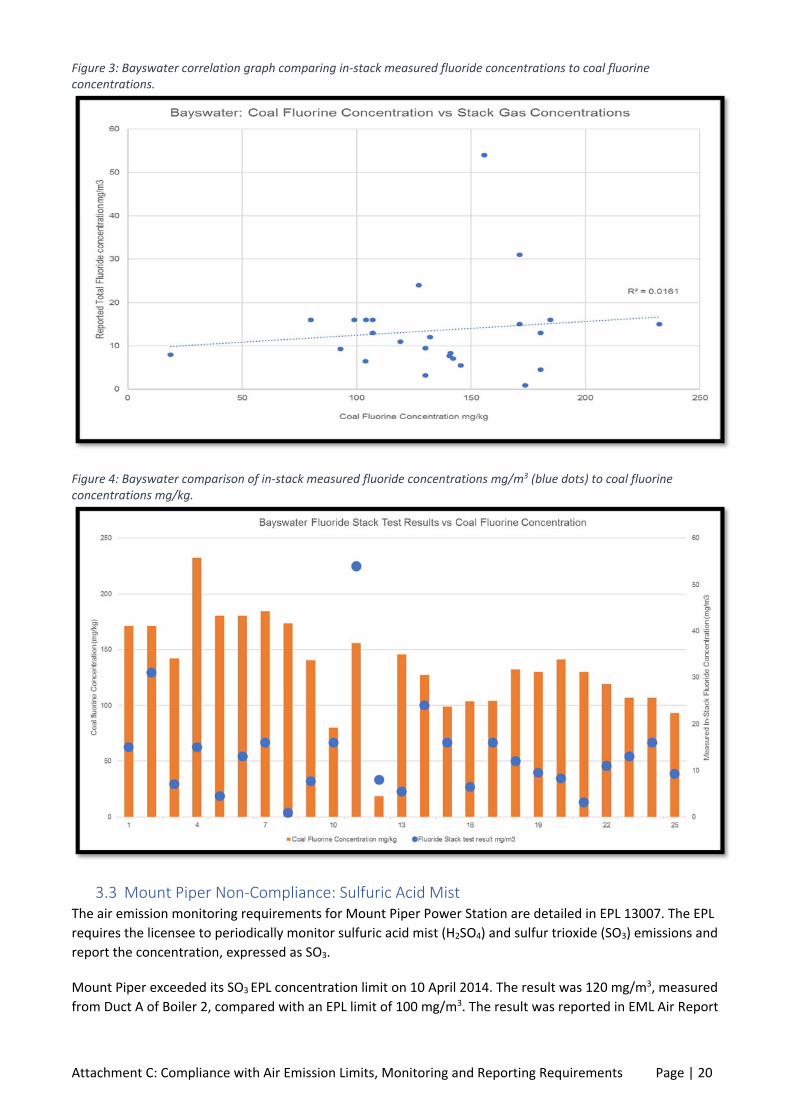
Figures 3 and 4 below, depict analysis used to help determine if high in‐stack fluoride concentrations can be
attributed to elevated coal fluorine content. The analysis was inconclusive, possibly due to confounding
factors such as the averaging periods of coal sample analysis and stack sampling periods; temperature;
moisture and pollution control efficiency which were not accounted for in the the analysis.
The review could not confidently determine if the reported total fluoride concentration of 54mg/m3 was a
‘real exceedance’, at the time of sampling, or if the elevated result was due to sampling/ analysis error. It is
noted that there is no clear indication or evidence of a sampling error.
Attachment C: Compliance with Air Emission Limits, Monitoring and Reporting Requirements Page | 20
Figure 3: Bayswater correlation graph comparing in‐stack measured fluoride concentrations to coal fluorine concentrations.
Figure 4: Bayswater comparison of in‐stack measured fluoride concentrations mg/m3 (blue dots) to coal fluorine concentrations mg/kg.
3.3 Mount Piper Non‐Compliance: Sulfuric Acid Mist The air emission monitoring requirements for Mount Piper Power Station are detailed in EPL 13007. The EPL
requires the licensee to periodically monitor sulfuric acid mist (H2SO4) and sulfur trioxide (SO3) emissions and
report the concentration, expressed as SO3.
Mount Piper exceeded its SO3 EPL concentration limit on 10 April 2014. The result was 120 mg/m3, measured
from Duct A of Boiler 2, compared with an EPL limit of 100 mg/m3. The result was reported in EML Air Report
Attachment C: Compliance with Air Emission Limits, Monitoring and Reporting Requirements Page | 21
N924644 prepared for Energy Australia NSW, Mount Piper Power Station. Mount Piper did not record any
non‐compliances related to air emission exceedances in its Annual Return or published data during this
period. A retest was conducted on 22 July 2014, the new test result was 2.2 mg/m3 as reported in EML Air
Report N929725 prepared for Energy Australia NSW, Mount Piper Power Station.
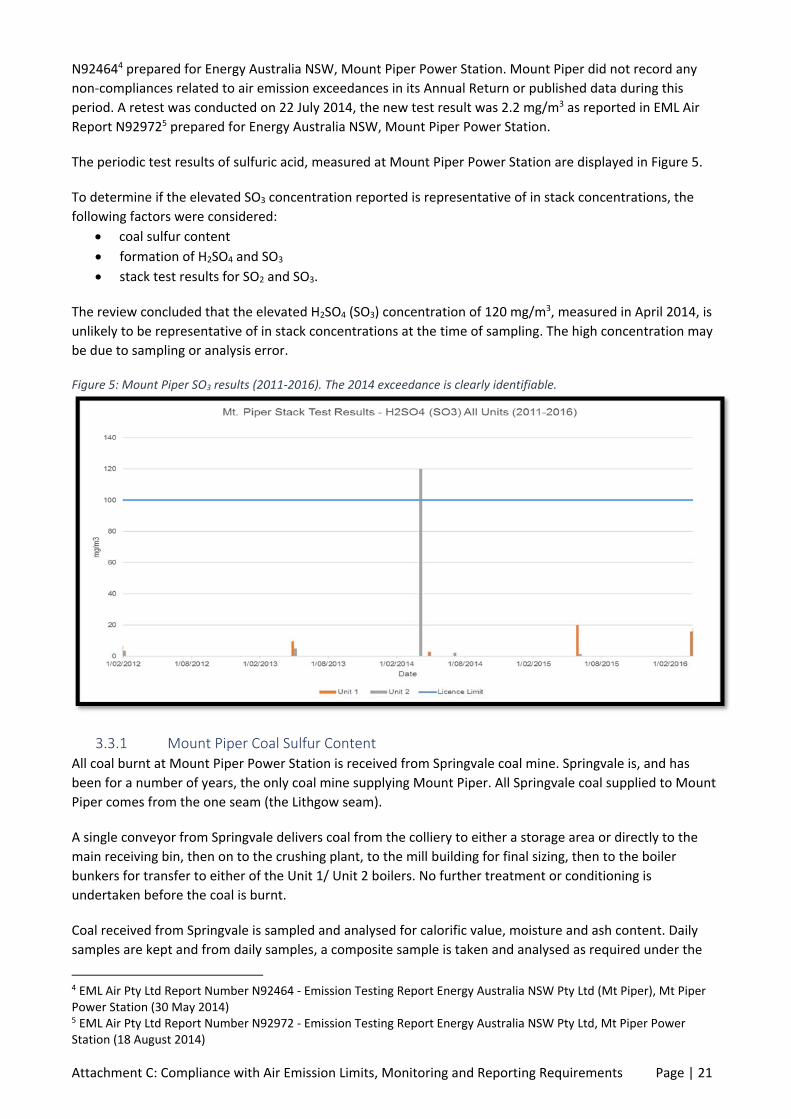
The periodic test results of sulfuric acid, measured at Mount Piper Power Station are displayed in Figure 5.
To determine if the elevated SO3 concentration reported is representative of in stack concentrations, the
following factors were considered:
coal sulfur content
formation of H2SO4 and SO3
stack test results for SO2 and SO3.
The review concluded that the elevated H2SO4 (SO3) concentration of 120 mg/m3, measured in April 2014, is
unlikely to be representative of in stack concentrations at the time of sampling. The high concentration may
be due to sampling or analysis error.
Figure 5: Mount Piper SO3 results (2011‐2016). The 2014 exceedance is clearly identifiable.
3.3.1 Mount Piper Coal Sulfur Content All coal burnt at Mount Piper Power Station is received from Springvale coal mine. Springvale is, and has
been for a number of years, the only coal mine supplying Mount Piper. All Springvale coal supplied to Mount
Piper comes from the one seam (the Lithgow seam).
A single conveyor from Springvale delivers coal from the colliery to either a storage area or directly to the
main receiving bin, then on to the crushing plant, to the mill building for final sizing, then to the boiler
bunkers for transfer to either of the Unit 1/ Unit 2 boilers. No further treatment or conditioning is
undertaken before the coal is burnt.
Coal received from Springvale is sampled and analysed for calorific value, moisture and ash content. Daily
samples are kept and from daily samples, a composite sample is taken and analysed as required under the
4 EML Air Pty Ltd Report Number N92464 ‐ Emission Testing Report Energy Australia NSW Pty Ltd (Mt Piper), Mt Piper Power Station (30 May 2014) 5 EML Air Pty Ltd Report Number N92972 ‐ Emission Testing Report Energy Australia NSW Pty Ltd, Mt Piper Power Station (18 August 2014)

Attachment C: Compliance with Air Emission Limits, Monitoring and Reporting Requirements Page | 22
EPL. The monthly coal sulfur content and SO2 stack test results are shown in Figure 6 below. The sulfur
content (%) has been stable between 0.7% and 0.9% between 2011 and 2015.
Table 17 displays the 2014 monthly coal analysis data for Mount Piper Power Station. The sulfur content of
the coal was relatively consistent throughout all months of the year, ranging between 0.74% and 0.89%.
Figure 6: Mount Piper coal sulfur content and SO2 stack test results (2011‐2015).
Table 17: 2014 monthly coal analysis data for Mount Piper power station. Sourced from data provided by Mount Piper, contained in excel workbook “2012‐2017 monthly data as fired.xlsx”.
6/07/2009 18/11/2010 1/04/2012 14/08/2013 27/12/2014 10/05/2016 22/09/2017
0
200
400
600
800
1000
1200
1400
1600
0
0.1
0.2
0.3
0.4
0.5
0.6
0.7
0.8
0.9
1
SO2 m
g/m3
Sulfur Content %
Date
Mount Piper Coal Analysis (2011‐2015)
Sulfur Content % Stack Test SO2

Attachment C: Compliance with Air Emission Limits, Monitoring and Reporting Requirements Page | 23
3.3.2 Formation of H2SO4 and SO3 The formation of SO3 will occur during the combustion of sulfur bearing fuels such as coal and heavy fuel oils.
During the combustion of coal, virtually all sulfur gets oxidized to gaseous species such as SO2 and SO3, with
SO2 being the principal oxide. Virtually all SO3 converts to H2SO4 as flue gas is cooled.
Literature and data suggests the typical conversion of SO2 to SO3 in coal‐fired boilers, in the presence of fly
ash, ranges between, 0.8 to 1.6% for bituminous and 0.05–0.1% for sub‐bituminous coals6. Data comparing
SO2 and SO3 concentrations at Mount Piper is presented in the following sub‐section on SO2 and SO3 stack
test results.
The chemistry of SO3 and water to make sulfuric acid vapor is temperature dependent, that is, the amount of
sulfuric acid molecules that are formed is related to the temperature of the exhaust. Therefore, the amount
of manufactured and released sulfuric acid are dependent upon the flue gas temperature.
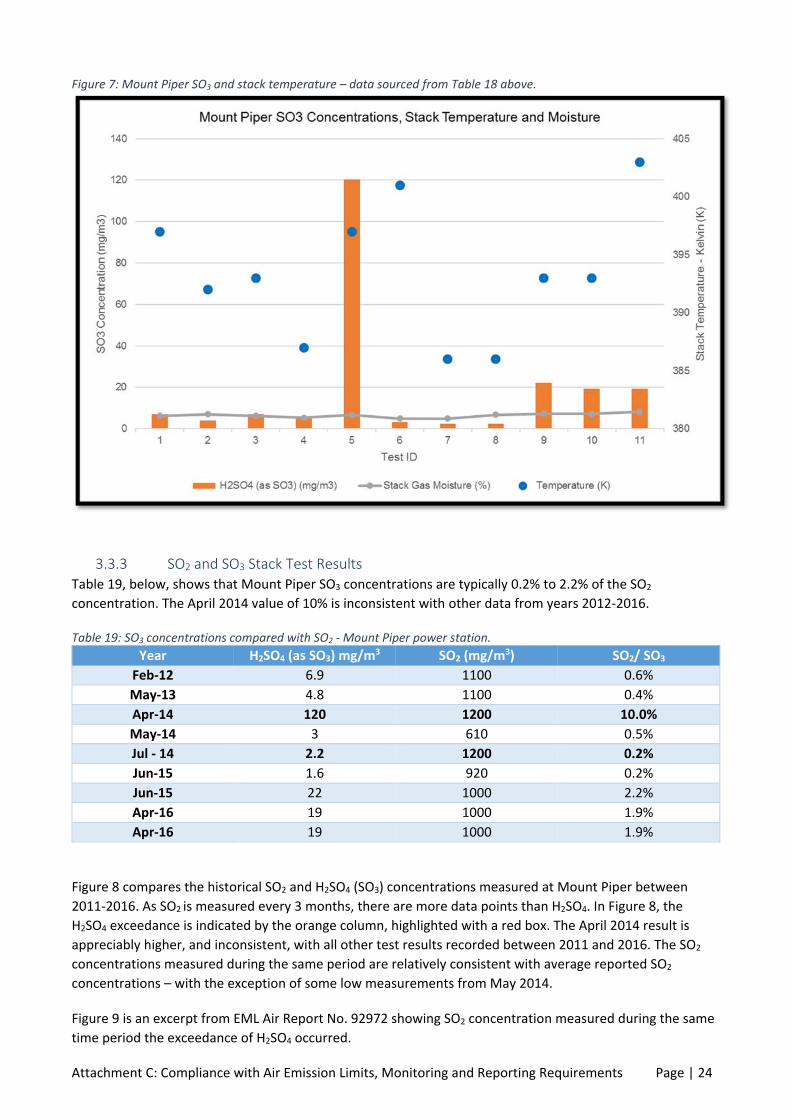
As shown in Table 18 and Figure 7, the measured stack temperature has been relatively consistent between
386 and 403 Kelvin (or 113 to 130 degrees Celsius). There appears to be no simple relationship between
moisture content, temperature and the high H2SO4 concentration measured in April 2014.
Table 18: Summary of Mount Piper SO3 results, stack temperature, moisture and boiler load.
Test ID Date sampled H2SO4 (as SO3) (mg/m3) Temperature (K) Stack Gas
Moisture (%) Boiler load
(MW) 1 9‐Feb‐12 6.9 397 6.2 670
2 16‐Feb‐12 3.6 392 7.0 670
3 24‐May‐13 6.9 393 6.2 575
4 28‐May‐13 4.8 387 5.3 575
5 10‐Apr‐14 120 397 6.6 680 6 15‐May‐14 3 401 4.9 575
7 22‐Jul‐14 2.2 386 4.9 575 8 9‐Jun‐15 2 386 6.8 440
9 17‐Jun‐15 22 393 7.3 440
10 14‐Apr‐16 19 393 7.2 600
11 28‐Apr‐16 19 403 8.2 620
6 Emissions of Sulfur Trioxide from Coal‐Fired Power Plants – Technical Paper. R.K. Srivastava and C.A. Miller. Office of Research and Development, National Risk Management Research Laboratory, Air Pollution Prevention and Control Division, U.S. Environmental Protection Agency, Research Triangle Park, North Carolina
Attachment C: Compliance with Air Emission Limits, Monitoring and Reporting Requirements Page | 24
Figure 7: Mount Piper SO3 and stack temperature – data sourced from Table 18 above.
3.3.3 SO2 and SO3 Stack Test Results Table 19, below, shows that Mount Piper SO3 concentrations are typically 0.2% to 2.2% of the SO2
concentration. The April 2014 value of 10% is inconsistent with other data from years 2012‐2016.
Table 19: SO3 concentrations compared with SO2 ‐ Mount Piper power station.
Year H2SO4 (as SO3) mg/m3 SO2 (mg/m3) SO2/ SO3 Feb‐12 6.9 1100 0.6%
May‐13 4.8 1100 0.4%
Apr‐14 120 1200 10.0% May‐14 3 610 0.5%
Jul ‐ 14 2.2 1200 0.2% Jun‐15 1.6 920 0.2%
Jun‐15 22 1000 2.2%
Apr‐16 19 1000 1.9%
Apr‐16 19 1000 1.9%
Figure 8 compares the historical SO2 and H2SO4 (SO3) concentrations measured at Mount Piper between
2011‐2016. As SO2 is measured every 3 months, there are more data points than H2SO4. In Figure 8, the
H2SO4 exceedance is indicated by the orange column, highlighted with a red box. The April 2014 result is
appreciably higher, and inconsistent, with all other test results recorded between 2011 and 2016. The SO2
concentrations measured during the same period are relatively consistent with average reported SO2
concentrations – with the exception of some low measurements from May 2014.
Figure 9 is an excerpt from EML Air Report No. 92972 showing SO2 concentration measured during the same
time period the exceedance of H2SO4 occurred.

Attachment C: Compliance with Air Emission Limits, Monitoring and Reporting Requirements Page | 25
Figure 8: Mount Piper H2SO4 and SO2 stack test results (2011‐2016).
Figure 9: Excerpt from EML Air report # 92972 showing SO2 concentration measured during the same time period sulfur trioxide was sampled.

Attachment C: Compliance with Air Emission Limits, Monitoring and Reporting Requirements Page | 26
4) Compliance with Regulatory Reporting Requirements To investigate if the power stations were compliant with regulatory reporting requirements for the period
2011‐2016, EPA considered the following:
• Annual Returns ‐ All NSW power stations are required to submit an Annual Return form including a
statement of compliance with regulatory conditions.
• Published monitoring data ‐ Each power station is required to publish monitoring data on the
licensee’s website. In accordance with the POEO Act (1997).
• Air emissions exceedance reports – Power station EPLs include requirements to report emissions
found in exceedance of reporting limits.
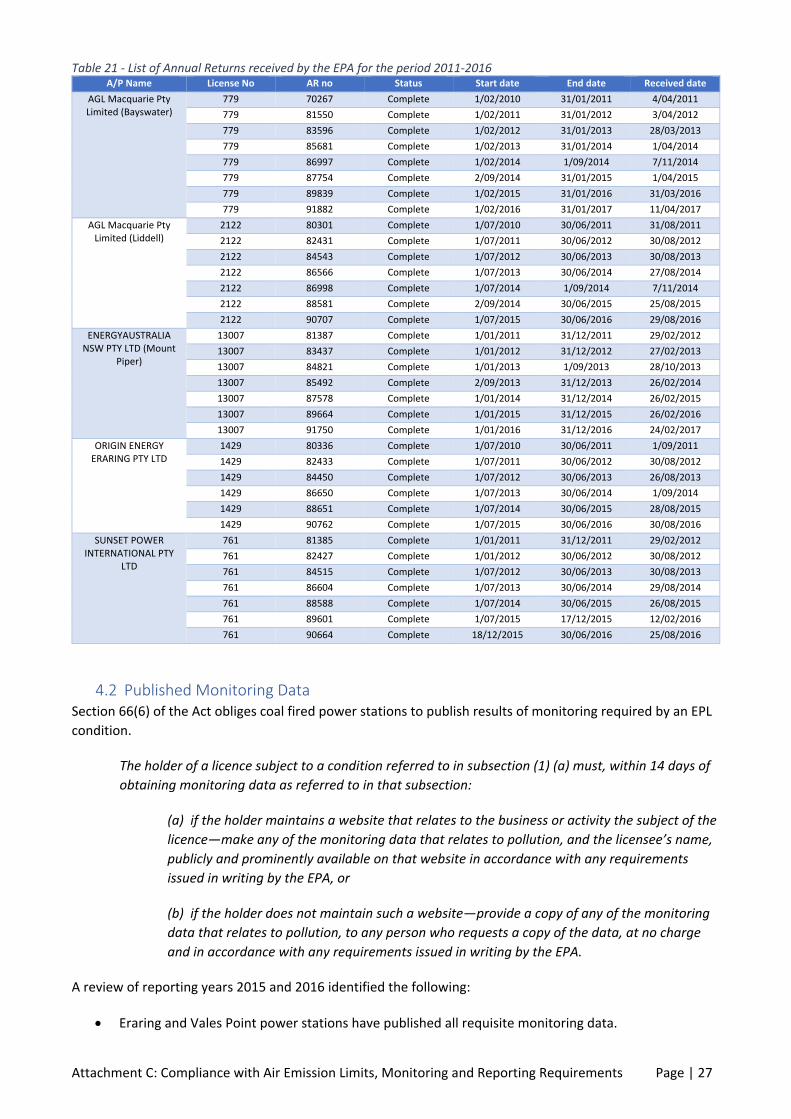
4.1 Annual Returns All NSW power stations are required to submit an Annual Return form including a statement of compliance
with regulatory conditions. All power stations submitted and Annual Return to the EPA for all years reviewed
– refer to Table 21.
For the period of review (2011‐2016), Liddell reported six non‐compliances related to air emissions, including
failure to monitor volatile organic compounds due to oversight, an opacity exceedance due to operational
failure, and failure to report an exceedance of its sulfur dioxide reporting limit within the timeframe
specified in its EPL. Details are provided in Table 20.
No other power station reported non‐compliances, relating to air emissions, in their Annual Returns for the
review period.
Table 20: Liddell power station, reported non‐compliances with EPL conditions ‐ from Annual Returns (2011‐2016).
AR no Start date End date Condition number
Number of incidents
Summary of particulars
82431 1/07/2011 30/06/2012 R1.10.1 2 Exceeded smoke reporting limit of 20% opacity. Licensee required to provide report under this condition if there is an exceedance of the 20% opacity trigger value.
86566 1/07/2013 30/06/2014 M2.2 2 Monitoring of VOC concentrations on points 2 & 4 were not carried out after change in requirements due to an oversight. Minor opacity trigger exceedance due to mechanical fault in pulse cycling for bag cleaning.
86998 1/07/2014 1/09/2014 M2.2 1 No VOC monitoring was completed during the reporting period due to an oversight in the monitoring regime. The next monitoring event is scheduled for October 2014 and is to incorporate VOC monitoring.
90707 1/07/2015 30/06/2016 R4.1 1 Concentration limit exceedance of sulphur dioxide was not reported within 30 days as required.
Attachment C: Compliance with Air Emission Limits, Monitoring and Reporting Requirements Page | 27
Table 21 ‐ List of Annual Returns received by the EPA for the period 2011‐2016 A/P Name License No AR no Status Start date End date Received date
AGL Macquarie Pty Limited (Bayswater)
779 70267 Complete 1/02/2010 31/01/2011 4/04/2011
779 81550 Complete 1/02/2011 31/01/2012 3/04/2012
779 83596 Complete 1/02/2012 31/01/2013 28/03/2013
779 85681 Complete 1/02/2013 31/01/2014 1/04/2014
779 86997 Complete 1/02/2014 1/09/2014 7/11/2014
779 87754 Complete 2/09/2014 31/01/2015 1/04/2015
779 89839 Complete 1/02/2015 31/01/2016 31/03/2016
779 91882 Complete 1/02/2016 31/01/2017 11/04/2017
AGL Macquarie Pty Limited (Liddell)
2122 80301 Complete 1/07/2010 30/06/2011 31/08/2011
2122 82431 Complete 1/07/2011 30/06/2012 30/08/2012
2122 84543 Complete 1/07/2012 30/06/2013 30/08/2013
2122 86566 Complete 1/07/2013 30/06/2014 27/08/2014
2122 86998 Complete 1/07/2014 1/09/2014 7/11/2014
2122 88581 Complete 2/09/2014 30/06/2015 25/08/2015
2122 90707 Complete 1/07/2015 30/06/2016 29/08/2016
ENERGYAUSTRALIA NSW PTY LTD (Mount
Piper)
13007 81387 Complete 1/01/2011 31/12/2011 29/02/2012
13007 83437 Complete 1/01/2012 31/12/2012 27/02/2013
13007 84821 Complete 1/01/2013 1/09/2013 28/10/2013
13007 85492 Complete 2/09/2013 31/12/2013 26/02/2014
13007 87578 Complete 1/01/2014 31/12/2014 26/02/2015
13007 89664 Complete 1/01/2015 31/12/2015 26/02/2016
13007 91750 Complete 1/01/2016 31/12/2016 24/02/2017
ORIGIN ENERGY ERARING PTY LTD
1429 80336 Complete 1/07/2010 30/06/2011 1/09/2011
1429 82433 Complete 1/07/2011 30/06/2012 30/08/2012
1429 84450 Complete 1/07/2012 30/06/2013 26/08/2013
1429 86650 Complete 1/07/2013 30/06/2014 1/09/2014
1429 88651 Complete 1/07/2014 30/06/2015 28/08/2015
1429 90762 Complete 1/07/2015 30/06/2016 30/08/2016
SUNSET POWER INTERNATIONAL PTY
LTD
761 81385 Complete 1/01/2011 31/12/2011 29/02/2012
761 82427 Complete 1/01/2012 30/06/2012 30/08/2012
761 84515 Complete 1/07/2012 30/06/2013 30/08/2013
761 86604 Complete 1/07/2013 30/06/2014 29/08/2014
761 88588 Complete 1/07/2014 30/06/2015 26/08/2015
761 89601 Complete 1/07/2015 17/12/2015 12/02/2016
761 90664 Complete 18/12/2015 30/06/2016 25/08/2016
4.2 Published Monitoring Data Section 66(6) of the Act obliges coal fired power stations to publish results of monitoring required by an EPL
condition.
The holder of a licence subject to a condition referred to in subsection (1) (a) must, within 14 days of
obtaining monitoring data as referred to in that subsection:
(a) if the holder maintains a website that relates to the business or activity the subject of the
licence—make any of the monitoring data that relates to pollution, and the licensee’s name,
publicly and prominently available on that website in accordance with any requirements
issued in writing by the EPA, or
(b) if the holder does not maintain such a website—provide a copy of any of the monitoring
data that relates to pollution, to any person who requests a copy of the data, at no charge
and in accordance with any requirements issued in writing by the EPA.
A review of reporting years 2015 and 2016 identified the following:
Eraring and Vales Point power stations have published all requisite monitoring data.

Attachment C: Compliance with Air Emission Limits, Monitoring and Reporting Requirements Page | 28
o The review additionally confirmed that published data is consistent with stack test reports held by the EPA.
Bayswater and Liddell power stations have published all requisite monitoring results. o Errors in data transcription, presentation and consistency were identified. Issues include;
rounding of some data to zero; variable rounding from month to month; poor labelling of sampling dates and discharge points; and transposing of mean and maximum data.
Mount Piper did not publish all requisite monitoring results7 and some published data was in error: o Quarterly NOx and SO2 data in Q4 2015 and Q1 & Q2 2016 was not published o Annual mercury data for 2015 and 2016 was not published o The published particle data in 2016 for generating Unit 1 was the result of a single total
particle test of 2.2 mg/m3 from Duct A. Published data should have included tests for all ducts associated with the licenced discharge point. A test result from Duct B of 5.8 mg/m3
was not published. Additionally, a second test from duct A of 39 mg/m3 was not published. o Test data for solid particles from generating Unit 2 was not published for 2016. o Annual test data for all other monitored pollutants from Units 1 and 2 was not published for
2016.
4.3 EPL Reporting Limits In addition to concentration limits, some EPLs also include reporting limits. Table 22 summarises the
reporting limits and monitoring requirements for each of the power stations.
Table 22: NSW power station Environment Protection Licence – Reporting Limits
EPL Reporting Limits SO2 NOx Opacity
Bayswater 600 ppm (Boiler 1 Only) Not Required Not Required
Liddell 600 ppm 700 ppm 20% Opacity
Mount Piper No Continuous Monitoring Requirements
Eraring 600 ppm Not Required Not Required
Vales Point 600 ppm Not Required Not Required
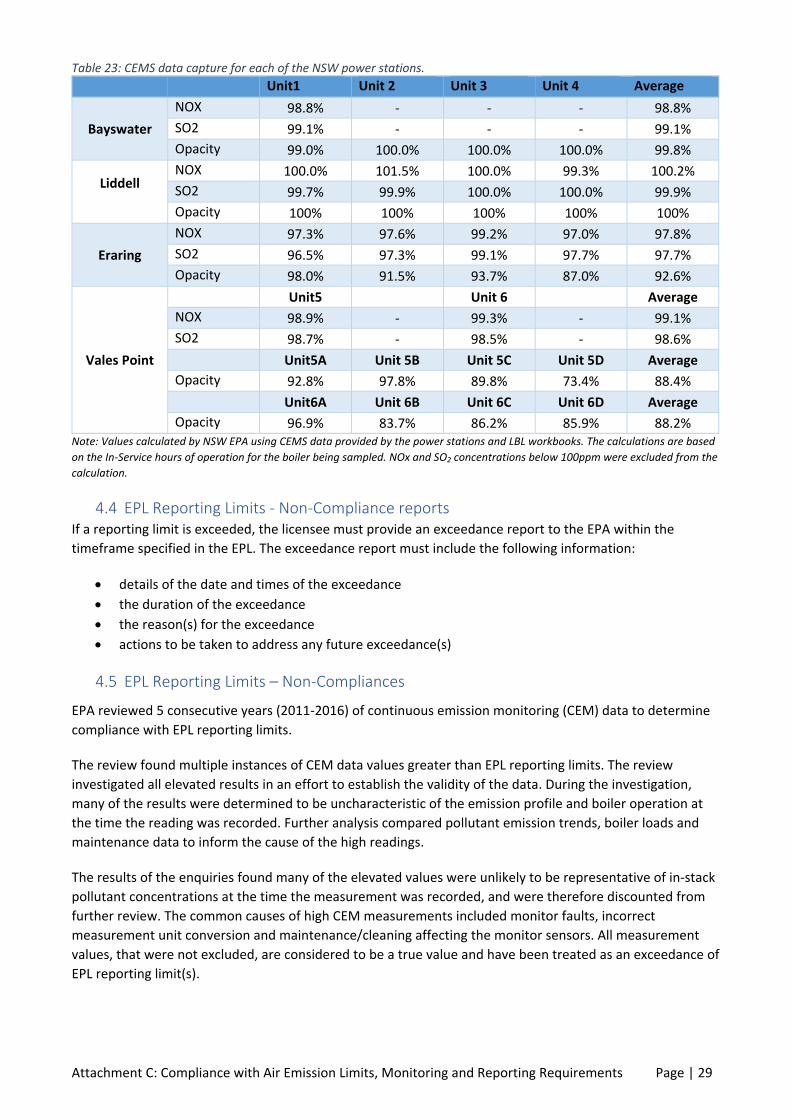
To comply with EPL reporting limits, the licensee must continuously monitor emissions to air for each
pollutant specified. Typically, data capture rates of 90% or above are recommended to demonstrate
continuous monitoring is being achieved. The review found CEMS monitoring being conducted at each of the
power stations is achieving high rates of data capture as per Table 23 over page.
7 EPA sourced published monitoring data from Energy Australia’s website page ‐https://www.energyaustralia.com.au/about‐
us/energy‐generation/mt‐piper‐power‐station/mt‐piper‐epa‐reports. EPA was unable to access historical published data records from website, http://www.de.com.au/Environment/Environmental‐Licences‐‐‐Monitoring/Mt‐Piper‐Power‐Station‐Monitoring‐Data/default.aspx
Attachment C: Compliance with Air Emission Limits, Monitoring and Reporting Requirements Page | 29
Table 23: CEMS data capture for each of the NSW power stations. Unit1 Unit 2 Unit 3 Unit 4 Average
Bayswater NOX 98.8% ‐ ‐ ‐ 98.8%
SO2 99.1% ‐ ‐ ‐ 99.1%
Opacity 99.0% 100.0% 100.0% 100.0% 99.8%
Liddell
NOX 100.0% 101.5% 100.0% 99.3% 100.2%
SO2 99.7% 99.9% 100.0% 100.0% 99.9%
Opacity 100% 100% 100% 100% 100%
Eraring NOX 97.3% 97.6% 99.2% 97.0% 97.8%
SO2 96.5% 97.3% 99.1% 97.7% 97.7%
Opacity 98.0% 91.5% 93.7% 87.0% 92.6%
Vales Point
Unit5 Unit 6 Average
NOX 98.9% ‐ 99.3% ‐ 99.1%
SO2 98.7% ‐ 98.5% ‐ 98.6%
Unit5A Unit 5B Unit 5C Unit 5D Average Opacity 92.8% 97.8% 89.8% 73.4% 88.4%
Unit6A Unit 6B Unit 6C Unit 6D Average Opacity 96.9% 83.7% 86.2% 85.9% 88.2%
Note: Values calculated by NSW EPA using CEMS data provided by the power stations and LBL workbooks. The calculations are based
on the In‐Service hours of operation for the boiler being sampled. NOx and SO2 concentrations below 100ppm were excluded from the
calculation.
4.4 EPL Reporting Limits ‐ Non‐Compliance reports If a reporting limit is exceeded, the licensee must provide an exceedance report to the EPA within the
timeframe specified in the EPL. The exceedance report must include the following information:
details of the date and times of the exceedance
the duration of the exceedance
the reason(s) for the exceedance
actions to be taken to address any future exceedance(s)
4.5 EPL Reporting Limits – Non‐Compliances
EPA reviewed 5 consecutive years (2011‐2016) of continuous emission monitoring (CEM) data to determine
compliance with EPL reporting limits.
The review found multiple instances of CEM data values greater than EPL reporting limits. The review
investigated all elevated results in an effort to establish the validity of the data. During the investigation,
many of the results were determined to be uncharacteristic of the emission profile and boiler operation at
the time the reading was recorded. Further analysis compared pollutant emission trends, boiler loads and
maintenance data to inform the cause of the high readings.
The results of the enquiries found many of the elevated values were unlikely to be representative of in‐stack
pollutant concentrations at the time the measurement was recorded, and were therefore discounted from
further review. The common causes of high CEM measurements included monitor faults, incorrect
measurement unit conversion and maintenance/cleaning affecting the monitor sensors. All measurement
values, that were not excluded, are considered to be a true value and have been treated as an exceedance of
EPL reporting limit(s).

Attachment C: Compliance with Air Emission Limits, Monitoring and Reporting Requirements Page | 30
Table 24 below provides a summary of identified reporting limit exceedances.
Table 24 ‐ Reporting limit exceedances identified by EPA for the review period 2011‐2016.
Record of Exceedances
Bayswater No Exceedances
Liddell
SO2 exceeded 600 ppm on 3 separate occasions between 2011 and 2016.
Opacity exceeded 20% opacity on 17 separate days between 2011 and 2013, and 2 days between 2014‐2016. Total of 19 exceedances.
Mount Piper
No Continuous Monitoring Requirements
Eraring No Exceedances
Vales Point No Exceedances
4.6 Liddell Reporting Limit Exceedances Table 25 contains the summary of non‐compliances reported, in Annual Returns, by Liddell Power Station.
Table 25: Summary of non‐compliances self‐reported by Liddell power station.
AR no Start date End date Condition no
Number of incidents Summary of particulars
82431 1/07/2011 30/06/2012 R1.10.1 2
Exceeded smoke reporting limit of 20% opacity. Licensee required to provide report under this condition if there is an exceedance of the 20% opacity trigger value.
86566 1/07/2013 30/06/2014 M2.2 1 Minor opacity trigger exceedance due to mechanical fault in pulse cycling for bag cleaning.
90707 1/07/2015 30/06/2016 R4.1 1 Concentration limit exceedance of sulphur dioxide was not reported within 30 days as required.
4.6.1 Liddell Reporting Limit Exceedances of SO2 A review of the CEM data provided by Liddell Power Station indicates that the SO2 reporting limit of 600 ppm
was exceeded three times, as per Table 26. For the purposes of this review, figures highlighted in red are
considered exceedances of the SO2 reporting limit – in the absence of information to the contrary.
Table 26: Liddell ‐ Summary of SO2 Exceedances – Measured by CEMS
Liddell ‐ Summary of SO2 Exceedances – Measured by CEMS
Date Time Unit Generator Load (MW) SO2 Concentration (ppm) Reporting Limit
2/09/2011 10.00 3 420.17 671 600
6/02/2016 23.00 4 219.69 605 600
6/02/2016 20.00 3 314.01 614 600

Attachment C: Compliance with Air Emission Limits, Monitoring and Reporting Requirements Page | 31
4.6.2 Liddell Reporting Limit Exceedances of Opacity Liddell’s continuous opacity monitors have recorded opacity values greater than 20% on 19 occasions over
the 5‐year period 2011‐2016, as shown in Table 277.
Table 27 ‐ Summary of opacity exceedances recorded by Liddell PS continuous opacity monitors. Exceedance # Date Unit Number Generator Load (MW) Fan A Opacity
(%) Fan B Opacity
(%) Average Opacity
(%)
1 14/07/2011 4 377 22.7 20.2 21.4 2 23/07/2011 2 302 31.4 18.9 25.1 3 24/07/2011 2 359 18.1 22.4 20.2 4 25/07/2011 2 357 18.5 23.0 20.7 5 6/09/2011 1 229 9.5 37.1 23.3 6 6/09/2011 2 251 33.8 7.9 20.8 7 25/11/2011 3 420 12.4 32.0 22.2 8 13/03/2012 2 344 76.8 0.4 38.6 9 14/03/2012 2 388 80.0 2.0 41.0 10 19/04/2012 2 454 68.9 10.9 39.9 11 15/05/2012 3 355 86.0 11.5 48.7 12 16/05/2012 1 388 92.1 6.1 49.1 13 16/05/2012 2 243 77.0 16.4 46.7 14 14/01/2013 4 404 6.7 36.9 21.8 15 31/01/2013 2 333 5.2 76.5 40.8 16 26/08/2013 1 464 7.8 42.4 25.1 17 5/12/2013 3 420 4.3 50.2 27.2 18 8/05/2014 1 446 9.9 66.4 38.1 19 5/06/2016 1 420 20.5 22.4 21.4
Note: The opacity monitoring data provided by Liddell is based on 1 hour averages. The averaging time for measuring opacity is not specified the licence. The Protection of the Environment Operations (Clean Air) Regulation specifies an averaging period of 6 minutes.
Since 2014 only 2 exceedances have been recorded by the opacity meters, as summarised in Table 28.
Indicating significant improvement when compared to the number of exceedances recorded between 2011 –
2013.
Table 28 ‐ Count of number of exceedances recorded at Liddell PS, tabulated by calendar year.
Review of Opacity Exceedances Liddell PS (2011‐2016) Year Unit1 Unit 2 Unit 3 Unit4 Number
reported to EPA Number of Exceedances
2011 1 4 1 1 7
2012 1 4 1 0 0
2013 1 1 1 1 1
2014 1 0 0 0 0
2015 0 0 0 0 0
2016 1 0 0 0 0
Total 5 9 3 2 8