CORONADO AND SPRINGERVILLE GENERATING STATIONS … · Coronado and Springerville Generating...
25
CORONADO AND SPRINGERVILLE GENERATING STATIONS: An Economic Impact Study Dr. Anthony Evans and Professor Tim James L. William Seidman Research Institute, W. P. Carey School of Business, Arizona State University September 24, 2014
Transcript of CORONADO AND SPRINGERVILLE GENERATING STATIONS … · Coronado and Springerville Generating...
CORONADO AND SPRINGERVILLE
GENERATING STATIONS:
An Economic Impact Study
Dr. Anthony Evans and Professor Tim James
L. William Seidman Research Institute,
W. P. Carey School of Business,
Arizona State University
September 24, 2014

L. WILLIAM SEIDMAN RESEARCH INSTITUTE
The L. William Seidman Research Institute serves as a link between the local, national, and international business
communities and the W. P. Carey School of Business at Arizona State University (ASU).
First established in 1985 to serve as a center for applied business research and a consultancy resource for the
Arizona business community, Seidman collects, analyzes and disseminates information about local economies,
benchmarks industry practices, and identifies emerging business research issues that affect productivity and
competitiveness.
Using tools that support sophisticated statistical modeling and planning, supplemented by an extensive
understanding of the local, state and national economies, Seidman today offers a host of economic research and
consulting services, including economic impact analyses, economic forecasting, general survey research, attitudinal
and qualitative studies, and strategic analyses of economic development opportunities.
Working on behalf of government agencies, regulatory bodies, public or privately‐owned firms, academic
institutions, and non‐profit organizations, Seidman specializes in studies at the city, county or statewide level.
Recent and current clients include:
Arizona Commerce Authority (ACA)
Arizona Corporation Commission (ACC)
Arizona Department of Mines and Mineral
Resources
Arizona Hospital and Healthcare Association
Arizona Investment Council (AIC)
Arizona Mining Council
Arizona Public Service Corporation (APS)
Arizona School Boards Association
Arizona Town Hall
ASU Athletics
The Boeing Company
The Central Arizona Project (CAP)
DeMenna & Associates
Envision Healthcare/AMR
Epic Rides/City of Prescott
Excelsior Mining
Executive Budget Office State of Arizona
First Things First
Freeport McMoran
Glendale Community College
Goodwill Industries
Maricopa Integrated Health System
Intel Corporation
iState Inc.
The McCain Institute
Maricopa Integrated Health System
The Morrison Institute
Navajo Nation Div. Economic Development
Phoenix Convention Center
Phoenix Philanthropy Group
Phoenix Sky Harbor International Airport
Public Service New Mexico (PNM)
Raytheon
Rosemont Copper Mine
Salt River Project (SRP)
Science Foundation Arizona (SFAZ)
The Tillman Foundation
Turf Paradise Valley METRO Light Rail
Twisted Adventures Inc.
Vote Solar Initiative
Waste Management Inc.

i
Executive Summary
BACKGROUND
On June 2, 2014, the U.S. Environmental Protection Agency (EPA) issued a proposed rule that regulates carbon
dioxide (CO2) emissions from existing power plants. In the proposed rule, EPA establishes different CO2
emission rate goals for each state. EPA set the emission rate goals for Arizona based on an assumption that all
coal‐fired generation in the state would be replaced with natural gas or other generation by 2020.
Since the proposed rule could result in the shutdown of all in‐state coal‐fired power plants, 1 Salt River Project
(SRP) and Tucson Electric Power (TEP) requested assistance from Arizona State University’s (ASU’s) Seidman
Institute to quantify the economic impact of Coronado and Springerville Generating Stations, two large coal‐
fired power plants located in Apache County in northeastern Arizona.
This report examines the direct, indirect, and induced economic impacts of Coronado and Springerville
Generating Stations, individually and jointly, at the county and state level.
The economic impact was assessed for the 2013 calendar year (CY2013), since this is the most recent year for
which complete data is available.
An Arizona‐specific version of the Regional Economic Models Inc. (REMI) model (version 1.6) is used to
implement the analysis. Widely recognized by the business and academic communities as the leading
economic modeling tool available, the REMI model is currently used by ASU for all business expansion and
relocation studies commissioned by the Arizona Commerce Authority.
STUDY HIGHLIGHTS
Coronado and Springerville Generating Stations employ 218 and 332 FTE staff respectively. 2
Total employee compensation in CY2013 was $29.7 million for Coronado Generating Station, and $46.3 million
for Springerville Generating Station.
The U.S. Bureau of Labor Statistics estimates that the average weekly wage for the final quarter of 2013 in
Apache County was $783 per employee.3 The comparative average weekly wage at both generating stations
(excluding employee benefits) is over $1,825 per employee ‐ that is, more than double the county average.
An overview of the generating stations’ economic impacts in the State of Arizona in CY2013 is as follows.
1 Not including coal‐fired power plants located on tribal land. 2 FTE = full‐time (or equivalent). 3 Source: U.S. Bureau of Labor Statistics QCEW State and County Map – Apache County Industry Data.
ii
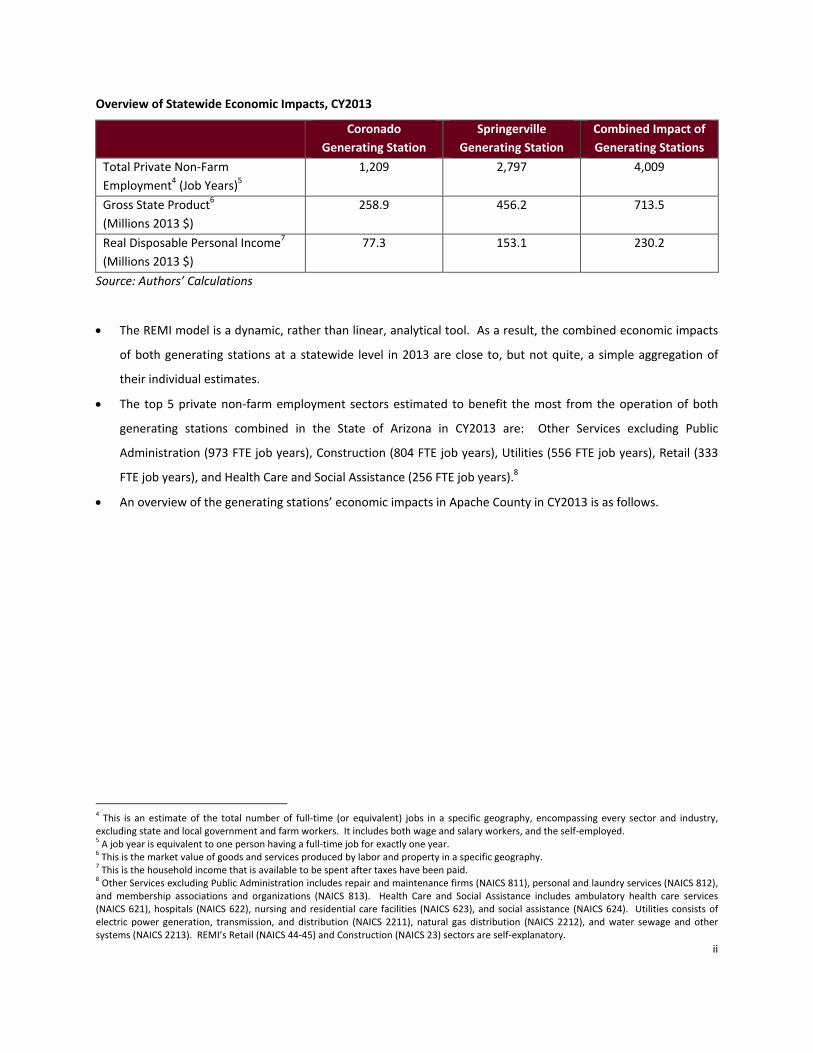
Overview of Statewide Economic Impacts, CY2013
Coronado
Generating Station
Springerville
Generating Station
Combined Impact of
Generating Stations
Total Private Non‐Farm
Employment4 (Job Years)5
1,209 2,797 4,009
Gross State Product6
(Millions 2013 $)
258.9 456.2 713.5
Real Disposable Personal Income7
(Millions 2013 $)
77.3 153.1 230.2
Source: Authors’ Calculations
The REMI model is a dynamic, rather than linear, analytical tool. As a result, the combined economic impacts
of both generating stations at a statewide level in 2013 are close to, but not quite, a simple aggregation of
their individual estimates.
The top 5 private non‐farm employment sectors estimated to benefit the most from the operation of both
generating stations combined in the State of Arizona in CY2013 are: Other Services excluding Public
Administration (973 FTE job years), Construction (804 FTE job years), Utilities (556 FTE job years), Retail (333
FTE job years), and Health Care and Social Assistance (256 FTE job years).8
An overview of the generating stations’ economic impacts in Apache County in CY2013 is as follows.
4 This is an estimate of the total number of full‐time (or equivalent) jobs in a specific geography, encompassing every sector and industry, excluding state and local government and farm workers. It includes both wage and salary workers, and the self‐employed. 5 A job year is equivalent to one person having a full‐time job for exactly one year. 6 This is the market value of goods and services produced by labor and property in a specific geography. 7 This is the household income that is available to be spent after taxes have been paid. 8 Other Services excluding Public Administration includes repair and maintenance firms (NAICS 811), personal and laundry services (NAICS 812), and membership associations and organizations (NAICS 813). Health Care and Social Assistance includes ambulatory health care services (NAICS 621), hospitals (NAICS 622), nursing and residential care facilities (NAICS 623), and social assistance (NAICS 624). Utilities consists of electric power generation, transmission, and distribution (NAICS 2211), natural gas distribution (NAICS 2212), and water sewage and other systems (NAICS 2213). REMI’s Retail (NAICS 44‐45) and Construction (NAICS 23) sectors are self‐explanatory.
iii
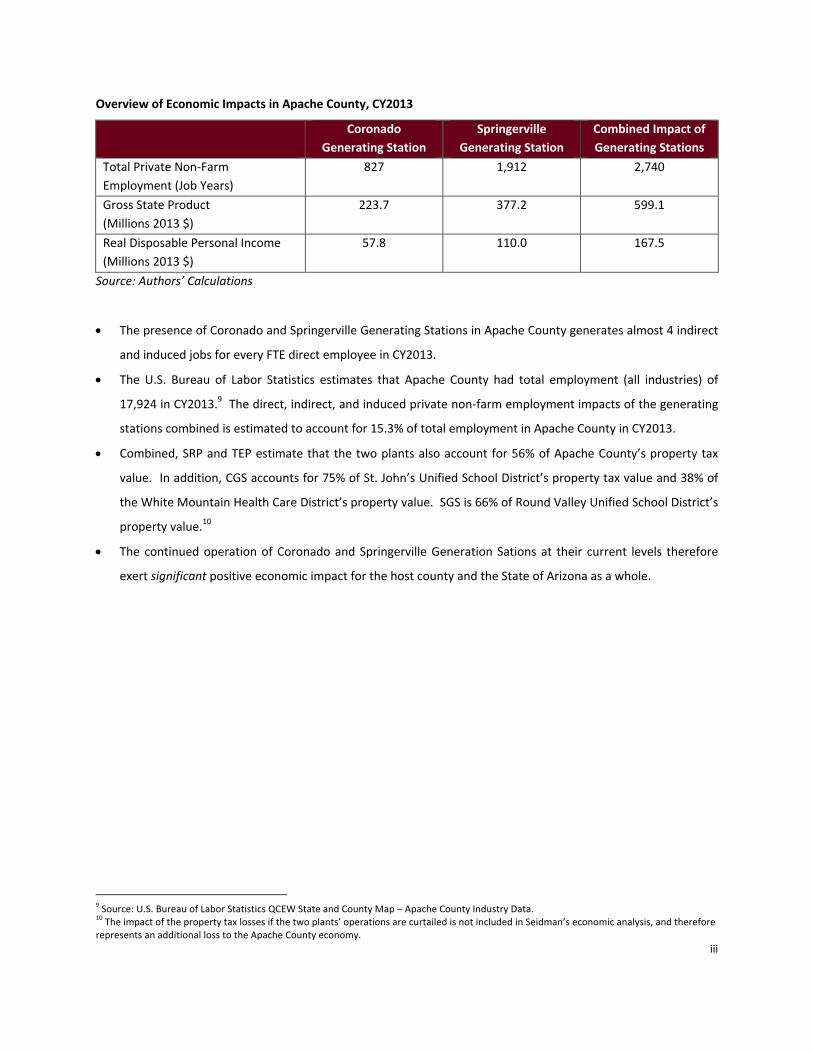
Overview of Economic Impacts in Apache County, CY2013
Coronado
Generating Station
Springerville
Generating Station
Combined Impact of
Generating Stations
Total Private Non‐Farm
Employment (Job Years)
827 1,912 2,740
Gross State Product
(Millions 2013 $)
223.7 377.2 599.1
Real Disposable Personal Income
(Millions 2013 $)
57.8 110.0 167.5
Source: Authors’ Calculations
The presence of Coronado and Springerville Generating Stations in Apache County generates almost 4 indirect
and induced jobs for every FTE direct employee in CY2013.
The U.S. Bureau of Labor Statistics estimates that Apache County had total employment (all industries) of
17,924 in CY2013.9 The direct, indirect, and induced private non‐farm employment impacts of the generating
stations combined is estimated to account for 15.3% of total employment in Apache County in CY2013.
Combined, SRP and TEP estimate that the two plants also account for 56% of Apache County’s property tax
value. In addition, CGS accounts for 75% of St. John’s Unified School District’s property tax value and 38% of
the White Mountain Health Care District’s property value. SGS is 66% of Round Valley Unified School District’s
property value.10
The continued operation of Coronado and Springerville Generation Sations at their current levels therefore
exert significant positive economic impact for the host county and the State of Arizona as a whole.
9 Source: U.S. Bureau of Labor Statistics QCEW State and County Map – Apache County Industry Data. 10 The impact of the property tax losses if the two plants’ operations are curtailed is not included in Seidman’s economic analysis, and therefore
represents an additional loss to the Apache County economy.
iv
TABLE OF CONTENTS
Executive Summary i
1. Introduction 1
2. Report Method 2
2.1 Introduction to Economic Impact Analysis 2
2.2 The REMI Model 3
2.3 Model Inputs 4
3. Simulation Results: Coronado Generating Station, CY2013 5
4. Simulation Results: Springerville Generating Station, CY2013 9
5. Simulation Results: Combined Impact of Coronado and Springerville Generating Stations, CY2013 13
6. Conclusion 17
LIST OF TABLES
Table 1: REMI Model Inputs, CY2013 ............................................................................................................................ 4
Table 2: Overview of Coronado Generating Station’s Economic Impact, CY2013 ......................................................... 6
Table 3: Comparison of Direct and Indirect/Induced Private Non‐Farm Employment Job Years in Apache County .... 7
Table 4: Overview of Springerville Generating Station’s Economic Impact, CY2013 .................................................. 10
Table 5: Comparison of Direct and Indirect/Induced Private Non‐Farm Employment Job Years in Apache County .. 10
Table 6: Overview of Coronado and Springerville Generating Stations’ Total Economic Impact, CY2013 .................. 14
Table 7: Comparison of Direct and Indirect/Induced Private Non‐Farm Employment Job Years in Apache County .. 14
Table 8: Overview of Individual and Combined Generating Station Economic Impacts, CY2013 ............................... 17
LIST OF FIGURES
Figure 1: Statewide Private Non‐Farm Job Impacts, CY2013 ......................................................................................... 7
Figure 2: Statewide Population Impacts, CY2013 .......................................................................................................... 8
Figure 3: Statewide Private Non‐Farm Job Impacts, CY2013 ....................................................................................... 11
Figure 4: Statewide Population Impacts, CY2013 ........................................................................................................ 12
Figure 5: Statewide Private Non‐Farm Job Impacts, CY2013 ....................................................................................... 15
Figure 6: Statewide Population Impacts, CY2013 ........................................................................................................ 16
Page | 1
1. Introduction
Coronado Generating Station (CGS) is a coal‐fired, 773 MW steam electric power station near St. Johns, Apache
County, generating electricity for Salt River Project (SRP) since 1979. Springerville Generating Station (SGS) is a
coal‐fired, 1,560 MW steam electric power station near Springerville, Apache County, generating electricity for
Tucson Electric Power (TEP), Tri‐State Generation & Transmission, and SRP.
On June 2, 2014, the United States Environmental Protection Agency (EPA) issued a proposed Clean Power Plan.
This proposed rule limits nationwide carbon dioxide (CO2) emissions from existing fossil fuel‐fired stationary
combustion turbines and electric utility steam generating units, including CGS and SGS. The proposed rule
establishes state‐specific target emissions rates. EPA calculated the emission rate goals for the State of Arizona
assuming that all coal generation could be displaced by natural gas generation and other resources by 2020.
The implementation of the rule as proposed threatens the long‐term viability of both coal‐fired generating stations
in Apache County. Accordingly, SRP and TEP requested that the L. William Seidman Research Institute, W. P. Carey
School of Business, ASU conduct a study of the economic impact of both generating stations in order to help
members of the public understand the potential impact of shutting down the two facilities.
The objectives of this current study are twofold, namely:
To quantify the direct economic impacts and indirect/induced effects of CGS and SGS individually, at both a
county and state level, for the latest full calendar year – CY2013.
To estimate a combined figure for the total contribution of both generating stations to Apache County and the
State of Arizona economies in CY2013.
Section 2 describes the research method and model inputs.
An estimate of the economic impact of CGS in CY2013 is presented in Section 3.
An estimate of the economic impact of SGS in CY2013 is presented in Section 4.
Section 5 estimates the combined economic impact of both generating stations in CY2013 for the Apache County
and State of Arizona economies.
Conclusions are presented in Section 6.
Page | 2
2. Report Method
2.1 Introduction to Economic Impact Analysis
Economic impact analysis traces the full impact ‐ direct, indirect and induced ‐ of an economic activity on jobs and
incomes in a defined economy.
The operation of a generating station directly affects a county or state economy through its employment of power
plant operators, distributors and dispatchers, maintenance managers, technicians, administrative and support
staff, and management. Direct effects also arise through a generating station’s purchase of coal or natural gas,
chemicals, machinery, motor vehicles, computers, electrical equipment, and other supplies; and through the
payment of property taxes.
Indirect effects occur when the suppliers of a generating station, for example, place upstream demands on other
producers, or increase their number of employees to meet the generating station’s demand. These second round
impacts only occur because of the existence and operation of the generating station.
Induced effects occur when workers, either directly or indirectly associated with the operation of a generating
station, spend their incomes in the local economy. The sales, income, and jobs that result from household
spending of added wage, salary, or proprietor’s income are all induced effects.
The cumulative changes in jobs and incomes associated with the operation of a generating station are a multiple of
the initial direct effects.
These rounds of expenditures are not self‐perpetuating in equal measure. In fact, they become smaller as more of
the income/expenditures “leak” out of the local economy.11 The cumulative impacts of these rounds of
expenditures or “ripple effects” are known as the multiplier effect in economics.
Importantly, there is no one “magic” multiplier number for every conceivable scenario. Due to the inter‐linked
nature of the Arizona economy and its links to the rest of the U.S. (and the world), the eventual ripple effects
depend on numerous different factors.12
11 For example, in the form of savings, payments on goods and services produced outside of the state, etc.
12 In very simple terms, what matters is the size of the direct impact, where it occurs (that is, which county and which sector of the economy)
and the duration of the impacts.
Page | 3
The magnitude of secondary effects depends on the propensity of businesses and households in the region to
purchase goods and services from local suppliers. A full understanding of the total impact that a generating station
has on the local economy is therefore rather more complex than just an extrapolation of direct impacts. This is the
reason for the current study.
2.2 The REMI Model
This report uses an Arizona‐specific version of the REMI regional forecasting model (version 1.6) to produce
numeric estimates of the impact of a generating station upon the host county and state economies.
REMI is a dynamic forecasting and analysis tool developed by Regional Economic Models Inc., containing a wealth
of detail about industries and inter‐industry relationships.
Widely recognized by the business and academic communities as the leading economic modeling tool available,
the REMI model is currently used by ASU’s Seidman Institute (Seidman) for all business expansion and relocation
studies commissioned by the Arizona Commerce Authority. Seidman is also the only known consultancy in the
state offering this dynamic type of economic modeling.
Through its dynamic multi‐year functionality, REMI can take account of variations in the economic impact of a
generating station through time. The model examines the county or state economies over a specific time‐horizon
with and without the existence of a generating station.
The use of a county level model also enables a more detailed disaggregation of results to occur, thereby estimating
any economic impacts that ‘leak’ into other counties within Arizona.
Seidman’s method for estimating economic impact involves four fundamental steps:
1. Prepare a baseline forecast: This baseline scenario provides a forecast of the future path of the county or
state economy based on a combination of the extrapolation of historic economic conditions and an exogenous
forecast of relevant national economic variables. This is often referred to as the Business as Usual (BAU) case.
2. Develop a policy scenario: The policy scenario describes the direct impacts that the operation of a generating
station will have in a specific county or state.
3. Prepare a forecast of the county or state economy based on the policy scenario: This alternative forecast
simulates the future path of the county or state economy, based on the operation of the generating station as
described in the policy scenario.
Page | 4
4. Compare the baseline and policy scenario forecasts: The differences between the future values of each
variable in the BAU and policy scenario forecasts numerically estimate the nature and magnitude of a
generating station’s impact on the host county and state economies, relative to the baseline.
2.3 Model Inputs
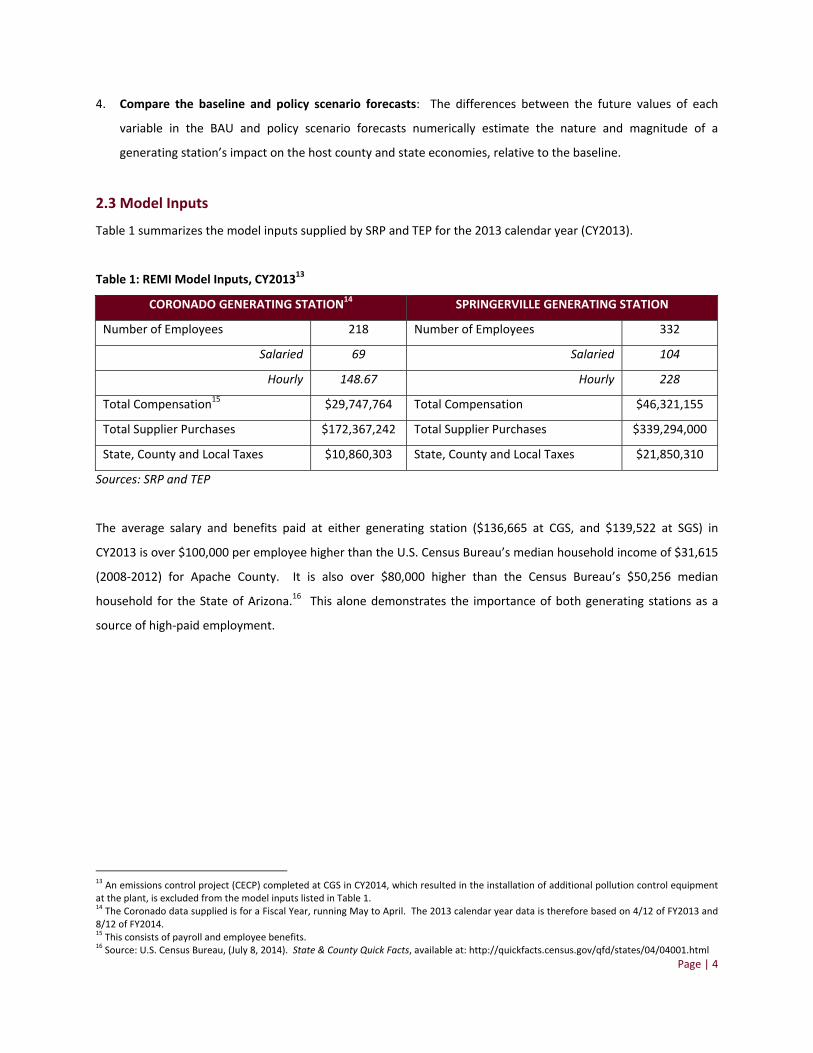
Table 1 summarizes the model inputs supplied by SRP and TEP for the 2013 calendar year (CY2013).
Table 1: REMI Model Inputs, CY201313
CORONADO GENERATING STATION14 SPRINGERVILLE GENERATING STATION
Number of Employees 218 Number of Employees 332
Salaried 69 Salaried 104
Hourly 148.67 Hourly 228
Total Compensation15 $29,747,764 Total Compensation $46,321,155
Total Supplier Purchases $172,367,242 Total Supplier Purchases $339,294,000
State, County and Local Taxes $10,860,303 State, County and Local Taxes $21,850,310
Sources: SRP and TEP
The average salary and benefits paid at either generating station ($136,665 at CGS, and $139,522 at SGS) in
CY2013 is over $100,000 per employee higher than the U.S. Census Bureau’s median household income of $31,615
(2008‐2012) for Apache County. It is also over $80,000 higher than the Census Bureau’s $50,256 median
household for the State of Arizona.16 This alone demonstrates the importance of both generating stations as a
source of high‐paid employment.
13 An emissions control project (CECP) completed at CGS in CY2014, which resulted in the installation of additional pollution control equipment
at the plant, is excluded from the model inputs listed in Table 1. 14 The Coronado data supplied is for a Fiscal Year, running May to April. The 2013 calendar year data is therefore based on 4/12 of FY2013 and
8/12 of FY2014. 15 This consists of payroll and employee benefits.
16 Source: U.S. Census Bureau, (July 8, 2014). State & County Quick Facts, available at: http://quickfacts.census.gov/qfd/states/04/04001.html
Page | 5
3. Simulation Results: Coronado Generating Station, CY2013
This section estimates the direct, indirect, and induced economic impacts of CGS in CY2013. Results are presented
for both Apache County (the host county) and for the State of Arizona as a whole. All dollar amounts are
expressed in 2013 dollars (2013 $).
CGS is a coal‐fired, 773 MW steam electric power station near St. Johns, Apache County, generating electricity for
SRP since 1979. Coronado has 218 full‐time or equivalent (FTE) employees, consisting of 69 salaried and 149
hourly people, who receive $29.7 million in wages, salaries, and benefits. The average salary and benefits paid at
CGS ($136,665) in CY2013 is over $100,000 per employee higher than the U.S. Census Bureau’s median household
income of $31,615 (2008‐2012) for Apache County.17 In CY2013, Coronado Generating Station purchased over
$172.3 million goods and services from in‐state and out‐of‐state suppliers. The Generating Station also paid over
$10.8 million in state, county and local taxes.
Table 2 estimates the economic impacts of CGS in terms of three key measures:
Total private non‐farm employment
Gross State Product
Real disposable personal income
Total private non‐farm employment is an estimate of the total number of FTE jobs in a specific geography,
encompassing every sector and industry, but excluding state and local government workers and farm workers. It
includes both wage and salary workers, and the self‐employed.
Gross State Product (GSP) is the market value of goods and services produced by labor and property in a specific
geography. It excludes the value of intermediate goods and services purchased as inputs to final production. GSP
can also be defined as the sum of employee compensation (wages, salaries and benefits, including employer
contributions to health insurance and retirement pensions), proprietor income, property income, and indirect
business taxes. GSP is commonly used as an indicator of the economic health of a state or nation.
17 Source: U.S. Census Bureau, (July 8, 2014). State & County Quick Facts, available at: http://quickfacts.census.gov/qfd/states/04/04001.html
Page | 6
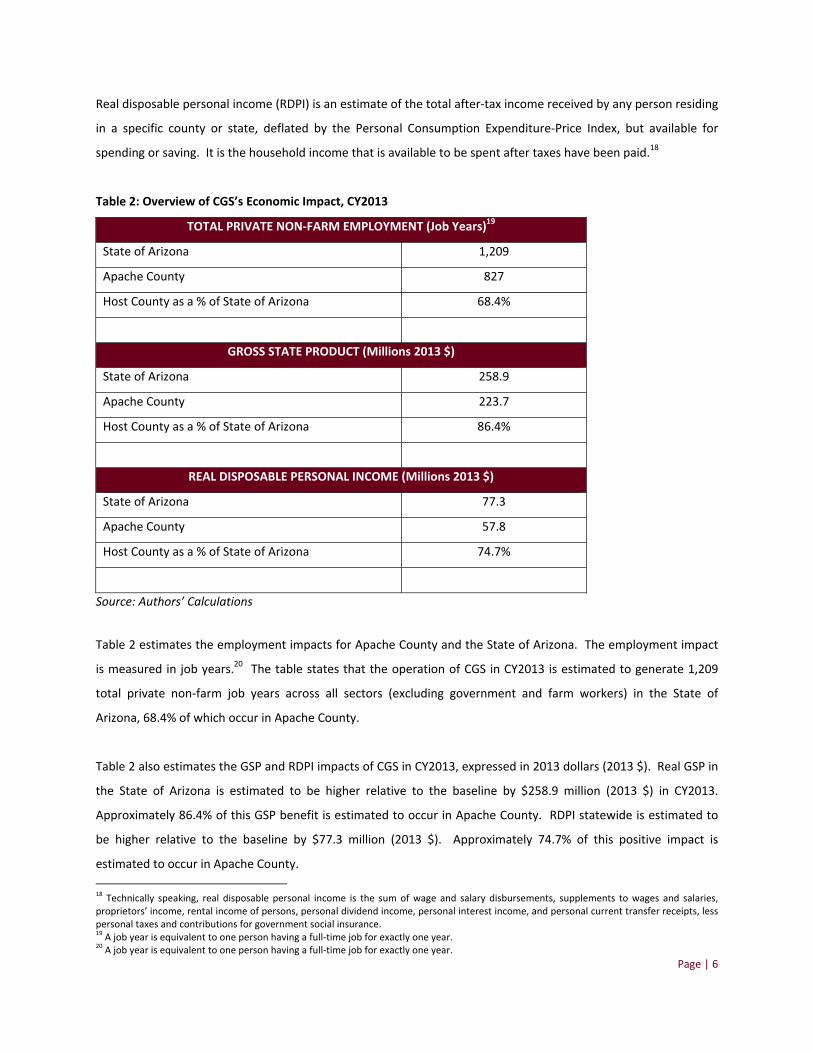
Real disposable personal income (RDPI) is an estimate of the total after‐tax income received by any person residing
in a specific county or state, deflated by the Personal Consumption Expenditure‐Price Index, but available for
spending or saving. It is the household income that is available to be spent after taxes have been paid.18
Table 2: Overview of CGS’s Economic Impact, CY2013
TOTAL PRIVATE NON‐FARM EMPLOYMENT (Job Years)19
State of Arizona 1,209
Apache County 827
Host County as a % of State of Arizona 68.4%
GROSS STATE PRODUCT (Millions 2013 $)
State of Arizona 258.9
Apache County 223.7
Host County as a % of State of Arizona 86.4%
REAL DISPOSABLE PERSONAL INCOME (Millions 2013 $)
State of Arizona 77.3
Apache County 57.8
Host County as a % of State of Arizona 74.7%
Source: Authors’ Calculations
Table 2 estimates the employment impacts for Apache County and the State of Arizona. The employment impact
is measured in job years.20 The table states that the operation of CGS in CY2013 is estimated to generate 1,209
total private non‐farm job years across all sectors (excluding government and farm workers) in the State of
Arizona, 68.4% of which occur in Apache County.
Table 2 also estimates the GSP and RDPI impacts of CGS in CY2013, expressed in 2013 dollars (2013 $). Real GSP in
the State of Arizona is estimated to be higher relative to the baseline by $258.9 million (2013 $) in CY2013.
Approximately 86.4% of this GSP benefit is estimated to occur in Apache County. RDPI statewide is estimated to
be higher relative to the baseline by $77.3 million (2013 $). Approximately 74.7% of this positive impact is
estimated to occur in Apache County.
18 Technically speaking, real disposable personal income is the sum of wage and salary disbursements, supplements to wages and salaries,
proprietors’ income, rental income of persons, personal dividend income, personal interest income, and personal current transfer receipts, less personal taxes and contributions for government social insurance. 19 A job year is equivalent to one person having a full‐time job for exactly one year.
20 A job year is equivalent to one person having a full‐time job for exactly one year.
Page | 7
Economic impact assessment reports usually disaggregate total private non‐farm employment into direct and
indirect/induced job years. This is illustrated in Table 3 for Apache County. Seidman estimates in CY2013 that CGS
helps to generate 2.8 indirect/induced jobs for every person they directly employ full‐time for a year.
Table 3: Comparison of Direct and Indirect/Induced Private Non‐Farm Employment Job Years in Apache County
TOTAL PRIVATE NON‐FARM EMPLOYMENT (Job Years)21
Direct Job Years 218
Indirect/Induced Job Years22 609
Indirect/Induced Job Years as a % of Direct Job Years 280%
Source: Authors’ Calculations
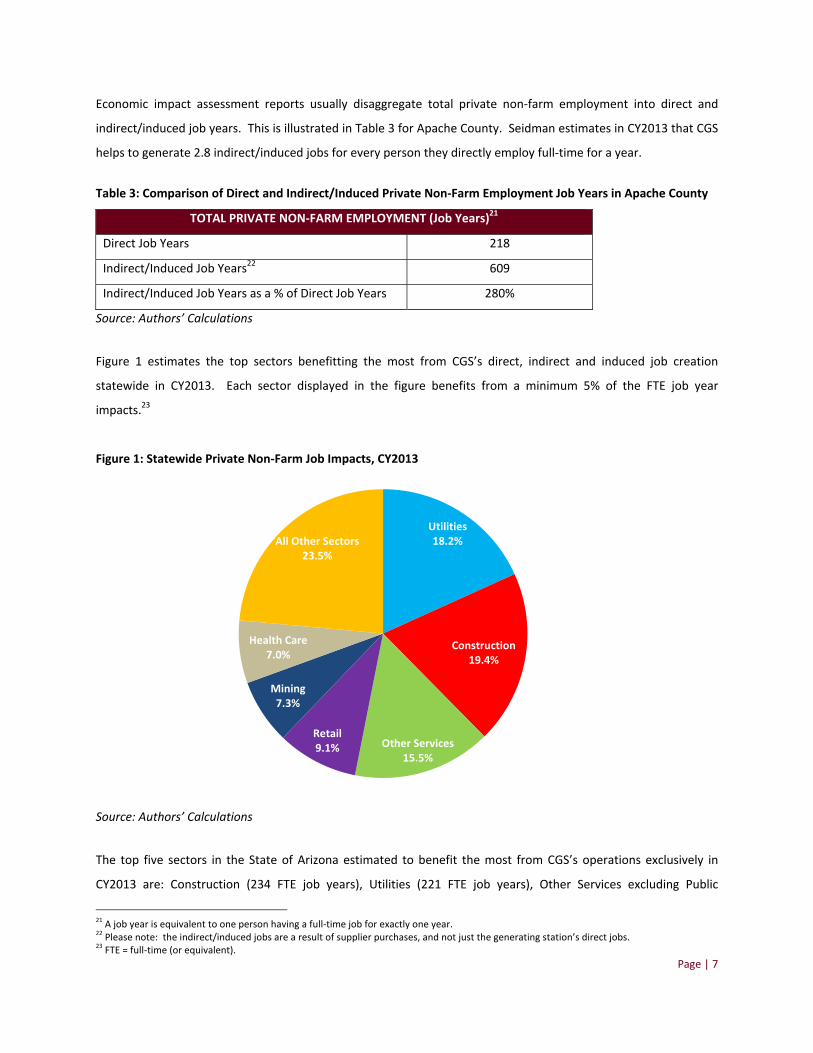
Figure 1 estimates the top sectors benefitting the most from CGS’s direct, indirect and induced job creation
statewide in CY2013. Each sector displayed in the figure benefits from a minimum 5% of the FTE job year
impacts.23
Figure 1: Statewide Private Non‐Farm Job Impacts, CY2013
Source: Authors’ Calculations
The top five sectors in the State of Arizona estimated to benefit the most from CGS’s operations exclusively in
CY2013 are: Construction (234 FTE job years), Utilities (221 FTE job years), Other Services excluding Public
21 A job year is equivalent to one person having a full‐time job for exactly one year.
22 Please note: the indirect/induced jobs are a result of supplier purchases, and not just the generating station’s direct jobs.
23 FTE = full‐time (or equivalent).
Utilities18.2%
Construction 19.4%
Other Services15.5%
Retail9.1%
Mining7.3%
Health Care7.0%
All Other Sectors23.5%

Page | 8
Administration (187 FTE job years), Retail (109 FTE job years), and Mining (88 FTE job years).24 Almost all of the
utility jobs are direct employees at CGS, with the balance (3 FTE job years) in all probability based at other utility
offices in the state. REMI’s statewide mining sector extends beyond coal to copper, potash, limestone, gold,
cement, and uranium mining; and the 88 FTE jobs in this sector are almost certainly in non‐coal areas, because
CGS’ coal is sourced out‐of‐state.
The presence of CGS in Apache County will also attract people to live in the State of Arizona. Figure 2 estimates
the population impacts for the host county (Apache), and all other counties in the State of Arizona. The figure
estimates that the operation of CGS in CY2013 has a net positive impact of approximately 546 people statewide,
79.8% of which reside in Apache County. This equates to approximately 0.6% of Apache County’s total population
in CY2013.25
Figure 2: Statewide Population Impacts, CY2013
Source: Authors’ Calculations
24 Construction is NAICS code 23. Utilities consists of electric power generation, transmission, and distribution (NAICS 2211), natural gas
distribution (NAICS 2212), and water sewage and other systems (NAICS 2213). Other Services excluding Public Administration includes repair and maintenance firms (NAICS 811), personal and laundry services (NAICS 812), and membership associations and organizations (NAICS 813). Retail corresponds to NAICS 44‐45. Mining consists of oil and gas extraction (NAICS 211), coal mining (NAICS 2121), metal ore mining (NAICS 2122), nonmetallic mineral mining and quarrying (NAICS 2123), and support activities for mining (NAICS 213). 25 Apache County’s total population estimate in CY2013 was 71,934 ‐ Source: U.S. Census Bureau.
436
110
0
50
100
150
200
250
300
350
400
450
500
Apache All Other AZ
Number of People
County
Page | 9
4. Simulation Results: Springerville Generating Station, CY2013
This section estimates the direct, indirect, and induced economic impacts of SGS in 2013. Results are presented
for both Apache County (the host county) and for the State of Arizona as a whole. All dollar amounts are
expressed in 2013 dollars (2013$).
SGS is a 1,560 MW coal power station in Apache County, supplying electricity to Tucson Electric Power (TEP), Tri‐
State Generation & Transmission, and SRP. It has 332 FTE employees, consisting of 104 salaried and 228 hourly
people, who receive over $46.3 million in wages, salaries, and benefits. The average salary and benefits paid at
SGS ($139,522) in CY2013 is over $100,000 per employee higher than the U.S. Census Bureau’s median household
income of $31,615 (2008‐2012) for Apache County.26 In CY2013, SGS purchased $339.3 million goods and services
from in‐state and out‐of‐state suppliers. The generating station also paid over $21.8 million in state, county and
local taxes.
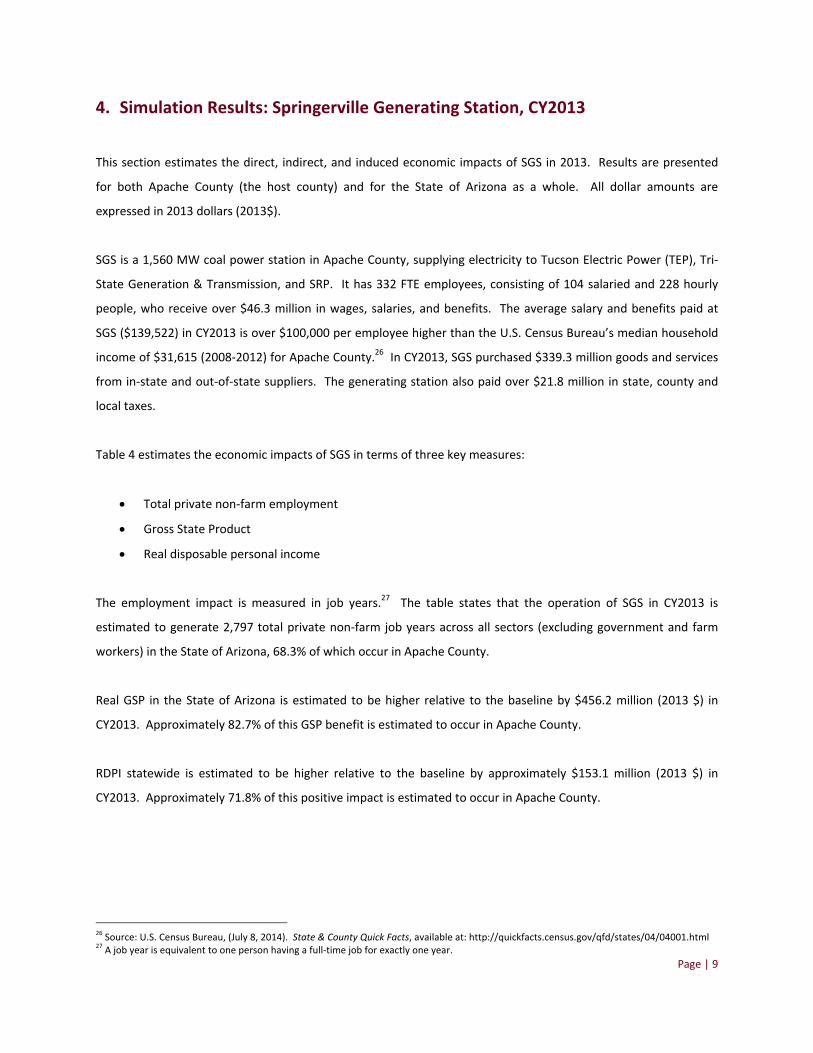
Table 4 estimates the economic impacts of SGS in terms of three key measures:
Total private non‐farm employment
Gross State Product
Real disposable personal income
The employment impact is measured in job years.27 The table states that the operation of SGS in CY2013 is
estimated to generate 2,797 total private non‐farm job years across all sectors (excluding government and farm
workers) in the State of Arizona, 68.3% of which occur in Apache County.
Real GSP in the State of Arizona is estimated to be higher relative to the baseline by $456.2 million (2013 $) in
CY2013. Approximately 82.7% of this GSP benefit is estimated to occur in Apache County.
RDPI statewide is estimated to be higher relative to the baseline by approximately $153.1 million (2013 $) in
CY2013. Approximately 71.8% of this positive impact is estimated to occur in Apache County.
26 Source: U.S. Census Bureau, (July 8, 2014). State & County Quick Facts, available at: http://quickfacts.census.gov/qfd/states/04/04001.html
27 A job year is equivalent to one person having a full‐time job for exactly one year.
Page | 10
Table 4: Overview of SGS’s Economic Impact, CY2013
TOTAL PRIVATE NON‐FARM EMPLOYMENT (Job Years)28
State of Arizona 2,797
Apache County 1,912
Host County as a % of State of Arizona 68.3%
GROSS STATE PRODUCT (Millions 2013 $)
State of Arizona 456.2
Apache County 377.2
Host County as a % of State of Arizona 82.7%
REAL DISPOSABLE PERSONAL INCOME (Millions 2013 $)
State of Arizona 153.1
Apache County 110.0
Host County as a % of State of Arizona 71.8%
Source: Authors’ Calculations
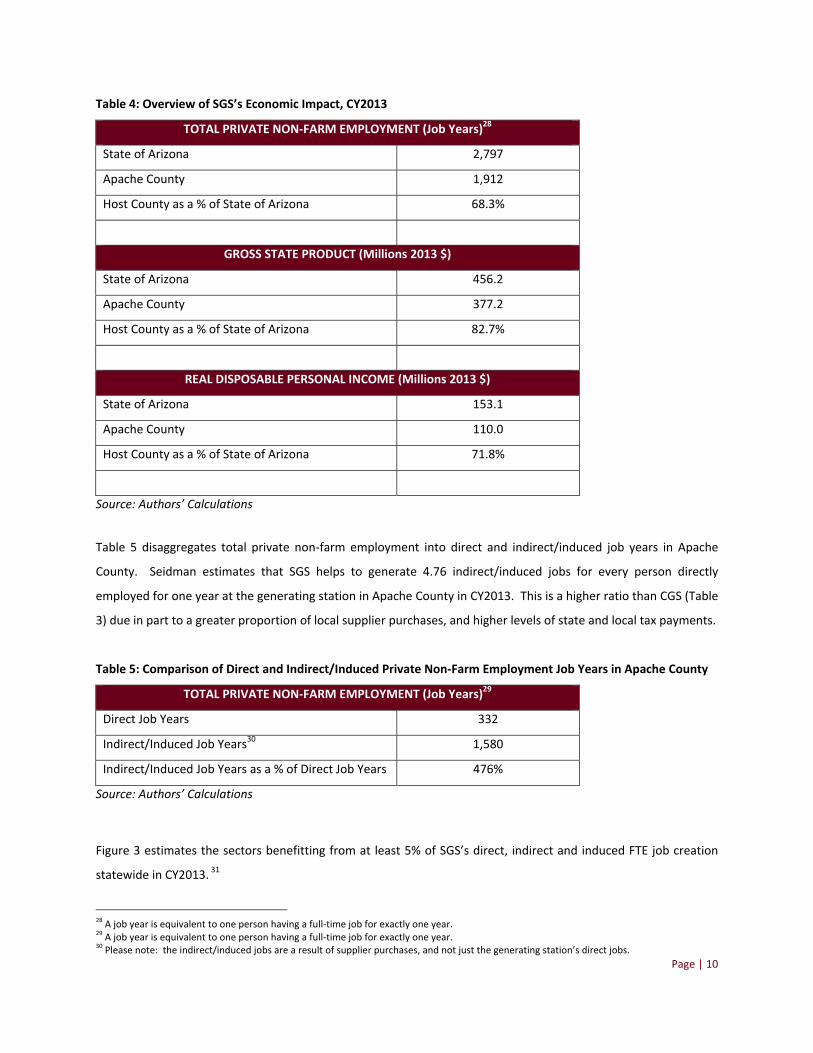
Table 5 disaggregates total private non‐farm employment into direct and indirect/induced job years in Apache
County. Seidman estimates that SGS helps to generate 4.76 indirect/induced jobs for every person directly
employed for one year at the generating station in Apache County in CY2013. This is a higher ratio than CGS (Table
3) due in part to a greater proportion of local supplier purchases, and higher levels of state and local tax payments.
Table 5: Comparison of Direct and Indirect/Induced Private Non‐Farm Employment Job Years in Apache County
TOTAL PRIVATE NON‐FARM EMPLOYMENT (Job Years)29
Direct Job Years 332
Indirect/Induced Job Years30 1,580
Indirect/Induced Job Years as a % of Direct Job Years 476%
Source: Authors’ Calculations
Figure 3 estimates the sectors benefitting from at least 5% of SGS’s direct, indirect and induced FTE job creation
statewide in CY2013. 31
28 A job year is equivalent to one person having a full‐time job for exactly one year.
29 A job year is equivalent to one person having a full‐time job for exactly one year.
30 Please note: the indirect/induced jobs are a result of supplier purchases, and not just the generating station’s direct jobs.

Page | 11
Figure 3: Statewide Private Non‐Farm Job Impacts, CY2013
Source: Authors’ Calculations
The top five sectors in the State of Arizona estimated to benefit the most from SGS’s operations exclusively in
CY2013 are: Other Services excluding Public Administration (785 FTE job years), Construction (570 FTE job years),
Utilities (336 FTE job years), Retail (220 FTE job years), and Health Care and Social Assistance (170 FTE job years).32
Almost all of the utility jobs are direct employees at SGS, with the balance (4 FTE job years) in all probability based
at other utility offices in the state.
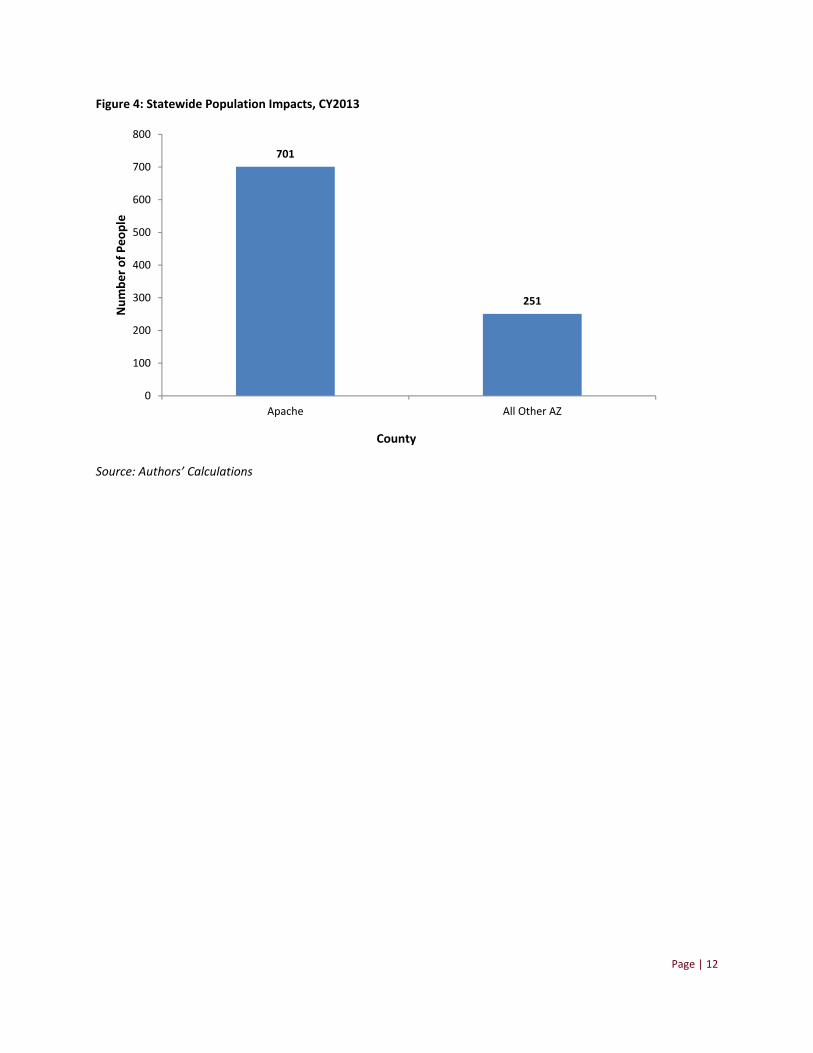
The presence of SGS in Apache County also directly or indirectly encourages people to live in the State of Arizona.
Figure 4 estimates the population impacts in CY2013. The figure estimates that the operation of SGS in CY2013 has
a net positive impact of approximately 952 people statewide, 73.7% of which reside in Apache County. This
equates to approximately 1% of Apache County’s total population in CY2013.33
31 FTE = full‐time (or equivalent).
32 Other Services excluding Public Administration includes repair and maintenance firms (NAICS 811), personal and laundry services (NAICS 812),
and membership associations and organizations (NAICS 813). Construction is NAICS 23. Utilities consists of electric power generation, transmission, and distribution (NAICS 2211), natural gas distribution (NAICS 2212), and water sewage and other systems (NAICS 2213). Retail is NAICS 44‐45. Health Care and Social Assistance includes ambulatory health care services (NAICS 621), hospitals (NAICS 622), nursing and residential care facilities (NAICS 623), and social assistance (NAICS 624). 33 Apache County’s total population estimate in CY2013 was 71,934 ‐ Source: U.S. Census Bureau.
Utilities12.0%
Construction 20.4%
Other Services28.1%
Retail7.9%
Mining5.1%
Health Care6.1%
All Other Sectors20.5%
Page | 12
Figure 4: Statewide Population Impacts, CY2013
Source: Authors’ Calculations
701
251
0
100
200
300
400
500
600
700
800
Apache All Other AZ
Number of People
County
Page | 13
5. Simulation Results: Combined Impact of Coronado and Springerville
Generating Stations, CY2013
REMI is a dynamic, rather than linear, model. As a result, the combined economic impact estimate of both
generating stations at a county and statewide level for CY2013 is close to, but not quite, a simple aggregation of
the single generating station estimates described in Sections 3 and 4.
Table 6 estimates the total economic impact of both CGS and SGS in terms of three key measures:
Total private non‐farm employment
Gross State Product
Real disposable personal income
The employment impact is measured in job years.34 The table states that the operation of both generating stations
in CY2013 is estimated to generate 4,009 total private non‐farm job years across all sectors (excluding government
and farm workers) in the State of Arizona, 68.4% of which occur in Apache County.
Real GSP in the State of Arizona is estimated to be higher relative to the baseline by $713.5 million (2013 $) in
CY2013. Approximately 84% of this GSP benefit is estimated to occur in Apache County.
RDPI statewide is estimated to be higher relative to the baseline by approximately $230.2 million (2013 $) in
CY2013. Approximately 72.8% of this positive impact is estimated to occur in Apache County.
34 A job year is equivalent to one person having a full‐time job for exactly one year.
Page | 14
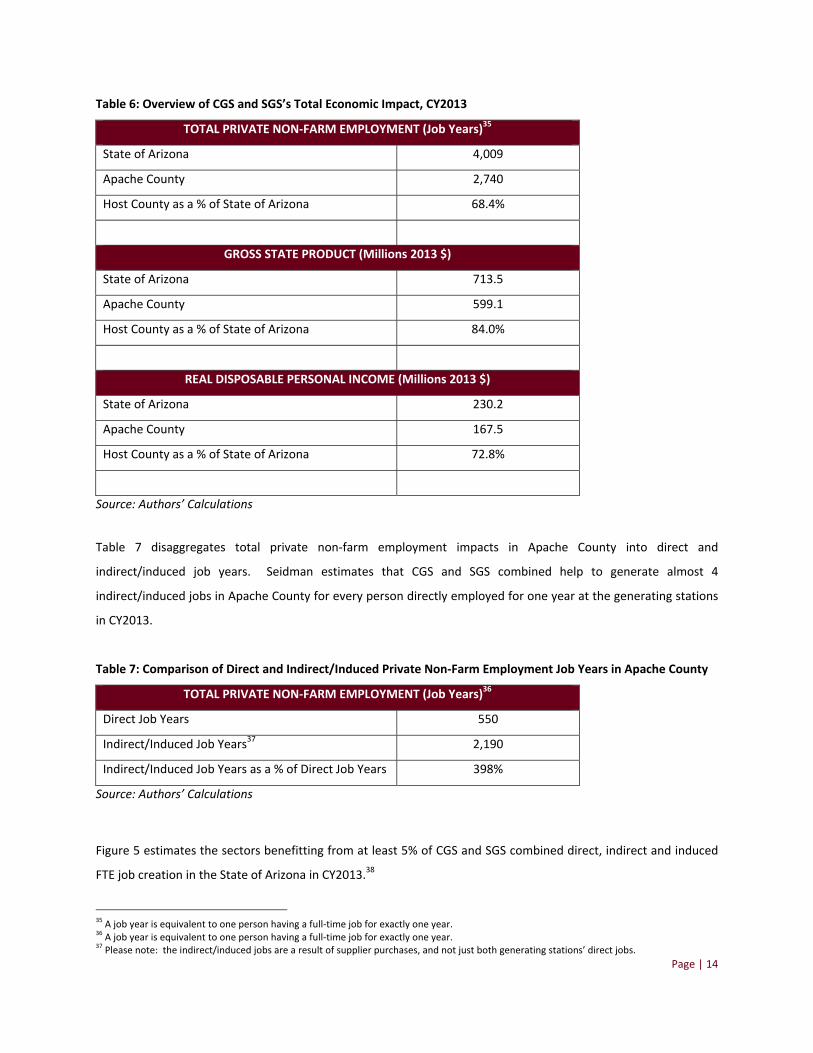
Table 6: Overview of CGS and SGS’s Total Economic Impact, CY2013
TOTAL PRIVATE NON‐FARM EMPLOYMENT (Job Years)35
State of Arizona 4,009
Apache County 2,740
Host County as a % of State of Arizona 68.4%
GROSS STATE PRODUCT (Millions 2013 $)
State of Arizona 713.5
Apache County 599.1
Host County as a % of State of Arizona 84.0%
REAL DISPOSABLE PERSONAL INCOME (Millions 2013 $)
State of Arizona 230.2
Apache County 167.5
Host County as a % of State of Arizona 72.8%
Source: Authors’ Calculations
Table 7 disaggregates total private non‐farm employment impacts in Apache County into direct and
indirect/induced job years. Seidman estimates that CGS and SGS combined help to generate almost 4
indirect/induced jobs in Apache County for every person directly employed for one year at the generating stations
in CY2013.
Table 7: Comparison of Direct and Indirect/Induced Private Non‐Farm Employment Job Years in Apache County
TOTAL PRIVATE NON‐FARM EMPLOYMENT (Job Years)36
Direct Job Years 550
Indirect/Induced Job Years37 2,190
Indirect/Induced Job Years as a % of Direct Job Years 398%
Source: Authors’ Calculations
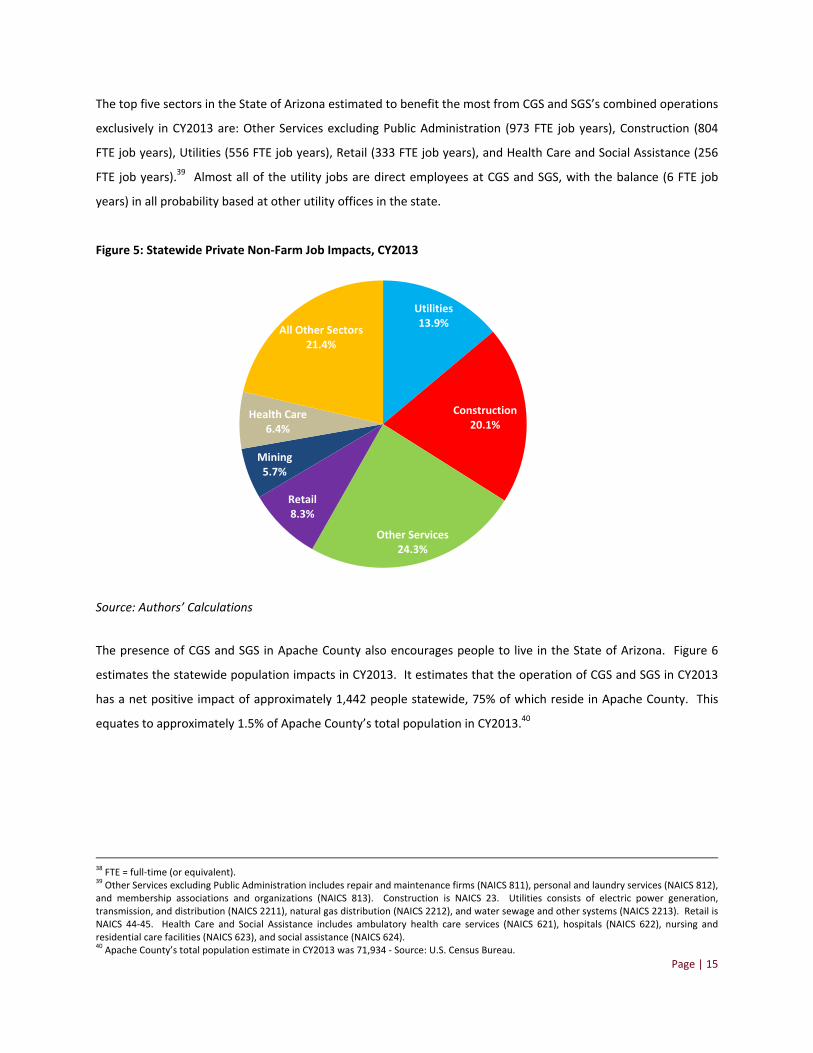
Figure 5 estimates the sectors benefitting from at least 5% of CGS and SGS combined direct, indirect and induced
FTE job creation in the State of Arizona in CY2013.38
35 A job year is equivalent to one person having a full‐time job for exactly one year.
36 A job year is equivalent to one person having a full‐time job for exactly one year.
37 Please note: the indirect/induced jobs are a result of supplier purchases, and not just both generating stations’ direct jobs.
Page | 15
The top five sectors in the State of Arizona estimated to benefit the most from CGS and SGS’s combined operations
exclusively in CY2013 are: Other Services excluding Public Administration (973 FTE job years), Construction (804
FTE job years), Utilities (556 FTE job years), Retail (333 FTE job years), and Health Care and Social Assistance (256
FTE job years).39 Almost all of the utility jobs are direct employees at CGS and SGS, with the balance (6 FTE job
years) in all probability based at other utility offices in the state.
Figure 5: Statewide Private Non‐Farm Job Impacts, CY2013
Source: Authors’ Calculations
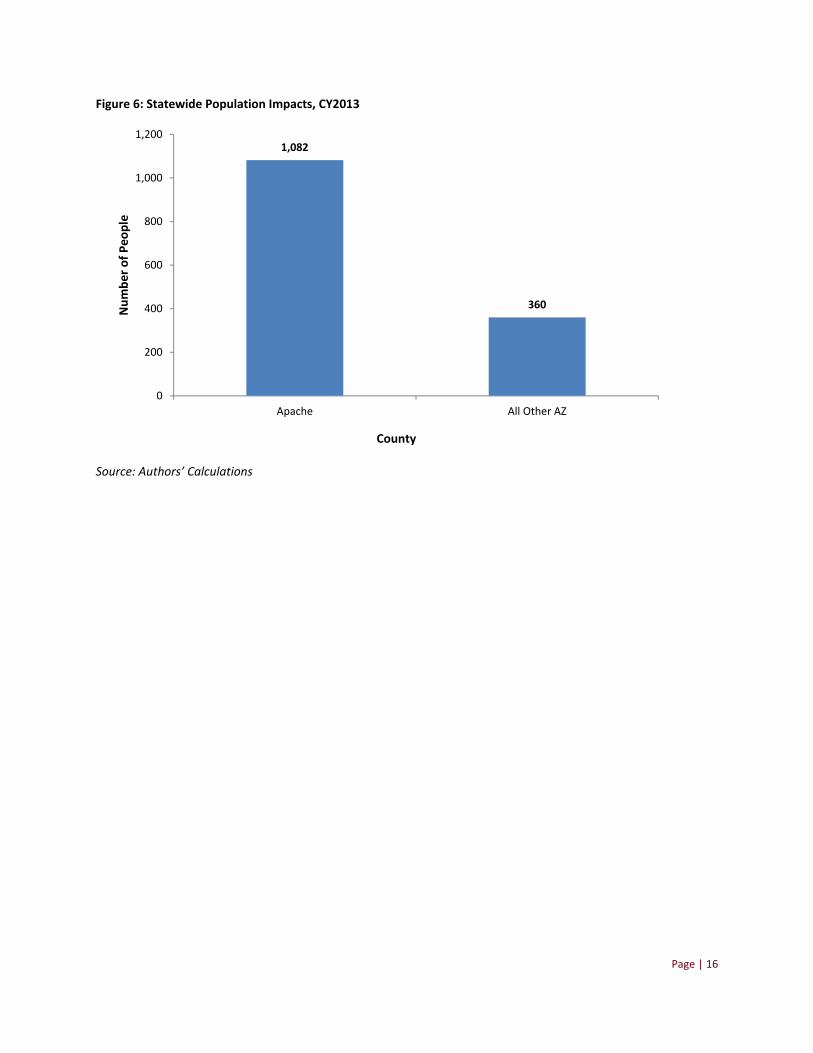
The presence of CGS and SGS in Apache County also encourages people to live in the State of Arizona. Figure 6
estimates the statewide population impacts in CY2013. It estimates that the operation of CGS and SGS in CY2013
has a net positive impact of approximately 1,442 people statewide, 75% of which reside in Apache County. This
equates to approximately 1.5% of Apache County’s total population in CY2013.40
38 FTE = full‐time (or equivalent).
39 Other Services excluding Public Administration includes repair and maintenance firms (NAICS 811), personal and laundry services (NAICS 812),
and membership associations and organizations (NAICS 813). Construction is NAICS 23. Utilities consists of electric power generation, transmission, and distribution (NAICS 2211), natural gas distribution (NAICS 2212), and water sewage and other systems (NAICS 2213). Retail is NAICS 44‐45. Health Care and Social Assistance includes ambulatory health care services (NAICS 621), hospitals (NAICS 622), nursing and residential care facilities (NAICS 623), and social assistance (NAICS 624). 40 Apache County’s total population estimate in CY2013 was 71,934 ‐ Source: U.S. Census Bureau.
Utilities13.9%
Construction 20.1%
Other Services24.3%
Retail8.3%
Mining5.7%
Health Care6.4%
All Other Sectors21.4%
Page | 16
Figure 6: Statewide Population Impacts, CY2013
Source: Authors’ Calculations
1,082
360
0
200
400
600
800
1,000
1,200
Apache All Other AZ
Number of People
County
Page | 17
6. Conclusion
The goal of this report is to provide an assessment of the economic impact of CGS and SGS at a host county and
statewide level in CY2013.
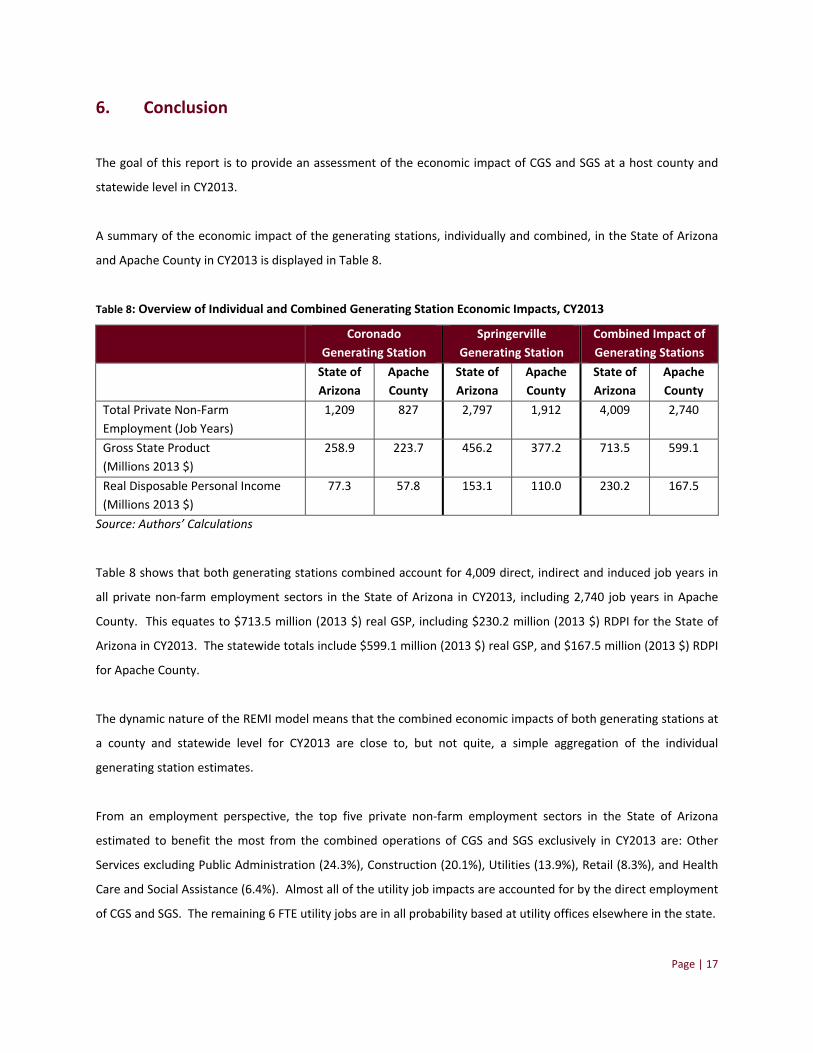
A summary of the economic impact of the generating stations, individually and combined, in the State of Arizona
and Apache County in CY2013 is displayed in Table 8.
Table 8: Overview of Individual and Combined Generating Station Economic Impacts, CY2013
Coronado
Generating Station
Springerville
Generating Station
Combined Impact of
Generating Stations
State of
Arizona
Apache
County
State of
Arizona
Apache
County
State of
Arizona
Apache
County
Total Private Non‐Farm
Employment (Job Years)
1,209 827 2,797 1,912 4,009 2,740
Gross State Product
(Millions 2013 $)
258.9 223.7 456.2 377.2 713.5 599.1
Real Disposable Personal Income
(Millions 2013 $)
77.3 57.8 153.1 110.0 230.2 167.5
Source: Authors’ Calculations
Table 8 shows that both generating stations combined account for 4,009 direct, indirect and induced job years in
all private non‐farm employment sectors in the State of Arizona in CY2013, including 2,740 job years in Apache
County. This equates to $713.5 million (2013 $) real GSP, including $230.2 million (2013 $) RDPI for the State of
Arizona in CY2013. The statewide totals include $599.1 million (2013 $) real GSP, and $167.5 million (2013 $) RDPI
for Apache County.
The dynamic nature of the REMI model means that the combined economic impacts of both generating stations at
a county and statewide level for CY2013 are close to, but not quite, a simple aggregation of the individual
generating station estimates.
From an employment perspective, the top five private non‐farm employment sectors in the State of Arizona
estimated to benefit the most from the combined operations of CGS and SGS exclusively in CY2013 are: Other
Services excluding Public Administration (24.3%), Construction (20.1%), Utilities (13.9%), Retail (8.3%), and Health
Care and Social Assistance (6.4%). Almost all of the utility job impacts are accounted for by the direct employment
of CGS and SGS. The remaining 6 FTE utility jobs are in all probability based at utility offices elsewhere in the state.
Page | 18
The U.S. Bureau of Labor Statistics estimates that Apache County had total employment (all industries) of 17,924 in
CY2013.41 CGS and SGS’s direct employment therefore accounts for 3% of Apache County’s total employment (all
industries). The direct, indirect, and induced private non‐farm employment impacts of the generating stations
combined is estimated to account for 15.3% of total employment in Apache County in CY2013.
The presence of CGS and SGS in Apache County also directly or indirectly encourages people to live in the State of
Arizona. The combined impact of both generating stations operating in Apache County in CY2013 is estimated to
have a positive population impact of 1,442 people statewide, 75% of which occurs in the host county. This equates
to approximately 1.5% of Apache County’s total population in CY2013.42
In summary, the State of Arizona and Apache County in particular, will be severely impacted if both CGS and SGS
cease operation. Seidman’s economic impact analysis estimates that Apache County could lose 2,700 FTE job
years employment, just under $600 million in annual gross state product and $170 million real disposable personal
income. In addition, SRP and TEP estimate that over half (56%) of Apache County’s property tax value could be
eliminated, including two‐thirds to three‐quarters of the property value that supports the local school districts, St.
John’s Unified and Round Valley Unified. The White Mountain Health Care District could also lose almost 40% of
its property value. With limited alternative employment opportunities, the associated exodus of plant employees
from the region could potentially result in a drop in housing values, shuttering of local businesses, and closing of
schools as the remaining population is left with the full financial burden of schools, medical centers, library
districts, fire districts, etc., currently born by the utilities and their employees.
As such, the continued operation of CGS and SGS at their current operational levels, even without the installation
of additional emissions and environmental control technologies, exert significant positive economic impact for the
host county (Apache) and the State of Arizona as a whole.
.
41 Source: U.S. Bureau of Labor Statistics QCEW State and County Map – Apache County Industry Data.
42 Apache County’s total population estimate in CY2013 was 71,934 ‐ Source: U.S. Census Bureau.

660 S MILL AVENUE, SUITE 300
TEMPE
AZ 85281
Tel: (480) 965 5362
Fax: (480) 965 5458
www.seidmaninstitute.com