REVIEW CONTENT: FINANCIAL OPERATIONS AND … CONTENT: FINANCIAL OPERATIONS AND ASSET ANALYSIS ......
36
CPM ® Exam Prep Tutorial Financial Ops and Asset Analysis FIN ASM 1 REVIEW CONTENT: FINANCIAL OPERATIONS AND ASSET ANALYSIS The outline below serves as a guide to understanding the main topic areas that you could be tested on in the CPM ® certification exam: Ownership Goals and Objectives Financing and Loan Analysis – Types of Loans – Calculating Loans – Loan to Value (LTV%) – Debt Coverage Ratio (DCR) – Leverage Budgeting and Analysis – Basic Accounting Types – Elements of a Budget – Types of Budgets – Budget Forecasting Time Value of Money (TVM) Financial Reports – Common Reports – Balance Sheet Benchmarks Discounted Cash Flow (DCF) Analysis – DCF and Effective Rent – DCF and Value Pro Forma Statement of Cash Flow – Operating Expense Benchmarks Measures of Investment Return – Cash-on-Cash Rate of Return ($/$%) – Value Enhancement – Net Present Value (NPV) – Internal Rate of Return (IRR) Valuation – Income Approach – Equity Approach – Cost Approach – Comparable Sales Approach Midstream Analysis – Cash-Out Potential – Current Equity
Transcript of REVIEW CONTENT: FINANCIAL OPERATIONS AND … CONTENT: FINANCIAL OPERATIONS AND ASSET ANALYSIS ......
CPM® Exam Prep Tutorial Financial Ops and Asset Analysis
FIN ASM 1
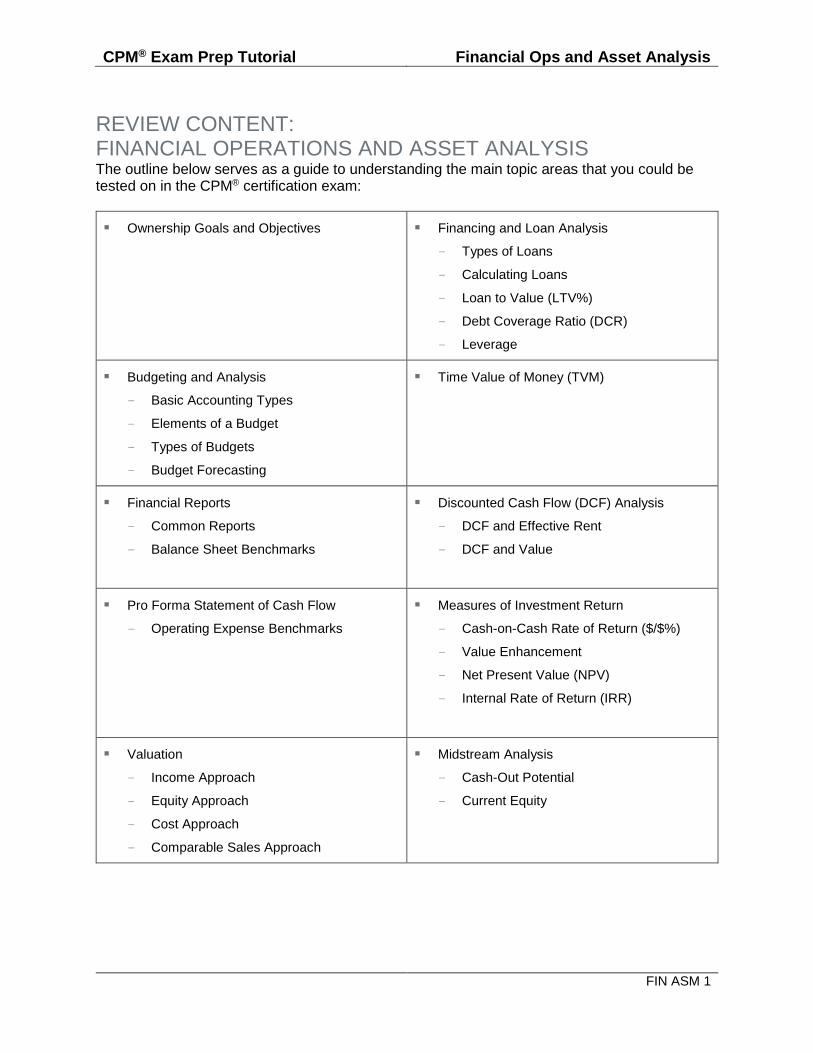
REVIEW CONTENT: FINANCIAL OPERATIONS AND ASSET ANALYSIS The outline below serves as a guide to understanding the main topic areas that you could be tested on in the CPM® certification exam:
Ownership Goals and Objectives Financing and Loan Analysis
– Types of Loans
– Calculating Loans
– Loan to Value (LTV%)
– Debt Coverage Ratio (DCR)
– Leverage
Budgeting and Analysis
– Basic Accounting Types
– Elements of a Budget
– Types of Budgets
– Budget Forecasting
Time Value of Money (TVM)
Financial Reports
– Common Reports
– Balance Sheet Benchmarks
Discounted Cash Flow (DCF) Analysis
– DCF and Effective Rent
– DCF and Value
Pro Forma Statement of Cash Flow
– Operating Expense Benchmarks
Measures of Investment Return
– Cash-on-Cash Rate of Return ($/$%)
– Value Enhancement
– Net Present Value (NPV)
– Internal Rate of Return (IRR)
Valuation
– Income Approach
– Equity Approach
– Cost Approach
– Comparable Sales Approach
Midstream Analysis
– Cash-Out Potential
– Current Equity
CPM® Exam Prep Tutorial Financial Ops and Asset Analysis
FIN ASM 2
OWNERSHIP GOALS AND OBJECTIVES Investors purchase income-producing real estate for two primary reasons. Speculation offers investors an opportunity to take a high risk and potentially receive a high reward from a relatively short-term holding period. Their return is typically achieved at the time of sale and is realized from the profit made on the sale of the property. Investment in real estate, on the other hand, typically extends for a longer holding period and offers investors five fundamental opportunities:
Safety (capital preservation) An owner wants to protect his principal investment by acquiring and maintaining quality real estate assets that hold value over time.
Periodic return (cash flows) An investor purchases real estate to obtain a recurring source of income over time. The cash flow will provide a rate of return that can be compared to other investments. The strength of a rent roll or market will greatly impact the quality of the cash flow that the owner will receive.
Leverage (using borrowed funds)
An investor wants a return on the acquisition that exceeds the cost of the borrowed funds.
Capital appreciation (hedge against inflation)
An owner wants the benefit of increasing rents to increase asset values over time.
Tax advantage (income tax shelter)
An owner wants the ability to defer recognition of income through a deduction of cost recovery (originally called depreciation).
In addition to the five fundamental financial reasons for investment, investors also enjoy pride of ownership from owning income-producing property. While all investors have these financial goals, the goal of an effective real estate manager is to understand the mix of the various elements as it relates to the individual investor’s risk tolerance.
CPM® Exam Prep Tutorial Financial Ops and Asset Analysis
FIN ASM 3
BUDGETING AND ANALYSIS
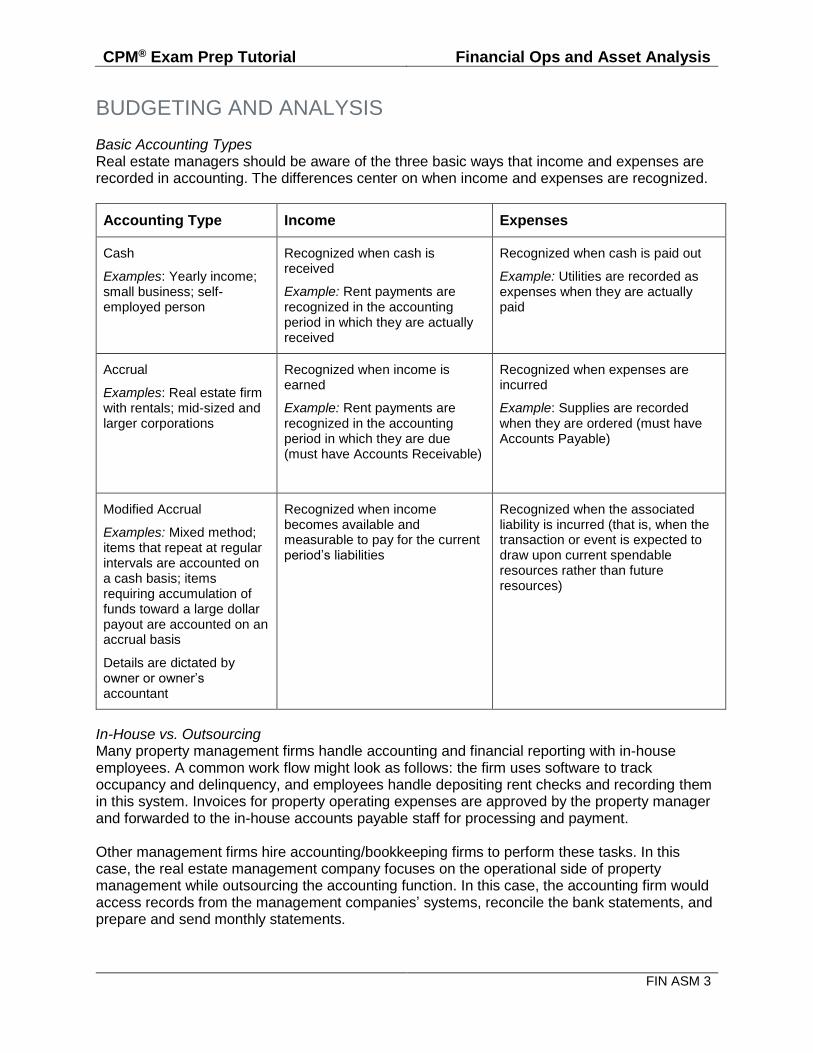
Basic Accounting Types Real estate managers should be aware of the three basic ways that income and expenses are recorded in accounting. The differences center on when income and expenses are recognized.
Accounting Type Income Expenses
Cash
Examples: Yearly income; small business; self-employed person
Recognized when cash is received
Example: Rent payments are recognized in the accounting period in which they are actually received
Recognized when cash is paid out
Example: Utilities are recorded as expenses when they are actually paid
Accrual
Examples: Real estate firm with rentals; mid-sized and larger corporations
Recognized when income is earned
Example: Rent payments are recognized in the accounting period in which they are due (must have Accounts Receivable)
Recognized when expenses are incurred
Example: Supplies are recorded when they are ordered (must have Accounts Payable)
Modified Accrual
Examples: Mixed method; items that repeat at regular intervals are accounted on a cash basis; items requiring accumulation of funds toward a large dollar payout are accounted on an accrual basis
Details are dictated by owner or owner’s accountant
Recognized when income becomes available and measurable to pay for the current period’s liabilities
Recognized when the associated liability is incurred (that is, when the transaction or event is expected to draw upon current spendable resources rather than future resources)
In-House vs. Outsourcing Many property management firms handle accounting and financial reporting with in-house employees. A common work flow might look as follows: the firm uses software to track occupancy and delinquency, and employees handle depositing rent checks and recording them in this system. Invoices for property operating expenses are approved by the property manager and forwarded to the in-house accounts payable staff for processing and payment. Other management firms hire accounting/bookkeeping firms to perform these tasks. In this case, the real estate management company focuses on the operational side of property management while outsourcing the accounting function. In this case, the accounting firm would access records from the management companies’ systems, reconcile the bank statements, and prepare and send monthly statements.
CPM® Exam Prep Tutorial Financial Ops and Asset Analysis
FIN ASM 4
Elements of a Budget A budget is an itemized projection of income and expenses over a specific period for a particular property, project, or institution, providing a picture of a property’s financial activity. It is a financial tool that real estate managers use to plan and control a property’s operations. Information from several areas of real estate management is used in making decisions about profitability. Most budgets include several common elements:
INCOME (REVENUES): rent, fees, and other income sources
EXPENSES (DISBURSEMENTS, EXPENDITURES): operating costs such as maintenance, utilities, payroll, advertising, and taxes
NET OPERATING INCOME (NOI): total collections less operating expenses
FINANCING EXPENSES: property loan(s), loans for equipment, rehab, or furniture
CAPITAL EXPENDITURES: funds for major improvements, large equipment, additions to buildings, buildings themselves, and land
CASH FLOW REQUIREMENTS: the owner's other specific financial objectives for the rate of return on the investment
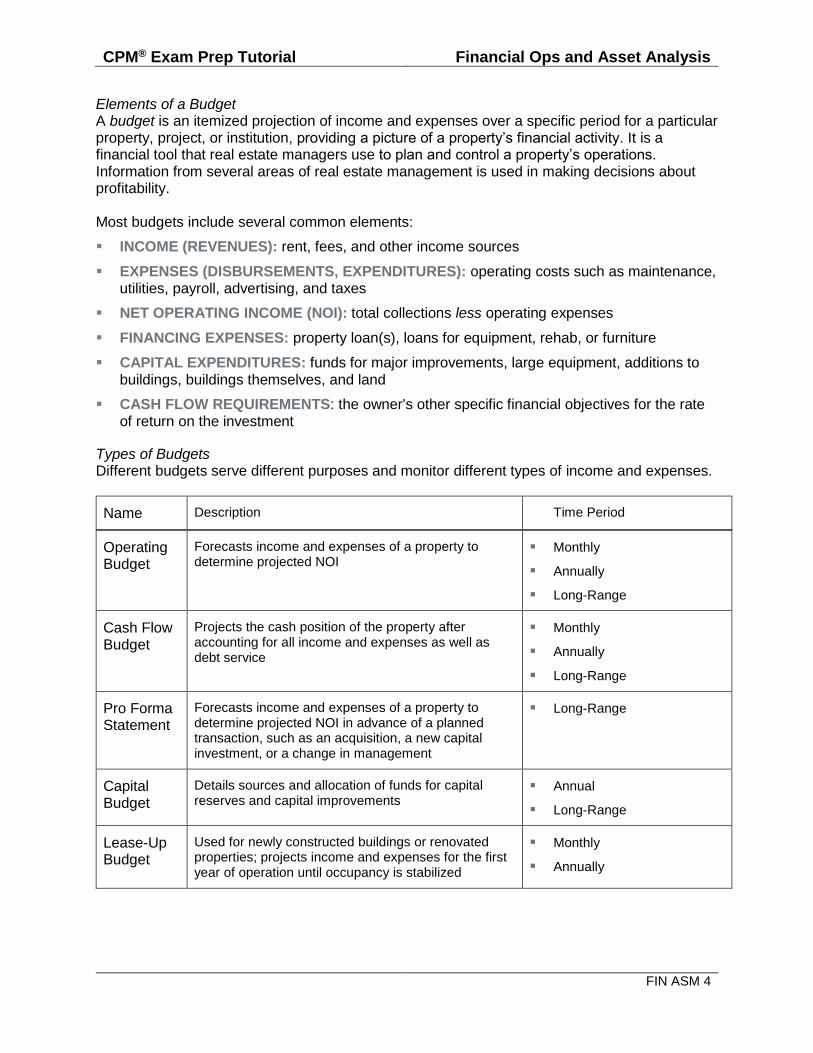
Types of Budgets Different budgets serve different purposes and monitor different types of income and expenses.
Name Description Time Period
Operating Budget
Forecasts income and expenses of a property to determine projected NOI
Monthly
Annually
Long-Range
Cash Flow Budget
Projects the cash position of the property after accounting for all income and expenses as well as debt service
Monthly
Annually
Long-Range
Pro Forma Statement
Forecasts income and expenses of a property to determine projected NOI in advance of a planned transaction, such as an acquisition, a new capital investment, or a change in management
Long-Range
Capital Budget
Details sources and allocation of funds for capital reserves and capital improvements
Annual
Long-Range
Lease-Up Budget
Used for newly constructed buildings or renovated properties; projects income and expenses for the first year of operation until occupancy is stabilized
Monthly
Annually

CPM® Exam Prep Tutorial Financial Ops and Asset Analysis
FIN ASM 5
Budget Forecasting
Forecasting income and expenses is an essential step in creating a budget. Accurate
projections are important for providing a realistic picture to ownership, identifying opportunities,
and effectively meeting goals.
Projecting expenses involves thinking about how costs arise and classifying them accordingly.
There are several ways to classify expenses:
FIXED COSTS do not change as occupancy rates change and are generally stable during the budget period. Insurance and real estate taxes can be considered fixed costs.
VARIABLE COSTS change with usage. Electricity and water are typical variable costs.
Fixed and variable costs may be further separated into controllable and uncontrollable
expenses.
Forecasting Techniques The two most common budget forecasting techniques are using historical data to make future projections, and starting from square one with zero-based budgeting.
Historical Data
Forecasting future expenses often begins with information about past expenses. Historical data
is helpful for budget items that change by predictable amounts from year to year. While budget
items controlled by the real estate manager are usually fairly predictable, it should not be
assumed that a budget item will always change as expected.
Working backward through three years of expense statements provides a good basis for a forecast. Averaging past years’ figures usually gives a reasonable estimate of future years’ performance. However, no one should follow figures blindly. Averages are sensitive to outliers and can easily be distorted. For example, if last winter was particularly severe, last year’s heating bills may be unusually high and should be compared to the previous two years.
Zero-Based Budgeting In contract to using historical data, zero-based budgeting de-emphasizes the historical role of income and expenses to make projections. The method assumes that past numbers may be inaccurate or may not reflect the current economic environment. Zero-based budgeting is particularly useful with new projects when there is no historical data, or for highly variable expenses. Zero-based budgeting prevents figures from being inserted automatically (and unthinkingly) into budgets year after year. Normally, when using zero-based budgeting, a real estate manager incorporates current information from sources like contractors, vendors, utility companies, and IREM® Income/Expense Analysis® Reports instead of plugging in historical data.
CPM® Exam Prep Tutorial Financial Ops and Asset Analysis
FIN ASM 6
Variance Analysis Budget variance analysis is an important part of monitoring existing budgets. It is most often used when working with the operating and cash flow budgets. A budget variance is the difference between the amount forecast for an account in a budget and the actual amount spent or earned in the account. Variance analysis and reporting are used to:
Determine the causes of differences between actual and forecast amounts.
Revise budgets, goals, and plans.
Variances (Favorable and Unfavorable) Budget variances can be favorable or unfavorable.
A FAVORABLE variance raises NOI (more income to owner).
An UNFAVORABLE variance lowers NOI (less income to owner).
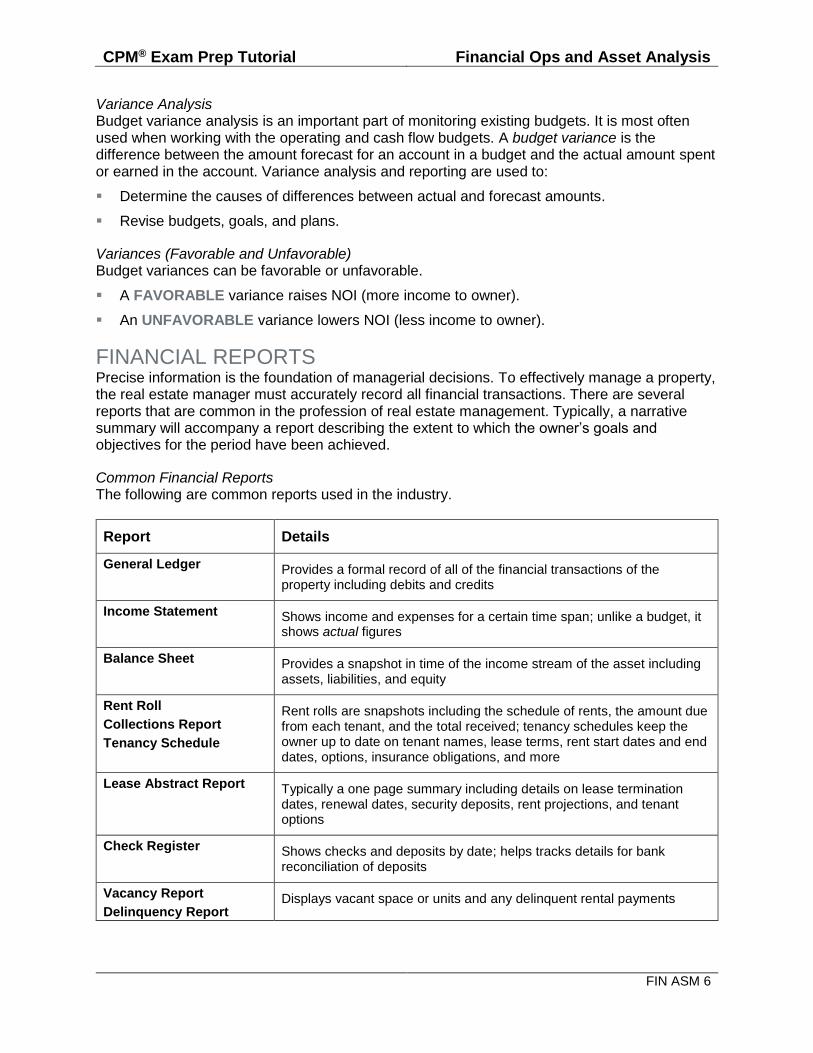
FINANCIAL REPORTS Precise information is the foundation of managerial decisions. To effectively manage a property, the real estate manager must accurately record all financial transactions. There are several reports that are common in the profession of real estate management. Typically, a narrative summary will accompany a report describing the extent to which the owner’s goals and objectives for the period have been achieved.
Common Financial Reports The following are common reports used in the industry.
Report Details
General Ledger Provides a formal record of all of the financial transactions of the property including debits and credits
Income Statement Shows income and expenses for a certain time span; unlike a budget, it shows actual figures
Balance Sheet Provides a snapshot in time of the income stream of the asset including assets, liabilities, and equity
Rent Roll
Collections Report
Tenancy Schedule
Rent rolls are snapshots including the schedule of rents, the amount due from each tenant, and the total received; tenancy schedules keep the owner up to date on tenant names, lease terms, rent start dates and end dates, options, insurance obligations, and more
Lease Abstract Report Typically a one page summary including details on lease termination dates, renewal dates, security deposits, rent projections, and tenant options
Check Register Shows checks and deposits by date; helps tracks details for bank reconciliation of deposits
Vacancy Report
Delinquency Report Displays vacant space or units and any delinquent rental payments
CPM® Exam Prep Tutorial Financial Ops and Asset Analysis
FIN ASM 7
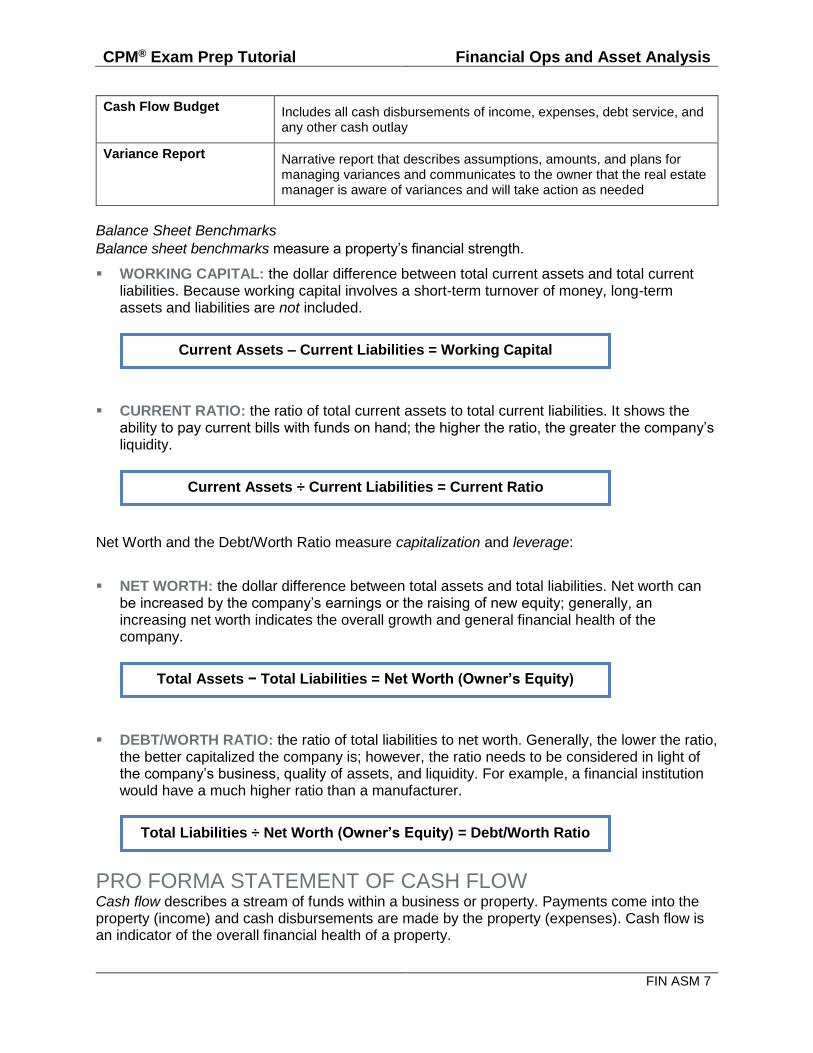
Cash Flow Budget Includes all cash disbursements of income, expenses, debt service, and any other cash outlay
Variance Report Narrative report that describes assumptions, amounts, and plans for managing variances and communicates to the owner that the real estate manager is aware of variances and will take action as needed
Balance Sheet Benchmarks
Balance sheet benchmarks measure a property’s financial strength.
WORKING CAPITAL: the dollar difference between total current assets and total current liabilities. Because working capital involves a short-term turnover of money, long-term assets and liabilities are not included.
CURRENT RATIO: the ratio of total current assets to total current liabilities. It shows the ability to pay current bills with funds on hand; the higher the ratio, the greater the company’s liquidity.
Net Worth and the Debt/Worth Ratio measure capitalization and leverage:
NET WORTH: the dollar difference between total assets and total liabilities. Net worth can be increased by the company’s earnings or the raising of new equity; generally, an increasing net worth indicates the overall growth and general financial health of the company.
DEBT/WORTH RATIO: the ratio of total liabilities to net worth. Generally, the lower the ratio, the better capitalized the company is; however, the ratio needs to be considered in light of the company’s business, quality of assets, and liquidity. For example, a financial institution would have a much higher ratio than a manufacturer.
PRO FORMA STATEMENT OF CASH FLOW Cash flow describes a stream of funds within a business or property. Payments come into the property (income) and cash disbursements are made by the property (expenses). Cash flow is an indicator of the overall financial health of a property.
Current Assets – Current Liabilities = Working Capital
Current Assets ÷ Current Liabilities = Current Ratio
Total Assets − Total Liabilities = Net Worth (Owner’s Equity)
Total Liabilities ÷ Net Worth (Owner’s Equity) = Debt/Worth Ratio
CPM® Exam Prep Tutorial Financial Ops and Asset Analysis
FIN ASM 8
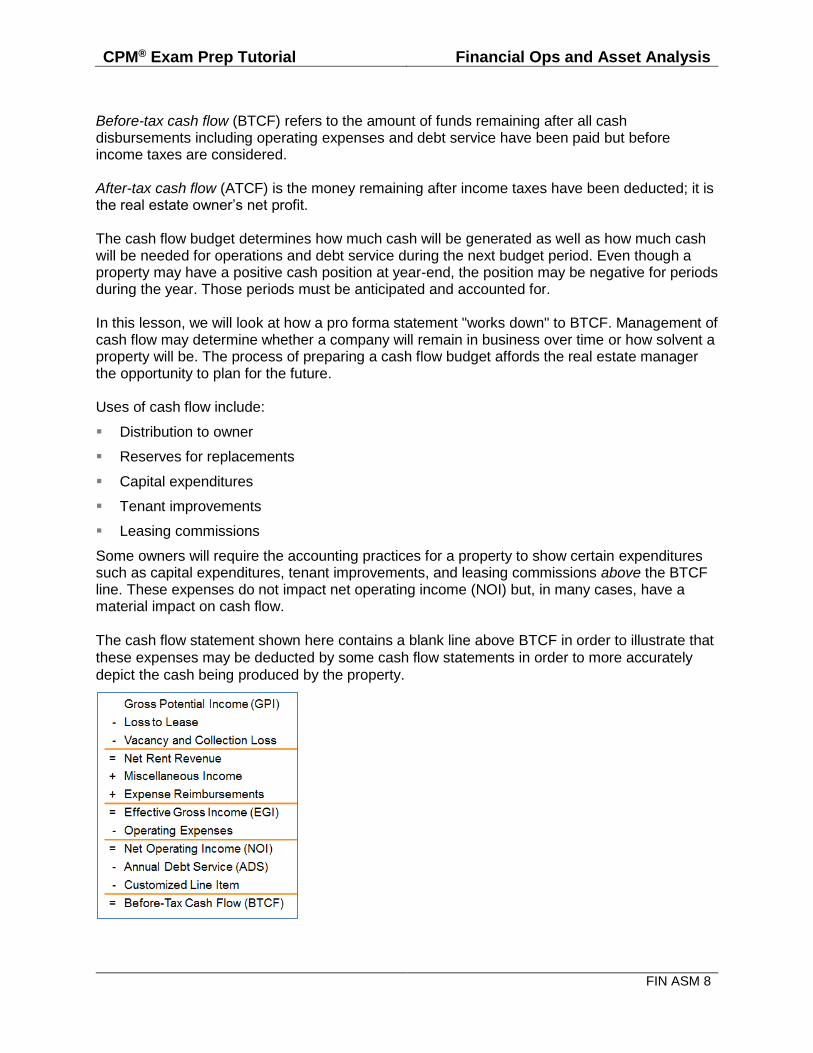
Before-tax cash flow (BTCF) refers to the amount of funds remaining after all cash disbursements including operating expenses and debt service have been paid but before income taxes are considered. After-tax cash flow (ATCF) is the money remaining after income taxes have been deducted; it is the real estate owner’s net profit. The cash flow budget determines how much cash will be generated as well as how much cash will be needed for operations and debt service during the next budget period. Even though a property may have a positive cash position at year-end, the position may be negative for periods during the year. Those periods must be anticipated and accounted for. In this lesson, we will look at how a pro forma statement "works down" to BTCF. Management of cash flow may determine whether a company will remain in business over time or how solvent a property will be. The process of preparing a cash flow budget affords the real estate manager the opportunity to plan for the future. Uses of cash flow include:
Distribution to owner
Reserves for replacements
Capital expenditures
Tenant improvements
Leasing commissions
Some owners will require the accounting practices for a property to show certain expenditures such as capital expenditures, tenant improvements, and leasing commissions above the BTCF line. These expenses do not impact net operating income (NOI) but, in many cases, have a material impact on cash flow.
The cash flow statement shown here contains a blank line above BTCF in order to illustrate that
these expenses may be deducted by some cash flow statements in order to more accurately
depict the cash being produced by the property.
CPM® Exam Prep Tutorial Financial Ops and Asset Analysis
FIN ASM 9
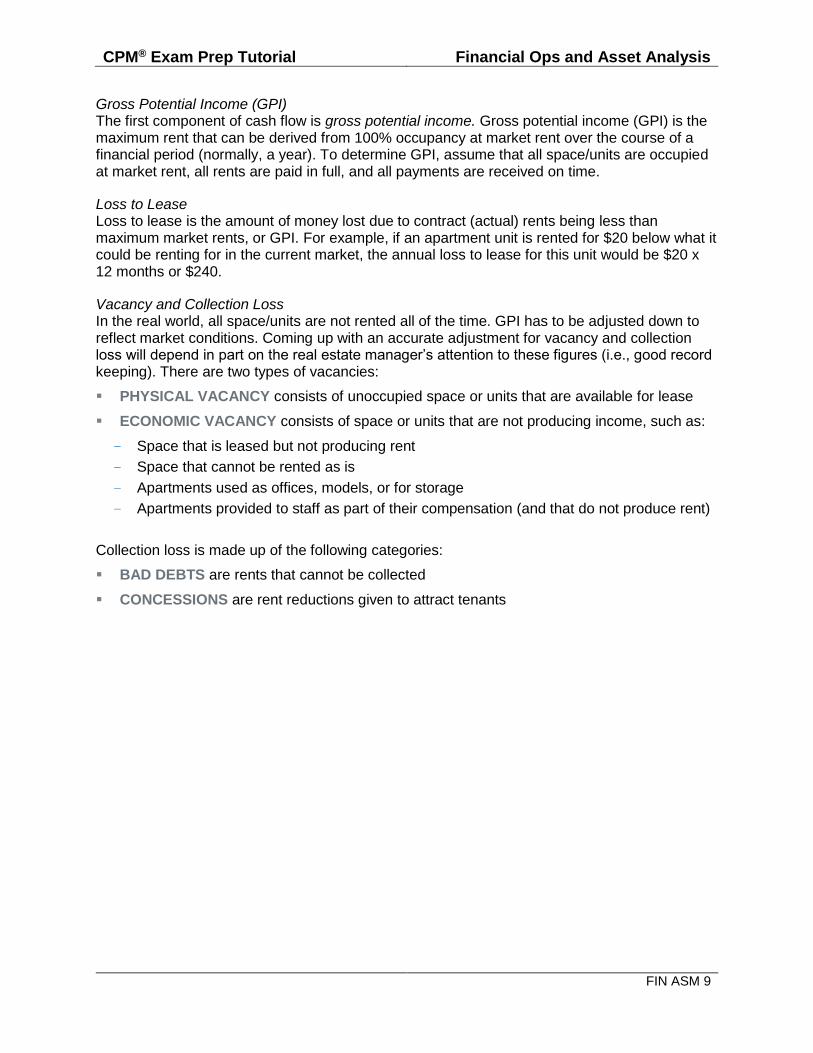
Gross Potential Income (GPI) The first component of cash flow is gross potential income. Gross potential income (GPI) is the maximum rent that can be derived from 100% occupancy at market rent over the course of a financial period (normally, a year). To determine GPI, assume that all space/units are occupied at market rent, all rents are paid in full, and all payments are received on time.
Loss to Lease Loss to lease is the amount of money lost due to contract (actual) rents being less than maximum market rents, or GPI. For example, if an apartment unit is rented for $20 below what it could be renting for in the current market, the annual loss to lease for this unit would be $20 x 12 months or $240.
Vacancy and Collection Loss In the real world, all space/units are not rented all of the time. GPI has to be adjusted down to reflect market conditions. Coming up with an accurate adjustment for vacancy and collection loss will depend in part on the real estate manager’s attention to these figures (i.e., good record keeping). There are two types of vacancies:
PHYSICAL VACANCY consists of unoccupied space or units that are available for lease
ECONOMIC VACANCY consists of space or units that are not producing income, such as:
– Space that is leased but not producing rent
– Space that cannot be rented as is
– Apartments used as offices, models, or for storage
– Apartments provided to staff as part of their compensation (and that do not produce rent)
Collection loss is made up of the following categories:
BAD DEBTS are rents that cannot be collected
CONCESSIONS are rent reductions given to attract tenants
CPM® Exam Prep Tutorial Financial Ops and Asset Analysis
FIN ASM 10
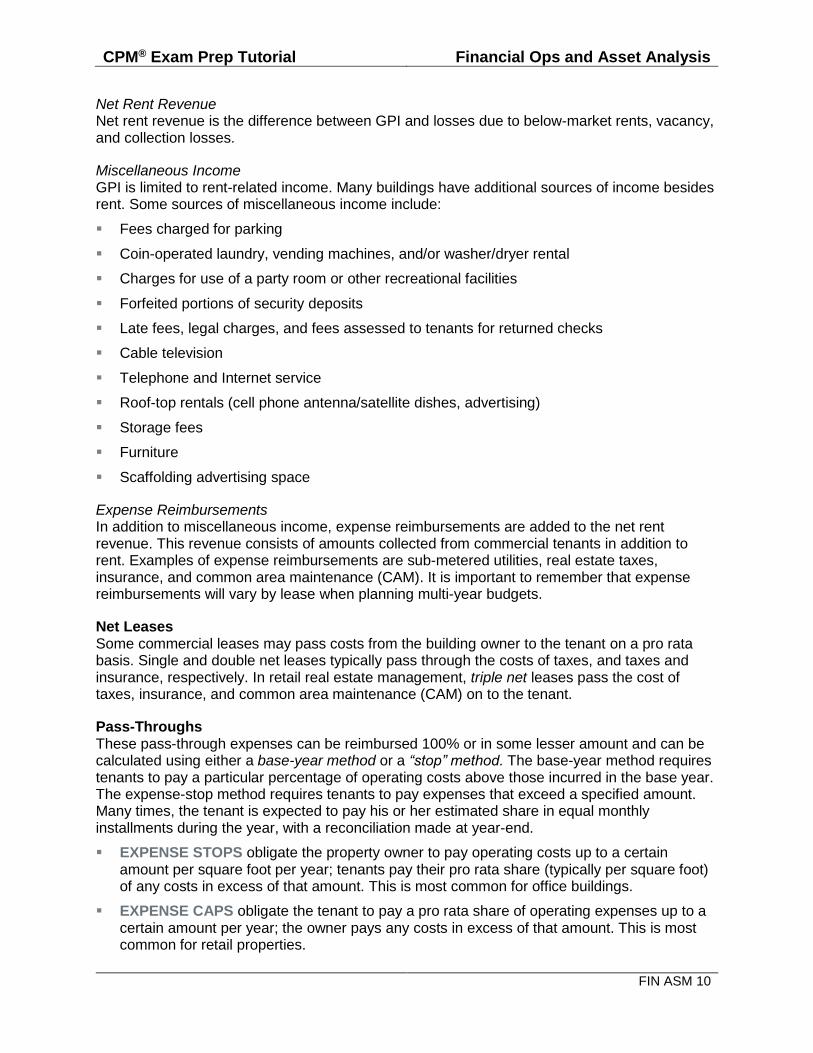
Net Rent Revenue Net rent revenue is the difference between GPI and losses due to below-market rents, vacancy, and collection losses.
Miscellaneous Income GPI is limited to rent-related income. Many buildings have additional sources of income besides rent. Some sources of miscellaneous income include:
Fees charged for parking
Coin-operated laundry, vending machines, and/or washer/dryer rental
Charges for use of a party room or other recreational facilities
Forfeited portions of security deposits
Late fees, legal charges, and fees assessed to tenants for returned checks
Cable television
Telephone and Internet service
Roof-top rentals (cell phone antenna/satellite dishes, advertising)
Storage fees
Furniture
Scaffolding advertising space
Expense Reimbursements In addition to miscellaneous income, expense reimbursements are added to the net rent revenue. This revenue consists of amounts collected from commercial tenants in addition to rent. Examples of expense reimbursements are sub-metered utilities, real estate taxes, insurance, and common area maintenance (CAM). It is important to remember that expense reimbursements will vary by lease when planning multi-year budgets.
Net Leases Some commercial leases may pass costs from the building owner to the tenant on a pro rata basis. Single and double net leases typically pass through the costs of taxes, and taxes and insurance, respectively. In retail real estate management, triple net leases pass the cost of taxes, insurance, and common area maintenance (CAM) on to the tenant.
Pass-Throughs These pass-through expenses can be reimbursed 100% or in some lesser amount and can be calculated using either a base-year method or a “stop” method. The base-year method requires tenants to pay a particular percentage of operating costs above those incurred in the base year. The expense-stop method requires tenants to pay expenses that exceed a specified amount. Many times, the tenant is expected to pay his or her estimated share in equal monthly installments during the year, with a reconciliation made at year-end.
EXPENSE STOPS obligate the property owner to pay operating costs up to a certain amount per square foot per year; tenants pay their pro rata share (typically per square foot) of any costs in excess of that amount. This is most common for office buildings.
EXPENSE CAPS obligate the tenant to pay a pro rata share of operating expenses up to a certain amount per year; the owner pays any costs in excess of that amount. This is most common for retail properties.
CPM® Exam Prep Tutorial Financial Ops and Asset Analysis
FIN ASM 11
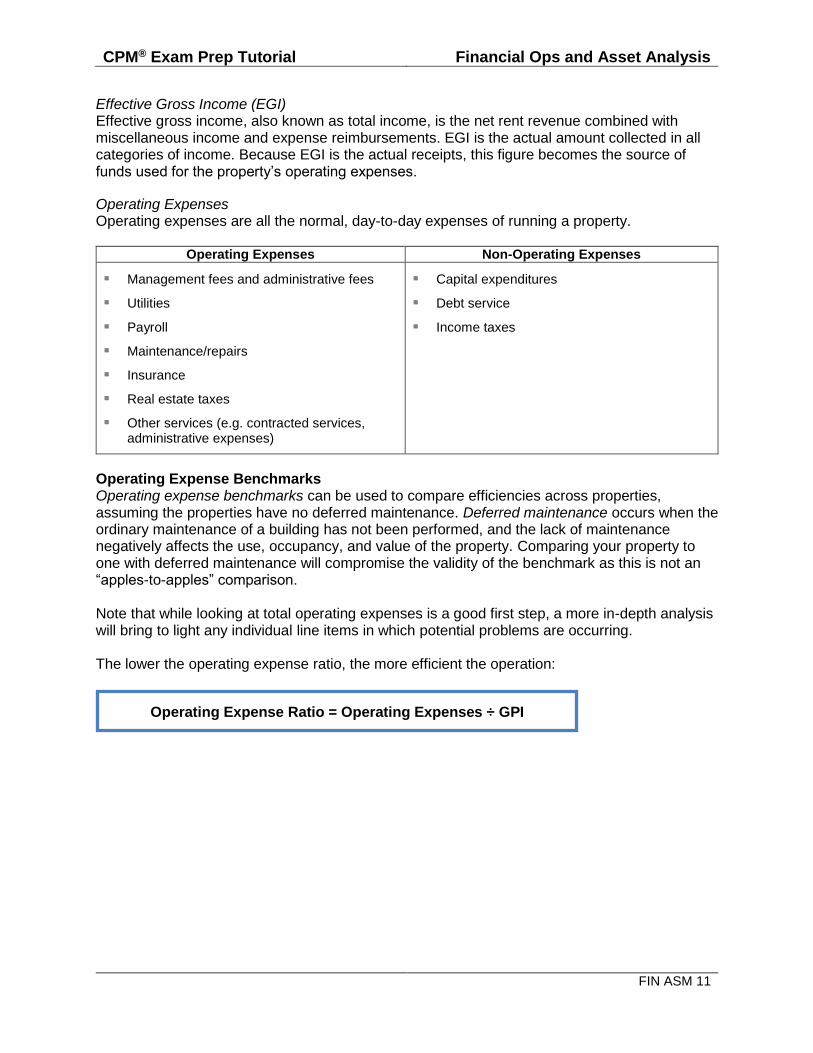
Effective Gross Income (EGI) Effective gross income, also known as total income, is the net rent revenue combined with miscellaneous income and expense reimbursements. EGI is the actual amount collected in all categories of income. Because EGI is the actual receipts, this figure becomes the source of funds used for the property’s operating expenses.
Operating Expenses Operating expenses are all the normal, day-to-day expenses of running a property.
Operating Expenses Non-Operating Expenses
Management fees and administrative fees
Utilities
Payroll
Maintenance/repairs
Insurance
Real estate taxes
Other services (e.g. contracted services, administrative expenses)
Capital expenditures
Debt service
Income taxes
Operating Expense Benchmarks Operating expense benchmarks can be used to compare efficiencies across properties, assuming the properties have no deferred maintenance. Deferred maintenance occurs when the ordinary maintenance of a building has not been performed, and the lack of maintenance negatively affects the use, occupancy, and value of the property. Comparing your property to one with deferred maintenance will compromise the validity of the benchmark as this is not an “apples-to-apples” comparison. Note that while looking at total operating expenses is a good first step, a more in-depth analysis will bring to light any individual line items in which potential problems are occurring. The lower the operating expense ratio, the more efficient the operation:
Operating Expense Ratio = Operating Expenses ÷ GPI
CPM® Exam Prep Tutorial Financial Ops and Asset Analysis
FIN ASM 12
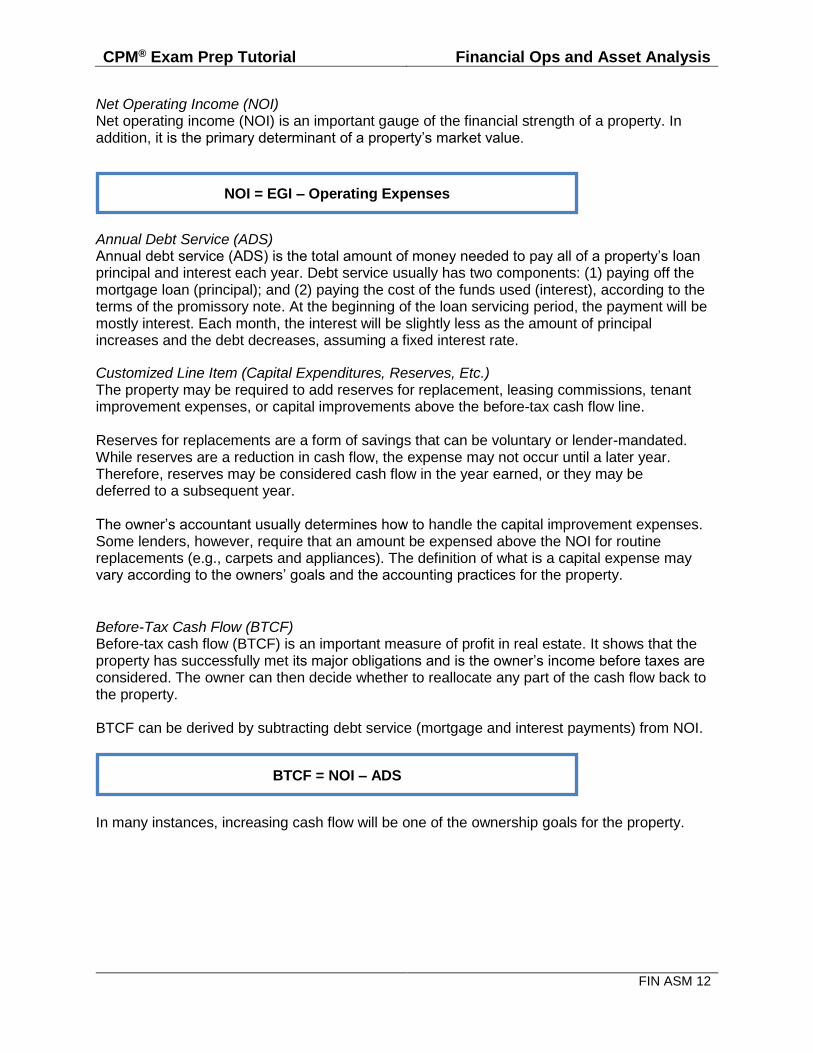
Net Operating Income (NOI) Net operating income (NOI) is an important gauge of the financial strength of a property. In addition, it is the primary determinant of a property’s market value.
Annual Debt Service (ADS) Annual debt service (ADS) is the total amount of money needed to pay all of a property’s loan principal and interest each year. Debt service usually has two components: (1) paying off the mortgage loan (principal); and (2) paying the cost of the funds used (interest), according to the terms of the promissory note. At the beginning of the loan servicing period, the payment will be mostly interest. Each month, the interest will be slightly less as the amount of principal increases and the debt decreases, assuming a fixed interest rate.
Customized Line Item (Capital Expenditures, Reserves, Etc.) The property may be required to add reserves for replacement, leasing commissions, tenant improvement expenses, or capital improvements above the before-tax cash flow line. Reserves for replacements are a form of savings that can be voluntary or lender-mandated. While reserves are a reduction in cash flow, the expense may not occur until a later year. Therefore, reserves may be considered cash flow in the year earned, or they may be deferred to a subsequent year. The owner’s accountant usually determines how to handle the capital improvement expenses. Some lenders, however, require that an amount be expensed above the NOI for routine replacements (e.g., carpets and appliances). The definition of what is a capital expense may vary according to the owners’ goals and the accounting practices for the property.
Before-Tax Cash Flow (BTCF) Before-tax cash flow (BTCF) is an important measure of profit in real estate. It shows that the property has successfully met its major obligations and is the owner’s income before taxes are considered. The owner can then decide whether to reallocate any part of the cash flow back to the property. BTCF can be derived by subtracting debt service (mortgage and interest payments) from NOI.
In many instances, increasing cash flow will be one of the ownership goals for the property.
NOI = EGI – Operating Expenses
BTCF = NOI – ADS
CPM® Exam Prep Tutorial Financial Ops and Asset Analysis
FIN ASM 13
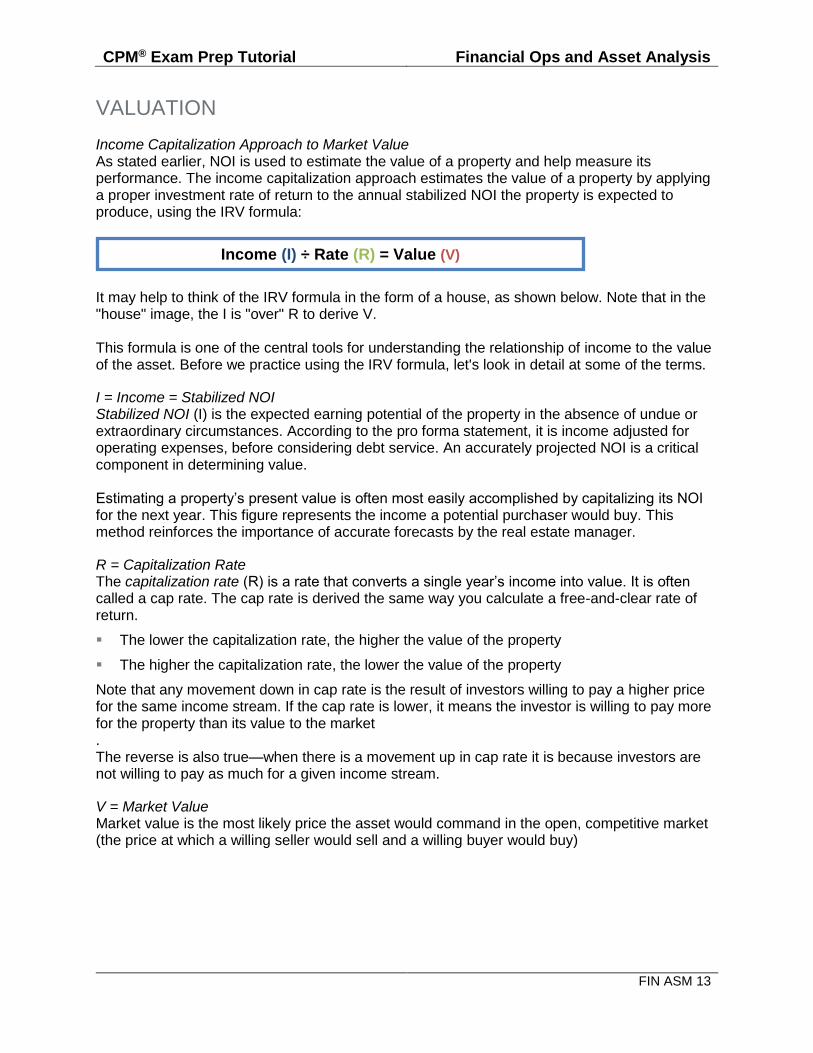
VALUATION
Income Capitalization Approach to Market Value As stated earlier, NOI is used to estimate the value of a property and help measure its performance. The income capitalization approach estimates the value of a property by applying a proper investment rate of return to the annual stabilized NOI the property is expected to produce, using the IRV formula:
It may help to think of the IRV formula in the form of a house, as shown below. Note that in the "house" image, the I is "over" R to derive V. This formula is one of the central tools for understanding the relationship of income to the value of the asset. Before we practice using the IRV formula, let's look in detail at some of the terms.
I = Income = Stabilized NOI Stabilized NOI (I) is the expected earning potential of the property in the absence of undue or extraordinary circumstances. According to the pro forma statement, it is income adjusted for operating expenses, before considering debt service. An accurately projected NOI is a critical component in determining value. Estimating a property’s present value is often most easily accomplished by capitalizing its NOI for the next year. This figure represents the income a potential purchaser would buy. This method reinforces the importance of accurate forecasts by the real estate manager.
R = Capitalization Rate The capitalization rate (R) is a rate that converts a single year’s income into value. It is often called a cap rate. The cap rate is derived the same way you calculate a free-and-clear rate of return.
The lower the capitalization rate, the higher the value of the property
The higher the capitalization rate, the lower the value of the property
Note that any movement down in cap rate is the result of investors willing to pay a higher price for the same income stream. If the cap rate is lower, it means the investor is willing to pay more for the property than its value to the market . The reverse is also true—when there is a movement up in cap rate it is because investors are not willing to pay as much for a given income stream.
V = Market Value Market value is the most likely price the asset would command in the open, competitive market (the price at which a willing seller would sell and a willing buyer would buy)
Income (I) ÷ Rate (R) = Value (V)
CPM® Exam Prep Tutorial Financial Ops and Asset Analysis
FIN ASM 14
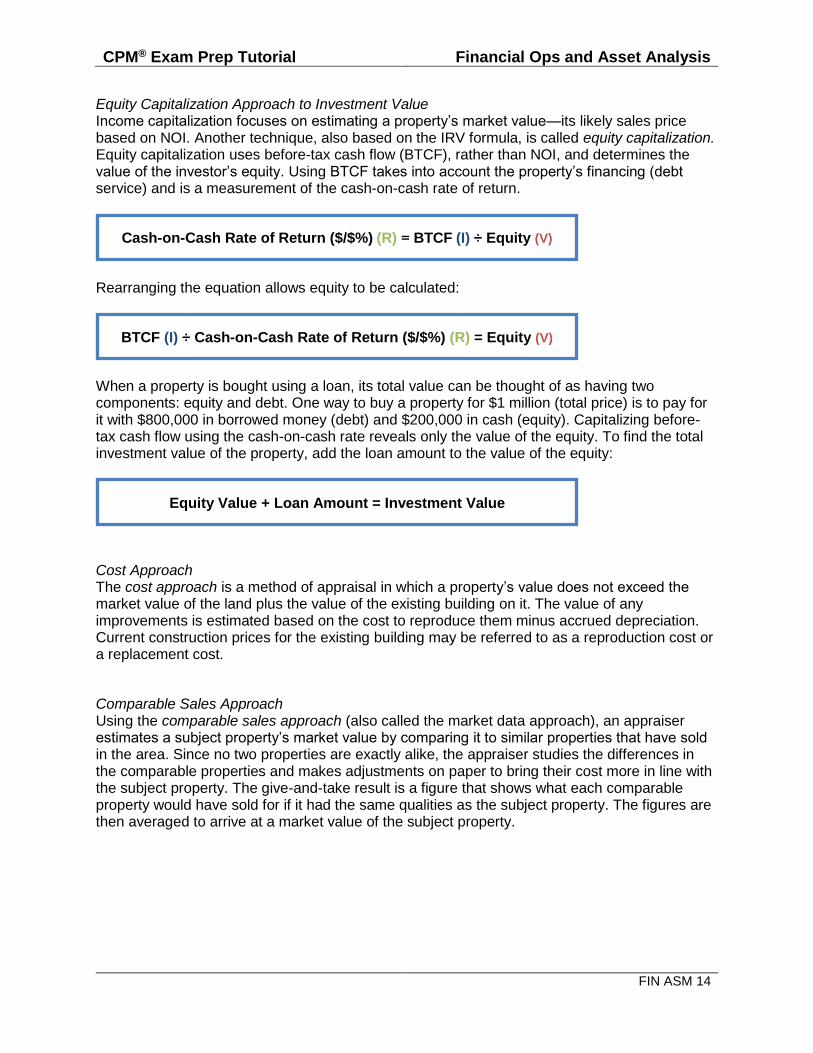
Equity Capitalization Approach to Investment Value Income capitalization focuses on estimating a property’s market value—its likely sales price based on NOI. Another technique, also based on the IRV formula, is called equity capitalization. Equity capitalization uses before-tax cash flow (BTCF), rather than NOI, and determines the value of the investor’s equity. Using BTCF takes into account the property’s financing (debt service) and is a measurement of the cash-on-cash rate of return.
Rearranging the equation allows equity to be calculated:
When a property is bought using a loan, its total value can be thought of as having two components: equity and debt. One way to buy a property for $1 million (total price) is to pay for it with $800,000 in borrowed money (debt) and $200,000 in cash (equity). Capitalizing before-tax cash flow using the cash-on-cash rate reveals only the value of the equity. To find the total investment value of the property, add the loan amount to the value of the equity:
Cost Approach The cost approach is a method of appraisal in which a property’s value does not exceed the market value of the land plus the value of the existing building on it. The value of any improvements is estimated based on the cost to reproduce them minus accrued depreciation. Current construction prices for the existing building may be referred to as a reproduction cost or a replacement cost.
Comparable Sales Approach Using the comparable sales approach (also called the market data approach), an appraiser estimates a subject property’s market value by comparing it to similar properties that have sold in the area. Since no two properties are exactly alike, the appraiser studies the differences in the comparable properties and makes adjustments on paper to bring their cost more in line with the subject property. The give-and-take result is a figure that shows what each comparable property would have sold for if it had the same qualities as the subject property. The figures are then averaged to arrive at a market value of the subject property.
Cash-on-Cash Rate of Return ($/$%) (R) = BTCF (I) ÷ Equity (V)
BTCF (I) ÷ Cash-on-Cash Rate of Return ($/$%) (R) = Equity (V)
Equity Value + Loan Amount = Investment Value
CPM® Exam Prep Tutorial Financial Ops and Asset Analysis
FIN ASM 15
FINANCING A typical mortgage loan has two parts: the promissory note and the mortgage.
The first part is the PROMISSORY NOTE, the legal document that a person executes (signs), in which the person makes the promise to pay back the lender. The promissory note lays out in detail the payment terms, interest rate, and other conditions of the loan.
The MORTGAGE is the legal document that pledges the real estate as collateral for a loan. COLLATERAL is any property pledged for payment of a loan and is said to secure a loan. (Unsecured loans are riskier and have higher interest rates.)
Costs of Borrowing Money Of course, there are costs involved in obtaining a loan. Some fees (or interest rate charges) are described as basis points (BP), which, as a standard, are 1/100th of one percent of the loan. These costs, which can vary from 4% to 8% of the loan amount, should be included in a real estate manager’s budgeting and decisions.
Title Theory vs. Lien Theory In the United States, two legal theories govern the property rights of a mortgage lender: title theory and lien theory. Most states follow the lien theory. Both theories are based on the concept of title. In states that follow title theory, legal title right to the mortgaged property actually transfers to the lender or to a third party to hold for the lender by means of a deed of trust. When the loan has been repaid, the property is transferred back to the borrower. This is called title theory because the title of the property actually changes hands. Under the lien theory, title to the mortgaged property remains with the borrower, and a lien, or claim, upon the property is given to the lender by means of the mortgage. The mortgage is a conditional deed that does not operate to transfer title unless a default has occurred in repayment of the loan. Virtually every interest in a property can be characterized by a lien:
MORTGAGES AND DEEDS OF TRUST create one kind of lien on property, a collateral or monetary lien, since the lien is given to secure repayment of the debt.
LEASES are another kind of lien, one that creates possession and enjoyment rights because it is a right given to someone to occupy the property for a specified length of time.
A MECHANIC’S LIEN secures payment for materials or labor used in construction. A person who has not been paid for providing construction labor or material used on the property may petition the court for a monetary lien on the property. Such a lien secures payment for the contractor.
TAX LIENS are monetary liens by federal, state, or local tax authorities for unpaid taxes.
Priority of Liens When a property is encumbered by competing claims, a determination must be made regarding whose claim should be honored first. Generally, such claims are ranked in the order they are created, with the first having priority over all subsequent claims. That is the reason we refer to competing mortgage claims as a first mortgage, second mortgage, and so on. The mortgage that is created first has priority over all other mortgages, even when the loan amount may be smaller than the amount on a second mortgage, as in the case of a wraparound mortgage.
CPM® Exam Prep Tutorial Financial Ops and Asset Analysis
FIN ASM 16
Types of Loans Financing for a property may be required for acquisition, major replacements, improvements, renovations, and rehabilitations. Thus, one responsibility of a real estate manager may be to compare mortgage loan options in order to select the most advantageous loan structure from available financing alternatives. It is important to first understand the various types of loans that can be obtained in the marketplace today.
Loan Type Description
Interim Financing
Interim financing is a temporary or short-term loan secured by a mortgage and generally paid off from the proceeds of permanent financing. A construction loan, a short-term loan that remains outstanding during the time needed to complete construction, is a common form of interim financing. Construction loans are often replaced by permanent financing — longer-term loans that are usually amortized over 25 to 30 years. Bridge loans may be used for financing between two events; the most common situation being between the construction loan and the completion of permanent financing.
Takeout A takeout loan is permanent financing that is funded at the completion of construction, with the funds being used to pay off (take out) the construction lender.
Interest-only An interest-only loan (also referred to as a straight-term, standing, or demand loan) is a type of mortgage in which the borrower makes only interest payments until the maturity date. Then, the entire principal must be repaid in a single payment (refer to balloon loan, below).
Fully Amortized
A fully amortized loan is characterized by periodic payments that include a portion applied to interest and a portion applied to principal. In the early years of the mortgage, a greater portion of the payment is applied to the interest. As the loan matures, a greater portion of the payment is applied to the principal, and the entire debt obligation is extinguished at the end of the loan term. Over the course of a fully amortized loan, the borrower builds equity in the property, and the lender gains additional cushioning against loss in the case of default of payment. There are two types of fully amortized loans, fixed-rate and adjustable-rate, which will be discussed later in the lesson.
Balloon A balloon, or partially amortized loan, has uniform periodic payments that include amounts for interest and principal, but the periodic principal payments do not fully amortize the mortgage because the term of the loan is shorter than the full amortization period. Thus, a substantial single payment, called a balloon payment, is due at the end of the loan term. This balloon payment is typically refinanced at a newly negotiated interest rate or is paid from the proceeds of a sale of the property.
The advantage of a balloon loan to the borrower is that the periodic payments are lower than they would be for a fully amortizing loan because the lender can offer a balloon loan at a lower rate of interest since the loan term is shorter. The advantage to the lender is that the fixed rate of interest is not committed for long periods. The lender will receive the balance of the loan back earlier and will be able to make those funds available for future lending.
Mezzanine Most commercial mortgage lenders [banks, life insurance companies, Commercial Mortgage Backed Securities (CMBS), etc.] are limited by regulation, rating agencies, or market constraints to real estate loans with a maximum loan-to-value ratio of 75-80%. To reduce the amount of equity required to invest in a real estate project, many borrowers will increase the total property leverage to 85-90% through the use of mezzanine debt. Due to first-mortgage lender restrictions on subordinate mortgages,
CPM® Exam Prep Tutorial Financial Ops and Asset Analysis
FIN ASM 17
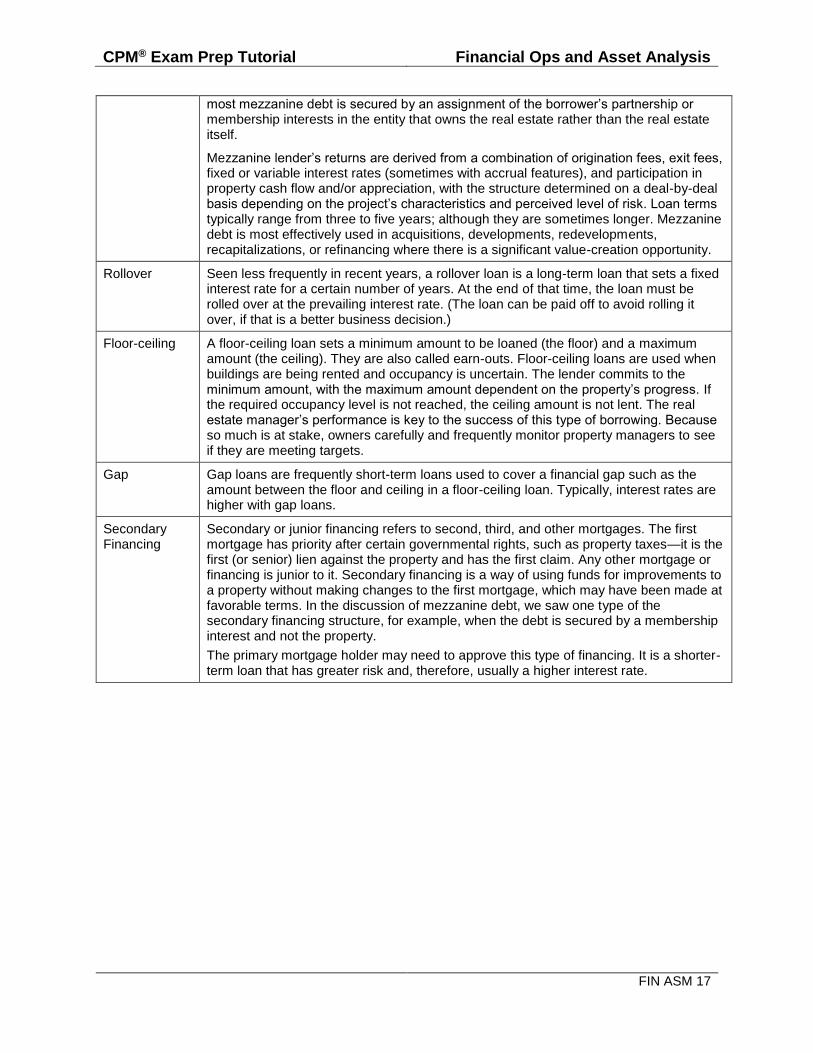
most mezzanine debt is secured by an assignment of the borrower’s partnership or membership interests in the entity that owns the real estate rather than the real estate itself.
Mezzanine lender’s returns are derived from a combination of origination fees, exit fees, fixed or variable interest rates (sometimes with accrual features), and participation in property cash flow and/or appreciation, with the structure determined on a deal-by-deal basis depending on the project’s characteristics and perceived level of risk. Loan terms typically range from three to five years; although they are sometimes longer. Mezzanine debt is most effectively used in acquisitions, developments, redevelopments, recapitalizations, or refinancing where there is a significant value-creation opportunity.
Rollover Seen less frequently in recent years, a rollover loan is a long-term loan that sets a fixed interest rate for a certain number of years. At the end of that time, the loan must be rolled over at the prevailing interest rate. (The loan can be paid off to avoid rolling it over, if that is a better business decision.)
Floor-ceiling A floor-ceiling loan sets a minimum amount to be loaned (the floor) and a maximum amount (the ceiling). They are also called earn-outs. Floor-ceiling loans are used when buildings are being rented and occupancy is uncertain. The lender commits to the minimum amount, with the maximum amount dependent on the property’s progress. If the required occupancy level is not reached, the ceiling amount is not lent. The real estate manager’s performance is key to the success of this type of borrowing. Because so much is at stake, owners carefully and frequently monitor property managers to see if they are meeting targets.
Gap Gap loans are frequently short-term loans used to cover a financial gap such as the amount between the floor and ceiling in a floor-ceiling loan. Typically, interest rates are higher with gap loans.
Secondary Financing
Secondary or junior financing refers to second, third, and other mortgages. The first mortgage has priority after certain governmental rights, such as property taxes—it is the first (or senior) lien against the property and has the first claim. Any other mortgage or financing is junior to it. Secondary financing is a way of using funds for improvements to a property without making changes to the first mortgage, which may have been made at favorable terms. In the discussion of mezzanine debt, we saw one type of the secondary financing structure, for example, when the debt is secured by a membership interest and not the property.
The primary mortgage holder may need to approve this type of financing. It is a shorter-term loan that has greater risk and, therefore, usually a higher interest rate.
CPM® Exam Prep Tutorial Financial Ops and Asset Analysis
FIN ASM 18
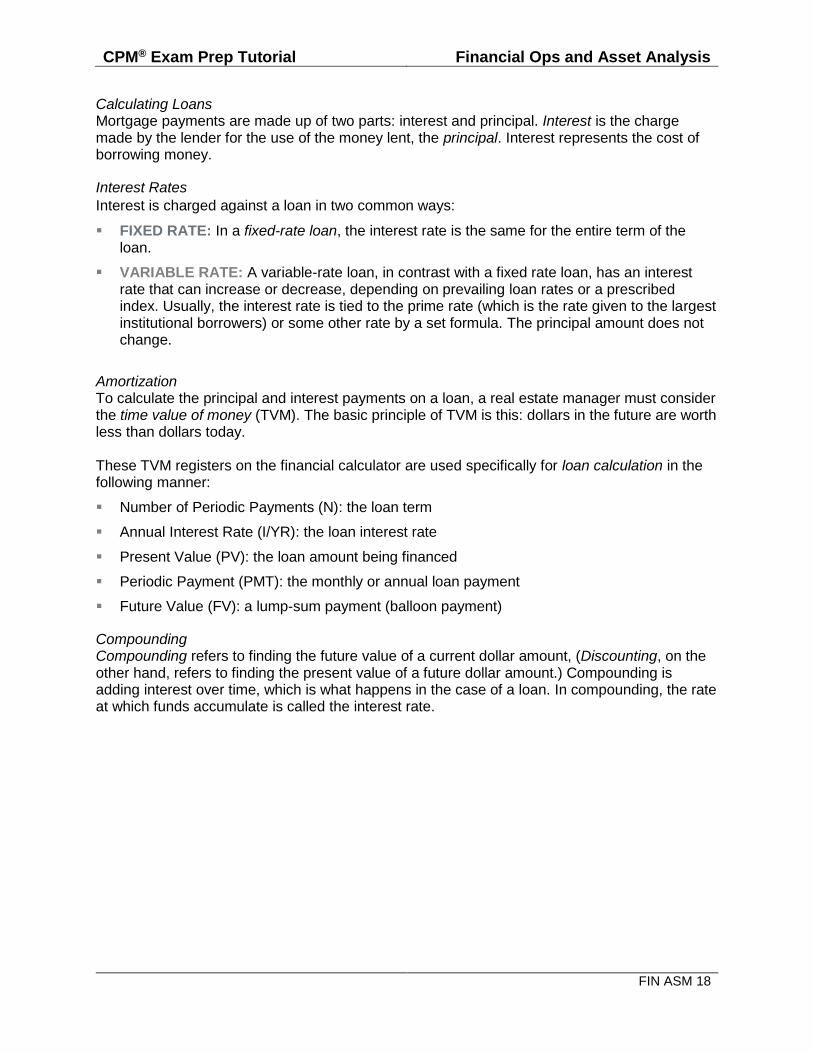
Calculating Loans Mortgage payments are made up of two parts: interest and principal. Interest is the charge made by the lender for the use of the money lent, the principal. Interest represents the cost of borrowing money.
Interest Rates
Interest is charged against a loan in two common ways:
FIXED RATE: In a fixed-rate loan, the interest rate is the same for the entire term of the loan.
VARIABLE RATE: A variable-rate loan, in contrast with a fixed rate loan, has an interest rate that can increase or decrease, depending on prevailing loan rates or a prescribed index. Usually, the interest rate is tied to the prime rate (which is the rate given to the largest institutional borrowers) or some other rate by a set formula. The principal amount does not change.
Amortization To calculate the principal and interest payments on a loan, a real estate manager must consider the time value of money (TVM). The basic principle of TVM is this: dollars in the future are worth less than dollars today. These TVM registers on the financial calculator are used specifically for loan calculation in the following manner:
Number of Periodic Payments (N): the loan term
Annual Interest Rate (I/YR): the loan interest rate
Present Value (PV): the loan amount being financed
Periodic Payment (PMT): the monthly or annual loan payment
Future Value (FV): a lump-sum payment (balloon payment)
Compounding Compounding refers to finding the future value of a current dollar amount, (Discounting, on the other hand, refers to finding the present value of a future dollar amount.) Compounding is adding interest over time, which is what happens in the case of a loan. In compounding, the rate at which funds accumulate is called the interest rate.
CPM® Exam Prep Tutorial Financial Ops and Asset Analysis
FIN ASM 19
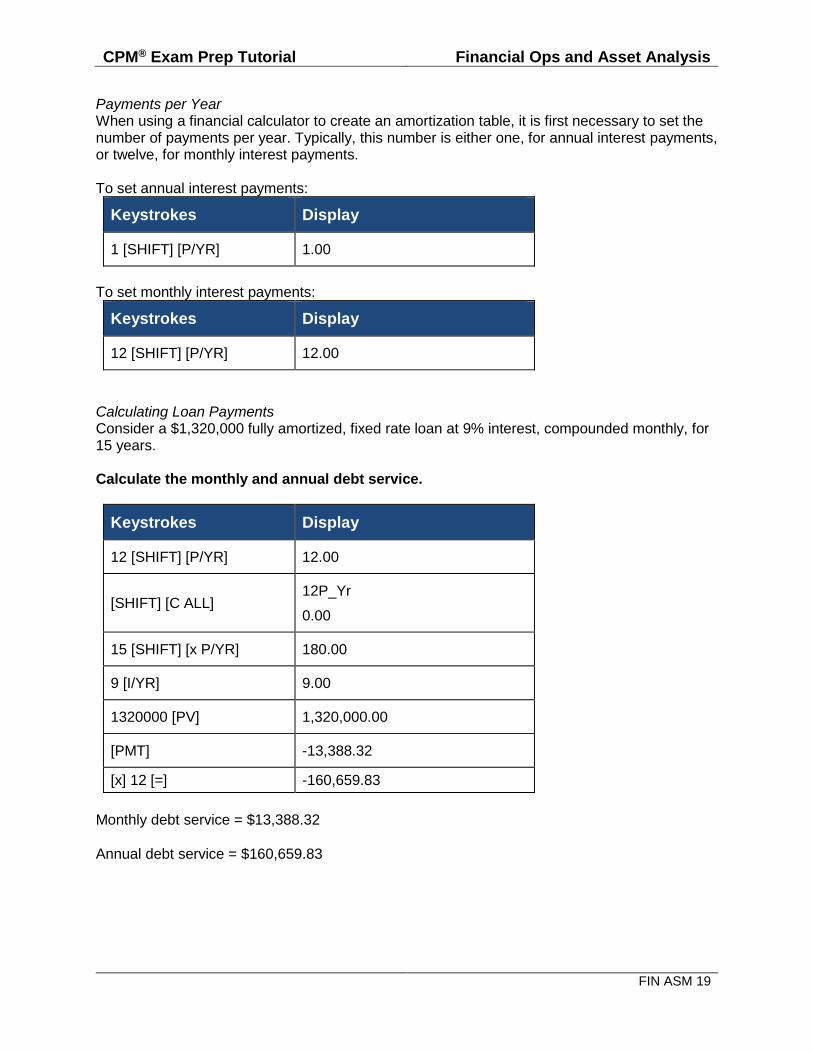
Payments per Year When using a financial calculator to create an amortization table, it is first necessary to set the number of payments per year. Typically, this number is either one, for annual interest payments, or twelve, for monthly interest payments. To set annual interest payments:
Keystrokes Display
1 [SHIFT] [P/YR] 1.00
To set monthly interest payments:
Keystrokes Display
12 [SHIFT] [P/YR] 12.00
Calculating Loan Payments Consider a $1,320,000 fully amortized, fixed rate loan at 9% interest, compounded monthly, for 15 years. Calculate the monthly and annual debt service.
Keystrokes Display
12 [SHIFT] [P/YR] 12.00
[SHIFT] [C ALL] 12P_Yr
0.00
15 [SHIFT] [x P/YR] 180.00
9 [I/YR] 9.00
1320000 [PV] 1,320,000.00
[PMT] -13,388.32
[x] 12 [=] -160,659.83
Monthly debt service = $13,388.32
Annual debt service = $160,659.83
CPM® Exam Prep Tutorial Financial Ops and Asset Analysis
FIN ASM 20
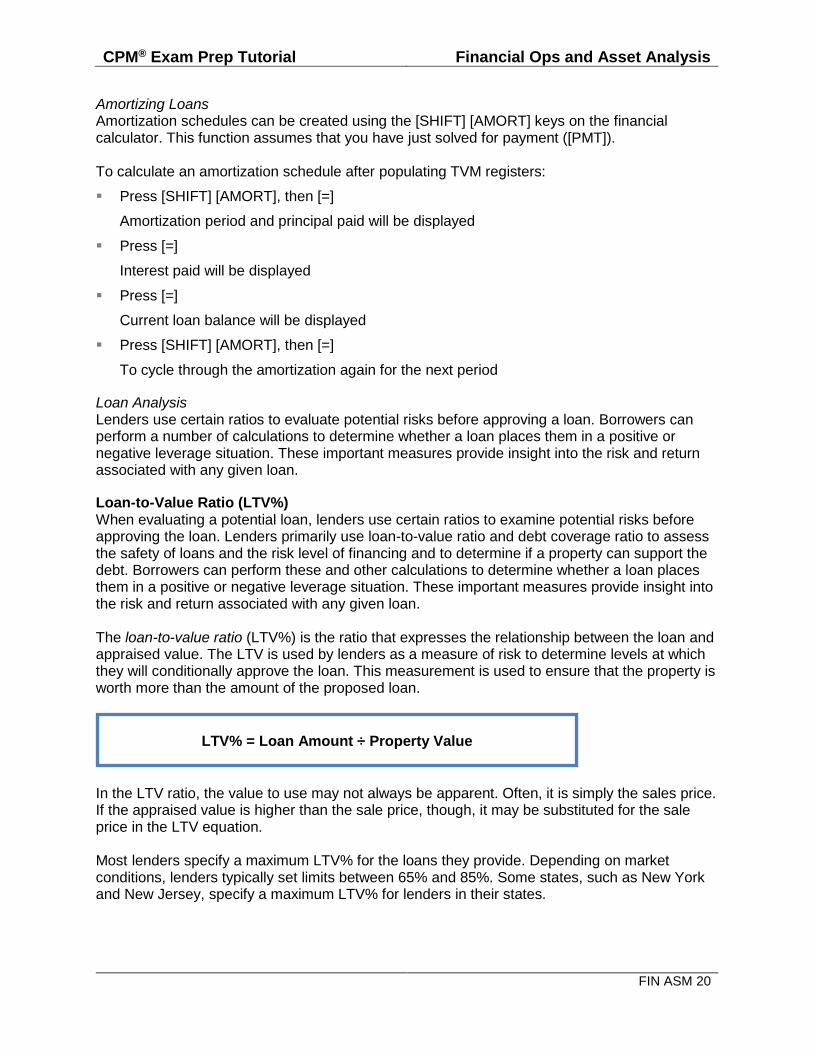
Amortizing Loans Amortization schedules can be created using the [SHIFT] [AMORT] keys on the financial calculator. This function assumes that you have just solved for payment ([PMT]). To calculate an amortization schedule after populating TVM registers:
Press [SHIFT] [AMORT], then [=]
Amortization period and principal paid will be displayed
Press [=]
Interest paid will be displayed
Press [=]
Current loan balance will be displayed
Press [SHIFT] [AMORT], then [=]
To cycle through the amortization again for the next period
Loan Analysis Lenders use certain ratios to evaluate potential risks before approving a loan. Borrowers can perform a number of calculations to determine whether a loan places them in a positive or negative leverage situation. These important measures provide insight into the risk and return associated with any given loan.
Loan-to-Value Ratio (LTV%) When evaluating a potential loan, lenders use certain ratios to examine potential risks before approving the loan. Lenders primarily use loan-to-value ratio and debt coverage ratio to assess the safety of loans and the risk level of financing and to determine if a property can support the debt. Borrowers can perform these and other calculations to determine whether a loan places them in a positive or negative leverage situation. These important measures provide insight into the risk and return associated with any given loan. The loan-to-value ratio (LTV%) is the ratio that expresses the relationship between the loan and appraised value. The LTV is used by lenders as a measure of risk to determine levels at which they will conditionally approve the loan. This measurement is used to ensure that the property is worth more than the amount of the proposed loan.
In the LTV ratio, the value to use may not always be apparent. Often, it is simply the sales price. If the appraised value is higher than the sale price, though, it may be substituted for the sale price in the LTV equation. Most lenders specify a maximum LTV% for the loans they provide. Depending on market conditions, lenders typically set limits between 65% and 85%. Some states, such as New York and New Jersey, specify a maximum LTV% for lenders in their states.
LTV% = Loan Amount ÷ Property Value
CPM® Exam Prep Tutorial Financial Ops and Asset Analysis
FIN ASM 21
The LTV% normally declines over the life of the loan because principal payments on most mortgages reduce the outstanding loan amount. Therefore, the lender’s risk should decline as the loan is paid down.
Debt Coverage Ratio (DCR) The debt coverage ratio (DCR) compares the annual NOI to the ADS of the loan. It indicates the investment’s capacity to repay the loan. DCR is written as a ratio, such as 1.2:1. The closer the DCR is to 1, the higher the risk is to the lender.
Leverage A characteristic that makes real estate notably different from other kinds of investments is its use of leverage—an investor can borrow a major portion of the purchase price. Leverage is the use of borrowed funds to increase one’s purchasing power. Leverage affects the decision-making process by changing the rate of return an investor earns on equity. It describes how effectively an investor uses debt.
POSITIVE LEVERAGE occurs when the property generates a higher return with the use of debt. Positive leverage means that borrowing increases the rate of return on the owner’s equity.
Conversely, NEGATIVE LEVERAGE means the property generates a lower rate of return with the use of debt (i.e., cash flow is lower).
The leverage position can be determined by comparing three critical measures:
Loan Constant (k%)
Free-and-Clear Rate of Return
Cash-on-Cash Rate of Return ($/$%)
Loan Constant The loan constant (k%) is the percentage of the loan amount that is required annually to service principal and interest payments on the loan. The term “constant” refers to a constant method of
calculation rather than a constant value. Because the loan constant includes both principal and interest payments, it is always higher than the loan’s interest rate, except in interest-only loans, where the loan constant equals the interest rate. Shorter-term debt has a higher constant because more principal is being paid back. Longer-term debt has a lower constant (one closer to the interest rate) because less principal is being paid off. The loan constant represents the amount to be paid for each dollar borrowed. The equation for the loan constant relates the ADS to the original loan amount:
DCR = NOI ÷ ADS
CPM® Exam Prep Tutorial Financial Ops and Asset Analysis
FIN ASM 22
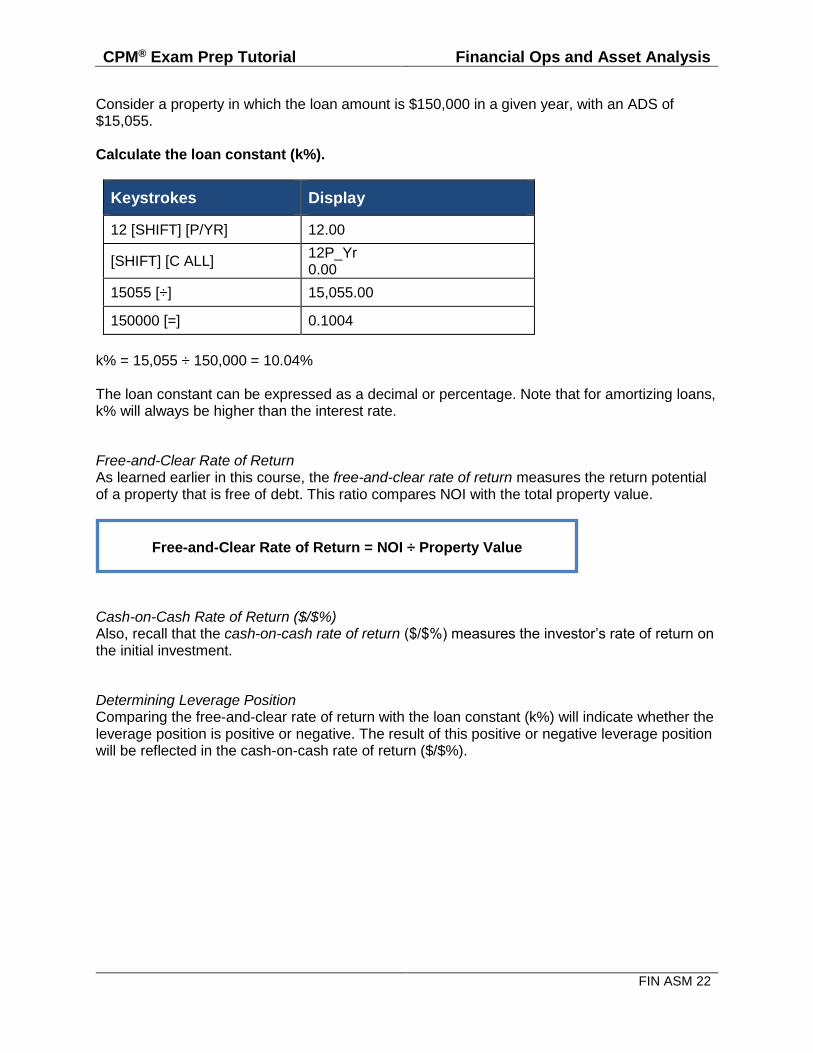
Consider a property in which the loan amount is $150,000 in a given year, with an ADS of $15,055. Calculate the loan constant (k%).
Keystrokes Display
12 [SHIFT] [P/YR] 12.00
[SHIFT] [C ALL] 12P_Yr 0.00
15055 [÷] 15,055.00
150000 [=] 0.1004
k% = 15,055 ÷ 150,000 = 10.04% The loan constant can be expressed as a decimal or percentage. Note that for amortizing loans, k% will always be higher than the interest rate.
Free-and-Clear Rate of Return As learned earlier in this course, the free-and-clear rate of return measures the return potential of a property that is free of debt. This ratio compares NOI with the total property value.
Cash-on-Cash Rate of Return ($/$%) Also, recall that the cash-on-cash rate of return ($/$%) measures the investor’s rate of return on the initial investment.
Determining Leverage Position Comparing the free-and-clear rate of return with the loan constant (k%) will indicate whether the leverage position is positive or negative. The result of this positive or negative leverage position will be reflected in the cash-on-cash rate of return ($/$%).
Free-and-Clear Rate of Return = NOI ÷ Property Value
CPM® Exam Prep Tutorial Financial Ops and Asset Analysis
FIN ASM 23
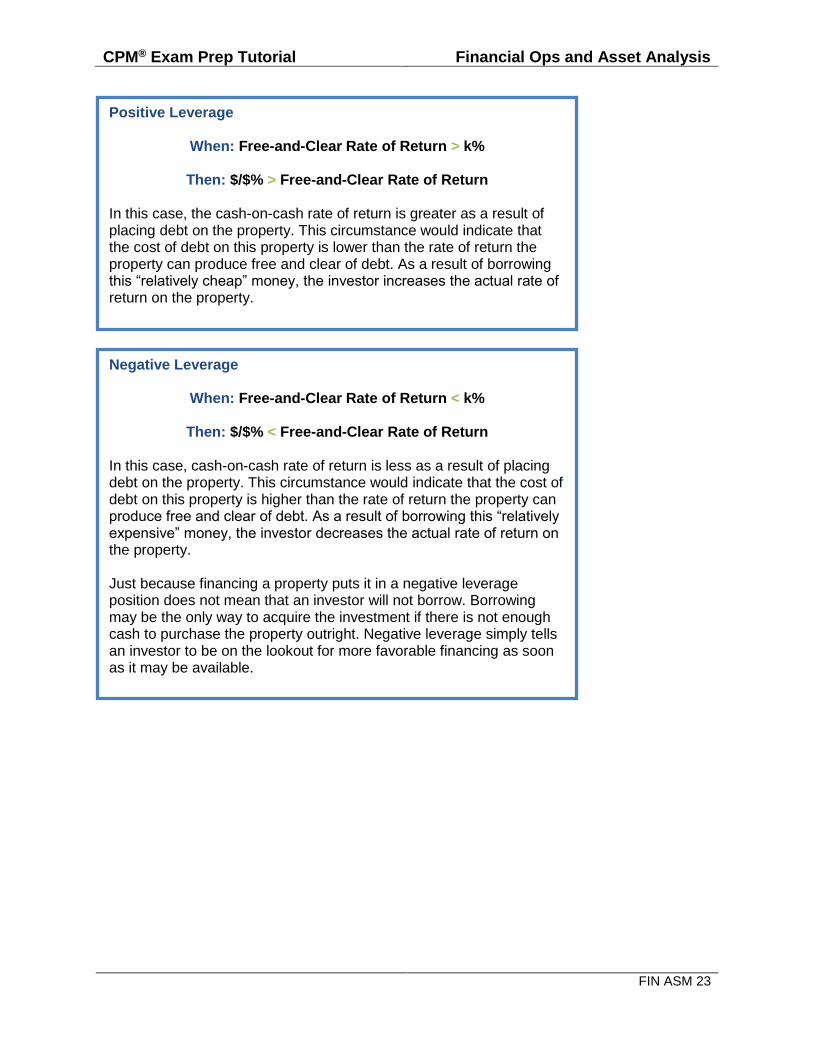
Positive Leverage
When: Free-and-Clear Rate of Return > k%
Then: $/$% > Free-and-Clear Rate of Return In this case, the cash-on-cash rate of return is greater as a result of placing debt on the property. This circumstance would indicate that the cost of debt on this property is lower than the rate of return the property can produce free and clear of debt. As a result of borrowing this “relatively cheap” money, the investor increases the actual rate of return on the property.
Negative Leverage
When: Free-and-Clear Rate of Return < k%
Then: $/$% < Free-and-Clear Rate of Return In this case, cash-on-cash rate of return is less as a result of placing debt on the property. This circumstance would indicate that the cost of debt on this property is higher than the rate of return the property can produce free and clear of debt. As a result of borrowing this “relatively expensive” money, the investor decreases the actual rate of return on the property. Just because financing a property puts it in a negative leverage position does not mean that an investor will not borrow. Borrowing may be the only way to acquire the investment if there is not enough cash to purchase the property outright. Negative leverage simply tells an investor to be on the lookout for more favorable financing as soon as it may be available.
CPM® Exam Prep Tutorial Financial Ops and Asset Analysis
FIN ASM 24
THE TIME VALUE OF MONEY In order to achieve the owner’s financial goals and fulfill fiduciary obligations to the client, real estate managers must understand the concept of the time value of money (TVM). The basic principle of TVM is this: Dollars in the future are worth less than dollars today.
Money is worth more today than in the future for four basic reasons:
1. Money today can be immediately spent and enjoyed.
2. Money today can be invested and earn interest.
3. Inflation diminishes the buying power of money in the future.
4. Waiting poses the risk of not receiving the money at all—accepting money today eliminates that possibility.
Let’s elaborate on the major components of TVM:
NUMBER OF PAYMENTS PER YEAR (P/YR): Number of payments per year (P/YR) is the number of times per year that the cash flow or benefit occurs. This is typically set to one payment per year (annual payments) or 12 payments per year (monthly payments).
NUMBER OF PERIODIC PAYMENTS (N): Number of periodic payments (N) is the number of periods or times a cash flow or benefit occurs. In the case of a loan, it is the number of times the loan payment is made.
ANNUAL INTEREST RATE (I/YR): Annual interest rate (I/YR) represents the rate of return, or the discount rate, on an investment. In the case of a loan, it is the interest rate charged on the loan.
PRESENT VALUE (PV): Present value (PV) refers to the present value of future benefits. It can be the present value of an investment, or in the case of a loan, the original or current loan balance. Present value is a single, lump-sum amount.
PERIODIC PAYMENT (PMT): Periodic payment (PMT) is an equal cash flow or benefit that is paid more than once. In the case of a loan, it is the payment on the loan.
FUTURE VALUE (FV): Future value (FV) refers to the value in the future of a benefit or series of benefits received over time. It can be thought of as a property’s terminal value, or in the case of a loan, a balloon payment. Future value is a single, lump-sum payment or benefit.
Present value (PV) or a series of payments (PMT) are compounded over time to determine future value (FV). Future value (FV) or a series of payments (PMT) are discounted over time to determine present value (PV).
CPM® Exam Prep Tutorial Financial Ops and Asset Analysis
FIN ASM 25
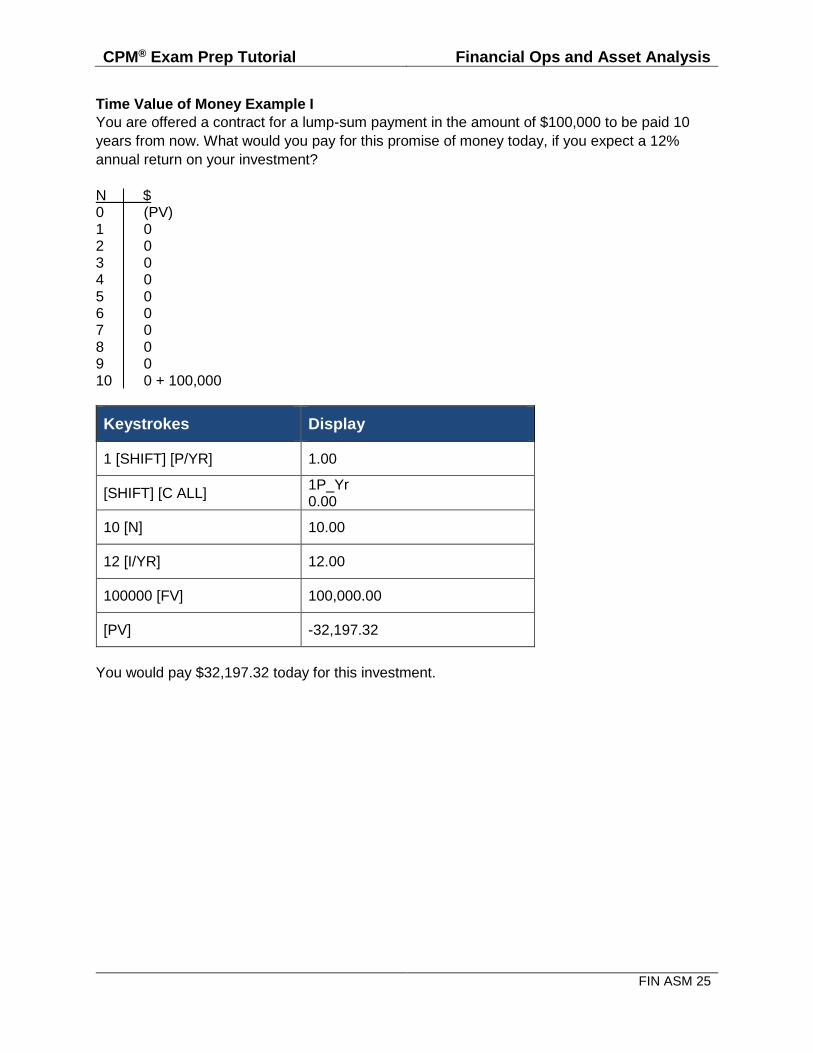
Time Value of Money Example I
You are offered a contract for a lump-sum payment in the amount of $100,000 to be paid 10
years from now. What would you pay for this promise of money today, if you expect a 12%
annual return on your investment?
N $ 0 (PV) 1 0 2 0 3 0 4 0 5 0 6 0 7 0 8 0 9 0 10 0 + 100,000
Keystrokes Display
1 [SHIFT] [P/YR] 1.00
[SHIFT] [C ALL] 1P_Yr 0.00
10 [N] 10.00
12 [I/YR] 12.00
100000 [FV] 100,000.00
[PV] -32,197.32
You would pay $32,197.32 today for this investment.
CPM® Exam Prep Tutorial Financial Ops and Asset Analysis
FIN ASM 26
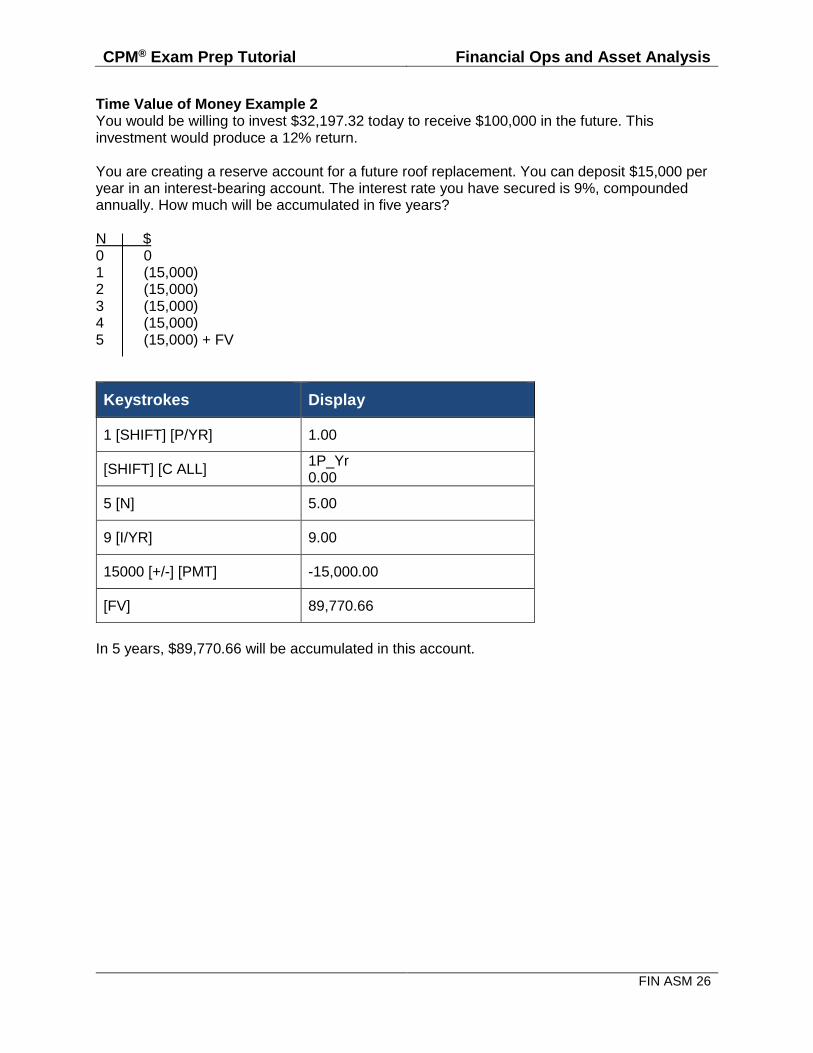
Time Value of Money Example 2 You would be willing to invest $32,197.32 today to receive $100,000 in the future. This investment would produce a 12% return. You are creating a reserve account for a future roof replacement. You can deposit $15,000 per year in an interest-bearing account. The interest rate you have secured is 9%, compounded annually. How much will be accumulated in five years? N $ 0 0 1 (15,000) 2 (15,000) 3 (15,000) 4 (15,000) 5 (15,000) + FV
Keystrokes Display
1 [SHIFT] [P/YR] 1.00
[SHIFT] [C ALL] 1P_Yr 0.00
5 [N] 5.00
9 [I/YR] 9.00
15000 [+/-] [PMT] -15,000.00
[FV] 89,770.66
In 5 years, $89,770.66 will be accumulated in this account.
CPM® Exam Prep Tutorial Financial Ops and Asset Analysis
FIN ASM 27
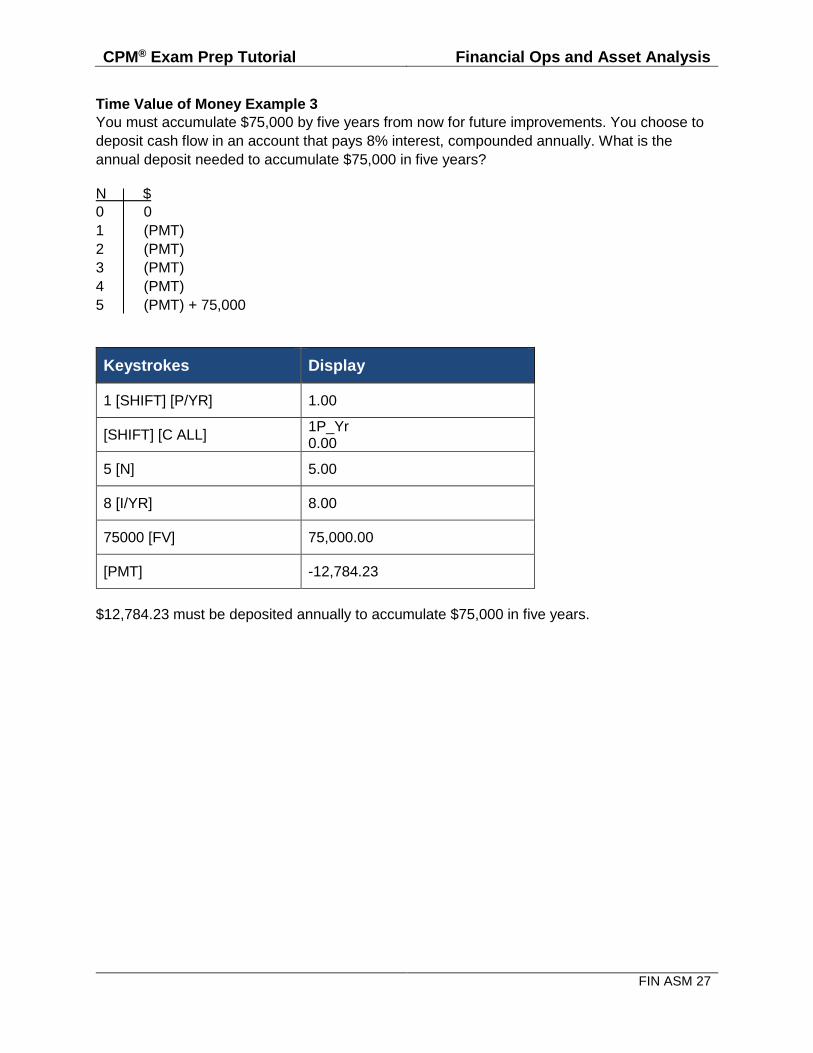
Time Value of Money Example 3
You must accumulate $75,000 by five years from now for future improvements. You choose to
deposit cash flow in an account that pays 8% interest, compounded annually. What is the
annual deposit needed to accumulate $75,000 in five years?
N $
0 0
1 (PMT)
2 (PMT)
3 (PMT)
4 (PMT)
5 (PMT) + 75,000
Keystrokes Display
1 [SHIFT] [P/YR] 1.00
[SHIFT] [C ALL] 1P_Yr 0.00
5 [N] 5.00
8 [I/YR] 8.00
75000 [FV] 75,000.00
[PMT] -12,784.23
$12,784.23 must be deposited annually to accumulate $75,000 in five years.
CPM® Exam Prep Tutorial Financial Ops and Asset Analysis
FIN ASM 28
DISCOUNTED CASH FLOW ANALYSIS Discounted cash flow (DCF) analysis uses the concept of the time value of money to determine
how much a series of payments over several months or years into the future would be worth in
present dollars. Therefore, it is a sound method used to calculate the real value of long-terms
leases.
Suppose you were offered a piece of land that could be sold for $100,000 five years from now.
Would you pay $100,000 for that land today? No, because you would receive no compensation
for the time that your money would be tied up. In addition, you would not be compensated for
the risk that you would encounter with this investment. Consequently, you would purchase the
land at an amount less than $100,000 (a discount). The amount of the discount would be
determined by the rate of return that you would require to entice you to invest. You could use
discounted cash flow analysis to determine what you should pay today for cash flow you would
receive in the future.
Components of DCF analysis follow:
NUMBER OF PAYMENTS PER YEAR (P/YR): Number of payments per year (P/YR) is the number of times per year a cash flow or benefit occurs. This is typically set to one payment per year (annual payments) or 12 payments per year (monthly payments).
NUMBER OF PERIODIC PAYMENTS (N): Number of periodic payments (N) is the number of periods or times a cash flow or benefit occurs.
ANNUAL INTEREST RATE (I/YR): Annual interest rate (I/YR) represents the rate of return or discount rate.
CASH FLOW (CFJ): Cash flow is the even or uneven cash flow or benefit that is paid or received.
NUMBER OF CONSECUTIVE CASH FLOWS (NJ): Number of consecutive cash flows is the number of periods or times the same cash flow or benefit occurs consecutively.
NET PRESENT VALUE (NPV): Net present value (NPV) is the difference between the cost of an investment and the discounted present value (PV) of all anticipated future fiscal benefits of that investment.
Note that when solving for PV using uneven cash flows on the HP10BII calculator, you must use the NPV key. This is because when initial cash flow equals 0, the NPV function becomes the PV function.
Discounted Cash Flow and Effective Rent Rent concessions are benefits used to encourage a tenant to enter into a lease. Concessions may be in the form of free rent, tenant improvements, buyouts of existing leases, reimbursements of tenant costs, etc. Concessions are negotiated as landlords and tenants perceive their position of strength in the lease market. To demonstrate the financial impact of these concessions, the industry uses a term called effective rent. To calculate effective rent, we use discounted cash flow analysis in the following way:
1. Enter the lease payments net of concessions. These are the cash flows or benefits received each period.
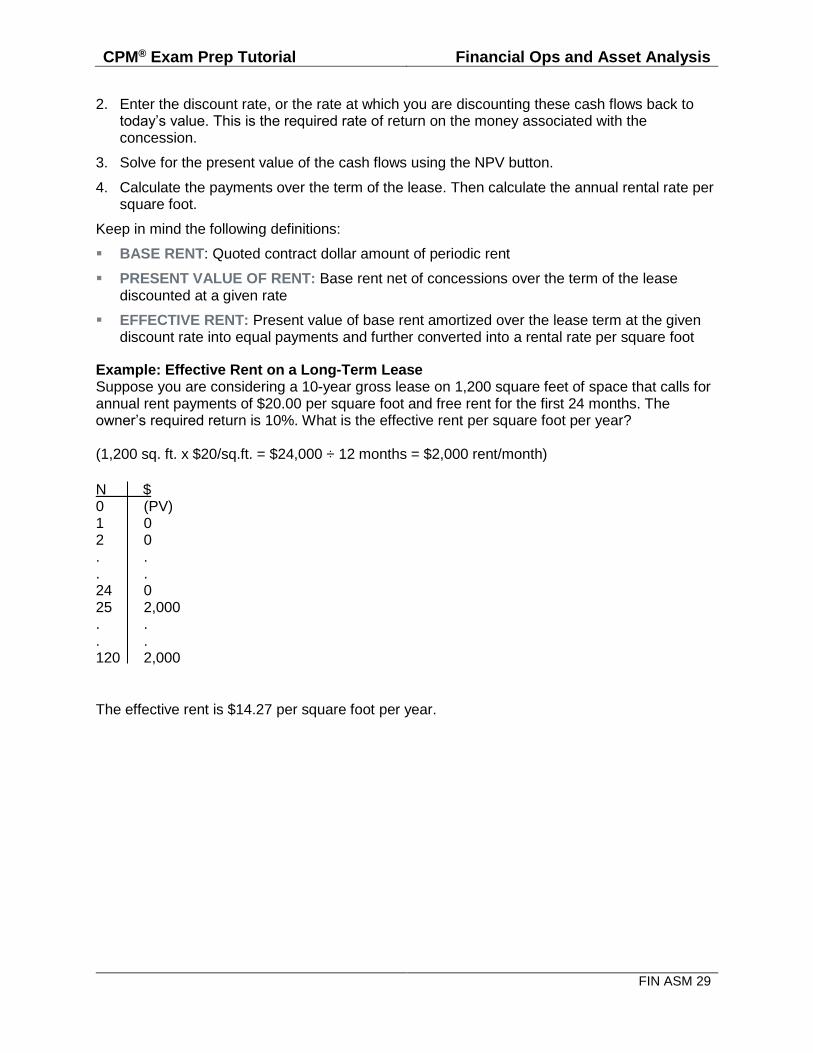
CPM® Exam Prep Tutorial Financial Ops and Asset Analysis
FIN ASM 29
2. Enter the discount rate, or the rate at which you are discounting these cash flows back to today’s value. This is the required rate of return on the money associated with the concession.
3. Solve for the present value of the cash flows using the NPV button.
4. Calculate the payments over the term of the lease. Then calculate the annual rental rate per square foot.
Keep in mind the following definitions:
BASE RENT: Quoted contract dollar amount of periodic rent
PRESENT VALUE OF RENT: Base rent net of concessions over the term of the lease discounted at a given rate
EFFECTIVE RENT: Present value of base rent amortized over the lease term at the given discount rate into equal payments and further converted into a rental rate per square foot
Example: Effective Rent on a Long-Term Lease Suppose you are considering a 10-year gross lease on 1,200 square feet of space that calls for annual rent payments of $20.00 per square foot and free rent for the first 24 months. The owner’s required return is 10%. What is the effective rent per square foot per year? (1,200 sq. ft. x $20/sq.ft. = $24,000 ÷ 12 months = $2,000 rent/month)
N $ 0 (PV) 1 0 2 0 . . . . 24 0 25 2,000 . . . . 120 2,000
The effective rent is $14.27 per square foot per year.
CPM® Exam Prep Tutorial Financial Ops and Asset Analysis
FIN ASM 30
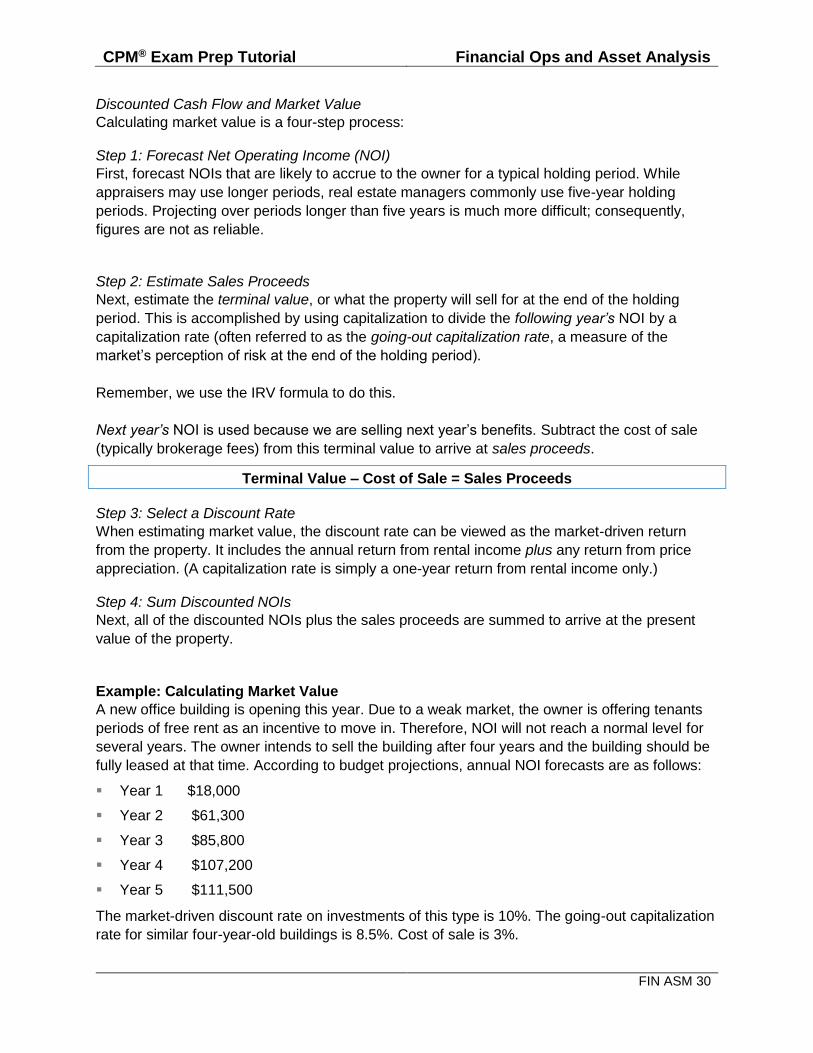
Discounted Cash Flow and Market Value
Calculating market value is a four-step process:
Step 1: Forecast Net Operating Income (NOI)
First, forecast NOIs that are likely to accrue to the owner for a typical holding period. While
appraisers may use longer periods, real estate managers commonly use five-year holding
periods. Projecting over periods longer than five years is much more difficult; consequently,
figures are not as reliable.
Step 2: Estimate Sales Proceeds
Next, estimate the terminal value, or what the property will sell for at the end of the holding
period. This is accomplished by using capitalization to divide the following year’s NOI by a
capitalization rate (often referred to as the going-out capitalization rate, a measure of the
market’s perception of risk at the end of the holding period).
Remember, we use the IRV formula to do this.
Next year’s NOI is used because we are selling next year’s benefits. Subtract the cost of sale
(typically brokerage fees) from this terminal value to arrive at sales proceeds.
Terminal Value – Cost of Sale = Sales Proceeds
Step 3: Select a Discount Rate
When estimating market value, the discount rate can be viewed as the market-driven return
from the property. It includes the annual return from rental income plus any return from price
appreciation. (A capitalization rate is simply a one-year return from rental income only.)
Step 4: Sum Discounted NOIs
Next, all of the discounted NOIs plus the sales proceeds are summed to arrive at the present
value of the property.
Example: Calculating Market Value
A new office building is opening this year. Due to a weak market, the owner is offering tenants
periods of free rent as an incentive to move in. Therefore, NOI will not reach a normal level for
several years. The owner intends to sell the building after four years and the building should be
fully leased at that time. According to budget projections, annual NOI forecasts are as follows:
Year 1 $18,000
Year 2 $61,300
Year 3 $85,800
Year 4 $107,200
Year 5 $111,500
The market-driven discount rate on investments of this type is 10%. The going-out capitalization
rate for similar four-year-old buildings is 8.5%. Cost of sale is 3%.
CPM® Exam Prep Tutorial Financial Ops and Asset Analysis
FIN ASM 31
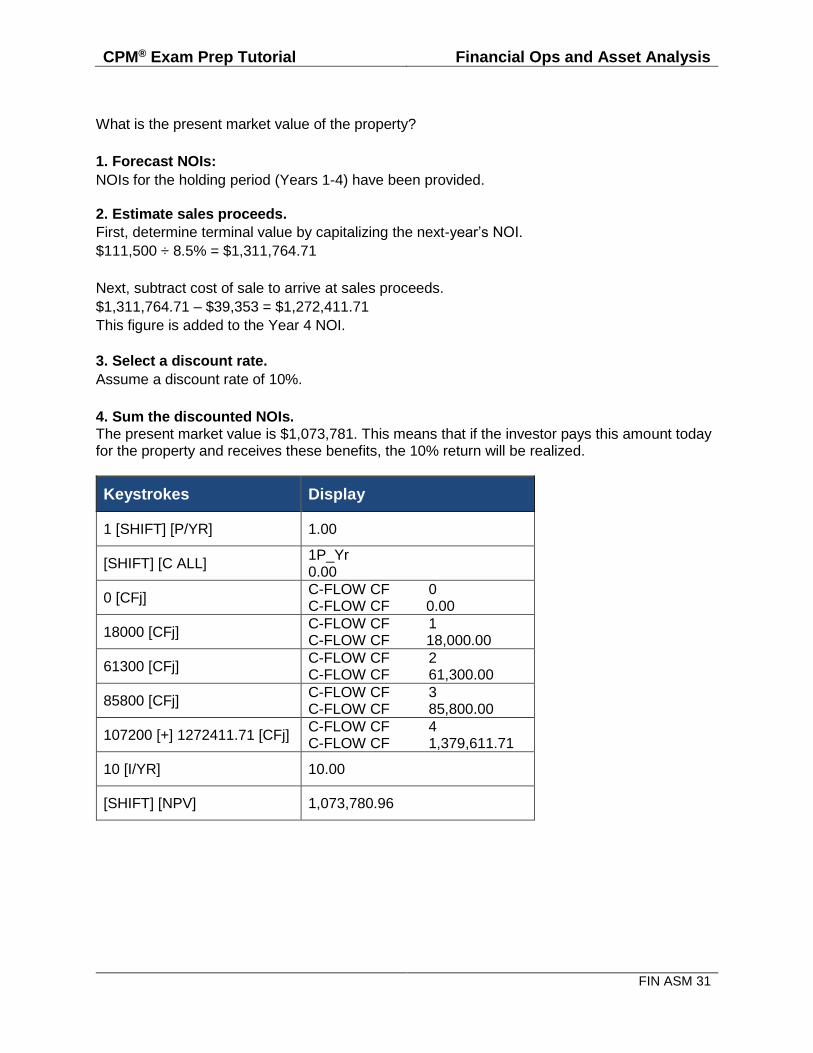
What is the present market value of the property?
1. Forecast NOIs:
NOIs for the holding period (Years 1-4) have been provided. 2. Estimate sales proceeds.
First, determine terminal value by capitalizing the next-year’s NOI.
$111,500 ÷ 8.5% = $1,311,764.71
Next, subtract cost of sale to arrive at sales proceeds.
$1,311,764.71 – $39,353 = $1,272,411.71
This figure is added to the Year 4 NOI.
3. Select a discount rate.
Assume a discount rate of 10%.
4. Sum the discounted NOIs.
The present market value is $1,073,781. This means that if the investor pays this amount today for the property and receives these benefits, the 10% return will be realized.
Keystrokes Display
1 [SHIFT] [P/YR] 1.00
[SHIFT] [C ALL] 1P_Yr 0.00
0 [CFj] C-FLOW CF 0 C-FLOW CF 0.00
18000 [CFj] C-FLOW CF 1 C-FLOW CF 18,000.00
61300 [CFj] C-FLOW CF 2 C-FLOW CF 61,300.00
85800 [CFj] C-FLOW CF 3 C-FLOW CF 85,800.00
107200 [+] 1272411.71 [CFj] C-FLOW CF 4 C-FLOW CF 1,379,611.71
10 [I/YR] 10.00
[SHIFT] [NPV] 1,073,780.96
CPM® Exam Prep Tutorial Financial Ops and Asset Analysis
FIN ASM 32
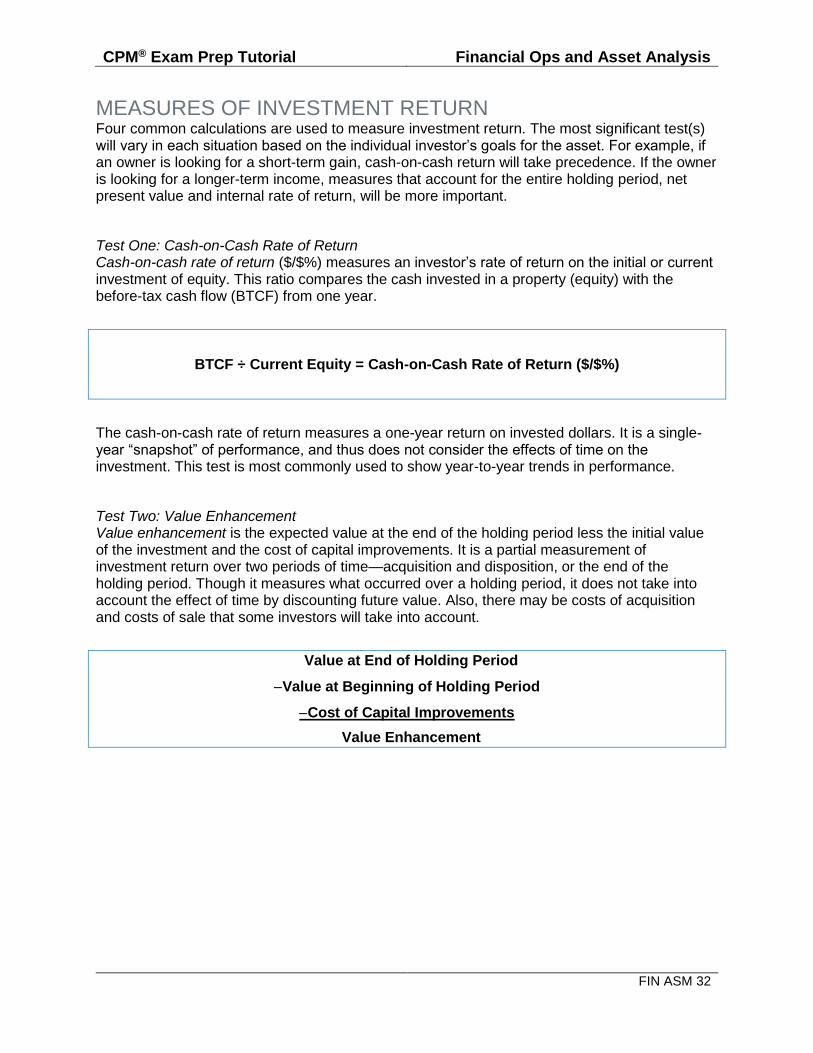
MEASURES OF INVESTMENT RETURN Four common calculations are used to measure investment return. The most significant test(s) will vary in each situation based on the individual investor’s goals for the asset. For example, if an owner is looking for a short-term gain, cash-on-cash return will take precedence. If the owner is looking for a longer-term income, measures that account for the entire holding period, net present value and internal rate of return, will be more important.
Test One: Cash-on-Cash Rate of Return Cash-on-cash rate of return ($/$%) measures an investor’s rate of return on the initial or current investment of equity. This ratio compares the cash invested in a property (equity) with the before-tax cash flow (BTCF) from one year.
BTCF ÷ Current Equity = Cash-on-Cash Rate of Return ($/$%)
The cash-on-cash rate of return measures a one-year return on invested dollars. It is a single-year “snapshot” of performance, and thus does not consider the effects of time on the investment. This test is most commonly used to show year-to-year trends in performance.
Test Two: Value Enhancement Value enhancement is the expected value at the end of the holding period less the initial value of the investment and the cost of capital improvements. It is a partial measurement of investment return over two periods of time—acquisition and disposition, or the end of the holding period. Though it measures what occurred over a holding period, it does not take into account the effect of time by discounting future value. Also, there may be costs of acquisition and costs of sale that some investors will take into account.
Value at End of Holding Period
Value at Beginning of Holding Period
Cost of Capital Improvements
Value Enhancement
CPM® Exam Prep Tutorial Financial Ops and Asset Analysis
FIN ASM 33
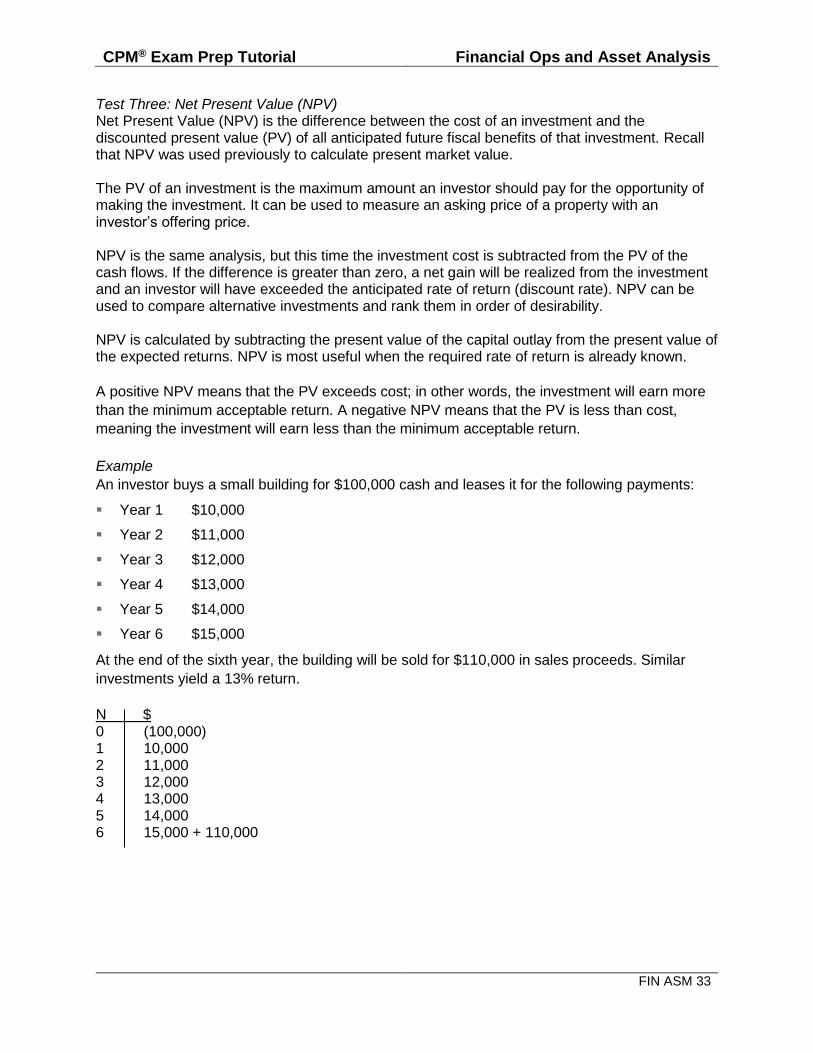
Test Three: Net Present Value (NPV) Net Present Value (NPV) is the difference between the cost of an investment and the discounted present value (PV) of all anticipated future fiscal benefits of that investment. Recall that NPV was used previously to calculate present market value. The PV of an investment is the maximum amount an investor should pay for the opportunity of making the investment. It can be used to measure an asking price of a property with an investor’s offering price. NPV is the same analysis, but this time the investment cost is subtracted from the PV of the cash flows. If the difference is greater than zero, a net gain will be realized from the investment and an investor will have exceeded the anticipated rate of return (discount rate). NPV can be used to compare alternative investments and rank them in order of desirability. NPV is calculated by subtracting the present value of the capital outlay from the present value of the expected returns. NPV is most useful when the required rate of return is already known.
A positive NPV means that the PV exceeds cost; in other words, the investment will earn more
than the minimum acceptable return. A negative NPV means that the PV is less than cost,
meaning the investment will earn less than the minimum acceptable return.
Example
An investor buys a small building for $100,000 cash and leases it for the following payments:
Year 1 $10,000
Year 2 $11,000
Year 3 $12,000
Year 4 $13,000
Year 5 $14,000
Year 6 $15,000
At the end of the sixth year, the building will be sold for $110,000 in sales proceeds. Similar
investments yield a 13% return.
N $ 0 (100,000) 1 10,000 2 11,000 3 12,000 4 13,000 5 14,000 6 15,000 + 110,000

CPM® Exam Prep Tutorial Financial Ops and Asset Analysis
FIN ASM 34
Keystrokes Display
1 [SHIFT] [P/YR] 1.00
[SHIFT] [C ALL] 1P_Yr 0.00
100000 [+/-] [CFj] C-FLOW CF 0 C-FLOW CF -100,000.00
10000 [CFj] C-FLOW CF 1 C-FLOW CF 10,000.00
11000 [CFj] C-FLOW CF 2 C-FLOW CF 11,000.00
12000 [CFj] C-FLOW CF 3 C-FLOW CF 12,000.00
13000 [CFj] C-FLOW CF 4 C-FLOW CF 13,000.00
14000 [CFj] C-FLOW CF 5 C-FLOW CF 14,000.00
15000 [+] 110000 [CFj] C-FLOW CF 6 C-FLOW CF 125,000.00
13 [I/YR] 13.00
[SHIFT] [NPV] 1,392.37
1,392.37
NPV = $1,392.37 This means that the present value of the future cash flows exceeds the cost of the investment and indicates that the owner’s desired rate of return of 13% is also exceeded. To answer the question of how much did the investment exceed the owner’s desired rate of return, we turn to the internal rate of return (IRR) analysis.
CPM® Exam Prep Tutorial Financial Ops and Asset Analysis
FIN ASM 35
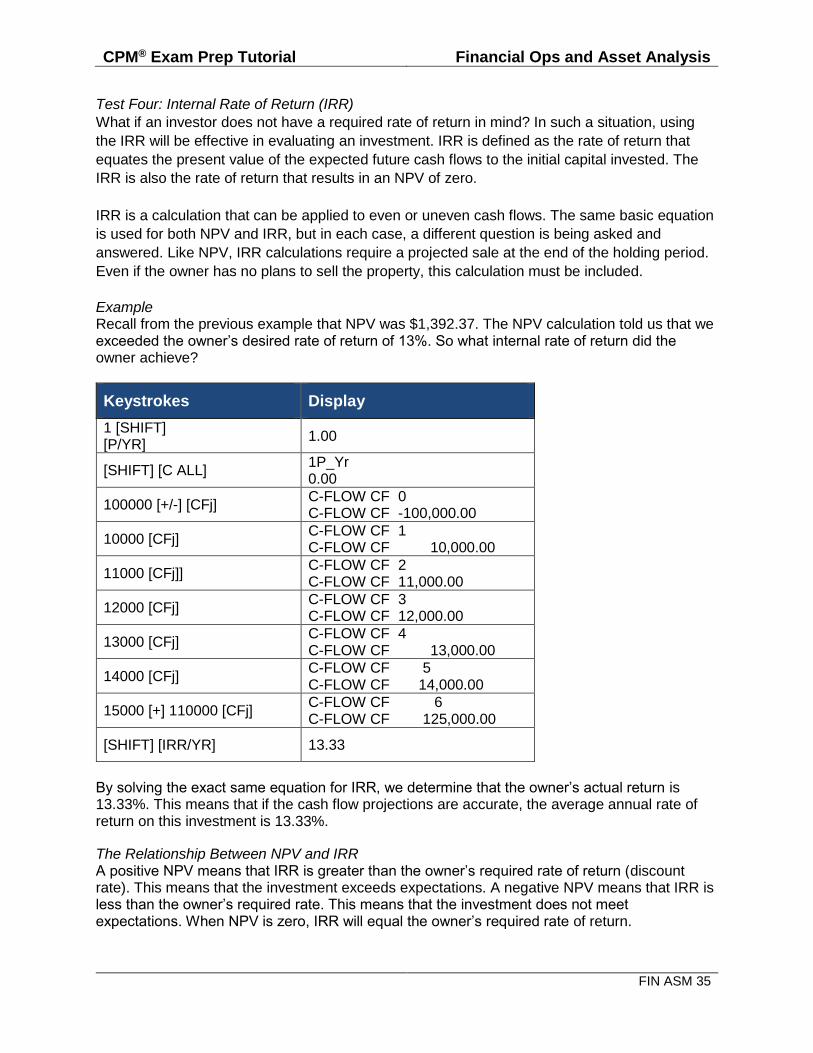
Test Four: Internal Rate of Return (IRR)
What if an investor does not have a required rate of return in mind? In such a situation, using
the IRR will be effective in evaluating an investment. IRR is defined as the rate of return that
equates the present value of the expected future cash flows to the initial capital invested. The
IRR is also the rate of return that results in an NPV of zero.
IRR is a calculation that can be applied to even or uneven cash flows. The same basic equation
is used for both NPV and IRR, but in each case, a different question is being asked and
answered. Like NPV, IRR calculations require a projected sale at the end of the holding period.
Even if the owner has no plans to sell the property, this calculation must be included.
Example Recall from the previous example that NPV was $1,392.37. The NPV calculation told us that we exceeded the owner’s desired rate of return of 13%. So what internal rate of return did the owner achieve?
Keystrokes Display
1 [SHIFT] [P/YR]
1.00
[SHIFT] [C ALL] 1P_Yr 0.00
100000 [+/-] [CFj] C-FLOW CF 0 C-FLOW CF -100,000.00
10000 [CFj] C-FLOW CF 1 C-FLOW CF 10,000.00
11000 [CFj]] C-FLOW CF 2 C-FLOW CF 11,000.00
12000 [CFj] C-FLOW CF 3 C-FLOW CF 12,000.00
13000 [CFj] C-FLOW CF 4 C-FLOW CF 13,000.00
14000 [CFj] C-FLOW CF 5 C-FLOW CF 14,000.00
15000 [+] 110000 [CFj] C-FLOW CF 6 C-FLOW CF 125,000.00
[SHIFT] [IRR/YR] 13.33
By solving the exact same equation for IRR, we determine that the owner’s actual return is 13.33%. This means that if the cash flow projections are accurate, the average annual rate of return on this investment is 13.33%.
The Relationship Between NPV and IRR A positive NPV means that IRR is greater than the owner’s required rate of return (discount rate). This means that the investment exceeds expectations. A negative NPV means that IRR is less than the owner’s required rate. This means that the investment does not meet expectations. When NPV is zero, IRR will equal the owner’s required rate of return.
CPM® Exam Prep Tutorial Financial Ops and Asset Analysis
FIN ASM 36
MID-STREAM ANALYSIS Thus far, our measures of investment return (NPV and IRR) have been calculated from the beginning of the initial investment. In some situations, such as the following, calculating NPV and IRR with a different start date is necessary:
Change in management
Infusion of capital
Refinancing
Testing alternative courses of action
A midstream analysis is performed when an investor wants to examine equity and investment return from a point in time other than the original purchase date. In order to calculate NPV and IRR, the current value of the owner’s equity must first be determined. Midstream analysis allows figures to be revised to determine:
CASH-OUT POTENTIAL: proceeds that would have been received had the property been sold at that time
CURRENT EQUITY: owner’s current equity in the property after capital improvements are made
Midstream analysis is used to determine cash-out potential as follows: Current Market Value
Cost of Sale
Current Loan Balance = Cash-Out Potential If a midstream analysis is conducted due to the infusion of new capital, the equation is continued as follows: Cash-Out Potential + Capital Improvements
New Loans + New Points and Fees = Current Equity