
Review and Meta-Analysis of EVs: Embodied Emissions and ...
29
This is an electronic reprint of the original article. This reprint may differ from the original in pagination and typographic detail. Powered by TCPDF (www.tcpdf.org) This material is protected by copyright and other intellectual property rights, and duplication or sale of all or part of any of the repository collections is not permitted, except that material may be duplicated by you for your research use or educational purposes in electronic or print form. You must obtain permission for any other use. Electronic or print copies may not be offered, whether for sale or otherwise to anyone who is not an authorised user. Dillman, Kevin Joseph; Árnadóttir, Áróra; Heinonen, Jukka; Czepkiewicz, Michał; Davíðsdóttir, Brynhildur Review and meta-analysis of EVs : Embodied emissions and environmental breakeven Published in: Sustainability (Switzerland) DOI: 10.3390/su12229390 Published: 11/11/2020 Document Version Publisher's PDF, also known as Version of record Published under the following license: CC BY Please cite the original version: Dillman, K. J., Árnadóttir, Á., Heinonen, J., Czepkiewicz, M., & Davíðsdóttir, B. (2020). Review and meta- analysis of EVs : Embodied emissions and environmental breakeven. Sustainability (Switzerland), 12(22), [9390]. https://doi.org/10.3390/su12229390
Transcript of Review and Meta-Analysis of EVs: Embodied Emissions and ...

This is an electronic reprint of the original article.This reprint may differ from the original in pagination and typographic detail.
Powered by TCPDF (www.tcpdf.org)
This material is protected by copyright and other intellectual property rights, and duplication or sale of all or part of any of the repository collections is not permitted, except that material may be duplicated by you for your research use or educational purposes in electronic or print form. You must obtain permission for any other use. Electronic or print copies may not be offered, whether for sale or otherwise to anyone who is not an authorised user.
Dillman, Kevin Joseph; Árnadóttir, Áróra; Heinonen, Jukka; Czepkiewicz, Michał; Davíðsdóttir,BrynhildurReview and meta-analysis of EVs : Embodied emissions and environmental breakeven
Published in:Sustainability (Switzerland)
DOI:10.3390/su12229390
Published: 11/11/2020
Document VersionPublisher's PDF, also known as Version of record
Published under the following license:CC BY
Please cite the original version:Dillman, K. J., Árnadóttir, Á., Heinonen, J., Czepkiewicz, M., & Davíðsdóttir, B. (2020). Review and meta-analysis of EVs : Embodied emissions and environmental breakeven. Sustainability (Switzerland), 12(22),[9390]. https://doi.org/10.3390/su12229390

sustainability
Review
Review and Meta-Analysis of EVs: Embodied Emissionsand Environmental Breakeven
Kevin Joseph Dillman 1,* , Áróra Árnadóttir 2, Jukka Heinonen 2,3 , Michał Czepkiewicz 2
and Brynhildur Davíðsdóttir 1
1 Department of Environment and Natural Resources, School of Engineering and Natural Sciences,University of Iceland, 107 Reykjavík, Iceland; [email protected]
2 Department of Civil and Environmental Engineering, School of Engineering and Natural Sciences,University of Iceland, 107 Reykjavík, Iceland; [email protected] (Á.Á.); [email protected] (J.H.);[email protected] (M.C.)
3 Department of Built Environment, Aalto University, 00076 Aalto, Iceland* Correspondence: [email protected]
Received: 23 September 2020; Accepted: 10 November 2020; Published: 11 November 2020 �����������������
Abstract: Electric vehicles (EVs) are often considered a potential solution to mitigate greenhouse gas(GHG) emissions originating from personal transport vehicles, but this has also been questioned dueto their high production emissions. In this study, we performed an extensive literature review ofexisting EV life-cycle assessments (LCAs) and a meta-analysis of the studies in the review, extractinglife-cycle GHG emission data combined with a standardized methodology for estimating GHGelectrical grid intensities across the European Economic Area (EEA), which were used to estimate a setof environmental breakeven points for each EEA country. A Monte Carlo simulation was performedto provide sensitivity analysis. The results of the review suggest a need for greater methodologicaland data transparency within EV LCA research. The meta-analysis found a subset of countriesacross the EEA where there is a potential that EVs could lead to greater life-cycle GHG emissionsthan a comparable diesel counterpart. A policy discussion highlights how EV policies in countrieswith contrasting GHG electric grid intensities may not reflect the current techno-environmentalreality. This paper emphasizes the importance for researchers to accurately depict life-cycle vehicleemissions and the need for EEA countries to enact policies corresponding to their respective contextualconditions to avoid potentially enacting policies that could lead to greater GHG emissions.
Keywords: electric vehicles; meta-analysis; environmental breakeven; e-mobility; life cycle analysis;EV LCA
1. Introduction
The transportation sector plays a significant role in the emission of greenhouse gases (GHGs),accounting for over 20% of energy-related greenhouse gas (GHG) emissions globally [1,2]. With theinclusion of “well-to-tank” (WTT) emissions associated with the production and distribution of thefuels needed to power these vehicles, this share would be even higher [3]. The Fifth IntergovernmentalPanel on Climate Change (IPCC) assessment report estimates that transport emissions could increasefaster than all other energy end-use sectors unless sustained mitigation policies are implemented [2].The European Commission has acknowledged the need to create a framework to transition tolow-emission mobility, as the EU relies on oil products for approximately 94% of its transport energyneeds. The transportation fleet’s electrification is a leading solution under consideration, and electricvehicles (EVs) are a crucial technology within this solution [1].
As policies are being put in place to decrease the GHG emissions associated with the transportationsector, the critical question should be how large the mitigation potential is when all emissions related
Sustainability 2020, 12, 9390; doi:10.3390/su12229390 www.mdpi.com/journal/sustainability

Sustainability 2020, 12, 9390 2 of 28
to the transition to e-mobility are taken into account. This issue becomes prominent due to the highmaterial and energy needed to produce and operate the vehicles and the high variation in the GHGintensities of energy grids worldwide.
Life-cycle assessment (LCA) provides a standardized methodology to answer this question [4].LCA attempts to capture the life cycle and determine the environmental impacts of different processeswithin the product’s life cycle. The life cycle of a vehicle (Figure 1) illustrates the key phases within avehicle’s life cycle, which can broadly be categorized into the vehicle’s production, the vehicle’s usephase, and the end of life (EOL) of the vehicle.
Sustainability 2020, 12, x FOR PEER REVIEW 2 of 32
As policies are being put in place to decrease the GHG emissions associated with the transportation sector, the critical question should be how large the mitigation potential is when all emissions related to the transition to e-mobility are taken into account. This issue becomes prominent due to the high material and energy needed to produce and operate the vehicles and the high variation in the GHG intensities of energy grids worldwide.
Life-cycle assessment (LCA) provides a standardized methodology to answer this question [4]. LCA attempts to capture the life cycle and determine the environmental impacts of different processes within the product’s life cycle. The life cycle of a vehicle (Figure 1) illustrates the key phases within a vehicle’s life cycle, which can broadly be categorized into the vehicle’s production, the vehicle’s use phase, and the end of life (EOL) of the vehicle.
Figure 1. Illustration of a vehicle life cycle (adapted from [5,6]).
Unsurprisingly, LCA has been applied in numerous EV studies, and interest in the topic continues to grow as EV technology and market share develop. However, these studies’ results vary, as is common when surveying a field of LCA studies for differing technologies, leaving the results of such studies and the suggested mitigation potential of EVs uncertain. Efforts can be made to synthesize this field of data for a more conclusive assessment. However, this can prove challenging due to inconsistencies in each study’s scopes and methods [7].
Previous attempts to overcome this challenge in the form of literature reviews on LCAs of EVs have been performed, discussing sources of variability and shortcomings present within the literature [6,8,9]. The review of Hawkins et al. [8] emphasized the lack of data within different life-cycle phases. Nordelöf et al.’s [6] review was critical of the lacking temporal aspect within LCA studies, particularly concerning the rapidly evolving EV market and production processes. Hawkins et al.’s [8] and Nordelöf et al.’s [6] reviews acknowledged that the electricity production process within an LCA had the most significant impact on the variability of the results. As they reviewed studies published in 1997–2010 and 1998–2013, respectively, a need for an updated review and discussion of methods was identified, as this field of research continues to grow.
Marmiroli et al. [9] published a review discussing the conflicting results found in the literature due to methodological differences between studies regarding the electricity mix. Within their research, the GHG intensity of the electricity mix used to power the EV was estimated to be responsible for 70% of the variability within the reviewed studies’ LCA results. The discussion within their research was then geared towards providing future studies with guidelines to improve consistency when accounting for electricity production. This study uses a standardized methodology for calculating emissions from energy production [10]. Combining the results from an up-to-date
Figure 1. Illustration of a vehicle life cycle (adapted from [5,6]).
Unsurprisingly, LCA has been applied in numerous EV studies, and interest in the topic continuesto grow as EV technology and market share develop. However, these studies’ results vary, as is commonwhen surveying a field of LCA studies for differing technologies, leaving the results of such studiesand the suggested mitigation potential of EVs uncertain. Efforts can be made to synthesize this field ofdata for a more conclusive assessment. However, this can prove challenging due to inconsistencies ineach study’s scopes and methods [7].
Previous attempts to overcome this challenge in the form of literature reviews on LCAs ofEVs have been performed, discussing sources of variability and shortcomings present within theliterature [6,8,9]. The review of Hawkins et al. [8] emphasized the lack of data within different life-cyclephases. Nordelöf et al. [6] review was critical of the lacking temporal aspect within LCA studies,particularly concerning the rapidly evolving EV market and production processes. Hawkins et al. [8]and Nordelöf et al. [6] reviews acknowledged that the electricity production process within an LCAhad the most significant impact on the variability of the results. As they reviewed studies published in1997–2010 and 1998–2013, respectively, a need for an updated review and discussion of methods wasidentified, as this field of research continues to grow.
Marmiroli et al. [9] published a review discussing the conflicting results found in the literaturedue to methodological differences between studies regarding the electricity mix. Within their research,the GHG intensity of the electricity mix used to power the EV was estimated to be responsible for 70%of the variability within the reviewed studies’ LCA results. The discussion within their research wasthen geared towards providing future studies with guidelines to improve consistency when accountingfor electricity production. This study uses a standardized methodology for calculating emissions fromenergy production [10]. Combining the results from an up-to-date review of the most recent LCA

Sustainability 2020, 12, 9390 3 of 28
literature, the goal is to perform a meta-analysis of the reviewed literature to estimate the effectivenessof EV integration in terms of GHG emissions across European countries.
The approach taken in this article is similar to that of Ellingsen et al. [11]. They performedan analysis across different vehicle segments using the EU electricity production mix and differentelectricity production technologies (i.e., coal, natural gas, wind). However, the research used relativelyfew sources to model vehicles, and did not provide comparable country-by-country results acrossthe EU [11]. This study aims to bridge the gap left by the previous reviews and studies by providingboth a review of the field of literature with feedback on the differences and variability within themethodologies and scopes of the studies, as well as a meta-analysis using life-cycle GHG data extractedfrom the studies, following Zamagni et al.’s approach [12]. This methodology will be used to answerthe following research questions:
ReserachQuestion1: How do the existing published LCA studies comparing EVs and internalcombustion engine vehicles (ICEVs), i.e., petrol or diesel vehicles, differ? (It is worth noting that allreferences to EVs within this paper refer to battery electric vehicles (BEVs); while plug-in hybridelectric vehicles (PHEVs) and fuel-cell electric vehicles (FCEVs) are an interesting field of study,they were considered outside the scope of this study).
ResearchQuestion2: How do the GHG intensities of the electrical grids across Europe affect EVs’environmental effectiveness?
By answering RQ1, this paper provides an up-to-date literature review, as well as an in-depthanalysis of different EV LCAs, expanding upon the framework put out by Egede et al. [5]. The goal wasto gain a deeper understanding of reasons for variability—for example, in terms of scope, battery size,vehicle weight, lifetime, and electricity source—to identify potential research needs and priorities forfuture LCAs. Additionally, this work allowed the study to consider the variation in individual studies’outcomes to perform a cross-study meta-analysis to answer RQ2. It allowed for a set of statistics forthe life-cycle phases of a vehicle to be collected. A standardized cross-country comparison was madeusing a standardized set of electrical grid GHG intensities across the European Economic Area (EEA)countries. It could not have been done by merely looking at individual specific-country-focused LCAstudies and comparing them. Based on the results, policies regarding life-cycle emissions across EEAcountries with different grid conditions were then discussed.
EVs’ environmental effectiveness across Europe is estimated by calculating the distance ofintersection points (DIP) for the EEA countries using the EV emission estimates from the literaturereview. The DIP represents the estimated number of kilometers that would need to be driven byan EV and the comparison ICEV so that the total life-cycle emissions of each vehicle type would beequal, as performed in previous studies [11,13]. The emission disparity (ED) between the comparedvehicles within each DIP analysis was calculated to estimate the total life-cycle GHG emission impactsof using an EV compared to a petrol or diesel vehicle. The maximum production emissions (MPEs)that an EV can reach before losing environmental viability were additionally estimated. A Monte Carlosimulation was then performed as a sensitivity analysis to determine the probability that an EV wouldlead to less life-cycle GHG emissions with different electricity grid emission intensities according tothe distribution of the data collected within the review.
The results of this study aim to further the discussion surrounding the environmental viability ofEVs across the EEA in terms of GHG emissions from a life-cycle perspective. The policy discussionregards the soundness ofEEA countries’ climate, transportation, and EV policies in the context oflife-cycle emissions, reflecting on whether existing policies are in line with the techno-environmentalreality of vehicle production emissions and electrical grid GHG intensities.
2. Materials and Methods
A mixed-method approach was followed in this study. First, a review of the field of EV LCAstudies and a qualitative meta-analysis of the reviewed studies were performed, with the primary
Sustainability 2020, 12, 9390 4 of 28
methodological aspects mapped and a gap analysis performed to understand where variation existedacross the studies and where improvements were needed. Second, a quantitative meta-analysis wasperformed using the extracted life-cycle GHG emission data extracted from the reviewed studies.To standardize the use phase of the electric vehicles, which were highly dependent on the electricalgrid, were highly unstandardized, and were a large source of variation in previous studies [9],a standardized method for estimating GHG emissions across the EEA was used [10]. It allowed forimproved cross-study data-use applicability and a more policy-relevant output.
2.1. EV LCA Review
The EV LCA review was performed using the Standardized Technique for Assessing and ReportingReviews of Life Cycle Assessment Data (STARR-LCA) checklist developed by Zumsteg et al. [14].The well-established Preferred Reporting Items guided the formulation of this STARR-LCA checklist,or Systematic Reviews and Meta-Analyses (PRISMA) statement [15], from the field of medicine.It was adapted in Zumsteg et al.’s work for the use of LCA reviews. A qualitative LCA reviewapproach suggested by Zamagni et al. [12] was then followed. The research question was defined,the literature review was performed, and the research gaps were finally identified, analyzed,and discussed. These frameworks were used as guides. They provided relevant frameworks forthe specific research question at hand—specifically, a review and meta-analysis across the literaturefield for a specific product.
2.1.1. Selection of Review Material
The review material search process consisted of two steps: (1) a snowball process,meaning searching through the references of the papers known by the authors, their references,and so on, until no new papers were found fulfilling the selection criteria; (2) a database search throughScience Direct, Scopus, Google Scholar, and Web of Science to complement the snowball collection.The primary search terms used were: “LCA of Electric Vehicles” and “Comparative LCA of electricvehicles”, as well as a key term search for “Electric Vehicle” and “Life Cycle Assessment”, leading to acollection of 25 papers.
The 25 studies found using this search were screened to see if they fulfilled the followingselection criteria:
1. Published in the last ten years (the most dated study was 2012).2. Included the production (material extraction and manufacturing) phase and use phase of
the vehicle.3. Included greenhouse gas emissions within the analysis.4. Used empirical data.5. Included a BEV case.6. Included a medium-sized passenger vehicle.
Nineteen studies were found to fulfill the criteria, these forming the final review collection utilizedin the remainder of the paper. A period of ten years was selected as the review period because ofEVs being an emerging technology, and to see if changes could be seen within the last ten years ofsignificant EV market growth. The necessity of including the production and use phase is becausethese phases account for >95% of life-cycle emissions for EVs and ICEVs. Since this study aims todetermine the amount of GHG emissions, all studies selected would need to include a GHG analysis.While plug-in hybrid electric vehicles (PHEVs), hybrid electric vehicles (HEVs), and fuel-cell electricvehicles (FCEVs) are interesting fields of study, PHEVs and HEVs are heavily dependent on theuse case, and FCEVs were considered outside the scope of this study. Thus, only BEV studies wereconsidered and included. The use of medium-sized passenger vehicles reduces the variability thatwould accompany data associated with sports utility vehicles (SUVs), trucks, vans, or other such largervehicles to improve consistency.
Sustainability 2020, 12, 9390 5 of 28
2.1.2. Review Approach
The chosen articles were reviewed for their goals and scopes, processes included within the lifecycle, and determining factors, such as battery capacity and vehicle lifetimes. During this review,process data were extracted from each article to characterize and find trends within the results. The datawere broken down into three categories (Table 1).
Table 1. Data extracted from the articles reviewed.
Methodological Characteristics Contextual/Vehicle Characteristics Results
Included life-cycle processes Electricity mix Battery productionLife-cycle assessment (LCA) type
(process, hybrid, or input–output (IO)) Country of study Vehicle production
Background database Vehicle make/model Total productionOther data sources Powertrain (ICEV, BEV, PHEV) Well-to-Tank
Vehicle weight Tank-to-WheelsFuel efficiency (l/100 km and kWh/100 km) Well-to-Wheels
Battery capacity End of lifeVehicle lifetime Maintenance (including battery replacement)
Vehicle classification (LDV, SUV, etc.) Total life-cycle emissions
2.2. Analysis
After the review and qualitative meta-analysis, the quantitative meta-analysis was performed,in which the goal was to estimate the life-cycle GHG impacts of EVs through quantitative synthesisand statistical analysis of the extracted data following Zumsteg et al. [14] and Zamagni et al.’s [12]suggested approaches.
2.2.1. The Distance of Intersection Point Calculations
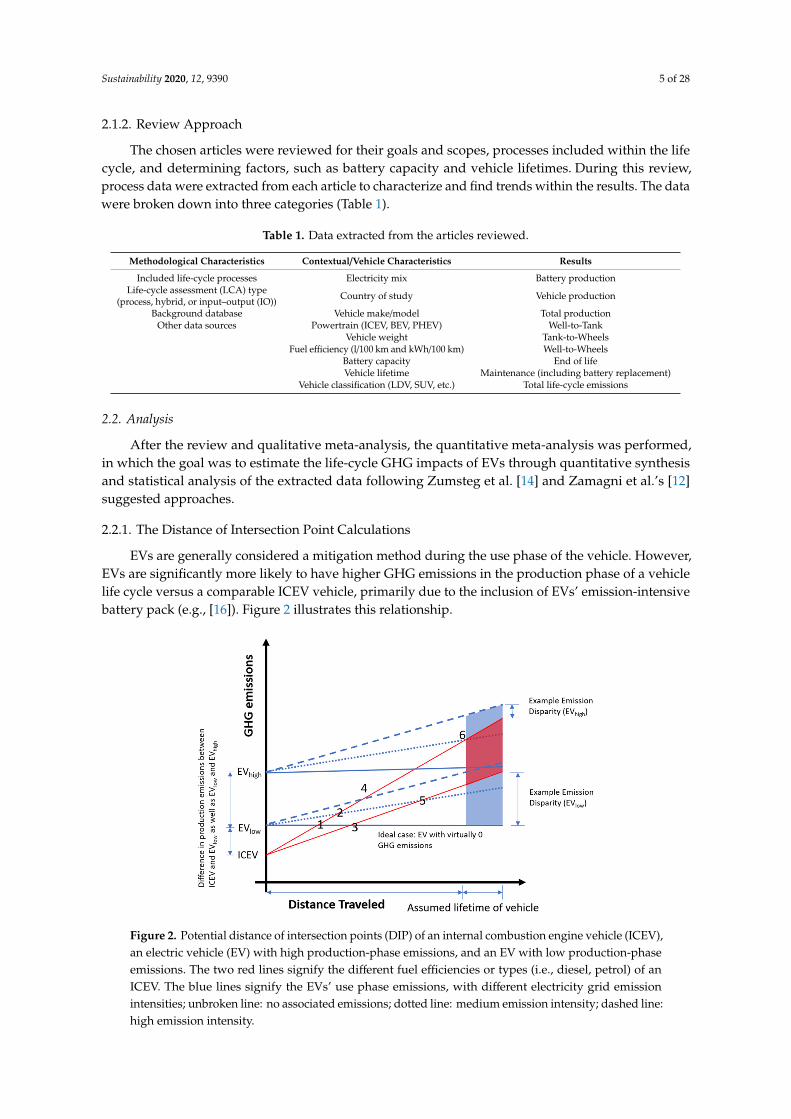
EVs are generally considered a mitigation method during the use phase of the vehicle. However,EVs are significantly more likely to have higher GHG emissions in the production phase of a vehiclelife cycle versus a comparable ICEV vehicle, primarily due to the inclusion of EVs’ emission-intensivebattery pack (e.g., [16]). Figure 2 illustrates this relationship.Sustainability 2020, 12, x FOR PEER REVIEW 6 of 32
Figure 2. Potential distance of intersection points (DIP) of an internal combustion engine vehicle (ICEV), an electric vehicle (EV) with high production-phase emissions, and an EV with low production-phase emissions. The two red lines signify the different fuel efficiencies or types (i.e., diesel, petrol) of an ICEV. The blue lines signify the EVs’ use phase emissions, with different electricity grid emission intensities; unbroken line: no associated emissions; dotted line: medium emission intensity; dashed line: high emission intensity.
Each numbered point within Figure 2 identifies a different DIP (the breakeven point) for an associated vehicle comparison. For example, point 1 identifies a DIP reached after the shortest distance traveled, where an EV with low production emissions powered by a near emission-less source of electricity would reach the same level of life-cycle emissions as a less efficient ICEV. Point 5 identifies a DIP between a more fuel-efficient ICEV and an EV with low production emissions powered by a medium emission-intensive electricity grid. The vertical distance between two points can be considered as the emission disparity at that particular distance of comparison. This framework highlights the value of a breakeven analysis if EVs are considered a GHG mitigation solution and illustrates the high variability in cumulative GHG emissions that can be incurred over the lifetime of an EV compared to an ICEV. It sheds light on how quickly an EV can provide potential GHG emission reductions according to different conditions.
The DIP in kilometers can be calculated using the following formula: 𝐷𝐼𝑃 = 𝑃𝐸 − 𝑃𝐸 ((𝑊𝑇𝑊 + 𝑀 ) − (𝑊𝑇𝑊 + 𝑀 )) (1)
where PEev and PEicev are the production emissions in tons of CO2 equivalents for the EV and ICEV being studied, respectively. The WTWicev/WTWev and Micev/Mev are the Well-to-Wheel (WTW) and maintenance GHG emissions of the studied ICEV or EV in tons of CO2 equivalents per kilometer (typically reported in grams of CO2 equivalents, but units were changed for use in the formula). The WTW emissions of an EV are estimated by multiplying the emission intensity of the electricity supplied with the assumed energy efficiency of the EV being studied.
2.2.2. Emission Disparity
The ED follows similar logic to that of the DIP, except that it represents the difference in life-cycle emissions at a specific distance driven, in this case, to estimate the life-cycle emissions from the production and use phases at the end of the studied vehicles’ lifetimes. The emission disparity can be calculated using the following formula:
Figure 2. Potential distance of intersection points (DIP) of an internal combustion engine vehicle (ICEV),an electric vehicle (EV) with high production-phase emissions, and an EV with low production-phaseemissions. The two red lines signify the different fuel efficiencies or types (i.e., diesel, petrol) of anICEV. The blue lines signify the EVs’ use phase emissions, with different electricity grid emissionintensities; unbroken line: no associated emissions; dotted line: medium emission intensity; dashed line:high emission intensity.

Sustainability 2020, 12, 9390 6 of 28
Each numbered point within Figure 2 identifies a different DIP (the breakeven point) for anassociated vehicle comparison. For example, point 1 identifies a DIP reached after the shortest distancetraveled, where an EV with low production emissions powered by a near emission-less source ofelectricity would reach the same level of life-cycle emissions as a less efficient ICEV. Point 5 identifiesa DIP between a more fuel-efficient ICEV and an EV with low production emissions powered by amedium emission-intensive electricity grid. The vertical distance between two points can be consideredas the emission disparity at that particular distance of comparison. This framework highlights thevalue of a breakeven analysis if EVs are considered a GHG mitigation solution and illustrates the highvariability in cumulative GHG emissions that can be incurred over the lifetime of an EV compared to anICEV. It sheds light on how quickly an EV can provide potential GHG emission reductions accordingto different conditions.
The DIP in kilometers can be calculated using the following formula:
DIP =PEev − PEicev
((WTWicev + Micev) − (WTWev + Mev))(1)
where PEev and PEicev are the production emissions in tons of CO2 equivalents for the EV and ICEVbeing studied, respectively. The WTWicev/WTWev and Micev/Mev are the Well-to-Wheel (WTW) andmaintenance GHG emissions of the studied ICEV or EV in tons of CO2 equivalents per kilometer(typically reported in grams of CO2 equivalents, but units were changed for use in the formula).The WTW emissions of an EV are estimated by multiplying the emission intensity of the electricitysupplied with the assumed energy efficiency of the EV being studied.
2.2.2. Emission Disparity
The ED follows similar logic to that of the DIP, except that it represents the difference in life-cycleemissions at a specific distance driven, in this case, to estimate the life-cycle emissions from theproduction and use phases at the end of the studied vehicles’ lifetimes. The emission disparity can becalculated using the following formula:
ED = (PEicev + (WTWicev + Micev) ∗ LT + EOLicev) − (PEev + (WTWev + Mev) ∗ LT + EOLev) (2)
Most inputs are similar to those of Formula (1), with the addition of LT, the estimated lifetime ofthe vehicle measured in kilometers, and EOLicev and EOLev, representing the EOL emissions associatedwith each vehicle’s recycling/disposal process type.
2.2.3. Maximum Production Emissions
The MPE measurement estimates the lowest level of production emissions of an electric vehiclenecessary for an EV to be considered a mitigation solution over the EV’s comparative life cycle and thecompared ICEV. The MPEs, measured in tCO2eq, can be calculated as follows:
MPE = (PEicev + (WTWicev + Micev) ∗ LT + EOLicev) − ((WTWev + Mev) ∗ LT + EOLev) (3)
where all inputs have been described after the previous formulas.
2.2.4. Monte Carlo Simulation
A Monte Carlo simulation was then performed using the range of meta-data extracted for eachlife-cycle phase found within the review. The total life-cycle emissions for each vehicle type wereestimated within each simulation, repeated 100,000 times, and mapped across a range of electrical gridemission intensities, estimating the probability that an EV would lead to fewer GHG emissions thanthe compared ICEV counterpart.

Sustainability 2020, 12, 9390 7 of 28
2.2.5. GHG Emission Intensity of Electricity Supply
The GHG emission intensity for each European country was sourced from Moro and Lonza [10],who provide a unified methodology that includes electricity trading between states. Additionally,we included GHG emission intensities of energy supplied in two EEA countries, Iceland and Norway,as they provide interesting cases with low-intensity electricity grids and strong push-policies for EVintegration. For Norway, the calculation method and data presented by Moro and Lonza [10] wereused, supplemented with simplified data on trade structure in 2018 (40% with Sweden, 24% withDenmark, and 36% with the Netherlands). The resulting GHG intensity supplied is 29 gCO2eq/kWh.For Iceland, the emission intensity of electricity used was assumed to be 20.7 gCO2eq/kWh, as given inGaBi’s global LCA database. These estimates were used for the WTT emissions and combined with theestimated energy efficiency of an EV to calculate the WTW emissions.
3. Review
3.1. Overview of the Reviewed Studies
Table 2 includes the information extracted from the 19 studies reviewed. The publication dates ofthe studies spanned from 2012–2019. The 19 studies compared 24 EVs against 24 ICEVs. There were40 EV cases from the 24 vehicles studied, with each case being defined by a specific EV paired with aspecific grid condition. There were a total of 71 cases when summing EV and ICEV cases. As illustratedin Table 1, the included phases of the vehicle’s life cycle varied between studies. The lifetime of thevehicles studied, measured in kilometers, was included to illustrate the different lifetime assumptionsmade within each study. This assumption then impacts the resulting emissions per functional unit(gCO2eq/km), presented in Table A1 of Appendix A. Additionally, each study was identified as being aprocess, input–output, or hybrid LCA to determine if the utilized LCA method could lead to additionalvariability in results, which is elaborated upon in the discussion section.
Three primary categories of causes of variation between each study’s results were identified:(1) differences in methodologies, goals, and scopes, (2) contextual variability and assumptions, and(3) differences in levels of granularity and access to data. These categories are explored further in thefollowing subsections.
3.2. Methodologies, Goals, and Scopes
While all papers within the review presented an LCA on EV passenger vehicles, distinctmethodologies, scopes, and goals existed among them. The lack of clear goals has been documentedin previous reviews [6,9], and was again identified in this review, along with differences in includedlife-cycle phases and details within them despite the framework provided by Egede et al. [5]. There wasno evident improvement in terms of clear goals, scopes, or inclusion of life-cycle phases over time sincethese publications. One of the most significant inconsistencies was related to life-cycle phase/componentinclusion, particularly EOL and battery replacement. It could be due to a lack of available data onrecycling technologies, as EVs have only recently entered the mass market, and these new entrantshave yet to reach their end of life. As part of the selection criteria, all papers were required to includethe production- and use-phase life-cycle processes. Still, the inclusion of other life-cycle phases(and components in the case of battery replacement) varied. The following subsections further describethe critical methodological, goal, and scope differences between the studies.
3.2.1. Inclusion of Battery Replacement
The inclusion of battery replacement serves as a good example of the methodological differencesbetween studies. There were essentially six approaches taken towards the inclusion of batteryreplacement within the LCA studies reviewed, which are presented in Table 3.

Sustainability 2020, 12, 9390 8 of 28
Table 2. The data on studies captured in the review with the included factors listed by year of publication.
Study & Year LCA Method Materials Manuf-Acturing Shipping Use Phase Mainte-Nance Battery Replacement EOL Lifetime (km)
Gao et al. (2012) [17] Process x x x x x x 256,000Ma et al. (2012) [18] Process x x x x x x 180,000
Szczechowicz et al. (2012) [19] Process x x x x x 150,000Bartolozzi et al. (2013) [20] Process x x x x x x LT not disclosedHawkins et al. (2013) [16] Process x x x x x x 150,000Sharma et al. (2013) [21] Process x x x x 150,000
Chatzikomis et al. (2014) [22] Process x x x 150,000Messagie et al. (2014) [23] Process x x x x x x 230,500
Bauer et al. (2015) [24] Process x x x x x x Vehicle: 240,000Battery: 150,000
Girardi et al. (2015) [25] Process x x x x x 150,000Onat et al. (2015) [26] Hybrid x x x x 240,000
Tagliaferri at al. (2016) [27] Process x x x x 150,000Burchart-Korol et al. (2018) [28] Process x x x x x x 150,000
Gawron et al. (2018) [29] Process x x x x 257,495Wu et al. (2018) [30] Process x x x x 150,000
Bekel et al. (2019) [31] Process x x x x x 150,000Kawamoto et al. (2019) [13] Process x x x x x x 200,000
Li et al. (2019) [32] Hybrid x x x x x 260,000Xiong et al. (2019) [33] Process x x x x x x 160,000; 120,000
Table 3. Approaches to battery replacement.
Approach Number of Studies Studies
Not discussed and not included 6 [20–22,29,31,32]Out of scope—identified as a limitation 1 [18]
Battery life considered longer than or equal to vehicle life 7 [16,19,25–28,30,33]Battery replacement included with unclear methodology 2 [17,24]
Included with clear methodology—Ratio of battery lifetime versus EV lifetime 1 [23]Included with clear methodology—one-time battery replacement 1 [13]

Sustainability 2020, 12, 9390 9 of 28
3.2.2. Inclusion of End of Life
The inclusion of EOL was one of the methodological differences with the highest variation withinthe review. There were five primary approaches taken towards EOL within the LCA studies reviewed,which are presented in Table 4.
Table 4. Approaches taken to end of life (EOL).
Approach Additional Comments Number of Studies Studies
Not discussed andnot Included 1 [22]
Out of scope—identifiedas a limitation
Limitations often mention lack of precedence dueto mass-market EVs not having reached EOL orciting relative impact being less than 2% of totallife-cycle emissions in studies that have includedEOL.
3 [21,26,30]
Included with anunclear methodology
Aggregated EOL emissions into other processes,making the environmental impact associated withEOL unclear. Because EOL often includes recyclingmaterials, uncertainty increases because recyclingcan lead to positive or negative GHG emissionsdepending on methodology.
4 [17,24,28,31]
Included with clearmethodology—positiveenvironmental impact
Positive environmental impact in terms of reducingGHG emissions due to material recycling. 2 [23,27]
Included with clearmethodology—negativeenvironmental impact
a. Direct calculations of EOL emissionsb. Partial inclusion of EOL, often only taking
energy use within recycling/disposal processinto account
c. Scaling factor of production emissions dueto uncertainty in EOL processing
9
a. [16,19,20,25,29,32]b. [13,33]c. [18]
3.2.3. Inclusion of Maintenance and Differing Sub-Process Inclusion within the Maintenance Phase
The inclusion of maintenance had variability in including the life-cycle phase itself andsub-processes within the maintenance life-cycle phase. There were four primary approaches takentowards the inclusion of maintenance within the LCA studies reviewed, which are presented in Table 5.
Table 5. Approaches taken to maintenance.
Approach Additional Comments Number of Studies Studies
Not discussed andnot included 3 [22,27,29]
Out of scope—identifiedas limitation 1 [19]
Included with anunclear methodology
a. Maintenance stated as included, but unclearwhat was included within maintenance(i.e., part replacement, oils, road, etc.)
b. Uncertainty within the maintenance phasefurther heightened when batteryreplacement is mentioned as part of themaintenance phase, but not aggregatedin results
7a. [17,20,24–26,32]b. [28]
Included with clearmethodology
c. Clearly defined methodologies, specific partsor processes identified
d. Maintenance of roads included within themaintenance of the vehicle
e. Scaling factor of production emissions
8
c. [16,21,30,31,33]d. [24]e. [18]
3.2.4. LCA Methods
Of the reviewed studies, 90% performed process LCAs, and the remaining two studies [26,32]performed hybrid LCAs. None solely performed an input–output (IO) LCA. Process LCAs most

Sustainability 2020, 12, 9390 10 of 28
typically would develop the Life Cycle Inventories (LCIs) upstream until all vehicle parts werebroken down to the comprising materials. At that point, most of the studies would then connectthese materials to background databases. The hybrid LCAs performed a similar analysis, except thematerial breakdowns were then applied to an IO database, combining the benefits of a process LCAand an IO LCA [34,35], assisting in the elimination of the truncation error inherent in process LCAs.Examples from other sectors show that IO LCAs typically produce higher emission estimates becauseof eliminating this truncation error and the inclusion of capital goods and overheads [36,37].
3.2.5. Databases Used for Background Data
As mentioned, process LCAs most typically connect material and energy inputs to a backgroundLCA database to populate the inputs and outputs required for the associated processes. Table 6 showswhich databases were utilized within each study. It is worth noting that many studies used a combinationof the databases mentioned and primary data across their respective analyses. Therefore, the role ofthe database within the analysis cannot precisely be determined without detailed supplementary data.
Table 6. Databases/data sources used within each study.
Database/Data Source Number of Studies Studies
Ecoinvent 7 [19,20,24,25,27,28,31]GREET 5 [16,17,21,26,29]
Collection of published data and/or country-specific databases, Other 6 [13,18,22,23,30,32]GaBi 1 [33]
The selection of a database can lead to variability due to differing database methodologies.This was recently highlighted in a study that found that emissions associated with battery productiondiffered significantly depending on whether the material inputs were connected to GREET, Ecoinvent,or thinkstep GaBi databases [38]. Variability caused by using different background databases has beenseen in other sectors, such as the construction sector [39].
3.2.6. Drive Cycle Selection
The drive cycle used within each study can impact the environmental performance of the vehiclesbeing analyzed, as it defines the fuel/energy efficiency of the vehicles being studied, which, in turn,impacts the emissions associated with a vehicle’s use phase. Around 50% of the reviewed studieseither simply defined the efficiency and/or did not mention any form of drive cycle under which theseefficiencies were tested [13,16,19,21,25,27–32]. Around 30% used the New European Driving Cycle(NEDC) [16,18,19,23,25,27].
The remaining studies made use of other drive cycles, such as the Worldwide harmonized Lightvehicles Test Procedure (WLTP), Australian Urban Drive Cycle (AUDC), and Urban DynamometerDriving Schedule (UDDS) [18,21,24].
3.3. Contextual Variability and Assumptions
The second category of variability factors relates to the context of the study. It primarily concernsthe vehicle’s attributes under study and the life-cycle emissions associated with the power source,particularly in terms of GHG emission intensity of the assumed electricity source. The followingsubsections discuss each of the contextual factors that can impact the results of a vehicle LCA. It isworth noting that there may be a varying number of cases within each analysis within the followingsubsections due to missing data points in the studies reviewed, which in itself is one of the identifiedsources of result variability.
3.3.1. Electricity Source
The assumed electricity supply within the study played a significant role in determining theWTW emissions, which affected the results. Studies that performed their analyses on regions with high

Sustainability 2020, 12, 9390 11 of 28
coal use levels within their electricity grid, such as China, had significantly higher WTW emissionsthan others that assumed entirely wind or hydroelectric power sources. Figure 3 shows the WTWresults of different cases, highlighting this disparity. Marmiroli et al. [9] covered this topic in greatdetail. Thus, this paper acknowledges the variance in methodologies, selected grids, and technologiesand its importance, but will not discuss this in more detail for brevity.Sustainability 2020, 12, x FOR PEER REVIEW 13 of 32
Figure 3. WTW emissions (gCO2/km) by case.
3.3.2. Production Location and Carbon Intensity of the Electrical Grid at the Production Facility
When discussing location within the focus of contextual variability, most often and rightly so, the attention is drawn to the location of the use phase of the EV and emission intensity of the electricity grid powering it. However, the emission intensity of the electricity grid also plays a role in manufacturing. The International Council of Clean Transportation estimated that the electricity source used to manufacture EV battery packs is responsible for approximately half of the emissions associated with battery production [40]. Therefore, the battery production facility location (and the vehicle body, if the manufacturing locations of these two components differ) and the emissions associated with electric power play a significant role in the production process’s final life-cycle GHG results. This geographical importance in the production stage (or, at least, the electricity source’s carbon intensity, which often comes in hand) can be attributed to all phases of a vehicle’s production process. A recent study found that 37 materials found in automobile manufacturing have significant variance in the production’s electrical grid emission intensity [41]. It further highlighted the potential for variance across studies according to the time of production and assumed material and energy requirements.
3.3.3. Battery Capacity
Battery capacity can play a role in determining the life-cycle emissions of an electric vehicle. Of the 17 articles that stated a battery capacity, 21 cases of EVs and total production emissions are graphed in Figure 4 to highlight the correlation between battery capacity and estimated production emissions across the studies. As a vehicle’s battery capacity increases, the associated vehicle’s production emissions can be expected to rise, although with high variance due to the role of varying grid GHG intensity in the global battery supply chain. The average battery capacity from all EVs studied within this review was 30.5 kWh.
050100150200250300350400450500
0 5 10 15 20 25 30 35 40 45 50 55 60 65 70WTW Emission
s (gCO2eq/km
)
Cases
WTW Emissions by Vehicle Type
Petrol Diesel BEVFigure 3. WTW emissions (gCO2/km) by case.
3.3.2. Production Location and Carbon Intensity of the Electrical Grid at the Production Facility
When discussing location within the focus of contextual variability, most often and rightlyso, the attention is drawn to the location of the use phase of the EV and emission intensity of theelectricity grid powering it. However, the emission intensity of the electricity grid also plays a role inmanufacturing. The International Council of Clean Transportation estimated that the electricity sourceused to manufacture EV battery packs is responsible for approximately half of the emissions associatedwith battery production [40]. Therefore, the battery production facility location (and the vehicle body, ifthe manufacturing locations of these two components differ) and the emissions associated with electricpower play a significant role in the production process’s final life-cycle GHG results. This geographicalimportance in the production stage (or, at least, the electricity source’s carbon intensity, which oftencomes in hand) can be attributed to all phases of a vehicle’s production process. A recent study foundthat 37 materials found in automobile manufacturing have significant variance in the production’selectrical grid emission intensity [41]. It further highlighted the potential for variance across studiesaccording to the time of production and assumed material and energy requirements.
3.3.3. Battery Capacity
Battery capacity can play a role in determining the life-cycle emissions of an electric vehicle. Of the17 articles that stated a battery capacity, 21 cases of EVs and total production emissions are graphed inFigure 4 to highlight the correlation between battery capacity and estimated production emissionsacross the studies. As a vehicle’s battery capacity increases, the associated vehicle’s productionemissions can be expected to rise, although with high variance due to the role of varying grid GHGintensity in the global battery supply chain. The average battery capacity from all EVs studied withinthis review was 30.5 kWh.

Sustainability 2020, 12, 9390 12 of 28Sustainability 2020, 12, x FOR PEER REVIEW 14 of 32
Figure 4. Battery capacity (kWh) and associated vehicle production emissions (tCO2eq).
3.3.4. Vehicle Lifetime
A vehicle’s lifetime plays a role in determining the duration of the use phase. It acts as a divisor when calculating the life-cycle emissions per kilometer, with the most commonly used functional unit being grams of CO2 per kilometer driven—the greater the lifetime, the lower the per-kilometer emissions for the production and EOL phases. Of the 19 studies reviewed, the lowest assumed lifetime was 120,000 km and the highest assumed lifetime was 260,000 km. The average lifetime between all cases was approximately 184,000 km. There was no distinct trend of assumed lifetimes, as they depended on specific locations. However, some US studies assumed a lifetime in miles in the same quantity that other studies assumed in kilometers, leading to a significantly longer lifetime when converting units—an issue indicating the relatively arbitrary nature of the lifetime assumption.
3.3.5. Energy Efficiency
Energy efficiency defines the amount of electricity required to drive a vehicle an X number of kilometers. Several units were reported within the studies reviewed, but the most standardized unit was kWh/100 km. The average fuel efficiency was calculated to be 16.7 kWh/100 km.
3.3.6. Vehicle Weight
Vehicle weight is a factor worth considering when estimating the life-cycle emissions from vehicle production, as higher material requirements can typically be associated with higher emissions. All cases in which vehicle weight were specified are graphed in Figure 5 along with the production emissions. According to the reviewed studies’ data, a trend with a high level of variability exists; production emissions increase as vehicle weights increase.
024681012141618
010203040506070
1 2 3 4 5 6 7 8 9 10 11 12 13 14 15 16 17 18 19 20 21
CO2eq
Battery Capaci
ty (kWh)
Battery Capacity and Associated Vehicle Production Emissions
Battery Capacity (kWh) Production total (tCO2eq.)Linear (Production total (tCO2eq.))Figure 4. Battery capacity (kWh) and associated vehicle production emissions (tCO2eq).
3.3.4. Vehicle Lifetime
A vehicle’s lifetime plays a role in determining the duration of the use phase. It acts as a divisorwhen calculating the life-cycle emissions per kilometer, with the most commonly used functionalunit being grams of CO2 per kilometer driven—the greater the lifetime, the lower the per-kilometeremissions for the production and EOL phases. Of the 19 studies reviewed, the lowest assumed lifetimewas 120,000 km and the highest assumed lifetime was 260,000 km. The average lifetime betweenall cases was approximately 184,000 km. There was no distinct trend of assumed lifetimes, as theydepended on specific locations. However, some US studies assumed a lifetime in miles in the samequantity that other studies assumed in kilometers, leading to a significantly longer lifetime whenconverting units—an issue indicating the relatively arbitrary nature of the lifetime assumption.
3.3.5. Energy Efficiency
Energy efficiency defines the amount of electricity required to drive a vehicle an X number ofkilometers. Several units were reported within the studies reviewed, but the most standardized unitwas kWh/100 km. The average fuel efficiency was calculated to be 16.7 kWh/100 km.
3.3.6. Vehicle Weight
Vehicle weight is a factor worth considering when estimating the life-cycle emissions fromvehicle production, as higher material requirements can typically be associated with higher emissions.All cases in which vehicle weight were specified are graphed in Figure 5 along with the productionemissions. According to the reviewed studies’ data, a trend with a high level of variability exists;production emissions increase as vehicle weights increase.
3.4. Granularity and Access to Data
The third category of variability factors identified was related to the granularity and access todata within the studies. While some granularity issues can be attributed to differences in the goal andscope defined within each study, the severity of the differences justifies this separation of categories.The lack of LCIs and background data in the research makes cross-study comparisons difficult, a factnoted in Hawkins et al. [8] EV LCA review. Hawkins et al. [16], therefore, published a vehicle LCA

Sustainability 2020, 12, 9390 13 of 28
with supporting data with a breakdown of specific car components and further detail into eachcomponent [16]. While this provided a robust and thorough LCI and data source, unfortunately, it didnot set the trend, and lack of data transparency and access to data have been a persistent issue in EVLCAs. Key examples in which granularity and access to data led to increased uncertainty are describedin the following subsections.Sustainability 2020, 12, x FOR PEER REVIEW 15 of 32
Figure 5. Vehicle weight (kg) and associated vehicle production emissions (tCO2eq).
3.4. Granularity and Access to Data
The third category of variability factors identified was related to the granularity and access to data within the studies. While some granularity issues can be attributed to differences in the goal and scope defined within each study, the severity of the differences justifies this separation of categories. The lack of LCIs and background data in the research makes cross-study comparisons difficult, a fact noted in Hawkins et al.’s [8] EV LCA review. Hawkins et al. [16], therefore, published a vehicle LCA with supporting data with a breakdown of specific car components and further detail into each component [16]. While this provided a robust and thorough LCI and data source, unfortunately, it did not set the trend, and lack of data transparency and access to data have been a persistent issue in EV LCAs. Key examples in which granularity and access to data led to increased uncertainty are described in the following subsections.
3.4.1. Aggregated Emissions
Aggregation of emissions with a lack of transparency in how the emissions were estimated was widespread among the reviewed studies. It was one of the most significant causes of uncertainty when reviewing the results of each study. It follows from the previous subsection, where even if battery replacement was stated as being included, aggregating battery replacement into production or maintenance emissions—as in [17,24]—makes the impacts associated with the inclusion of battery production unclear. This issue of stating the inclusion of a particular process but not disaggregating the results was highly prevalent for the EOL phase [17,24,28,31] and the maintenance phase [17,24,25].
3.4.2. Battery Pack Production Emissions
The aggregation or non-stated emissions associated with battery pack production are a particularly important subset of the previous subsection on the issue of aggregated results, meriting their discussion. The inherent issue with the lack of transparency and access to data within the production phase, particularly concerning battery packs, is illustrated in Figure 6. This figure displays the production emissions by vehicle type (in tCO2eq) collected from the reviewed studies, where it is evident that emissions from ICEV vehicles have low variability compared to BEVs. Figure 6 shows BEVs’ production emissions, with battery production disaggregated from all other components when data were available. The lack of inclusion of the battery pack component, which can play a significant role in the total production emissions of an EV, highlights how a lack of
- 2 4 6 8 10 12 14 16 18
05001,0001,5002,0002,500
1 2 3 4 5 6 7 8 9 10 11 12 13 14 15 16 17 18 19 20 GHG Emissions
(tCO2eq)
Vehicle weigh
t (kg)
Cases
Vehicle Weight and Associated Vehicle Production Emissions
Vehicle weight (kg) Production total (tCO2eq.)Linear (Production total (tCO2eq.))Figure 5. Vehicle weight (kg) and associated vehicle production emissions (tCO2eq).
3.4.1. Aggregated Emissions
Aggregation of emissions with a lack of transparency in how the emissions were estimated waswidespread among the reviewed studies. It was one of the most significant causes of uncertaintywhen reviewing the results of each study. It follows from the previous subsection, where even ifbattery replacement was stated as being included, aggregating battery replacement into productionor maintenance emissions—as in [17,24]—makes the impacts associated with the inclusion of batteryproduction unclear. This issue of stating the inclusion of a particular process but not disaggregatingthe results was highly prevalent for the EOL phase [17,24,28,31] and the maintenance phase [17,24,25].
3.4.2. Battery Pack Production Emissions
The aggregation or non-stated emissions associated with battery pack production are a particularlyimportant subset of the previous subsection on the issue of aggregated results, meriting their discussion.The inherent issue with the lack of transparency and access to data within the production phase,particularly concerning battery packs, is illustrated in Figure 6. This figure displays the productionemissions by vehicle type (in tCO2eq) collected from the reviewed studies, where it is evident thatemissions from ICEV vehicles have low variability compared to BEVs. Figure 6 shows BEVs’ productionemissions, with battery production disaggregated from all other components when data were available.The lack of inclusion of the battery pack component, which can play a significant role in the totalproduction emissions of an EV, highlights how a lack of transparency within the data can lead touncertain results when attempting to analyze the research field.
3.4.3. Lack of Supplementary Data
The aggregation issue could potentially be solved with supplementary data with specific LCIand disaggregated result data. However, only three studies provided detailed enough data for ameaningful result analysis [16,24,31]. Some studies included supplementary data such as Life cycle

Sustainability 2020, 12, 9390 14 of 28
impact assessment (LCIAs), but the data did not provide a meaningful by-component breakdown toallow for high comparability [18,26,27,29]. All other studies (63% of studies reviewed) did not providesupplementary data.
Sustainability 2020, 12, x FOR PEER REVIEW 16 of 32
transparency within the data can lead to uncertain results when attempting to analyze the research field.
Figure 6. Production emissions (tCO2eq) by vehicle type, with BEV battery production emissions disaggregated when possible.
3.4.3. Lack of Supplementary Data
The aggregation issue could potentially be solved with supplementary data with specific LCI and disaggregated result data. However, only three studies provided detailed enough data for a meaningful result analysis [16,24,31]. Some studies included supplementary data such as Life cycle impact assessment (LCIAs), but the data did not provide a meaningful by-component breakdown to allow for high comparability [18,26,27,29]. All other studies (63% of studies reviewed) did not provide supplementary data.
3.4.4. Missing or Excluded Key Data Points
Some articles contained missing or excluded key data points, which made cross-study comparisons difficult. For example, two studies did not include the energy efficiency of the vehicles being studied [24,26], which plays a crucial role in the use phase in a vehicle’s LCA. Other studies did not include the battery pack capacity [23,30] or vehicle weight [20,22,24], which can both indicate potential sources of variation in production emissions.
4. Operationalization of Extracted Meta-Data
The life-cycle-phase GHG emissions were extracted from each study for EVs and petrol and diesel vehicles to complete the quantitative meta-analysis used to answer RQ2. The DIP, ED, and MPE calculations were then performed as described in the methodology (Sections 2.2.1 and 2.2.2.), and a Monte Carlo analysis was performed as a sensitivity analysis (Section 2.2.3).
4.1. Aggregation of Results from All Studies
Table 7 shows the mean, standard deviation (SD), and sample size n cases for the vehicle types studied within the collected research. Table A1 is included as an appendix with all case data used for the calculations in Table 7. The changing sample size per life-cycle phase is due to the lack of data inclusion and transparency discussed in the previous sections. On average, BEVs had higher GHG emissions within the production-phase emissions. The standard deviation within the production
024681012141618
0 2 4 6 8 10 12 14 16 18 20 22 24 26 28 30 32 34 36 38 40 42 44 46
CO2eq
Cases
Production Emissions (tCO2eq) by Vehicle Type with BEV Battery Production Emissions Disaggregated
Petrol Diesel BEV - Battery Production BEV - Vehicle ProductionFigure 6. Production emissions (tCO2eq) by vehicle type, with BEV battery production emissionsdisaggregated when possible.
3.4.4. Missing or Excluded Key Data Points
Some articles contained missing or excluded key data points, which made cross-study comparisonsdifficult. For example, two studies did not include the energy efficiency of the vehicles beingstudied [24,26], which plays a crucial role in the use phase in a vehicle’s LCA. Other studies did notinclude the battery pack capacity [23,30] or vehicle weight [20,22,24], which can both indicate potentialsources of variation in production emissions.
4. Operationalization of Extracted Meta-Data
The life-cycle-phase GHG emissions were extracted from each study for EVs and petrol anddiesel vehicles to complete the quantitative meta-analysis used to answer RQ2. The DIP, ED, and MPEcalculations were then performed as described in the methodology (Sections 2.2.1 and 2.2.2), and aMonte Carlo analysis was performed as a sensitivity analysis (Section 2.2.3).
4.1. Aggregation of Results from All Studies
Table 7 shows the mean, standard deviation (SD), and sample size n cases for the vehicle typesstudied within the collected research. Table A1 is included as an appendix with all case data used for thecalculations in Table 7. The changing sample size per life-cycle phase is due to the lack of data inclusionand transparency discussed in the previous sections. On average, BEVs had higher GHG emissionswithin the production-phase emissions. The standard deviation within the production emissions ofboth BEV and petrol vehicles highlights the importance of LCIs and background data regarding thevehicles’ materials and production locations, as highlighted in Figures 5 and 6. These characteristicscan play a decisive role in determining the outcome of comparative vehicle LCA studies. The WTWemissions associated with BEVs can be found in Table 7, and the different electricity sources assumedwithin each study help to explain the large variance of the WTW emissions. It is worth noting thatdiesel vehicles’ sample size was relatively small (n = 6), as diesel vehicles were less often compared toEVs than petrol vehicles. This small sample size leaves room for bias, which will be discussed to agreater extent within the limitations section, Section 4.3.

Sustainability 2020, 12, 9390 15 of 28
Table 7. Mean, standard deviation (SD), and population size n of emissions from production, WTW,maintenance, EOL, and energy efficiency from all studies reviewed.
Production(tCO2 eq.)
Energy Efficiency(EV: kWh/100 kmICEV: L/100 km)
WTWEmissions
(gCO2eq/km)
Maintenance(gCO2eq/km)
EOL(tCO2eq)
BEVMean 10.8 16.7 132.2 10.1 0.2
SD 2.38 3.15 107.1 5.06 1.55n 24 23 40 14 13
PetrolMean 6.6 7.6 237.1 12 0.4
SD 2.01 2.12 63.64 5.55 1.05n 18 17 23 12 14
DieselMean 6.1 5.2 154.3 10.1 −0.6
SD 1.25 1.03 32.7 4.82 1.06n 6 5 8 4 4
4.2. Electrical Grid Intensities
Utilizing the electrical grid GHG intensities as described in Section 2.2.4., the countries withthe lowest and highest electric emission intensity were Iceland and Latvia, estimated to be 20.3 and1168 gCO2eq/kWh, respectively. The European Union’s electric grid was estimated to have an averageintensity of 447 gCO2eq/kWh, which is relatively consistent with other published literature [42].The average value for energy efficiency for EVs found within the review analysis, 16.7 kWh/ 100 km,was used to perform the calculations in the following subsections (petrol and diesel vehicles additionallyused the average efficiency values, in L/100 km, found for the associated vehicle type found inTable 7). The average distance driven over the vehicle’s physical lifetime in all reviewed studies was183,894 km, which is thus used as the lifetime within the following analysis. The impacts of changes inthese values, energy efficiency, and lifetime are looked into in Sections 3.2.3 and 3.2.4 and examinedfurther in the discussion section.
4.3. The Distances of Intersection Points (DIPs)
The resulting DIPs, according to the calculations in Equation (1) and using the inputs described inSection 4.1, are shown in Figure 7.
Sustainability 2020, 12, x FOR PEER REVIEW 18 of 32
Figure 7. The distances of intersection points (DIPs; measured in thousands of kilometers) between an EV and (a) a diesel vehicle for comparison; (b) a petrol vehicle for comparison (in Figure 7a, the diesel DIP case, Malta does not intersect, and is thus highlighted in orange, but cannot be seen due to its relative size on the map).
4.4. Emissions Disparity (ED)
The ED, the difference in life-cycle emissions at the end of the vehicle lifetime, according to the calculations found in Equation (2) and using the inputs described in Section 4.1, are shown in Figure 8.
Figure 8. Emissions disparity (ED) (measured in tCO2eq) between an EV and (a) a diesel vehicle for comparison; (b) a petrol vehicle for comparison.
Figure 8a shows that in comparison with diesel vehicles, EVs are estimated to have more GHG emissions over their life cycle in seven countries. All countries that are not blue have a negative ED
Figure 7. The distances of intersection points (DIPs; measured in thousands of kilometers) between anEV and (a) a diesel vehicle for comparison; (b) a petrol vehicle for comparison (in Figure 7a, the dieselDIP case, Malta does not intersect, and is thus highlighted in orange, but cannot be seen due to itsrelative size on the map).

Sustainability 2020, 12, 9390 16 of 28
Figure 7a shows the calculated DIPs for the diesel case. In the countries colored in orange and withno labeled DIPs (Poland, Estonia, Latvia, and Malta), BEVs would never intersect with the compareddiesel vehicle at the current electric grid emission intensity due to the use-phase emissions of the BEVbeing higher than those of the diesel vehicle. Additionally, the UK, Cyprus, and Greece saw breakevenpoints beyond the vehicles’ assumed lifetime. The darker red the country, the greater the number ofkilometers required to be driven to meet the DIP point. In the petrol case (Figure 7b), no countries sawa DIP greater than the vehicles’ assumed lifetime. The minimum estimated DIPs were approximately34,100 and 18,000 km for the diesel and petrol cases, respectively, which were both found in Iceland.France and the other Nordic countries follow not far behind Iceland.
4.4. Emissions Disparity (ED)
The ED, the difference in life-cycle emissions at the end of the vehicle lifetime, according to thecalculations found in Equation (2) and using the inputs described in Section 4.1, are shown in Figure 8.
Sustainability 2020, 12, x FOR PEER REVIEW 18 of 32
Figure 7. The distances of intersection points (DIPs; measured in thousands of kilometers) between an EV and (a) a diesel vehicle for comparison; (b) a petrol vehicle for comparison (in Figure 7a, the diesel DIP case, Malta does not intersect, and is thus highlighted in orange, but cannot be seen due to its relative size on the map).
4.4. Emissions Disparity (ED)
The ED, the difference in life-cycle emissions at the end of the vehicle lifetime, according to the calculations found in Equation (2) and using the inputs described in Section 4.1, are shown in Figure 8.
Figure 8. Emissions disparity (ED) (measured in tCO2eq) between an EV and (a) a diesel vehicle for comparison; (b) a petrol vehicle for comparison.
Figure 8a shows that in comparison with diesel vehicles, EVs are estimated to have more GHG emissions over their life cycle in seven countries. All countries that are not blue have a negative ED
Figure 8. Emissions disparity (ED) (measured in tCO2eq) between an EV and (a) a diesel vehicle forcomparison; (b) a petrol vehicle for comparison.
Figure 8a shows that in comparison with diesel vehicles, EVs are estimated to have more GHGemissions over their life cycle in seven countries. All countries that are not blue have a negativeED (Latvia, Estonia, Poland, Greece, Cyprus, Malta, and the UK). The diesel case’s lighter bluecountries show countries where EVs will lead to less GHG emissions, but the mitigation effect is lesssignificant. In the petrol case, EVs were estimated to result in less life-cycle GHG emissions thanthe compared petrol counterparts in all countries However, the mitigation potential differs betweencountries, where the darkest blue color represents countries with the largest mitigation potential.
4.5. Maximum Production Emissions (MPEs)
The MPEs according to the calculations found in Equation (3) and using the inputs described inSection 4.1, are shown in Figure 9.
The MPEs represent the highest GHG emissions associated with producing an EV permissible forthe EV to be considered a GHG mitigation solution. Within the diesel case, it can be seen that the non-blueblue colored countries (Poland, Malta, and Latvia) require negative MPE’s to be environmentally viable,obviously an unrealistic case. On the other end, within the petrol case, all countries showed very highMPEs. There are multiple countries within the 1.5 standard deviations range (7.23–14.37 tCO2eq) fromthe mean EV production emissions within the diesel case.

Sustainability 2020, 12, 9390 17 of 28
Sustainability 2020, 12, x FOR PEER REVIEW 19 of 32
(Latvia, Estonia, Poland, Greece, Cyprus, Malta, and the UK). The diesel case’s lighter blue countries show countries where EVs will lead to less GHG emissions, but the mitigation effect is less significant. In the petrol case, EVs were estimated to result in less life-cycle GHG emissions than the compared petrol counterparts in all countries. However, the mitigation potential differs between countries, where the darkest blue color represents countries with the largest mitigation potential.
4.5. Maximum Production Emissions (MPEs)
The MPEs according to the calculations found in Equation (3) and using the inputs described in Section 4.1, are shown in Figure 9.
Figure 9. Maximum production emissions (MPEs; measured in tCO2eq) of an EV to environmentally outperform (a) a diesel vehicle for comparison; (b) a petrol vehicle for comparison.
The MPEs represent the highest GHG emissions associated with producing an EV permissible for the EV to be considered a GHG mitigation solution. Within the diesel case, it can be seen that the non-blue blue colored countries (Poland, Malta, and Latvia) require negative MPE’s to be environmentally viable, obviously an unrealistic case. On the other end, within the petrol case, all countries showed very high MPEs. There are multiple countries within the 1.5 standard deviations range (7.23–14.37 tCO2eq) from the mean EV production emissions within the diesel case.
4.6. Monte Carlo Simulation (MCS)
A Monte Carlo simulation was performed 100,000 times to estimate the life-cycle GHG emissions for each vehicle type within each simulation. It used the mean and standard deviation values for each life-cycle phase, and different EV energy efficiencies (ICEV energy intensities were taken into account within the variation of Tank-to-Wheel (TTW) emissions). The probability that an EV would lead to less GHG emissions than the compared ICEV was mapped at intervals of 20 gCO2eq/kWh. The results of this simulation are presented in Figure 10.
Figure 9. Maximum production emissions (MPEs; measured in tCO2eq) of an EV to environmentallyoutperform (a) a diesel vehicle for comparison; (b) a petrol vehicle for comparison.
4.6. Monte Carlo Simulation (MCS)
A Monte Carlo simulation was performed 100,000 times to estimate the life-cycle GHG emissionsfor each vehicle type within each simulation. It used the mean and standard deviation values for eachlife-cycle phase, and different EV energy efficiencies (ICEV energy intensities were taken into accountwithin the variation of Tank-to-Wheel (TTW) emissions). The probability that an EV would lead to lessGHG emissions than the compared ICEV was mapped at intervals of 20 gCO2eq/kWh. The results ofthis simulation are presented in Figure 10.Sustainability 2020, 12, x FOR PEER REVIEW 20 of 32
Figure 10. Monte Carlo simulation of the probability that EVs lead to lower life-cycle emissions than ICEVs for different electrical grid greenhouse gas (GHG) emission intensities. The blue line is compared to diesel and the orange compared to petrol.
Several countries were graphed on top of the probability curves according to their associated electrical grid emission intensities to illustrate the approximate probability of an EV leading to fewer GHG emissions than its compared ICEV counterpart. The results show that the higher the electrical grid emission intensity, the lower the likelihood of an EV leading to fewer GHG emissions. For diesel vehicles, at approximately 300 gCO2eq/kWh, a probability that EVs could lead to greater GHG emissions begins to develop. Between 500 and 1000 gCO2eq/kWh, the bulk of the drop in an EV’s probability of outperforming a diesel vehicle is seen. While the EU average grid was estimated to have a GHG intensity of 447 gCO2eq/kWh, the marginal electricity production emissions could be significantly higher than the average [43]. As will be discussed further in the “Limitations and Further Study” section, this increased grid GHG intensity would likely decrease EVs’ probability of leading to lower life-cycle GHG emissions. When compared to petrol vehicles, EVs see a slower drop in probability, with the probability of an EV leading to greater GHG emissions than a petrol vehicle existing on the far end of the spectrum of GHG emission intensities of an electrical grid. Figures 11 and 12 include EEA countries grouped by these probabilities for diesel and petrol vehicles, respectively. The calculated probabilities for each country’s diesel and petrol vehicles can be found in Figure A1 in Appendix A.
0%20%40%60%80%
100%
0 250 500 750 1000 1250 1500 1750 2000 2250 2500
CO2eq
Electrical Grid GHG Emission Intensity (gCO2eq/kWh)Probability Diesel Probability Petrol Norway AustriaE.U. U.K. Greece LatviaFigure 10. Monte Carlo simulation of the probability that EVs lead to lower life-cycle emissions thanICEVs for different electrical grid greenhouse gas (GHG) emission intensities. The blue line is comparedto diesel and the orange compared to petrol.

Sustainability 2020, 12, 9390 18 of 28
Several countries were graphed on top of the probability curves according to their associatedelectrical grid emission intensities to illustrate the approximate probability of an EV leading to fewerGHG emissions than its compared ICEV counterpart. The results show that the higher the electricalgrid emission intensity, the lower the likelihood of an EV leading to fewer GHG emissions. For dieselvehicles, at approximately 300 gCO2eq/kWh, a probability that EVs could lead to greater GHG emissionsbegins to develop. Between 500 and 1000 gCO2eq/kWh, the bulk of the drop in an EV’s probabilityof outperforming a diesel vehicle is seen. While the EU average grid was estimated to have a GHGintensity of 447 gCO2eq/kWh, the marginal electricity production emissions could be significantlyhigher than the average [43]. As will be discussed further in the “Limitations and Further Study”section, this increased grid GHG intensity would likely decrease EVs’ probability of leading to lowerlife-cycle GHG emissions. When compared to petrol vehicles, EVs see a slower drop in probability,with the probability of an EV leading to greater GHG emissions than a petrol vehicle existing on the farend of the spectrum of GHG emission intensities of an electrical grid. Figures 11 and 12 include EEAcountries grouped by these probabilities for diesel and petrol vehicles, respectively. The calculatedprobabilities for each country’s diesel and petrol vehicles can be found in Figure A1 in Appendix A.
Sustainability 2020, 12, x FOR PEER REVIEW 21 of 32
Figure 11. Groupings of probabilities that an EV will lead to lower life-cycle GHG emissions than a diesel vehicle.
Figure 12. Groupings of probabilities that an EV will lead to lower life-cycle GHG emissions than a petrol vehicle.
5. Discussion and Conclusions
5.1. Discussion on the Review
The review performed during this study aimed at understanding how existing and published LCA studies comparing EVs and ICEVs differ and how the field of study has developed as EV technologies have matured. Overall, the results of this review were consistent with those of previous LCA reviews, which emphasize the importance of the electricity source powering the EVs’ use phase [9] and the necessity of inclusion and consideration of all life-cycle phases and datapoints suggested in this review and other frameworks [5,8]. This study additionally acknowledges the need for data
Figure 11. Groupings of probabilities that an EV will lead to lower life-cycle GHG emissions than adiesel vehicle.
Sustainability 2020, 12, x FOR PEER REVIEW 21 of 32
Figure 11. Groupings of probabilities that an EV will lead to lower life-cycle GHG emissions than a diesel vehicle.
Figure 12. Groupings of probabilities that an EV will lead to lower life-cycle GHG emissions than a petrol vehicle.
5. Discussion and Conclusions
5.1. Discussion on the Review
The review performed during this study aimed at understanding how existing and published LCA studies comparing EVs and ICEVs differ and how the field of study has developed as EV technologies have matured. Overall, the results of this review were consistent with those of previous LCA reviews, which emphasize the importance of the electricity source powering the EVs’ use phase [9] and the necessity of inclusion and consideration of all life-cycle phases and datapoints suggested in this review and other frameworks [5,8]. This study additionally acknowledges the need for data
Figure 12. Groupings of probabilities that an EV will lead to lower life-cycle GHG emissions than apetrol vehicle.

Sustainability 2020, 12, 9390 19 of 28
5. Discussion and Conclusions
5.1. Discussion on the Review
The review performed during this study aimed at understanding how existing and published LCAstudies comparing EVs and ICEVs differ and how the field of study has developed as EV technologieshave matured. Overall, the results of this review were consistent with those of previous LCA reviews,which emphasize the importance of the electricity source powering the EVs’ use phase [9] and thenecessity of inclusion and consideration of all life-cycle phases and datapoints suggested in this reviewand other frameworks [5,8]. This study additionally acknowledges the need for data transparencyand clarity within studies to allow for cross-study comparability, particularly for key data points,such as battery capacity, fuel/energy efficiency, vehicle weight, and lifetime. Full data disclosurein the form of LCIs or other pre-analysis primary data would allow for enhanced reproducibility.This improvement of consistency across studies could improve future meta-analysis studies’ efficacyand conclusiveness [7].
While performing the review, it was found that a variable amount of temporal learning acrossstudies seemed to occur. While the inclusion of key data points seemed to improve over time,this learning did not extend to clear disclosure of the methodologies used within the studies(highlighted in this review, particularly for EOL, maintenance, and battery replacement). This lack ofmethodological transparency appeared to be uncorrelated with the time of publication. This lack oftemporal improvement also applied to the disclosure of data in the form of full LCIs, where it did notappear that data have become more accessible over time, even with Hawkins et al. [8] review in place.
Therefore, this study’s authors suggest higher data and methodological transparency, and at aminimum, studies should provide LCIAs disaggregated by the life-cycle phase within their results or assupplementary data, thus allowing future researchers the ability to analyze by life-cycle phase impacts.This echoes Brandão et al. [7] conclusions, highlighting the need for consistent methodologies andguidelines. Data quality is often a key factor when performing LCA studies for a specific technology toproduce more consistent, comparable, and conclusive results.
5.2. Discussion on the Operationalization of the Extracted Meta-Data
RQ2 was formulated as: “How do the GHG intensities of the electrical grids across Europe affectEVs’ environmental effectiveness?” Due to the contextual importance of the assumed electricity sourcewithin LCA studies, our use of meta-data for all life-cycle phases of EVs except the energy use phaseaimed to reduce this variability through the use of a standardized methodology provided by Moro andLonza [10]. Their results show relative consistency compared to other studies, though the inclusionof trading makes by-country cross-study comparisons difficult due to different the trading patternsover time [36,44]. This standardization attempts to address the gap presented by Marmiroli et al. [9],and was suggested by Zumsteg et al. [14].
The results in Section 3.2 highlight how important electrical grid and production emissions arefor determining GHG emissions. They also emphasize the value of reproducibility, comparability,and accuracy for future studies’ accuracy and policy relevance.
As the DIP and ED analyses showed, the contextual GHG emission intensity plays a significantrole in determining EVs’ efficacy in acting as a GHG mitigation solution. The DIPs showed that forcountries with high electrical grid intensities, such as Poland, Estonia, Latvia, and Malta, EVs couldpotentially never reach an environmental breakeven point. Within the other countries, the DIPs showedhighly varying breakeven points. For example, at an average annual driving distance between 10,000and 15,000 km per year [45], it would take roughly 2–3.5 years and 7.5–11 years for an EV to break evenagainst a diesel vehicle in the Icelandic and German contexts, respectively. These timelines decrease inpetrol comparisons. The ED analysis illustrated this point further, showing that the by-country gridcircumstance could lead to an estimated 35 tons CO2 equivalent difference in outcomes (Latvia vs.Iceland) in terms of the difference in life-cycle GHG emissions compared to a petrol or diesel vehicle.

Sustainability 2020, 12, 9390 20 of 28
The MPE analysis displayed the importance of production emissions, illustrating how, in the dieselcase, countries with the highest electrical grid GHG intensities (Poland, Malta, and Latvia) would needEVs to be produced with negative GHG emissions to be considered environmentally viable.
Conversely, in the petrol case, the MPE showed that in countries with the lowest electrical gridGHG intensities, it was estimated that EV production emissions could be three times and 4.5 timeshigher than for diesel and petrol cars, respectively, and act as environmentally viable mitigationsolutions. Thus, the importance of grid GHG intensity highlights the need to consider the contextwithin which EVs are being implemented, with a watchful eye towards the production emissionsof both battery and chassis. Depending on the grid context, the maximum environmentally viableproduction emissions will change.
Reproducibility, comparability, and accuracy are essential for depicting the life-cycle GHGemissions associated with a vehicle. The MPE analysis highlighted this, where all countries encompassedin orange and red within Figure 11 had an MPE < (µEV + σEV) (mean plus one standard deviationfrom Table 7), and where if the emissions associated with producing an EV were incorrectly estimated,EVs could potentially lead to more GHG emissions over the life cycle of the vehicle than the comparativediesel vehicle. The Monte Carlo simulation further showed this, where uncertainty in whether EVswould outperform ICEVs spanned a broad range of GHG intensity values (500–1000 gCO2eq/kWh fordiesel and even broader for EVs). While some of this uncertainty is undoubtedly due to the inherentvariability found within an LCA meta-analysis (to be discussed further in the Section 4.3), this breadthdisplays the need for greater consistency between studies to gain greater confidence within the results.To make such results more conclusive and to accurately depict at what GHG grid intensity EVs shouldbe implemented as a GHG mitigation solution, greater reproducibility, comparability, and accuracywill be needed within the field. The significance of most accurately portraying the environmentalimpact of EVs holds because if the science fails to do so, it could lead to the possibility of implementingGHG mitigation solutions to reduce GHG emissions only to increase them.
5.3. Limitations and Further Study
This study’s most obvious limitation is inherent to a meta-analysis performed upon acomplex product, such as a vehicle (EV or ICEV). Even with filtering through the selection criteria,variation existed within this criterion. Each vehicle is subject to the complex global supply chainsorganized by each major vehicle manufacturer, with models often changing annually. This varianceextends to the samples studied within the review and could lead to potential bias within the results.For example, petrol and diesel vehicle comparisons were not included in every study, with dieselcomparisons having a small diesel sample size (n = 6). Suppose that those six studies focused onsmaller, more efficient diesel vehicles and smaller EV comparisons; in that case, this small sample sizecould potentially skew the results in one direction or the other.
While it can be argued that this variance and the variance discussed in the review seemingly makethe results from the meta-analysis unreliable, it can conversely be argued that the review providescontext to the meta-analysis so that it can be correctly understood and interpreted. As opposed tosuggesting that each DIP, ED, and MPE are the exact values in which these different environmentalbreakevens would occur for every EV, the meta-analysis is an attempt to synthesize findings andprovide insight into the average case across the field of EV/ICEV LCA comparison studies according tothis study’s selection criteria. It may more accurately reflect the performance of a region’s mid-sizeEV/ICEV fleet’s average life-cycle GHG emissions instead of a comparison of specific vehicle makesand models.
By understanding the variability provided by the review, the goal was thus to attempt to derivedecision and policy support and considerations with the recognition of this variability [7]. This form ofanalysis has been performed across other technologies, such as electricity generation, biobased materials,desktop computers, consumer printers, and reviews. These can help develop more standardized LCAprocedures within future studies [46–49]. Recommendations can also be made for further study areas,

Sustainability 2020, 12, 9390 21 of 28
such as a greater number of diesel comparisons and performing cross-database comparative LCAs tounderstand the role of database selection further.
The variance discussed is further enhanced by the fact that EV production is still a maturingtechnology. The International Council on Clean Transportation (ICCT) presented potential developmentsthat could impact the production emissions associated with battery packs and expected life-cycleimpacts, namely: larger EV batteries (+18%), battery second life (−22%), battery recycling(−4%), projected grid decarbonization (−27%), and greater battery energy density (−6%) [40].These assumptions, however, are just for the battery pack. The production of both EVs’ and ICEVs’chassis could benefit from projected grid decarbonization and are subject to the location in whichthe production occurs. The complicated supply chain associated with batteries and vehicles makesprojecting future production emissions difficult. It seems likely, however, that as learning occurs andtechnology both for electricity generation and manufacturing develops, the production emissions ofEV technologies should decrease. As more vehicle LCA data become available, projections regardingthe changing environmental impact of EV production can be further improved.
This temporal limitation extends to the electricity mixes used within this analysis, as they remainconstant. However, within a potential 10–20 year lifespan of a vehicle, the GHG emission intensityof national electricity grids will likely continue to decrease as more substantial political pressureis placed to address climate change [50]. This implies that the linear trajectories of the use-phaseemissions illustrated in Figure 2 are likely to slowly curve downward over time as electrical gridsare decarbonized [51]. This temporal aspect also applies to ICEVs, which are becoming increasinglyefficient as technology improves, with the possibility of increased efficiency and use of biofuels.Despite this simplification, this study’s results remain valuable, as they show a wide range of countriesunder different grid emission intensity conditions and, therefore, provide points of comparison forany country for the impact of different paces of improvement. Future studies could address thesetemporal limitations by adding a temporal component to the metrics provided in Sections 2.2.1–2.2.3.Based on planned electricity grid decarbonization pathways published by different countries, theycould potentially use them for mapping when and at what decarbonization rates EVs would becomeenvironmentally viable.
There is also an additional uncertainty aspect that comes with average grid emissions, where themarginal emissions might vary significantly. An overview of how marginal emissions can be accountedfor in the EV context has been performed, using the US as an example [52]. However, this is just onemethodology, and to determine at which moment the marginal should be used and what the marginalis has multiple solutions, and is a complex task [53]. As such, its importance is acknowledged, but isconsidered out of the scope of this study.
As a final consideration, the entire discussion within this study revolves around EVs’ potential to actas a replacement for ICEVs to achieve GHG reductions. However, lacking in such a discussion regardingGHGs and personal transport, outside of the transition to e-mobility, are the concepts and roles of traveldemand and vehicle ownership [54,55]. There has been a field of studies discussing the role of e-mobilityand its limitations. In terms of rapid transport-sector emission-reduction pathways (along with otherfactors, such as urban livability, available resources, air pollution, etc.), the current global level ofvehicle ownership could already be considered unsustainable [56]. Particularly concerning the highproduction emissions associated with EVs as discussed throughout this study, a full one-to-onetransition of global vehicle fleets from ICEVs to EVs would likely not achieve the deeper levels ofdecarbonization required to keep global warming below 1.5 ◦C without addressing travel demand andvehicle ownership rates [57].
5.4. Policy Implications
EVs can eliminate TTW emissions and potentially reduce the WTW emissions associated witheach country’s transportation sector. However, for countries interested in promoting EVs as a GHGmitigation solution within their respective boundaries to meet their nationally determined contributions

Sustainability 2020, 12, 9390 22 of 28
(NDCs), they should consider the vehicle’s entire life cycle. Just because the emissions associated withproducing a vehicle do not fall within a specific country’s geographic boundary does not mean that theyshould not be considered when implementing national policies. GHG emissions are a global issue, andclimate change impacts do not take human-drawn boundaries into account. Implementing policies thatcan lead to higher GHG emissions for a comparable life cycle to meet national goals while neglectingglobal goals could be detrimental to the purpose of the Paris Agreement.
The analysis displayed in this study can help EEA policymakers understand the role that EVs canplay in climate mitigation strategy, taking local contexts into account. In countries with high electricalgrid GHG intensities, such as Estonia or Poland, where the probability of EVs outperforming BEVs froma climate change perspective is low, the electricity production sector’s decarbonization should likely beprioritized over car fleet electrification. The basic premises of the Polish and Estonian electromobilityand energy plans are to increase the supply and demand for electric vehicles, thus increasing energyuse. Poland has put in place policies promoting EVs by giving fiscal incentives, such as with a programthat will provide up to about 4000 EUR for citizens to purchase EVs until the 8,300,000 EUR budgetexpires [58]; Estonia gives 5000 EUR per EV, with a budget of 600,000 EUR (with a likely larger allocationforthcoming) [59]. Simultaneously, the plans for decarbonizing energy production are relatively modest,with Poland assuming a gradual decrease from a 78% share of coal and lignite in 2017 to 56–60% in2030 [60], and Estonia only seeks to increase its renewable energy share from 17% in 2020 to 30% in2030 [61]. The soundness of these policies is contrasted when compared to those of Finland, a countrywhere EVs would bring about considerable emission reductions, and where grants of 2000 EUR areprovided for up 6,000,000 EUR annually for the purchasing of EVs, accompanied by an emissions-basedtaxation system for all vehicles (further subsidizing EVs) [62]. Finland, Poland, and Estonia have thusestablished similar policies regarding intention and scale, with vastly different electricity grid emissionintensities (where Finland had a 41% share of renewable electricity in 2020, with a goal to reach 53%by 2030) [63]. This type of comparison can be made again between Iceland and Malta, two islandnations with significantly differing GHG electrical grid intensities, and yet both have policies in placeto remove registration and ownership taxes, purchase subsidies in the form of direct subsidies orVAT exemption, and incentives and grants for EV charging infrastructure [64]. With Malta’s NationalEnergy and Climate Plan goal to only increase the share of renewable electricity from 10% to 11% from2020 to 2030, the similar EV policies of these two island nations contrast heavily in terms of achievedGHG outcomes.
These matching policies in different contextual circumstances give the appearance of policiesbeing enacted without considering the global effects. When considering funding and policy allocations,policymakers should make efforts to prioritize either EVs or decarbonizing the electrical grid, or both atthe same time, in line with local conditions that determine the effectiveness of the policies considered.Additionally, countries, consumers, and vehicle manufacturers need to push for further EnvironmentalProduct Declarations or similar assessments on vehicles and their components so that this knowledgecan be more broadly shared and verified.
Applying the life-cycle thinking presented within this paper also places responsibility ontoresearchers. Suppose that the GHG emissions associated with producing EVs are underestimated oroverestimated within the field of research; in that case, policymakers could potentially be misguidedto promote or not promote environmental policies encouraging the uptake of EVs in line with the ParisAgreement and EU directives, with the possibility, in some cases, of actually increasing global life-cycleGHG emissions, countering the purpose of these national policies [1,50]. This added responsibilityextends to vehicle and vehicle component manufacturers, who should closely monitor productionemissions and promote environmental data transparency while attempting to meet the market’sconstant demand for longer range and larger battery capacity.
In conclusion, a need for greater methodological and data transparency within EV LCA researchhas been identified. Additionally, national and local policymakers should consider local context andlife-cycle emissions when developing policies. Researchers need to do their part to perform LCAs
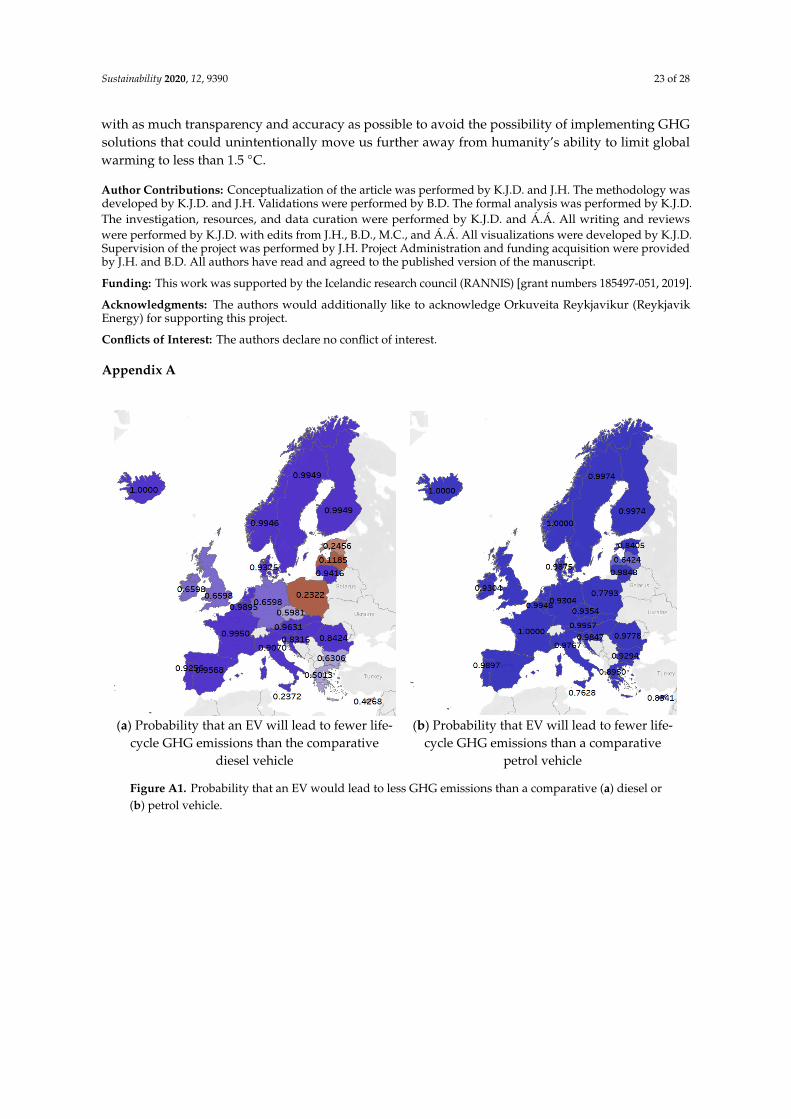
Sustainability 2020, 12, 9390 23 of 28
with as much transparency and accuracy as possible to avoid the possibility of implementing GHGsolutions that could unintentionally move us further away from humanity’s ability to limit globalwarming to less than 1.5 ◦C.
Author Contributions: Conceptualization of the article was performed by K.J.D. and J.H. The methodology wasdeveloped by K.J.D. and J.H. Validations were performed by B.D. The formal analysis was performed by K.J.D.The investigation, resources, and data curation were performed by K.J.D. and Á.Á. All writing and reviewswere performed by K.J.D. with edits from J.H., B.D., M.C., and Á.Á. All visualizations were developed by K.J.D.Supervision of the project was performed by J.H. Project Administration and funding acquisition were providedby J.H. and B.D. All authors have read and agreed to the published version of the manuscript.
Funding: This work was supported by the Icelandic research council (RANNIS) [grant numbers 185497-051, 2019].
Acknowledgments: The authors would additionally like to acknowledge Orkuveita Reykjavikur (ReykjavikEnergy) for supporting this project.
Conflicts of Interest: The authors declare no conflict of interest.
Appendix ASustainability 2020, 12, x FOR PEER REVIEW 29 of 32
(a) Probability that an EV will lead to fewer life-
cycle GHG emissions than the comparative diesel vehicle
(b) Probability that EV will lead to fewer life-cycle GHG emissions than a comparative
petrol vehicle
Figure A1. Probability that an EV would lead to less GHG emissions than a comparative (a) diesel or (b) petrol vehicle.
References
1. European Commission. A European Strategy for Low-Emission Mobility. In Communication from the Commission to the European Parliament, the Council, the European Economic and Social Committeee and the Committee of the Regions; European Commission: Brussels, Belgium, 2016.
2. IPCC. Transport. In Climate Change: Mitigation of Climate Change: Contribution of Working Group III to the Fifth Assessment Report of the IPCC; Intergovernmental Panel on Climate Change, Cambridge University Press: Cambridge, UK, 2014.
3. Woo, J.; Choi, H.; Ahn, J. Well-to-wheel analysis of greenhouse gas emissions for electric vehicles based on electricity generation mix: A global perspective. Transp. Res. Part D Transp. Environ. 2017, 51, 340–350.
4. International Organization for Standardizaiton (ISO). Environmental Management—Life Cycle Assessment—Principles and Framework; ISO 14040:2006; ISO: Geneva, Switzerland, 2006.
5. Egede, P.; Dettmer, T.; Herrmann, C.; Kara, S. Life Cycle Assessment of Electric Vehicles—A Framework to Consider Influencing Factors. Procedia CIRP 2015, 29, 233–238.
6. Nordelöf, A.; Messagie, M.; Tillman, A.M.; Söderman, M.L.; Van Mierlo, J. Environmental impacts of hybrid, plug-in hybrid, and battery. Int. J. Life Cycle Assess. 2014, 19, 1866–1890.
7. Brandao, M.; Heath, G.; Cooper, J. What Can Meta-Analyses Tell Us About the Reliability of Life Cycle Assessment for Decision Support? J. Ind. Ecol. 2012, 16, S3–S7.
8. Hawkins, T.R.; Gausen, O.M.; Strømman, A.H. Environmental impacts of hybrid and electric vehicles—A review. Int. J. Life Cycle Assess. 2012, 17, 997–1014.
9. Marmiroli, B.; Messagie, M.; Dotelli, G.; Van Mierlo, J. Electricity Generation in LCA of Electric Vehicles: A Review. Appl. Sci. 2018, 8, 1384.
10. Moro, A.; Lonza, L. Electricity carbon intensity in European Member States: Impacts on GHG emissions of electric vehicles. Transp. Res. Part D Transp. Environ 2018, 64, 5–14.
11. Ellingsen, L.A.W.; Singh, B.; Strømman, A.H. The size and range effect: Lifecycle greenhouse gas emissions of electric vehicles. Environ. Res. Lett. 2016, 11, 054010.
12. Zamagni, A.; Masoni, P.; Buttol, P.; Raggi, A.; Buonamici, R. Finding Life Cycle Assessment Research Direction with the Aid of Meta-Analysis. J. Ind. Ecol. 2012, 16, S39–S52.
Figure A1. Probability that an EV would lead to less GHG emissions than a comparative (a) diesel or(b) petrol vehicle.

Sustainability 2020, 12, 9390 24 of 28
Table A1. The data on each case considered within each study used within the review with included factors listed by year of publication.
Study and Year Vehicle Type Lifetime (km) Battery Capacity(kWh) Country of Study EV Fuel Efficiency
(kWh/100 km)ICEV Fuel Efficiency
(l/100 km) Total (g CO2/km)
Gao, L., and Winfield, Z. C. (2012) Petrol 256,000 US. 6.821235 265Gao, L., and Winfield, Z. C. (2012) BEV 256,000 24 US. 21.15178 231
Ma, Hongrui, et al. (2012) Petrol 180,000 UK. 6.4 201.2Ma, Hongrui, et al. (2012) Petrol 289,500 US. 12.9 282.9Ma, Hongrui, et al. (2012) BEV 180,000 35 UK. 14 109.2Ma, Hongrui, et al. (2012) BEV 289,500 35 US. no data 130.6Sharma, R., et al. (2013) Diesel 150,000 Australia 4.5 173.4Sharma, R., et al. (2013) BEV 150,000 19.2 Australia 12 208.3Sharma, R., et al. (2013) Petrol 150,000 Australia 12.5 410
Szczechowicz, E., Dederichs, T., and Schnettler, A. (2012) Petrol 150,000 Germany 7.5 252.7Szczechowicz, E., Dederichs, T., and Schnettler, A. (2012) BEV 150,000 34.3 Germany 17.15 163.9
Bartolozzi, I., Rizzi, F., and Frey, M. (2013) BEV no lifetime given, onlyemissions per km 34.2 Italy 17 110.35
Bartolozzi, I., Rizzi, F., and Frey, M. (2013) BEV no lifetime given, onlyemissions per km 34.2 Italy 17 121.2
Bartolozzi, I., Rizzi, F., and Frey, M. (2013) BEV no lifetime given, onlyemissions per km 34.2 Italy 17 178.25
Hawkins, Troy R., et al. (2013) Diesel 150,000 EU 6.85 228.439Hawkins, Troy R., et al. (2013) Petrol 150,000 EU 5.35 259.732Hawkins, Troy R., et al. (2013) BEV 150,000 24 EU 17.31 194.017Hawkins, Troy R., et al. (2013) BEV 150,000 24 EU 17.31 225.31Hawkins, Troy R., et al. (2013) BEV 150,000 24 EU 17.31 309.801Hawkins, Troy R., et al. (2013) BEV 150,000 24 EU 17.31 206.534
Chatzikomis, C. I., Spentzas, K. N., and Mamalis, A. G. (2014) Petrol 150,000 Greece 7.13 228.9Chatzikomis, C. I., Spentzas, K. N., and Mamalis, A. G. (2014) BEV 150,000 30 Greece 21 198.7
Messagie et al. (2014) Diesel 230,500 no data EU 5.3 189Messagie et al. (2014) Diesel 230,500 no data EU 5.9 195Messagie et al. (2014) Petrol 230,500 no data EU 7.2 267Messagie et al. (2014) Petrol 230,500 no data EU 7.1 270Messagie et al. (2014) Petrol 230,500 no data EU 13.1 288Messagie et al. (2014) BEV 230,500 no data EU 17 95
Bauer, Christian, et al. (2015) Petrol 240,000 EU no data 301.33Bauer, Christian, et al. (2015) Diesel 240,000 EU no data 253.48Bauer, Christian, et al. (2015) BEV 240,000 25 EU no data 66.86Bauer, Christian, et al. (2015) BEV 240,000 25 EU no data 67.94Bauer, Christian, et al. (2015) BEV 240,000 25 EU no data 70.36Bauer, Christian, et al. (2015) BEV 240,000 25 EU no data 87.14Bauer, Christian, et al. (2015) BEV 240,000 25 EU no data 185.94Bauer, Christian, et al. (2015) BEV 240,000 25 EU no data 213.94Bauer, Christian, et al. (2015) BEV 240,000 25 EU no data 370.94

Sustainability 2020, 12, 9390 25 of 28
Table A1. Cont.
Study and Year Vehicle Type Lifetime (km) Battery Capacity(kWh) Country of Study EV Fuel Efficiency
(kWh/100 km)ICEV Fuel Efficiency
(l/100 km) Total (g CO2/km)
Girardi, P., Gargiulo, A., and Brambilla, P. C. (2015) Petrol 150,000 Italy 6.83 308.0599Girardi, P., Gargiulo, A., and Brambilla, P. C. (2015) BEV 150,000 24 Italy 19 155.0967
Onat et al. (2015) Petrol 240,000 US. 7.6 263.4052Onat et al. (2015) BEV 240,000 24 US. no data 195.22
Tagliaferri at al. (2016) BEV 150,000 24 EU 15.56 117.7Tagliaferri at al. (2016) Diesel 150,000 24 EU 5 170
Burchart-Korol, Dorota, et al. (2018) BEV 150,000 29.9 Czech Republic 19.9 220.38Burchart-Korol, Dorota, et al. (2018) BEV 150,000 29.9 Poland 19.9 282.71
Gawron, James H., et al. (2018) Petrol 257,495 US. 266.5721Gawron, James H., et al. (2018) BEV 257,495 23 US. 19.57 138.725Gawron, James H., et al. (2018) BEV 257,495 23 US. 19.57 153.0942
Wu et al. (2018) Petrol 150,000 no data China 8.3 233.73Wu et al. (2018) Petrol 150,000 no data China 8.9 268.27Wu et al. (2018) BEV 150,000 no data China 19.4 218.8Wu et al. (2018) BEV 150,000 no data China 23.8 288.4
Bekel, K., and Pauliuk, S. (2019) Petrol 150,000 Germany no data 326.4Bekel, K., and Pauliuk, S. (2019) BEV 150,000 35.8 Germany 17.53 139.7
Kawamoto et al. (2019) Petrol 200,000 EU 5.102041 170.33Kawamoto et al. (2019) Petrol 200,000 Australia 5.813953 182.83Kawamoto et al. (2019) Petrol 200,000 China 6.21118 195.33Kawamoto et al. (2019) Petrol 200,000 US. 7.575758 245.33Kawamoto et al. (2019) Diesel 200,000 EU 3.802281 140.33Kawamoto et al. (2019) Diesel 200,000 Japan 4.62963 170.33Kawamoto et al. (2019) BEV 200,000 35.8 EU 12.70648 146.57Kawamoto et al. (2019) BEV 200,000 35.8 Japan 12.40695 171.57Kawamoto et al. (2019) BEV 200,000 35.8 U.S. 17.3913 202.01Kawamoto et al. (2019) BEV 200,000 35.8 China 12.70648 204.9Kawamoto et al. (2019) BEV 200,000 35.8 Australia 12.70648 213.23
Li, Y., Ha, N., and Li, T. (2019) Petrol 260,000 China 359.6Li, Y., Ha, N., and Li, T. (2019) Petrol 260,000 China 386.9Li, Y., Ha, N., and Li, T. (2019) Petrol 260,000 China 418.1Li, Y., Ha, N., and Li, T. (2019) BEV 260,000 17.7 China 11.67 456.7Li, Y., Ha, N., and Li, T. (2019) Petrol 260,000 China 437.7Li, Y., Ha, N., and Li, T. (2019) BEV 260,000 24.4 China 13.71 487.8Li, Y., Ha, N., and Li, T. (2019) BEV 260,000 42.1 China 14.98 518.9Li, Y., Ha, N., and Li, T. (2019) BEV 260,000 59.9 China 16.77 565.9
Xiong, S., Ji, J., and Ma, X. (2019) BEV 160,000 47.5 China 15.3 201.93Xiong, S., Ji, J., and Ma, X. (2019) BEV 120,000 60.5 China 15.2 237.57

Sustainability 2020, 12, 9390 26 of 28
References
1. European Commission. A European Strategy for Low-Emission Mobility. In Communication from the Commissionto the European Parliament, the Council, the European Economic and Social Committeee and the Committee of theRegions; European Commission: Brussels, Belgium, 2016.
2. IPCC. Transport. In Climate Change: Mitigation of Climate Change: Contribution of Working Group III to the FifthAssessment Report of the IPCC; Intergovernmental Panel on Climate Change, Cambridge University Press:Cambridge, UK, 2014.
3. Woo, J.; Choi, H.; Ahn, J. Well-to-wheel analysis of greenhouse gas emissions for electric vehicles basedon electricity generation mix: A global perspective. Transp. Res. Part D Transp. Environ. 2017, 51, 340–350.[CrossRef]
4. International Organization for Standardizaiton (ISO). Environmental Management—Life Cycle Assessment—Principles and Framework; ISO 14040:2006; ISO: Geneva, Switzerland, 2006.
5. Egede, P.; Dettmer, T.; Herrmann, C.; Kara, S. Life Cycle Assessment of Electric Vehicles—A Framework toConsider Influencing Factors. Procedia CIRP 2015, 29, 233–238. [CrossRef]
6. Nordelöf, A.; Messagie, M.; Tillman, A.M.; Söderman, M.L.; Van Mierlo, J. Environmental impacts of hybrid,plug-in hybrid, and battery. Int. J. Life Cycle Assess. 2014, 19, 1866–1890. [CrossRef]
7. Brandao, M.; Heath, G.; Cooper, J. What Can Meta-Analyses Tell Us About the Reliability of Life CycleAssessment for Decision Support? J. Ind. Ecol. 2012, 16, S3–S7. [CrossRef]
8. Hawkins, T.R.; Gausen, O.M.; Strømman, A.H. Environmental impacts of hybrid and electric vehicles—Areview. Int. J. Life Cycle Assess. 2012, 17, 997–1014. [CrossRef]
9. Marmiroli, B.; Messagie, M.; Dotelli, G.; Van Mierlo, J. Electricity Generation in LCA of Electric Vehicles:A Review. Appl. Sci. 2018, 8, 1384. [CrossRef]
10. Moro, A.; Lonza, L. Electricity carbon intensity in European Member States: Impacts on GHG emissions ofelectric vehicles. Transp. Res. Part D Transp. Environ. 2018, 64, 5–14. [CrossRef]
11. Ellingsen, L.A.W.; Singh, B.; Strømman, A.H. The size and range effect: Lifecycle greenhouse gas emissionsof electric vehicles. Environ. Res. Lett. 2016, 11, 054010. [CrossRef]
12. Zamagni, A.; Masoni, P.; Buttol, P.; Raggi, A.; Buonamici, R. Finding Life Cycle Assessment ResearchDirection with the Aid of Meta-Analysis. J. Ind. Ecol. 2012, 16, S39–S52. [CrossRef]
13. Kawamoto, R.; Mochizuki, H.; Moriguchi, Y.; Nakano, T.; Motohashi, M.; Sakai, Y.; Inaba, A. Estimation ofCO2 Emissions of Internal Combustion Engine Vehicle and Battery Electric Vehicle Using LCA. Sustainability2019, 11, 2690. [CrossRef]
14. Zumsteg, J.M.; Cooper, J.S.; Noon, M.S. Systematic Review Checklist: A Standardized Technique for Assessingand Reporting Reviews of Life Cycle Assessment Data. J. Ind. Ecol. 2012, 16, S12–S21. [CrossRef]
15. Moher, D.; Liberati, A.; Tetzlaff, J.; Altman, D.G.; The PRISMA Group. Preferred Reporting Items forSystematic Reviews and Meta-Analyses: The PRISMA Statement. PLoS Med. 2009, 6, e1000097. [CrossRef]
16. Hawkins, T.R.; Singh, B.; Majeau-Bettez, G.; Strømman, A.H. Comparative Environmental Life CycleAssessment of Conventional and Electric Vehicles. J. Ind. Ecol. 2013, 17, 53–64. [CrossRef]
17. Gao, L.; Winfield, Z.C. Life Cycle Assessment of Environmental and Economic Impacts of Advanced Vehicles.Energies 2012, 5, 605–620. [CrossRef]
18. Ma, H.; Balthasar, F.; Tait, N.; Riera-Palou, X.; Harrison, A. A new comparison between the life cyclegreenhouse gas emissions of battery electric vehicles and internal combustion vehicles. Energy Policy 2012,44, 160–173. [CrossRef]
19. Szczechowicz, E.; Dederichs, T.; Schnettler, A. Regional assessment of local emissions of electric vehiclesusing traffic simulations for a use case in Germany. Int. J. Life Cycle Assess. 2012, 17, 1131–1141. [CrossRef]
20. Bartolozzi, I.; Rizzi, F.; Frey, M. Comparison between hydrogen and electric vehicles by life cycle assessment:A case study in Tuscany, Italy. Appl. Energy 2013, 101, 103–111. [CrossRef]
21. Sharma, R.; Manzie, C.; Bessede, M.; Crawford, R.H.; Brear, M.J. Conventional, hybrid and electric vehiclesfor Australian driving conditions. Part 2: Life cycle CO2-e emissions. Transp. Res. Part C Emerg. Technol.2013, 28, 63–73. [CrossRef]
22. Chatzikomis, C.I.; Spentzas, K.N.; Mamalis, A.G. Environmental and economic effects of widespreadintroduction of electric vehicles in Greece. Eur. Transp. Res. Rev. 2014, 6, 365–376. [CrossRef]

Sustainability 2020, 12, 9390 27 of 28
23. Messagie, M.; Boureima, F.S.; Coosemans, T.; Macharis, C.; Mierlo, J.V. A Range-Based Vehicle Life CycleAssessment Incorporating Variability in the Environmental Assessment of Different Vehicle Technologiesand Fuels. Energies 2014, 7, 1467–1482. [CrossRef]
24. Bauer, C.; Hofer, J.; Althaus, H.J.; Del Duce, A.; Simons, A. The environmental performance of current andfuture passenger vehicles: Life cycle assessment based on a novel scenario analysis framework. Appl. Energy2015, 157, 871–883. [CrossRef]
25. Girardi, P.; Gargiulo, A.; Brambilla, P.C. A comparative LCA of an electric vehicle and an internal combustionengine vehicle using the appropriate power mix: The Italian case study. Girardi, Pierpaolo, Gargiulo, Alessiaand Brambilla, Paola Cristina. Int. J. Life Cycle Assess. 2015, 20, 1127–1142. [CrossRef]
26. Onat, N.C.; Kucukvar, M.; Tatari, O. Conventional, hybrid, plug-in hybrid or electric vehicles? State-basedcomparative carbon and energy footprint analysis in the United States. Appl. Energy 2015, 150, 36–49. [CrossRef]
27. Tagliaferri, C.; Evangelisti, S.; Acconcia, F.; Domenech, T.; Ekins, P.; Barletta, D.; Lettieri, P. Life cycle assessmentof future electric and hybrid vehicles: A cradle-to-grave systems engineering approach. Chem. Eng. Res. Des.2016, 112, 298–309. [CrossRef]
28. Burchart-Korol, D.; Jursova, S.; Folega, P.; Korol, J.; Pustejovska, P.; Blaut, A. Environmental life cycleassessment of electric vehicles in Poland and the Czech Republic. J. Clean. Prod. 2018, 202, 476–487. [CrossRef]
29. Gawron, J.H.; Keoleian, G.A.; De Kleine, R.D.; Wallington, T.J.; Kim, H.C. Life cycle assessment of connectedand automated vehicles: Sensing and computing subsystem and vehicle level effects. Environ. Sci. Technol.2018, 52, 3249–3256. [CrossRef]
30. Wu, Z.; Wang, M.; Zheng, J.; Sun, X.; Zhao, M.; Wang, X. Life cycle greenhouse gas emission reductionpotential of battery electric vehicle. J. Clean. Prod. 2018, 190, 462–470. [CrossRef]
31. Bekel, K.; Pauliuk, S. Prospective cost and environmental impact assessment of battery and fuel cell electricvehicles in Germany. Int. J. Life Cycle Assess. 2019, 24, 2220–2237. [CrossRef]
32. Li, Y.; Ha, N.; Li, T. Research on Carbon Emissions of Electric Vehicles throughout the Life Cycle AssessmentTaking into Vehicle Weight and Grid Mix Composition. Energies 2019, 12, 3612. [CrossRef]
33. Xiong, S.; Ji, J.; Ma, X. Comparative Life Cycle Energy and GHG Emission Analysis for BEVs and PhEVs:A Case Study in China. Energies 2019, 12, 834. [CrossRef]
34. Crawford, R.H.; Bontinck, P.A.; Stephan, A.; Wiedmann, T.; Yu, M. Hybrid life cycle inventory methods—Areview. J. Clean. Prod. 2018, 172, 1273–1288. [CrossRef]
35. Pomponi, F.; Lenzen, M. Hybrid life cycle assessment (LCA) will likely yield more accurate results thanprocess-based LCA. J. Clean. Prod. 2018, 176, 210–215. [CrossRef]
36. Säynäjoki, A.; Heinonen, J.; Junnonen, J.M.; Junnila, S. Input–output and process LCAs in the building sector:Are the results compatible with each other? Carbon Manag. 2017, 8, 155–166. [CrossRef]
37. Lenzen, M. Errors in Conventional and Input-Output—Based Life—Cycle Inventories. J. Ind. Ecol. 2008, 4,127–148. [CrossRef]
38. Romare, M.; Dahllöf, L. The Life Cycle Energy Consumption and Greenhouse Gas Emissions from Lithium-IonBatteries; IVL Swedish Environmental Research Institute: Stockholm, Sweden, 2017; Volume 23.
39. Emami, N.; Heinonen, J.; Marteinsson, B.; Säynäjoki, A.; Junnonen, J.M.; Laine, J.; Junnila, S. A Life CycleAssessment of Two Residential Buildings Using Two Different LCA Database-Software Combinations:Recognizing Uniformities and Inconsistencies. Buildings 2019, 9, 20. [CrossRef]
40. The International Council on Clean Transportation. Effects of Battery Manufacturing on Electric Vehicle Life-CycleGreenhouse Gas Emissions; International Council Clean Transportation: Washington, DC, USA, 2018.
41. Pryshlakivsky, J.; Searcy, C. An uncertainty analysis of the energy intensity of 37 materials used in automobilemanufacturing: Statistical methods and recommendations. Sustain. Prod. Consum. 2020, 24, 12–25. [CrossRef]
42. Skrúcaný, T.; Kendra, M.; Stopka, O.; Milojevic, S.; Figlus, T.; Csiszár, C. Impact of the Electric MobilityImplementation on the Greenhouse Gases Production in Central European Countries. Sustainability 2019,11, 4948.
43. Weidema, B.P.; Frees, N.; Nielsen, A.M. Marginal production technologies for life cycle inventories. Int. J.Life Cycle Assess. 1999, 4, 48–56. [CrossRef]
44. Tranberg, B.; Corradi, O.; Lajoie, B.; Gibon, T.; Staffell, I.; Andresen, G.B. Real-time carbon accounting methodfor the European electricity markets. Energy Strategy Rev. 2019, 26, 100367. [CrossRef]
45. Millard-Ball, A.; Schipper, L. Are We Reaching Peak Travel? Trends in Passenger Transport in EightIndustrialized Countries. Transp. Rev. 2011, 31, 357–378. [CrossRef]

Sustainability 2020, 12, 9390 28 of 28
46. Burkhardt, J.J., III; Heath, G.; Cohen, E. Life cycle greenhouse gas emissions of trough and tower concentratingsolar power electricity generation: Systematic review and harmonization. J. Ind. Ecol. 2012, 16, S93–S109.[CrossRef]
47. Weiss, M.; Haufe, J.; Carus, M.; Brandão, M.; Bringezu, S.; Hermann, B.; Patel, M.K. A review of theenvironmental impacts of biobased materials. J. Ind. Ecol. 2012, 16, S169–S181. [CrossRef]
48. Teehan, P.; Kandlikar, M. Sources of variation in life cycle assessments of desktop computers. J. Ind. Ecol.2012, 16, S182–S194. [CrossRef]
49. Bousquin, J.; Gambeta, E.; Esterman, M.; Rothenberg, S. Life cycle assessment in the print industry: A CriticalReview. J. Ind. Ecol. 2012, 16, S195–S205. [CrossRef]
50. United Nations. Transforming Our World: The 2030 Agenda for Sustainable Development; United Nations:Copenhagen, Denmark, 2015.
51. European Environment Agency. National emissions reported to the UNFCCC and to the EUGreenhouse Gas Monitoring Mechanism. Reykjavik: S.n., 6, 16. 2020. Available online: https://www.eea.europa.eu/data-and-maps/data/national-emissions-reported-to-the-unfccc-and-to-the-eu-greenhouse-gas-monitoring-mechanism-16 (accessed on 16 June 2020).
52. Zivin, J.S.G.; Kotchen, M.J.; Mansur, E.T. Spatial and temporal heterogeneity of marginal emissions:Implications for electric cars and other electricity-shifting policies. J. Econ. Behav. Organ. 2014, 107, 248–268.[CrossRef]
53. Heinonen, J.; Laine, J.; Pluuman, K.; Säynäjoki, E.S.; Soukka, R.; Junnila, S. Planning for a Low CarbonFuture? Comparing Heat Pumps and Cogeneration as the Energy System Options for a New ResidentialArea. Energies 2015, 8, 9137–9154. [CrossRef]
54. Holden, E.; Banister, D.; Gössling, S.; Gilpin, G.; Linnerud, K. Grand Narratives for sustainable mobility:A conceptual review. Energy Res. Soc. Sci. 2019. [CrossRef]
55. Creutzig, F.; Roy, J.; Lamb, W.F.; Azevedo, I.M.; De Bruin, W.B.; Dalkmann, H.; Edelenbosch, O.Y.;Geels, F.W.; Grubler, A.; Hepburn, C.; et al. Towards demand-side solutions for mitigating climate change.Nat. Clim. Chang. 2018, 8, 260. [CrossRef]
56. García-Olivares, A.; Solé, J.; Osychenko, O. Transportation in a 100% renewable energy system.Energy Convers. Manag. 2018, 158, 266–285. [CrossRef]
57. García-Olivares, A. Substitutability of Electricity and Renewable Materials for Fossil Fuels in a Post-CarbonEconomy. Energies 2015, 8, 13308–13343. [CrossRef]
58. Polish Ministry of Energy. Electromobility Development Plan in Poland: Energy for the Future. PolishMinistry of Energy, 2016. Available online: https://www.gov.pl/web/klimat/elektromobilnosc (accessed on16 June 2020).
59. Keskkonnaministri Määruse. Täiselektriliste Sõidukite Ostutoetuse Andmise Tingimused ja Kord. 2020.Available online: https://www.riigiteataja.ee/akt/113122019018 (accessed on 30 October 2020).
60. Polish Ministry of Energy. National Energy and Climate Plan for the Years 2021–2030; Polish Ministry of Energy:Warsaw, Poland, 2019.
61. Ministerstwo Klimatu. Program “Zielony Samochód”. Ministerstwo Klimatu, 2020. Available online:https://www.gov.pl/web/klimat/program-zielony-samochod (accessed on 16 June 2020).
62. European Alternative Fuels Observatory. Finland—Incentives and Legislation. European Alternative FuelsObservatory. 2020. Available online: https://www.eafo.eu/countries/finland/1732/incentives (accessed on16 June 2020).
63. Ministry of Economic Affairs and Employment. Finland’s Integrated Energy and Climate Plan; Ministry ofEconomic Affairs and Employment: Helsinki, Finland, 2019.
64. European Alternative Fuels Observatory. Malta—Incentives and Legislation. European Alternative FuelsObservatory. 2020. Available online: https://www.eafo.eu/countries/malta/1744/incentives (accessed on16 June 2020).
Publisher’s Note: MDPI stays neutral with regard to jurisdictional claims in published maps and institutionalaffiliations.
© 2020 by the authors. Licensee MDPI, Basel, Switzerland. This article is an open accessarticle distributed under the terms and conditions of the Creative Commons Attribution(CC BY) license (http://creativecommons.org/licenses/by/4.0/).