Rev. Fac. Ing. Univ. Antioquia N. º74 pp. 200-212, March, 2015 · 200 Rev. Fac. Ing. Univ....
13
200 Rev. Fac. Ing. Univ. Antioquia N. º74 pp. 200-212, March, 2015 Influence of meteorology and source variation on airborne PM 10 levels in a high relief tropical Andean city Influencia de la meteorología y las fuentes de emisión en los niveles ambientales de PM 10 en una ciudad tropical Andina. Carlos Mario González-Duque * , Johana Cortés-Araujo, Beatriz Helena Aristizábal-Zuluaga Grupo de Trabajo Académico en Ingeniería Hidráulica y Ambiental, Facultad de Ingeniería y Arquitectura, Universidad Nacional de Colombia Sede Manizales. Cra. 27 64-60 Bloque H Palogrande. C.P. 170004. Manizales, Colombia (Received February 25, 2014; accepted November 13, 2014) Abstract Atmospheric particulate matter (PM 10 ) was evaluated with meteorology, mixing height and source variation over a two-year period (from January 2010 to December 2012) in the densely populated tropical Andean city of Manizales. The highest levels of PM 10 were observed in areas with the highest vehicular density with values in a range of 18 - 69 µg m -3 . PM 10 concentrations were influenced by meteorological parameters, positively associated with temperature (r = 0.40), and negatively associated with relative humidity (r = -0.47) and precipitation (r = -0.38). The effects of scavenging by precipitation were observed by analyzing PM 10 concentrations for dry periods versus wet periods. The high sulfate PM 10 ionic contents observed throughout the city were consistent with the influence of public transport and automobiles, which use diesel and gasoline as principal fuels, and are recognized as the main source of particulate matter emissions. Increasing midday mixing height over downtown of the city (from 900 m to 1600 m) effectively diluted peak hour emission from vehicular traffic, as observed over a 24 hour sampling period, with 30-second intervals. These preliminary data suggest factors important to modeling PM 10 in high rainfall and densely populated tropical mountain ecosystems. ----------Keywords: PM 10 , meteorological variables, scavenging, mid- sized Andean cities * Corresponding author: Carlos Mario González Duque, e-mail: [email protected]
Transcript of Rev. Fac. Ing. Univ. Antioquia N. º74 pp. 200-212, March, 2015 · 200 Rev. Fac. Ing. Univ....
200
Rev. Fac. Ing. Univ. Antioquia N. º74 pp. 200-212, March, 2015
Influence of meteorology and source variation on airborne PM10 levels in a high relief tropical Andean city
Influencia de la meteorología y las fuentes de emisión en los niveles ambientales de PM10 en una ciudad tropical Andina.
Carlos Mario González-Duque*, Johana Cortés-Araujo, Beatriz Helena Aristizábal-Zuluaga
Grupo de Trabajo Académico en Ingeniería Hidráulica y Ambiental, Facultad de Ingeniería y Arquitectura, Universidad Nacional de Colombia Sede Manizales. Cra. 27 64-60 Bloque H Palogrande. C.P. 170004. Manizales, Colombia
(Received February 25, 2014; accepted November 13, 2014)
Abstract
Atmospheric particulate matter (PM10) was evaluated with meteorology, mixing height and source variation over a two-year period (from January 2010 to December 2012) in the densely populated tropical Andean city of Manizales. The highest levels of PM10 were observed in areas with the highest vehicular density with values in a range of 18 - 69 µg m-3. PM10 concentrations were influenced by meteorological parameters, positively associated with temperature (r = 0.40), and negatively associated with relative humidity (r = -0.47) and precipitation (r = -0.38). The effects of scavenging by precipitation were observed by analyzing PM10 concentrations for dry periods versus wet periods. The high sulfate PM10 ionic contents observed throughout the city were consistent with the influence of public transport and automobiles, which use diesel and gasoline as principal fuels, and are recognized as the main source of particulate matter emissions. Increasing midday mixing height over downtown of the city (from 900 m to 1600 m) effectively diluted peak hour emission from vehicular traffic, as observed over a 24 hour sampling period, with 30-second intervals. These preliminary data suggest factors important to modeling PM10 in high rainfall and densely populated tropical mountain ecosystems.
----------Keywords: PM10, meteorological variables, scavenging, mid-sized Andean cities
* Corresponding author: Carlos Mario González Duque, e-mail: [email protected]

201
Influence of meteorology and source variation on airborne PM10 levels in a high relief tropical Andean city
Introduction Understanding production, fate and transport of particulate matter is essential to managing public health risks associated with urban exposure of inhalable particulates, especially in poorly understood tropical mountain ecosystems where ambient air is influenced by factors that include strong orographic effects, wide precipitation and temperature variations. Researchers have found that particles in ambient air with diameters less than 10 µm (PM10) are strongly influenced by meteorological conditions and altitude [1, 2]. Identifying the fate and transport of PM10 in tropical mountain cities will contribute to a growing body of knowledge that is being developed in different regions of the world [3-5].
Particulate matter is a mixture of solid and liquid droplets formed by elemental and organic carbon,
ammonium, nitrates, sulfates, mineral dust, trace elements and water [6]. Aerosol particles arise from natural and anthropogenic sources such as windborne dust, volcanic emissions, vehicular fuel combustion, and industrial emission processes. These particles can be emitted directly into the atmosphere, or formed as secondary pollutants through chemical reactions of gaseous precursors [7]. Greater amounts of PM10 can form when vehicular combustion is incomplete, and factors like composition and mass of particulate matter are also influenced by the levels of sulfur in fuel [8].
The coarse fraction of particles less than 10 µm is normally filtered in the upper respiratory tract by nasal hairs, cilia and mucus membranes. However, these structures often do not filter fine PM10 fraction (PM2.5) that can enter deep into the lungs interfering with gas exchange sites
Resumen
El análisis de niveles de (PM10) y su asociación con la meteorología, altura de capa de mezcla y fuentes de contaminación, se realizó en la ciudad tropical andina de Manizales durante un periodo de dos años (enero 2010 a diciembre 2012). Los mayores niveles de PM10 se observaron en zonas con alta influencia vehicular, con valores de PM10 en un intervalo de 18 - 69 µg m-3. Las concentraciones de material particulado fueron influenciadas por factores meteorológicos, mostrando una asociación positiva con la temperatura (r = 0.40), y negativa con la humedad relativa (r = -0.47) y la precipitación (r = -0.38). Los efectos del fenómeno de scavenging por la precipitación fueron observados a través del análisis de concentraciones de PM10 para periodos secos y húmedos. Los altos niveles de sulfatos observados en el PM10 en comparación con los demás iones predominantes, fueron consistentes con la influencia de emisiones derivadas del transporte público y automóviles, los cuales utilizan diesel y gasolina como sus principales combustibles. Incrementos en la altura de capa de mezcla en la zona del centro histórico de la ciudad (de 900 m a 1600 m), explican la dilución efectiva de las emisiones provenientes del tráfico vehicular, tal como se observó mediante el monitoreo de PM10 cada 30 segundos por periodos de 24 horas. Este análisis preliminar sugiere factores de importancia para implementar a futuro técnicas de modelización del PM10 en ecosistemas tropicales de montaña caracterizados por su alta precipitación y alta densidad poblacional.
----------Palabras clave: PM10, variables meteorológicas, remoción húmeda, ciudades andinas intermedias

202
Rev. Fac. Ing. Univ. Antioquia N.° 74. March 2015
or alveoli, causing serious health problems [9, 10]. These types of particles have been linked with illnesses and deaths from heart or lung disease, which include heart failure and coronary artery disease, asthma and chronic obstructive pulmonary disease [11-13]. This finer fraction, more damaging to public health, has been found to comprise the majority of PM10 mass fraction (PM2.5/PM10 ~ 0.6) in principal urban areas of the Colombian Andes [14].
The majority of epidemiological studies have used PM10 as an exposure indicator [12]. The World Health Organization (WHO) has recommended reference limit values of PM10 for annual mean concentrations (20 µg m-3) and 24 h concentrations (50 µg m-3). Current limits in Colombia for annual and 24 h means are 50 µg m-3 and 100 µg m-3, respectively [15]. Taking into account a reduction in Colombian PM10 concentration limits during the last decade, it is probable that the government will adopt the lower WHO reference values in the near future.
Exposure to particulates in ambient air is influenced by various meteorological factors such as precipitation, wind velocity, relative humidity and temperature [16]. Scavenging of particles by precipitation can result in decreased concentrations [17]. Higher wind velocities disperse particles and decrease their concentration. Higher relative humidity removes atmospheric particles and diminishes the amount of re-suspended soil dust due to increases in soil humidity [2]. Temperature, solar radiation and wind velocity control vertical air movement and lower troposphere stability, resulting in changes in mixing height and effective dilution of airborne pollutants [7, 18].
The extreme Andean topography, altitude, and urban development of Manizales city become important considerations when describing the production, fate and transport of PM10. Manizales (urban population 367000 [19]) is a city located on the western slopes of the central range of the Andes (2150 m.a.s.l.) in the Colombian department of Caldas. Urban zone is developed
on steep slopes, and as a consequence, the area available for development is limited resulting in high urban density compared with other Colombian cities. The resulting high vehicular density (254 vehicles per 1000 inhabitants [20]) and combustion of fuels with sulfur content, justifies the monitoring, analysis and modeling of air pollution dynamics in Manizales.
Relatively high altitude of Manizales could reduce combustion efficiency of diesel fuels due to the low oxygen pressure on the air. Industrial activity, leading thermal processing of wastes, metal recycling and foods, also contributes to pollution in the city. As well as, 28 km southeast of the city, there is influence from an active volcano (Nevado del Ruiz), a natural source of reduced and oxidized forms of sulfur, nitrogen and particles. Records of air pollution monitoring in Manizales have been limited to Total Suspended Particles (TSP), monitored in three points of the city, and more recently PM10 has been monitored continuously, since 2000. The aim of this study is to analyze the effects of meteorology, mixing height and source variability in the production, fate and transport of PM10 to better understand patterns of human exposure to particulate matter.
Materials and methods
Sampling and meteorological data
The urban area of Manizales forms an elongated shape oriented northwest to southeast and occupies mostly ridge topography, changing into more valley topography in the southeastern most zone. Five stations were chosen along this axis over a total horizontal distance of approximately 6.8 km to evaluate airborne PM10 concentrations during January 2010 to December 2012 (Figure 1). Table 1 shows principal characteristics of the sampling sites. Three stations were located in the most densely urban downtown area (Agustinos, Gobernación and Liceo). One station was located in the central area of the Manizales ridge (Palogrande) and the fifth station was located in the southeast valley zone (Nubia). Daily mean
203
Influence of meteorology and source variation on airborne PM10 levels in a high relief tropical Andean city
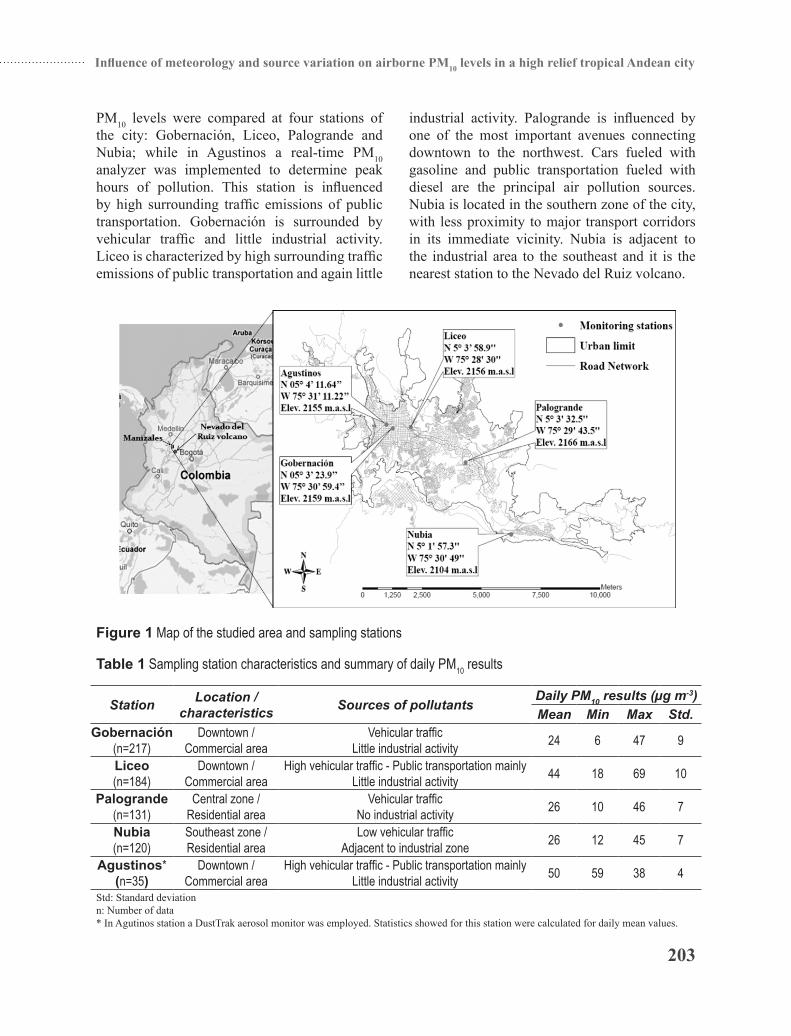
PM10 levels were compared at four stations of the city: Gobernación, Liceo, Palogrande and Nubia; while in Agustinos a real-time PM10 analyzer was implemented to determine peak hours of pollution. This station is influenced by high surrounding traffic emissions of public transportation. Gobernación is surrounded by vehicular traffic and little industrial activity. Liceo is characterized by high surrounding traffic emissions of public transportation and again little
industrial activity. Palogrande is influenced by one of the most important avenues connecting downtown to the northwest. Cars fueled with gasoline and public transportation fueled with diesel are the principal air pollution sources. Nubia is located in the southern zone of the city, with less proximity to major transport corridors in its immediate vicinity. Nubia is adjacent to the industrial area to the southeast and it is the nearest station to the Nevado del Ruiz volcano.
Figure 1 Map of the studied area and sampling stations
Table 1 Sampling station characteristics and summary of daily PM10 results
Station Location / characteristics Sources of pollutants
Daily PM10 results (µg m-3)Mean Min Max Std.
Gobernación(n=217)
Downtown / Commercial area
Vehicular trafficLittle industrial activity 24 6 47 9
Liceo(n=184)
Downtown / Commercial area
High vehicular traffic - Public transportation mainlyLittle industrial activity 44 18 69 10
Palogrande(n=131)
Central zone / Residential area
Vehicular trafficNo industrial activity 26 10 46 7
Nubia(n=120)
Southeast zone / Residential area
Low vehicular trafficAdjacent to industrial zone 26 12 45 7
Agustinos*(n=35)
Downtown / Commercial area
High vehicular traffic - Public transportation mainlyLittle industrial activity 50 59 38 4
Std: Standard deviationn: Number of data* In Agutinos station a DustTrak aerosol monitor was employed. Statistics showed for this station were calculated for daily mean values.

204
Rev. Fac. Ing. Univ. Antioquia N.° 74. March 2015
In Liceo, Gobernación, Palogrande and Nubia, samples were collected from January 2010 to December 2012. 24 h PM10 samples were collected during sampling campaign on quartz-fiber and glass-fiber filters using Hi-Vol Sampler (HVS) in Liceo, Palogrande and Nubia, and a sequential low volume sampler Partisol–FRM model 2025 in Gobernación. Samples were collected from a height of about 10 m above ground level. Information of PM10 concentrations in Liceo and Gobernación was supplied by Regional Environmental Authority (CORPOCALDAS). Hi-Vol sampled volumes ranged from 1226 m3 to 1400 m3 at a sampling flow rate of 53 - 58 m3 h-1. In the case of Partisol sequential sampler, flow rate was 1 m3 h-1. The filters were weighed before and after sampling (pre-desiccated) in an analytical balance with a precision of 0.1 mg. The PM10 concentrations have been performed following US EPA - 40 Method [21] and expressed in µg m-3.
In Agustinos a DustTrak™ Aerosol Monitor model 8520 was used for understanding daily variation and PM10 exposure. The equipment was set up to analyze PM10 concentrations in air every 30 seconds during 24 h, at a sampling flow rate of 0.1 m3 h-1. 35 daily samples were collected during October, 2010 and April, 2011.
In order to analyze the relationship between meteorological variables and PM10 levels, meteorological data (total precipitation, temperature, atmospheric pressure, relative humidity, solar radiation and wind velocity) were collected from three stations located in the immediate vicinity of HVS in Liceo, Palogrande and Nubia. In this sense only these stations were used to analyze the relationships of meteorology and PM10. In Gobernación, there was not meteorological station in its immediate vicinity and this station was not included in the analysis. In general, Manizales typically has low wind velocity and bi-directional daily wind pattern. This background information is important because low wind velocity limits horizontal dispersion of contaminants and diurnal flow patterns direct contaminants towards populated areas. Diurnal pattern of air movement -heating and rising during
the day, cooling and falling during the night, is important for transport of sulfur gas emissions from Nevado del Ruiz volcano.
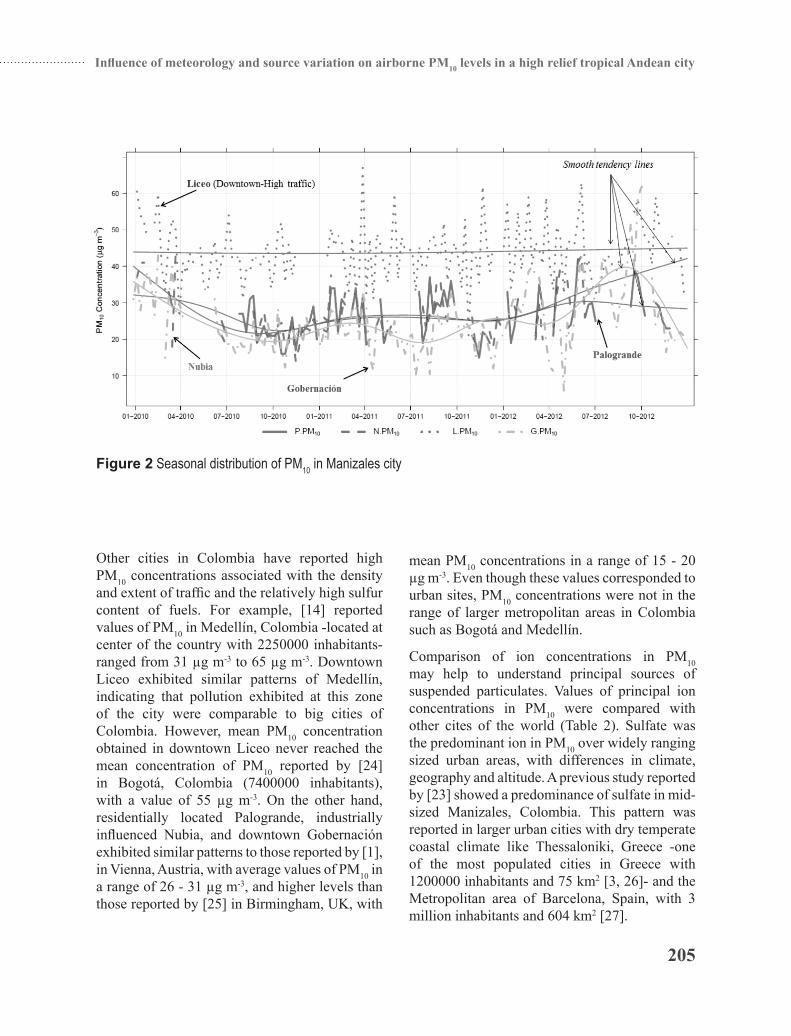
Statistical and temporal analysisPearson correlation coefficients were used to determine the relationships between PM10 and meteorological variables using simple regression model. Analysis of variance (ANOVA) was applied to determine the confidence levels between these variables. Low significant difference (LSD) Fisher test was used to estimate differences between mean concentrations of PM10 for wet versus dry periods. Seasonal distribution of PM10 concentrations (Figure 2) was performed using Openair package [22].
Results and discussionSeasonal PM10 analysis
The highest average of PM10 was associated with high urban traffic and high density of public transportation at the downtown Liceo station (44 µg m-3). Table 1 shows average PM10 statistics calculated in the five sampling sites. In terms of HVS stations, the PM10 average at downtown Liceo was 75% higher than the other three stations combined (n = 468). In previous studies, diesel and gasoline combustion was reported as principal sources of emissions around downtown Liceo [5, 23]. Among the other stations, there was little difference observed, with averages of PM10 ranging from 24 µg m-3 (Gobernación) to 26 µg m-3 (Palogrande and Nubia).
Liceo exhibited the greatest PM10 seasonal variability compared to Gobernación, Palogrande and Nubia (Figure 2). This pattern suggests that contributions of mobile sources in downtown of the city are relevant and define levels of PM10. Concentrations of PM10 never reached the Colombian 24 h guideline value of 100 µg m-3. Only downtown Liceo exceeded the Colombian annual limit of 50 µg m-3 for different daily measurements (Figure 2). However, if WHO annual limit is compared, all stations reported daily concentrations above WHO mean annual limit of 20 µg m-3.
205
Influence of meteorology and source variation on airborne PM10 levels in a high relief tropical Andean city
Figure 2 Seasonal distribution of PM10 in Manizales city
Other cities in Colombia have reported high PM10 concentrations associated with the density and extent of traffic and the relatively high sulfur content of fuels. For example, [14] reported values of PM10 in Medellín, Colombia -located at center of the country with 2250000 inhabitants- ranged from 31 µg m-3 to 65 µg m-3. Downtown Liceo exhibited similar patterns of Medellín, indicating that pollution exhibited at this zone of the city were comparable to big cities of Colombia. However, mean PM10 concentration obtained in downtown Liceo never reached the mean concentration of PM10 reported by [24] in Bogotá, Colombia (7400000 inhabitants), with a value of 55 µg m-3. On the other hand, residentially located Palogrande, industrially influenced Nubia, and downtown Gobernación exhibited similar patterns to those reported by [1], in Vienna, Austria, with average values of PM10 in a range of 26 - 31 µg m-3, and higher levels than those reported by [25] in Birmingham, UK, with
mean PM10 concentrations in a range of 15 - 20 µg m-3. Even though these values corresponded to urban sites, PM10 concentrations were not in the range of larger metropolitan areas in Colombia such as Bogotá and Medellín.
Comparison of ion concentrations in PM10 may help to understand principal sources of suspended particulates. Values of principal ion concentrations in PM10 were compared with other cites of the world (Table 2). Sulfate was the predominant ion in PM10 over widely ranging sized urban areas, with differences in climate, geography and altitude. A previous study reported by [23] showed a predominance of sulfate in mid-sized Manizales, Colombia. This pattern was reported in larger urban cities with dry temperate coastal climate like Thessaloniki, Greece -one of the most populated cities in Greece with 1200000 inhabitants and 75 km2 [3, 26]- and the Metropolitan area of Barcelona, Spain, with 3 million inhabitants and 604 km2 [27].
206
Rev. Fac. Ing. Univ. Antioquia N.° 74. March 2015
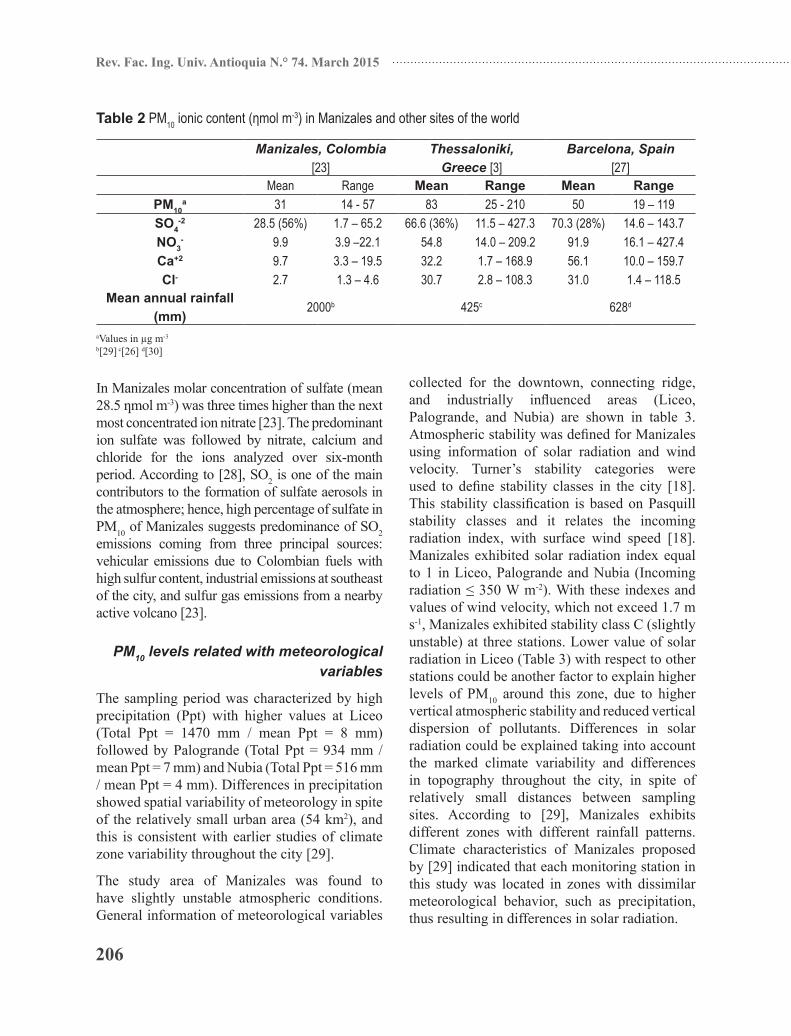
In Manizales molar concentration of sulfate (mean 28.5 ƞmol m-3) was three times higher than the next most concentrated ion nitrate [23]. The predominant ion sulfate was followed by nitrate, calcium and chloride for the ions analyzed over six-month period. According to [28], SO2 is one of the main contributors to the formation of sulfate aerosols in the atmosphere; hence, high percentage of sulfate in PM10 of Manizales suggests predominance of SO2 emissions coming from three principal sources: vehicular emissions due to Colombian fuels with high sulfur content, industrial emissions at southeast of the city, and sulfur gas emissions from a nearby active volcano [23].
PM10 levels related with meteorological variables
The sampling period was characterized by high precipitation (Ppt) with higher values at Liceo (Total Ppt = 1470 mm / mean Ppt = 8 mm) followed by Palogrande (Total Ppt = 934 mm / mean Ppt = 7 mm) and Nubia (Total Ppt = 516 mm / mean Ppt = 4 mm). Differences in precipitation showed spatial variability of meteorology in spite of the relatively small urban area (54 km2), and this is consistent with earlier studies of climate zone variability throughout the city [29].
The study area of Manizales was found to have slightly unstable atmospheric conditions. General information of meteorological variables
collected for the downtown, connecting ridge, and industrially influenced areas (Liceo, Palogrande, and Nubia) are shown in table 3. Atmospheric stability was defined for Manizales using information of solar radiation and wind velocity. Turner’s stability categories were used to define stability classes in the city [18]. This stability classification is based on Pasquill stability classes and it relates the incoming radiation index, with surface wind speed [18]. Manizales exhibited solar radiation index equal to 1 in Liceo, Palogrande and Nubia (Incoming radiation ≤ 350 W m-2). With these indexes and values of wind velocity, which not exceed 1.7 m s-1, Manizales exhibited stability class C (slightly unstable) at three stations. Lower value of solar radiation in Liceo (Table 3) with respect to other stations could be another factor to explain higher levels of PM10 around this zone, due to higher vertical atmospheric stability and reduced vertical dispersion of pollutants. Differences in solar radiation could be explained taking into account the marked climate variability and differences in topography throughout the city, in spite of relatively small distances between sampling sites. According to [29], Manizales exhibits different zones with different rainfall patterns. Climate characteristics of Manizales proposed by [29] indicated that each monitoring station in this study was located in zones with dissimilar meteorological behavior, such as precipitation, thus resulting in differences in solar radiation.
Table 2 PM10 ionic content (ηmol m-3) in Manizales and other sites of the world
Manizales, Colombia [23]
Thessaloniki, Greece [3]
Barcelona, Spain [27]
Mean Range Mean Range Mean RangePM10
a 31 14 - 57 83 25 - 210 50 19 – 119SO4
-2 28.5 (56%) 1.7 – 65.2 66.6 (36%) 11.5 – 427.3 70.3 (28%) 14.6 – 143.7NO3
- 9.9 3.9 –22.1 54.8 14.0 – 209.2 91.9 16.1 – 427.4 Ca+2 9.7 3.3 – 19.5 32.2 1.7 – 168.9 56.1 10.0 – 159.7Cl- 2.7 1.3 – 4.6 30.7 2.8 – 108.3 31.0 1.4 – 118.5
Mean annual rainfall (mm)
2000b 425c 628d
aValues in µg m-3
b[29] c[26] d[30]
207
Influence of meteorology and source variation on airborne PM10 levels in a high relief tropical Andean city
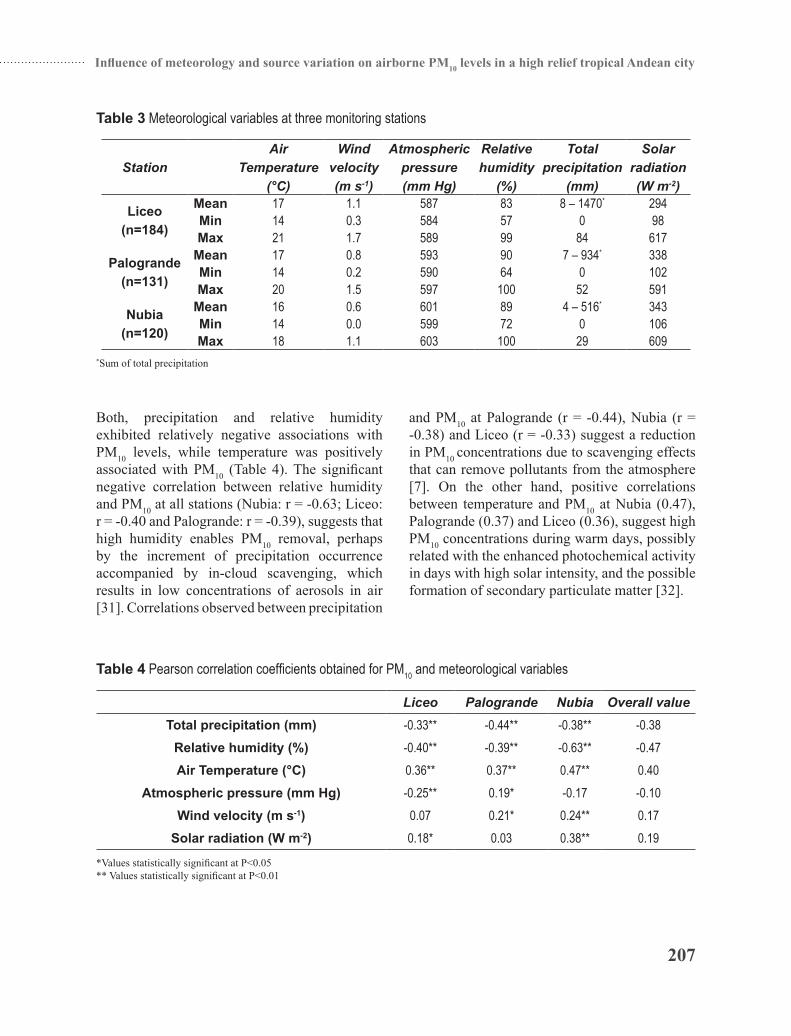
Both, precipitation and relative humidity exhibited relatively negative associations with PM10 levels, while temperature was positively associated with PM10 (Table 4). The significant negative correlation between relative humidity and PM10 at all stations (Nubia: r = -0.63; Liceo: r = -0.40 and Palogrande: r = -0.39), suggests that high humidity enables PM10 removal, perhaps by the increment of precipitation occurrence accompanied by in-cloud scavenging, which results in low concentrations of aerosols in air [31]. Correlations observed between precipitation
and PM10 at Palogrande (r = -0.44), Nubia (r = -0.38) and Liceo (r = -0.33) suggest a reduction in PM10 concentrations due to scavenging effects that can remove pollutants from the atmosphere [7]. On the other hand, positive correlations between temperature and PM10 at Nubia (0.47), Palogrande (0.37) and Liceo (0.36), suggest high PM10 concentrations during warm days, possibly related with the enhanced photochemical activity in days with high solar intensity, and the possible formation of secondary particulate matter [32].
Table 3 Meteorological variables at three monitoring stations
StationAir
Temperature (°C)
Wind velocity (m s-1)
Atmospheric pressure (mm Hg)
Relative humidity
(%)
Total precipitation
(mm)
Solar radiation (W m-2)
Liceo(n=184)
Mean 17 1.1 587 83 8 – 1470* 294Min 14 0.3 584 57 0 98Max 21 1.7 589 99 84 617
Palogrande(n=131)
Mean 17 0.8 593 90 7 – 934* 338Min 14 0.2 590 64 0 102Max 20 1.5 597 100 52 591
Nubia(n=120)
Mean 16 0.6 601 89 4 – 516* 343Min 14 0.0 599 72 0 106Max 18 1.1 603 100 29 609
*Sum of total precipitation
Table 4 Pearson correlation coefficients obtained for PM10 and meteorological variables
Liceo Palogrande Nubia Overall valueTotal precipitation (mm) -0.33** -0.44** -0.38** -0.38
Relative humidity (%) -0.40** -0.39** -0.63** -0.47Air Temperature (°C) 0.36** 0.37** 0.47** 0.40
Atmospheric pressure (mm Hg) -0.25** 0.19* -0.17 -0.10Wind velocity (m s-1) 0.07 0.21* 0.24** 0.17
Solar radiation (W m-2) 0.18* 0.03 0.38** 0.19
*Values statistically significant at P<0.05** Values statistically significant at P<0.01
208
Rev. Fac. Ing. Univ. Antioquia N.° 74. March 2015
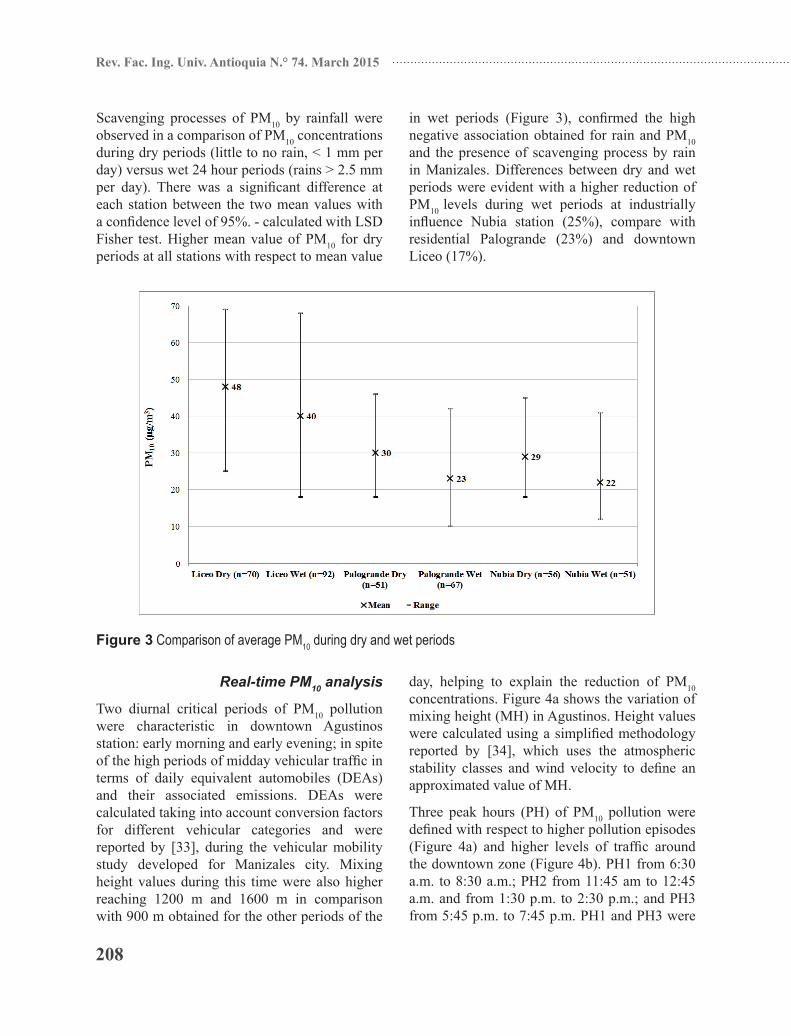
Scavenging processes of PM10 by rainfall were observed in a comparison of PM10 concentrations during dry periods (little to no rain, < 1 mm per day) versus wet 24 hour periods (rains > 2.5 mm per day). There was a significant difference at each station between the two mean values with a confidence level of 95%. - calculated with LSD Fisher test. Higher mean value of PM10 for dry periods at all stations with respect to mean value
in wet periods (Figure 3), confirmed the high negative association obtained for rain and PM10 and the presence of scavenging process by rain in Manizales. Differences between dry and wet periods were evident with a higher reduction of PM10 levels during wet periods at industrially influence Nubia station (25%), compare with residential Palogrande (23%) and downtown Liceo (17%).
Figure 3 Comparison of average PM10 during dry and wet periods
Real-time PM10 analysis
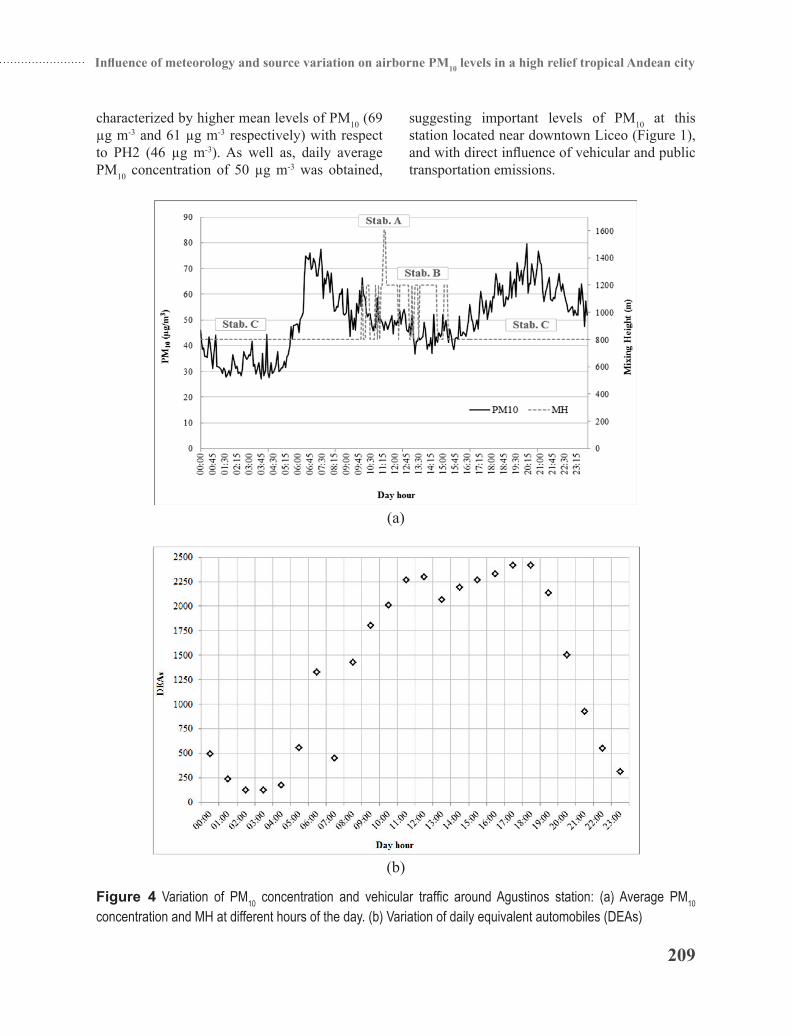
Two diurnal critical periods of PM10 pollution were characteristic in downtown Agustinos station: early morning and early evening; in spite of the high periods of midday vehicular traffic in terms of daily equivalent automobiles (DEAs) and their associated emissions. DEAs were calculated taking into account conversion factors for different vehicular categories and were reported by [33], during the vehicular mobility study developed for Manizales city. Mixing height values during this time were also higher reaching 1200 m and 1600 m in comparison with 900 m obtained for the other periods of the
day, helping to explain the reduction of PM10 concentrations. Figure 4a shows the variation of mixing height (MH) in Agustinos. Height values were calculated using a simplified methodology reported by [34], which uses the atmospheric stability classes and wind velocity to define an approximated value of MH.
Three peak hours (PH) of PM10 pollution were defined with respect to higher pollution episodes (Figure 4a) and higher levels of traffic around the downtown zone (Figure 4b). PH1 from 6:30 a.m. to 8:30 a.m.; PH2 from 11:45 am to 12:45 a.m. and from 1:30 p.m. to 2:30 p.m.; and PH3 from 5:45 p.m. to 7:45 p.m. PH1 and PH3 were
209
Influence of meteorology and source variation on airborne PM10 levels in a high relief tropical Andean city
characterized by higher mean levels of PM10 (69 µg m-3 and 61 µg m-3 respectively) with respect to PH2 (46 µg m-3). As well as, daily average PM10 concentration of 50 µg m-3 was obtained,
suggesting important levels of PM10 at this station located near downtown Liceo (Figure 1), and with direct influence of vehicular and public transportation emissions.
(a)
(b)
Figure 4 Variation of PM10 concentration and vehicular traffic around Agustinos station: (a) Average PM10 concentration and MH at different hours of the day. (b) Variation of daily equivalent automobiles (DEAs)
210
Rev. Fac. Ing. Univ. Antioquia N.° 74. March 2015
ConclusionsHigher levels of PM10 were observed in downtown (Liceo station) with values ranging from 18 µg m-3 to 69 µg m-3 and a mean concentration of 44 µg m-3. The influence of public transportation and automobiles, which use diesel and gasoline as principal fuels, respectively, were the main sources of particulate matter emissions. Other zones of the city with lower influence of mobile sources showed a reduction of daily mean values of PM10 compared with levels of downtown Liceo. All stations showed mean PM10 levels under annual Colombian limit of 50 µg m-3; nevertheless, annual WHO limit (20 µg m-3) was exceeded by all stations, in particular Liceo (44 µg m-3), suggesting the benefits of new PM10 reduction limits in order to diminish health risk of population.
Precipitation, temperature and relative humidity exerted the highest influence over concentration levels of PM10. Precipitation and relative humidity showed an inverse relationship, hence a PM10 reduction effect, while temperature showed a positive association with PM10 concentrations. The comparison of PM10 mean values during dry and wet periods suggested the removal of PM10 during scavenging processes by rain.
Two diurnal critical periods of PM10 concentration were found over downtown: early morning and early evening. Higher mixing height values during midday were associated with low PM10 concentrations, in spite of higher levels of vehicular traffic during midday, suggesting a process of vertical pollution dispersion. Mean value obtained at this zone of downtown (50 µg m-3) is indicative of the need to establish a PM10 monitoring station with Hi-Vol. samplers in this zone of the city, which can complement the air quality network of Manizales.
Additional studies that analyze other types of particles (PM2.5) and compare their composition, could develop a better understanding of the sources and fates of particulate matter pollution, characterizing organic and elemental carbon, ions
and metals in particulate matter. Results obtained in this study identify essential mechanisms for modeling PM10 in tropical mountain climates.
AcknowledgmentsAuthors acknowledge Vicerrectoria de Investigación and Dirección de Investigaciones de Manizales (DIMA) from Universidad Nacional de Colombia sede Manizales, for supporting this Project through “Programa de fortalecimiento de capacidades conjuntas para el procesamiento y análisis de información ambiental, code: 12677“. Also, the regional environmental authority (CORPOCALDAS) for their collaboration during the sampler campaign.
References1. B. Gomiscek, H. Hauck, S. Stopper, O. Preining.
“Spatial and temporal variations of PM1, PM2.5, PM10 and particle number concentration during the AUPHEP—project”. Atmospheric Environment. Vol. 38. 2004. pp. 3917-3934.
2. M. Akyüz, H. Cabuk. “Meteorological variations of PM2.5/PM10 concentrations and particle-associated polycyclic aromatic hydrocarbons in the atmospheric environment of Zonguldak, Turkey”. Journal of Hazardous Materials. Vol. 170. 2009. pp. 13-21.
3. R. Tsitouridou, D. Voutsa, Th. Kouimtzis. “Ionic composition of PM10 in the area of Thessaloniki, Greece”. Chemosphere. Vol. 52. 2003. pp. 883-891.
4. R. Harrison, A. Jones, R. Lawrence. “Major component composition of PM10 and PM2.5 from roadside and urban background sites”. Atmospheric Environment. Vol. 38. 2004. pp. 4531-4538.
5. B. Aristizábal, C. González, L. Morales, M. Abalos, E. Abad. “Polychlorinated dibenzo-p-dioxin and dibenzofuran in urban air of an Andean city”. Chemosphere. Vol. 85. 2011. pp. 170-178.
6. J. Aldabe, D. Elustondo, C. Santamaría, E. Lasheras, M. Pandolfi, A. Alastuey, X. Querol, J. Santamaría. “Chemical characterisation and source apportionment of PM2.5 and PM10 at rural, urban and traffic sites in Navarra (North of Spain)”. Atmospheric Research. Vol. 102. 2011. pp. 191–205.
7. J. Seinfeld, S. Pandis. Atmospheric chemistry and physics: From air pollution to climate change. 2nd ed.

211
Influence of meteorology and source variation on airborne PM10 levels in a high relief tropical Andean city
Ed. John Wiley & Sons, Inc. New Jersey, USA. 2006. pp. 22-27.
8. J. Zhang, K. He, Y. Ge, X. Shi. “Influence of fuel sulfur on the characterization of PM10 from a diesel engine”. Fuel. Vol. 88. 2009. pp. 504-510.
9. R. Crystal. “Research Opportunities and Advances in Lung Disease”. Jama. Vol. 285. 2001. pp. 612-618.
10. F. Dominici, R. Peng, M. Bell, L. Pham, A. McDermott, S. Zeger, J. Samet. “Fine particulate air pollution and hospital admission for cardiovascular and respiratory diseases”. Jama. Vol. 295. 2006. 1127-1134.
11. World Health Organization (WHO). Health aspects of air pollution with particulate matter, ozone and nitrogen dioxide. Report on a WHO working group. Bonn, Germany. 2003. pp. 7-29.
12. World Health Organization (WHO). WHO Air quality guidelines for particulate matter, ozone, nitrogen dioxide and sulphur dioxide. 2006. Available on: http://whqlibdoc.who.int/hq/2006/WHO_SDE_PHE_OEH_06.02_eng.pdf Accessed: July 3, 2013.
13. US EPA—United States Environmental Protection Agency. Air Quality Index. A Guide to Air Quality and Your Health. EPA Report, Office of Air Quality Planning and Standards. North Carolina, USA. 2009. pp. 7-8.
14. C. Echeverri, G. Maya. “Relation between fine particles (PM2.5) and breathable particles (PM10) in Medellin city”. Revista Ingenierías Universidad de Medellín. Vol. 7. 2008. pp. 23-42.
15. Ministerio de Ambiente, Vivienda y Desarrollo Territorial. Resolution 610 de 2010. MAVDT. Bogotá, Colombia. 2010. Available on: http://www.minambiente.gov.co/documentos/normativa/ambiente/resolucion/res_0610_240310.pdf Accessed: August 5, 2013.
16. K. Moustris, I. Larissi, P. Nastos, K. Koukouletsos, A. Paliatsos. “Development and application of artificial neural network modeling in forecasting PM10 levels in a mediterranean city”. Water, Air, and Soil Pollution. Vol. 224. 2013. pp. 1-11.
17. G. Loosmore, R. Cederwall. “Precipitation scavenging of atmospheric aerosols for emergency response applications: testing an updated model with new real-time data”. Atmospheric Environment. Vol. 38. 2004. pp. 993-1003.
18. S. Zoras, A. Triantafyllou, D. Deligiorgi. “Atmospheric stability and PM10 concentrations at far distance from elevated point sources in complex terrain: Worst-
case episode study”. Journal of Environmental Management. Vol. 80. 2006. pp. 295-302.
19. DANE. Estimaciones de población para el municipio de Manizales. Available on: https://www.dane.gov.co/files/censo2005/PERFIL_PDF_CG2005/17001T7T000.PDF Accessed: September 15, 2013.
20. Manizales cómo vamos. Informe de calidad de vida 2008-2011. Recopilación de indicadores objetivos sobre Manizales. Available on: http://w w w. m a n i z a l e s c o m o v a m o s . o rg / d e s c a rg a s /informecalidadvida2011.pdf Accessed: October 24, 2013.
21. US EPA—United States Environmental Protection Agency. Method 40 CFR Pt. 50, App. J-Reference Method for the Determination of Particulate Matter as PM10 in the Atmosphere. EPA Federal Register - Proposed Rules. USA. 1987. pp. 2620-2708.
22. D. Carslaw. The openair manual — open-source tools for analyzing air pollution data. Manual for version 0.8-0. Ed. King’s College London. London, UK. 2013. pp. 66-135.
23. C. González, B. Aristizábal. “Acid rain and particulate matter dynamics in a mid-sized Andean city: The effect of rain intensity on ion scavenging”. Atmospheric Environment. Vol. 60. 2012. pp. 164-171.
24. F. Vargas, N. Rojas, J. Pachon, A. Russell. “PM10 characterization and source apportionment at two residential areas in Bogota”. Atmospheric Pollution Research. Vol. 3. 2012. pp. 72‐80.
25. S. Vardoulakis, P. Kassomenos. “Sources and factors affecting PM10 levels in two European cities: Implications for local air quality management”. Atmospheric Environment. Vol. 42. 2008. pp. 3949-3963.
26. C. Anatolaki, R. Tsitouridou. “Relationship between acidity and ionic composition of wet precipitation. A two years study at an urban site, Thessaloniki, Greece”. Atmospheric Research. Vol. 92. 2009. pp. 100-113.
27. X. Querol, A. Alastuey, S. Rodriguez, F. Plana, C. Ruiz, N. Cots, G. Massagué, O. Puig. “PM10 and PM2.5 source apportionment in the Barcelona Metropolitan area, Catalonia, Spain”. Atmospheric Environment. Vol. 35. 2001. pp. 6407-6419.
28. A. Calvo, C. Alves, A. Castro, V. Pont, A. Vicente, R. Fraile. “Research on aerosol sources and chemical composition: Past, current and emerging issues”. Atmospheric Research. Vol. 120-121. 2013. pp. 1-28.
212
Rev. Fac. Ing. Univ. Antioquia N.° 74. March 2015
29. A. Cortés. Análisis de la variabilidad espacial y temporal de la precipitación en una ciudad de media montaña andina. Caso de estudio: Manizales. Master’s degree thesis. Universidad Nacional de Colombia sede Manizales. Manizales, Colombia. 2010. pp. 20-81.
30. World Weather Organization (WWO). Climatological information for Barcelona, Spain. Available on: http://worldweather.wmo.int/083/c01232.htm Accessed: August 12, 2012.
31. H. Elminir. “Dependence of urban air pollutants on meteorology”. Science of the Total Environment. Vol. 350. 2005. pp. 225-237.
32. A. Chaloulakou, P. Kassomenos, N. Spyrellis, P. Demokritou, P. Koutrakis. “Measurements of PM10
and PM2.5 particle concentrations in Athens, Greece”. Atmospheric Environment. Vol. 37. 2003. pp. 649-660.
33. Universidad Nacional de Colombia sede Manizales. Plan de Movilidad de Manizales 2010 – 2040. Facultad de Ingeniería y Arquitectura, Universidad Nacional de Colombia sede Manizales. Manizales, Colombia. 2011. pp. 294-313.
34. L. Turtós, M. Sánchez, A. Roque, R. Soltura. “Estimación de la altura de la capa de mezcla en Casablanca a partir de parametrizaciones en superficie”. Eco Solar, Revista Científica de las Energías Renovables. Vol. 17. 2006. Available on: www.cubasolar.cu/biblioteca/Ecosolar/Ecosolar17/HTML/articulo04.htm Accessed: January 24, 2013.


![Artículo universidad de antioquia[1]](https://static.fdocuments.us/doc/165x107/55b97036bb61ebe8798b4753/articulo-universidad-de-antioquia1.jpg)