Return to Tutorials Tricia Neuman, Sc.D. Director, Medicare Policy Project Vice President, Kaiser...
18
Return to Tutori Tricia Neuman, Sc.D. Director, Medicare Policy Project Vice President, Kaiser Family Foundation For KaiserEDU June 2009 Medicare 101: The Basics
-
Upload
stanley-flynn -
Category
Documents
-
view
219 -
download
0
Transcript of Return to Tutorials Tricia Neuman, Sc.D. Director, Medicare Policy Project Vice President, Kaiser...

Return to Tutorials
Tricia Neuman, Sc.D.
Director, Medicare Policy Project
Vice President, Kaiser Family Foundation
For
KaiserEDU
June 2009
Medicare 101: The Basics

Return to Tutorials
Medicare Overview
1965: Signed into law by President Johnson to provide health and economic security to seniors
1972: expanded to cover younger adults with permanent disabilities
2009: covers 45 million people, including 7 million under-65 disabled
Covers individuals without regard to income or medical history
Helps pay for range of medical services, including inpatient hospital, physician, home health, diagnostic tests and prescription drugs
Exhibit 2

Return to Tutorials
Percent of total Medicare population:
NOTE: ADL is activity of daily living. SOURCE: Income data for 2007 from U.S. Census Bureau, Current Population Survey, 2008 Annual Social and Economic Supplement. All other data from Kaiser Family Foundation analysis of the Centers for Medicare & Medicaid Services Medicare Current Beneficiary Survey, Access to Care file, 2006.
Income <200% FPL ($20,800 in 2008)
Cognitive/Mental Impairment
Long-term Care Facility Resident
3+ Chronic Conditions
Under-65 Disabled
Medicare Covers a Population with Diverse Needs and Circumstances
5%
12%
16%
17%
28%
29%
38%
46%
Fair/Poor Health
Age 85+
2+ADL Limitations
Exhibit 3

Return to Tutorials
• Medicare Part A – Hospital Insurance Program• Inpatient hospital, skilled nursing facility, home health, hospice • $1,068 deductible for hospital inpatient in 2009• Individuals (and spouses) entitled to Part A after paying payroll
taxes for 10+ years • Mainly funded by payroll tax contributions (1.45 percent from
employers/employees)
• Medicare Part B – Supplementary Medical Insurance• Physician visits, outpatient, preventive services, home health • $96.40 monthly premium in 2009; higher for beneficiaries with
higher incomes • $135 deductible; 20% coinsurance for physician visits and
outpatient hospital services
Exhibit 4
Medicare Parts A and B

Return to Tutorials
• Beneficiaries can enroll in regular fee-for-service program OR in a Medicare Advantage (MA) plan
• MA include HMOs, PPOs and other private health plans
• Some plans offer extra benefits and have lower cost-sharing requirements than traditional Medicare
• Access to doctors and other health care providers is typically limited to those in the plan’s network
• Plans are paid a fixed amount per enrollee
• On average, 14 percent more than it would pay under traditional Medicare
• This extra payment will increase overall costs to Medicare by about~$150 b over 10 years
Exhibit 5
Medicare Advantage (Part C)
6.96.1
5.36.1
8.7
10.8
1999 2001 2003 2005 2007 2009
Medicare Advantage Enrollment (in millions)
25% of beneficiaries are enrolled in Medicare Advantage plans in 2009
Return to Tutorials
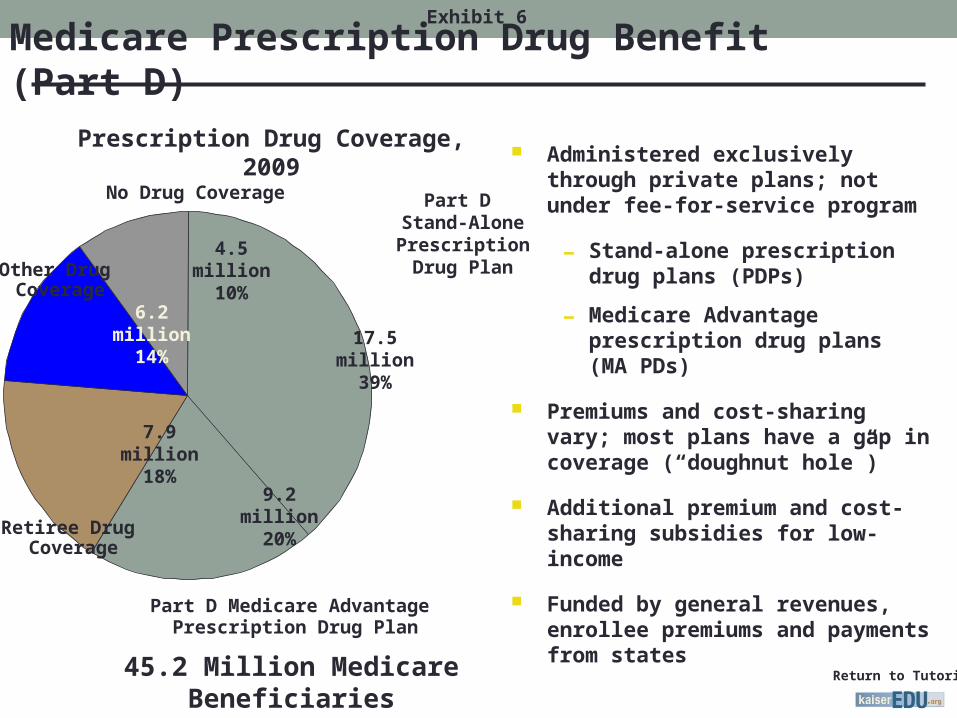
Medicare Prescription Drug Benefit (Part D)Exhibit 6
Administered exclusively through private plans; not under fee-for-service program
- Stand-alone prescription drug plans (PDPs)
- Medicare Advantage prescription drug plans (MA PDs)
Premiums and cost-sharing vary; most plans have a gap in coverage (“doughnut hole”)
Additional premium and cost-sharing subsidies for low-income
Funded by general revenues, enrollee premiums and payments from states
Part D Stand-Alone Prescription
Drug Plan
Part D Medicare Advantage Prescription Drug Plan
Retiree Drug Coverage
No Drug Coverage
Other Drug Coverage
4.5million
10%
9.2 million20%
7.9 million18%
6.2million
14%17.5
million39%
Prescription Drug Coverage, 2009
45.2 Million Medicare Beneficiaries

Return to Tutorials
Home Health
Physicians and Other Suppliers
Medicare Advantage (Part C)
Hospice3%
Skilled Nursing Facilities
Hospital Inpatient
Hospital Outpatient
Payments to Drug Plans
Other Part B Benefits
Payments to Union/Employer-Sponsored Plans
1%
Low-Income Subsidy Payments
Medicare Benefit Payments, by Type of Service, 2009
Total Benefit Payments = $484 billionNotes: Total does not include $2.5 billion in administrative expenses such as spending for implementation of the Medicare drug benefit and the Medicare Advantage program. Total is net of $9.4 billion in recoveries for 2009.Source: Congressional Budget Office, Medicare Baseline, March 2009.
Part A
Part B
Part D
Part A and B
19%
4% 23%
5%
28%
4%6%
4%
5%
Exhibit 7

Return to Tutorials
7%3%7%
13%
12% 25%11%
39%
73% 77%
40%
85%
4% 2%
2%
1%
Payroll Taxes
General Revenue
BeneficiaryPremiums
Payments fromStates
Taxation of SocialSecurity Benefits
Interest and Other
Sources of Medicare Revenue in 2010
Source: 2009 Annual Report of the Boards of Trustees of the Federal Hospital Insurance and Federal Supplementary Medical Insurance Trust Funds.
PART A$237 Billion
PART D$66 Billion
PART B$196 Billion
TOTAL$499 Billion
Exhibit 8

Return to Tutorials
Medicare offers important coverage, but with high cost-sharing and benefit gaps
• Does not cover all medical benefits• Very limited long-term care coverage• No dental, hearing aids or eyeglasses
• Has relatively high cost-sharing requirements• Deductibles for Part A, Part B, and Part D• Coinsurance/copayments • Part D coverage gap (“doughnut hole”)
• No limit on out-of-pocket spending• Unlike typical plans offered by large employer
• Pays about half of beneficiaries’ total health and long-term care spending
Exhibit 9

Return to Tutorials
Supplemental Coverage Among Medicare Beneficiaries, by Income, 2006
Employer
Medicaid
Self-Purchased Only
Other Public/Private
No SupplementalCoverage
SOURCE: Kaiser Family Foundation analysis of the CMS Medicare Current Beneficiary Survey Access to Care File, 2006.
$10,000 or less
$10,001-20,000
$20,001-30,000
$30,001-40,000
$40,001or more
Exhibit 10
8%
20%
42%
52%
9%
52%59%19%
3%
1%1%
20%
21%
20%1%
14%16%
1%
<1%
11%7% 5%
21%
<1%<1%

Return to Tutorials
Median out-of-pocket health spending as a percent of income for Medicare beneficiaries is on the rise – especially for those with modest incomes
NOTES: In 2005, federal poverty level: $9,570/individual and $12,830/couple. SOURCE: Kaiser Family Foundation. “Skin-in-the-Game,” November 2008.
16.1%
21.9% 22.4%
14.9%
7.8%
5.4%
10.6%
17.6%16.0%
11.9%
Total <100% Poverty 100-199%Poverty
200-399%Poverty
400%+ Poverty
1997 2005
Exhibit 11

Return to Tutorials
20092018
(projected)Percent Increase
2009-2018
Part A: Hospital Insurance
Deductible $1,068 $1,584 48%
Part B: Supplementary Medical Insurance
Premiums $1,157 $1,577 36%
Deductible $135 $184 36%
Part D: Prescription Drug Benefit
Premiums $364 $667 83%
Deductible $295 $490 66%
Coverage gap $3,454 $5,755 67%
Medicare Premiums and Cost Sharing Projected to Increase
Exhibit 12
Annual Costs:
Source: 2009 Annual Report of the Boards of Trustees of the Federal Hospital Insurance and Federal Supplementary Medical Insurance Trust Funds.

Return to Tutorials
Medicare Spending and Financing

Return to Tutorials
Medicare accounts for 13% of federal spending and 22% of national health spending
Nondefense Discretionary
OtherNet Interest
Social Security
Defense Discretionary
Medicare
Medicaid/ CHIP
21%
13%
7%
13%9%
16%
23%
Total Federal Spending, 2009 = $3.1 trillion
Exhibit 14

Return to Tutorials
A small share of beneficiaries account for most of Medicare spending
90%
37%
10%
63%
Total FFS Beneficiaries, 2005: 37.5 million
Total Medicare FFS Spending, 2005: $265 billion
Average per capita* = $2,934
Average per capita* = $44,220
NOTE: Excludes Medicare Advantage enrollees*Average Medicare FFS Spending onlySOURCE: Kaiser Family Foundation analysis of the CMS Medicare Current Beneficiary Survey Cost & Use file, 2005.
Exhibit 15

Return to Tutorials
Medicare Financial Challenges
Part A Trust Fund - The hospital insurance trust fund is projected to be insolvent by 2017 – with insufficient funds to pay for all promised benefits
Worker to retiree ratio – The number of workers per beneficiary is projected to decline as the Medicare population grows in the future
GDP – Medicare spending is projected to double from 3.5% of GDP in 2010 to 6.4% of GDP by 2030.
The Congressional Budget Office indicates most of the growth is due to rising health costs, rather than the aging of the Baby Boom generation.
Exhibit 16

Return to Tutorials
Looking to the Future…
Medicare remains critical source of health coverage and economic security for many
Addressing fiscal pressures without shifting more costs to beneficiaries
Setting fair payment rates to providers and plans
Monitoring and improving Part D drug benefit
Assessing role of Medicare Advantage plans
Improving care to meet needs of those with coverage and chronic illnesses and disabilities
Ensuring affordability for lower-income beneficiaries
Strengthening coverage for long-term care services
Exhibit 17

Return to Tutorials
• Kaiser Family Foundation’s Medicare Policy ProjectKaiser Family Foundation’s Medicare Policy Project• kff.org/medicare/index.cfmkff.org/medicare/index.cfm
• Official Medicare siteOfficial Medicare site• medicare.gov/medicare.gov/
• Centers for Medicare & Medicaid Services (CMS)Centers for Medicare & Medicaid Services (CMS)• cms.hhs.govcms.hhs.gov
• Congressional Budget Office (CBO)Congressional Budget Office (CBO)• cbo.govcbo.gov
• Medicare Payment Advisory Commission (MedPAC)Medicare Payment Advisory Commission (MedPAC) • medpac.govmedpac.gov
Additional ResourcesAdditional Resources
Exhibit 18