Retailing: Specialty - · PDF fileRetailing: Specialty . Efraim Levy, ... Thrifts & Mortgage...
48
Current Environment ............................................................................................ 1 Industry Profile .................................................................................................... 11 Industry Trends ................................................................................................... 12 How the Industry Operates ............................................................................... 22 Key Industry Ratios and Statistics ................................................................... 28 How to Analyze a Specialty Retail Company ................................................. 31 Glossary ................................................................................................................ 36 Industry References ........................................................................................... 38 Comparative Company Analysis ...................................................................... 40 This issue updates the one dated March 2014. Industry Surveys Retailing: Specialty Efraim Levy, CFA, Consumer Discretionary Sector Equity Analyst SEPTEMBER 2014 CONTACTS: INQUIRIES & CLIENT SUPPORT 800.523.4534 clientsupport@ standardandpoors.com SALES 877.219.1247 [email protected] MEDIA Michael Privitera 212.438.6679 [email protected] S&P CAPITAL IQ 55 Water Street New York, NY 10041 Please see General Disclaimers on the last page of this report.
Transcript of Retailing: Specialty - · PDF fileRetailing: Specialty . Efraim Levy, ... Thrifts & Mortgage...

Current Environment ............................................................................................ 1
Industry Profile .................................................................................................... 11
Industry Trends ................................................................................................... 12
How the Industry Operates ............................................................................... 22
Key Industry Ratios and Statistics ................................................................... 28
How to Analyze a Specialty Retail Company ................................................. 31
Glossary ................................................................................................................ 36
Industry References ........................................................................................... 38
Comparative Company Analysis ...................................................................... 40
This issue updates the one dated March 2014.
Industry Surveys Retailing: Specialty Efraim Levy, CFA, Consumer Discretionary Sector Equity Analyst
SEPTEMBER 2014
CONTACTS:
INQUIRIES & CLIENT SUPPORT 800.523.4534 clientsupport@ standardandpoors.com
SALES 877.219.1247 [email protected]
MEDIA Michael Privitera 212.438.6679 [email protected]
S&P CAPITAL IQ 55 Water Street New York, NY 10041
Please see General Disclaimers on the last page of this report.

Topics Covered by Industry Surveys
Aerospace & Defense
Airlines
Alcoholic Beverages & Tobacco
Apparel & Footwear: Retailers & Brands
Autos & Auto Parts
Banking
Biotechnology
Broadcasting, Cable & Satellite
Chemicals
Communications Equipment
Computers: Commercial Services
Computers: Consumer Services & the Internet
Computers: Hardware
Computers: Software
Electric Utilities
Environmental & Waste Management
Financial Services: Diversified
Foods & Nonalcoholic Beverages
Healthcare: Facilities
Healthcare: Managed Care
Healthcare: Pharmaceuticals
Healthcare: Products & Supplies
Heavy Equipment & Trucks
Homebuilding
Household Durables
Household Nondurables
Industrial Machinery
Insurance: Life & Health
Insurance: Property-Casualty
Investment Services
Lodging & Gaming
Movies & Entertainment
Natural Gas Distribution
Oil & Gas: Equipment & Services
Oil & Gas: Production & Marketing
Paper & Forest Products
Publishing & Advertising
Real Estate Investment Trusts
Restaurants
Retailing: General
Retailing: Specialty
Semiconductor Equipment
Semiconductors
Supermarkets & Drugstores
Telecommunications
Thrifts & Mortgage Finance
Transportation: Commercial
Global Industry Surveys
Airlines: Asia
Autos & Auto Parts: Europe
Banking: Europe
Food Retail: Europe
Foods & Beverages: Europe
Media: Europe
Oil & Gas: Europe
Pharmaceuticals: Europe
Telecommunications: Asia
Telecommunications: Europe
S&P Capital IQ Industry Surveys 55 Water Street, New York, NY 10041
CLIENT SUPPORT: 1-800-523-4534
VISIT THE S&P CAPITAL IQ WEBSITE: www.spcapitaliq.com
S&P CAPITAL IQ INDUSTRY SURVEYS (ISSN 0196-4666) is published weekly. Redistribution or reproduction in whole or in part (including inputting into a computer) is prohibited without written permission. To learn more about Industry Surveys and the S&P Capital IQ product offering, please contact our Product Specialist team at 1-877-219-1247 or visit getmarketscope.com. Executive and Editorial Office: S&P Capital IQ, 55 Water Street, New York, NY 10041. Officers of McGraw Hill Financial: Douglas L. Peterson, President, and CEO; Jack F. Callahan, Jr., Executive Vice President, Chief Financial Officer; John Berisford, Executive Vice President, Human Resources; D. Edward Smyth, Executive Vice President, Corporate Affairs; and Lucy Fato, Executive Vice President and General Counsel. Information has been obtained by S&P Capital IQ INDUSTRY SURVEYS from sources believed to be reliable. However, because of the possibility of human or mechanical error by our sources, INDUSTRY SURVEYS, or others, INDUSTRY SURVEYS does not guarantee the accuracy, adequacy, or completeness of any information and is not responsible for any errors or omissions or for the results obtained from the use of such information. Copyright © 2014 Standard & Poor's Financial Services LLC, a part of McGraw Hill Financial. All rights reserved. STANDARD & POOR’S, S&P, S&P 500, S&P MIDCAP 400, S&P SMALLCAP 600, and S&P EUROPE 350 are registered trademarks of Standard & Poor’s Financial Services LLC. S&P CAPITAL IQ is a trademark of Standard & Poor’s Financial Services LLC.

CURRENT ENVIRONMENT
Specialty retailers recovering, but challenges remain
Amid soft consumer spending brought about by lackluster employment trends and higher taxes, albeit partially offset by looser credit, we think that specialty retailers are facing mixed prospects in 2014.
Trends for the industry show that some retailers are widely embracing e-commerce to tap technology, enhance market reach, and spur revenue growth. Other retailers are faced with financial difficulties, possible business spin-offs, and mergers and acquisitions (M&As), discussed later in this report.
Omni channel strategies… the future of retail? In February 2014, Knowledgefaber, a consulting and research firm, reported that the retail industry in the US generated sales revenue of $4.5 trillion from about 3.8 million retail establishments in 2013, of which offline and online sales contributed 94% and 6%, respectively. According to eMarketer, a provider of research on digital media and marketing, total US retail sales will reach $4.7 trillion in 2014.
Traditional brick-and-mortar retailers’ sales grew at a modest compound annual growth rate (CAGR) of 2% from 2009–2013. A large portion of this growth can be attributed to the strong e-commerce market, which showed a CAGR of 14% in the same five-year period. Through 2018, the e-commerce industry is expected to grow at a CAGR of 12.5%, while brick-and-mortar retail is expected to grow at only a quarter of the pace of e-commerce, according to the Knowledgefaber report.
To keep up with the competition, specialty retailers are tapping new technology and adapting “omni-channel retailing” to reach out to their customers, expand sales, and spur growth. Omni-channel strategies feature an integration of technology and retail to ensure same customer experience while shopping through an online system. Customers with Internet access can shop and purchase the same items using their computer, smartphone, or tablet—anywhere and anytime.
According to a June 2014 report, “Are You Ready? How to Create an Always-On, Always-Open Shopping Experience” by Capgemini Consulting, a global strategy and consulting firm, four critical components help drive a successful omni-channel strategy. The first is investor visibility, which includes inventory identification, tracking and management. The second component is web-ready products, which ensure accuracy of key product information, attributes, and images. The third is predictive customer analysis, which uses sophisticated algorithms and data-mining activities to analyze current social data, product reviews, and historical facts in order to create an individual shopping experience. The final component is fulfillment strategy, which includes using storefront locations as distribution centers to ensure fast delivery of products to the customer.
One company that has successfully adopted an omni-channel strategy is Toys “R” Us Inc. The company reported that 31% of its $1.2 billion online sales in 2013 came from omni-channel sales—up from only 1% in 2010. Best Buy, Macy’s and Gap Inc. are leading a major shift toward omni-channel marketing. Best Buy’s omni-channel strategy centers on adding a “store pickup” option within its online shopping process, while Macy’s will encourage shoppers to scan products via the retailer’s mobile app while shopping in brick-and-mortar stores. In April 2014, Gap announced plans to expand its existing omni-channel suite that currently includes reserve in store, find in store, and ship from store features, in an effort to gain share in the $1.4 trillion global apparel market.
While stores are widely embracing the omni-channel strategy, a July 2014 Starmount and Retail Systems Research (RSR) analysis, the “Omni Channel Maturity Self Assessment Report” based on survey results from a wide range of retailers, revealed that retailers face challenges on six dimensions of omni-channel maturity—customer, product, inventory, order/fulfillment, locus, and technology. Key findings of the study highlight the respondents’ struggle to reorganize supply chains for more flexibility and lack of focus on delivering the services that their customers expect. In addition, findings show that 67% of retailers were
INDUSTRY SURVEYS RETAILING: SPECIALTY / SEPTEMBER 2014 1
“inefficient” in integrating in-store and digital experiences, 71% were unable to successfully measure omni-channel customer engagement, and 50% were inefficient or worse at responsibility and ownership of omni-channel inventory.
RadioShack sailing in troubled water After nine decades in the business, RadioShack Corp. has been left behind by the digital revolution and is now facing a dim future in electronic retailing.
In the first quarter of 2014, the electronic retailer’s loss widened to $98.3 million from $28.0 million in the same period in 2013. Sales dropped 13% to $736.7 million in the first quarter of the year, marking the ninth straight quarterly decline. The shares have lost more than three-quarters of their value this year, through August 12. In addition to these woes, RadioShack’s lenders blocked a plan to close 1,100 underperforming stores earlier this year, and the company is now in danger of being delisted from the New York Stock Exchange.
Three fundamental market shifts in this decade have caused trouble for RadioShack: changes in retailing convenience, the evolution of wireless technology, and the dwindling market for the bits and parts that form the inner workings of many devices. The evolution of wireless technology is perhaps the biggest drag on the company. The shift to smartphone particularly cannibalized RadioShack’s other inventory, lessening the need for digital cameras and GPS devices, along with the cables and cords that connect devices.
Despite the company’s efforts to remodel its stores and improve its product line-up, this turnaround attempt is “highly in doubt,” according to a report from UBS AG.
Barnes & Noble to split off e-reader division Barnes & Noble, the largest brick-and-mortar bookseller, has faced tough competition from online retailers and discount stores such as Amazon. The bookseller announced in June 2014 that it plans to split off its Nook e-reader division in an attempt to boost shareholder value. Barnes & Noble has spent years investing heavily in its Nook e-book reader and e-book library, but has struggled to be profitable. In December 2013, the company said it was evaluating the future of its tablets. For the fourth quarter of fiscal 2014 ended May 3, the Nook segment posted a 22% decline to $87 million; likewise, digital content sales fell 19% to $62 million. Barnes & Noble expects the separation of its Nook e-reader division to be complete by the end of April 2015.
Deals remain strong in 2014 The retail industry has recently been seeing a steady flow of M&A activity, and this trend is expected to continue. Almost all retail CFOs (96%) expect M&A activity to accelerate or remain the same in 2014 compared with 2013, which was a strong year for deals. Although the total number of US retails and consumer product deals fell in 2013 from the 2012 levels, the total deal value grew 26% to about $176 billion, according to S&P Capital IQ (S&P).
Private equity deals also increased for the retailing industry, led by private equity firm Cereberus Capital Management’s $85 billion acquisition of Safeway Inc., a California-based grocery store operator.
MACROECONOMIC FACTORS
According to the latest estimate from the US Bureau of Economic Analysis (BEA), real gross domestic profit (GDP) grew at a higher than expected annual rate of 4.0% in the second quarter of 2014. In the previous quarter, economic activity dropped 2.1%. The uptick in economic growth for the second quarter can be attributed to positive contributions from personal consumption expenditures (PCEs), private inventory investment, exports, nonresidential fixed investment, state and local government spending, and residential fixed investment. Meanwhile, imports, a subtraction in the calculation of GDP, increased.
Through the first half of 2014, the economy grew at a lackluster rate of about 1%, a reminder that the country’s recovery from the worst recession since the 1930s remains the slowest on record. For full-year 2013, real GDP grew an estimated 1.9%, compared with 2.8% in 2012 and 1.8% in 2011.
2 RETAILING: SPECIALTY / SEPTEMBER 2014 INDUSTRY SURVEYS
The fact that growth has been this subdued over the past few years reflects a number of fundamental factors, including political, economic, and demographic issues. In fact, given the relatively slow pace of growth and soft underlying employment trends, many consumers continue to feel like the recession has yet to end. Adding to our concerns about the fiscal health of the consumer, the payroll tax holiday was not extended in 2013, which has resulted in a 2.0% tax increase for most workers. As a result, this may pressure discretionary consumer spending.
Those fortunate enough to have jobs continue to spend at a modest pace. To maintain their current standard of living, consumers have also dipped into their savings and increased the borrowing on their credit cards. While we don’t think this behavior is sustainable over the long term, total retail sales (in nominal terms) increased 5.0% in 2013, and 4.3% as of June 2014. While this is a solid number, it is also the lowest rate of growth since 2009 (by comparison, retail sales grew 8.0% in 2011). Excluding autos, preliminary data from the US Census Bureau show that nominal retail sales were up just 3.8%. We expect sales to decelerate further in 2014, given the additional pressure placed on consumers due to anemic wage growth.
Although consumer confidence has shown signs of improvement in recent months, it has not really fully regained its strength as consumers continue to be cautious in spending. Although Europe came out of recession in the second quarter of 2013, it has only begun a slow recovery and its unemployment rate is still high; also, China’s growth is slowing. Both of these situations have diminished demand for US exports, which is dragging down the US economy. As a result, we expect only a slight improvement in real GDP growth and consumer spending in 2014. As of August, Standard & Poor’s Economics (which operates separately from S&P Capital IQ) forecast real GDP growth of 2.1% in 2014. We also expect a 2.3% increase in PCE in 2014, which should lead to a slight sales increase for specialty retailers.
Unemployment drops We see employment as the primary driver of consumer spending, and it has been improving over the past three years. In July 2014, the national unemployment rate fell to 6.2%, an improvement from the 7.3% recorded in the same period in 2013. For full year 2013, the national unemployment rate (as measured by the U-3 rate) fell to 7.4% from 8.1% recorded in 2012 and the 8.9% rate recorded in 2011. In the start of 2014, the rate declined to 6.6%. As of August 2014, Standard & Poor’s Economics was projecting that the U-3 rate would average 6.3% in 2014.
The gradual decline in the unemployment rate is a positive development, driven by both additional jobs and by more people dropping out of the labor force. (Due to how the Bureau of Labor Statistics (BLS) accounts for the unemployed, anyone who has not sought work in the past four weeks is not considered to be actively looking and is removed from the labor force). The unemployment rate dropped from its peak of 10.0% in October 2009 to its most recent level of 6.2% in July 2014, and approximately 8.8 million non-farm jobs were created over that same period. However, these job gains were largely offset by civilians deemed by the BLS as “not in the labor force,” a figure that has surged to a record high 92.0 million as of July.
Perhaps an easier way to explain the impact that a reduction in the labor force has on the unemployment rate is to look at the labor force participation rate (defined as the percentage of working-age persons who are employed or looking for a job), which has averaged 65.5% since 2000 through July 2014. Should we apply this same labor force participation rate to today’s labor market, it would reflect a U-3 unemployment rate of 10.5%.
Discouraged workers have been leaving the labor force in droves, and the labor force participation rate fell to 62.8% in December 2013, a new 35-year low. In July 2014, the labor participation rate remained almost flat at 62.9%. The unemployment rate is expected to decline in 2014, largely due to the number of workers dropping out of the labor force. While the headline U-3 is improving, it tells only part of the story. If the statistics include the 2.2 million “marginally attached” workers (such as discouraged workers of legal employment age who want jobs but did not actively seek employment in the previous four weeks due to weak prospects) and part-time workers who want full-time jobs, the unemployment rate jumps to a seasonally adjusted rate of 12.2%. The BLS measures this figure in the form of U-6 data.
INDUSTRY SURVEYS RETAILING: SPECIALTY / SEPTEMBER 2014 3

In addition to U-6, the employment-to-population ratio also reveals signs of a troubled labor market. This ratio is unaffected by the many quirks that can easily influence the U-3 number. It measures the number of working people divided by the number of civilians who are 16 or older and not in an institution (educational, criminal, mental, or other) or on active military duty. In July 2014, this ratio stood at 59.0%, slightly improved from the 58.7% in July 2013 and the 58.3% recorded when employment troughed in December 2009. Since then, while 9.0 million jobs have been added, they have essentially only kept up with growth in the population. Sadly, this metric remains near the lowest level seen since the early 1980s, when it was far more common to see one-income families. The labor force participation rate, which measures the participating portion of the economy’s total labor force, also supports the view that while unemployment trends may be improving on a year-over-year basis, they are not driven by a healthy labor market. The labor force participation rate stood at 62.9% in July 2014. This was lower than the 63.4% rate measured in July 2013.
Those employed in the private sector were working just 34.5 hours per week as of July 2014 for the fifth straight month, which remains near the lowest level of activity since the government began tracking this metric (the lowest was last reached in October 2009, at 33.8 hours per week). While full-time workers are no longer being shifted en masse to part time, as businesses have recovered somewhat and capacity utilization has improved, the majority of recent retail hires continue to be part-time, seasonal workers. Further, the average length of unemployment was 32.4 weeks in July 2014, lower than the rate in July 2013, which was 36.7 weeks. These figures remain not that far from the record of 40.7 weeks set in December 2011. The number of long-term unemployed (those without a job for 27 weeks or more) was essentially unchanged at 3.2 million in July 2014, accounting for 32.9% of the unemployed. Over the past 12 months, the number of long-term unemployed has declined by 1.1 million.
Chart H08: UNEMPLOYED WORKERS VS. BROADER TOTAL UNEMPLOYMENT
Chart H10: AVERAGE DURATION OF UNEMPLOYMENT
Chart H09: CIVILIAN EMPLOYMENT/ POPULATION RATIO AND LABOR FORCE PARTICIPATION RATE
56
58
60
62
64
66
68
1998 99 00 01 02 03 04 05 06 07 08 09 10 11 12 13 *2014
Civilian employment- population ratioCivilian labor force participation rate
CIVILIAN EMPLOYMENT/POPULATION RATIO AND LABOR FORCE PARTICIPATION RATE(In percent)
*Data through July.Source: US Bureau of Labor Statistics.
10
15
20
25
30
35
40
45
2006 2007 2008 2009 2010 2011 2012 2013 *2014
*Data through July.Source: US Bureau of Labor Statistics.
AVERAGE DURATION OF UNEMPLOYMENT(In weeks, seasonally adjusted)
0
2
4
6
8
10
12
14
16
18
1998 00 02 04 06 08 10 12 *2014
Unemployment rate (U-3) Total unemployment rate (U-6)
*Data through July.Source: US Bureau of Labor Statistics.
UNEMPLOYED WORKERS VS. BROADER TOTAL UNEMPLOYMENT(As a percent of the civilian labor force)
4 RETAILING: SPECIALTY / SEPTEMBER 2014 INDUSTRY SURVEYS

This decline can partially be attributed to unemployed individuals who have exceeded their 99 weeks of unemployment benefits and dropped out of the labor force completely, and who are therefore no longer being counted.
These statistics highlight many of the challenges that individuals face when they lose their jobs, and are the reason why so many of the jobless are currently discouraged and not seeking work. According to BLS, the unemployed persons per job opening ratio has trended downward since the end of recession, and was 2.0 in June 2014. This is well below July 2009’s record of 6.70, it is significantly higher than the 1.8 unemployed people per job opening when the recession began in December 2007. We think it is likely that the job market will strengthen slightly in 2014, which we think might bring discouraged workers back into the labor force. As of August 2014, Standard & Poor’s Economics was forecasting the U-3 unemployment rate to average 6.3% in 2014, compared with an estimated 7.4% in 2013 and a rate of 8.1% in 2012.
Lending standards are easing, and credit card delinquencies are at a seven-year low Given the macroeconomic concerns, the availability of cheap capital had largely been limited to only the most credit-worthy borrowers. That has changed over the past year or so, as credit is again being extended freely to sub-prime borrowers in all areas but housing.
While consumer credit defaults continue, one positive aspect is that the pace of defaults appears to be slowing. According to TransUnion, a global leader in credit and information management, the national credit card delinquency rate (the share of bankcard borrowers 90 days or more delinquent on one or more of their credit cards) dropped nearly 9% to 1.16% in the second quarter of 2014, from the 1.37% recorded in the first quarter of 2014, and a sharp 15% year-on-year decrease in delinquency rate from the 1.27% rate recorded in the second quarter of 2013. The current credit card delinquency rate is the lowest since 2007. TransUnion noted that consumers are continuing to have a good handle on their credit cards and that delinquency rates are dropping for all age groups.
Stock market gains drive wealth effect, leading to bifurcation of retail market The stock market gains in the past few years drove a positive wealth effect for those who own stocks. The S&P 500 Composite stock index increase slowed to 13% in 2010 after climbing 24% in 2009, generating solid returns for investors. With investment portfolios higher, consumers had been more likely to open their purse strings. While equity returns were essentially flat in 2011, the S&P 500 index was up 13.4% in 2012 and 29.6% in 2013. Year to date through August 26, 2014, the index was up by 9.7%.
While investment gains certainly have helped drive consumer spending, they have led to a bifurcation in the market, in our opinion. Since most of the people who own stocks are in the upper-middle or upper class, their gains have been more apt to drive increased spending at luxury retailers such as Tiffany’s or Nordstrom. Conversely, discount stores have also done rather well over the past three years as middle- and lower-class citizens have traded down in an effort to secure value for their dollar. We anticipate this bifurcation will continue over the medium term.
Additional macroeconomic variables might affect consumer spending The US savings rate declined steadily in 2011, coinciding with improvements in the labor markets and consumers’ increased confidence regarding their employment situation. In 2012, the rate increased to 5.6% (from 4.3% in 2011), but declined again to 4.5% in 2013 due to pressure on consumers’ incomes from the increase in the payroll tax. As of August 2014, Standard & Poor’s Economics was projecting the national savings rate to average 5.1% in 2014.
The most recent lowest national savings rate was 2.4% in 2007. (The all-time lowest rate was 1.6% set in 2005, and the historical average is 6.9%.) In December 2013, the national savings rate was 3.9%, down from 4.3% in November, and still well below the 8.7% rate set in December 2012.
After improving steadily in 2009 and 2010, consumer confidence remained range-bound in 2011 and 2012, according to the Conference Board’s Consumer Confidence Index (CCI). Aside from a few outlier months, including the recent low of 40.9 set in October 2011 (which was likely driven by political posturing over the nation’s debt ceiling) and a yearly high of 73.1 set in October 2012, consumer confidence remained in a
INDUSTRY SURVEYS RETAILING: SPECIALTY / SEPTEMBER 2014 5

rather tight range between 58.0 and 70.0. In January 2013, the CCI reading was 58.4, down from 66.7 in December 2012. However, the index improved steadily in 2013, reaching a then high of 82.1 in June 2013.
Although the index slipped to 80.7 in January 2014, consumer confidence unexpectedly climbed to 92.4 in August 2014, the highest level in almost seven years. This can be attributed to the improving labor market and stock prices advancing to record highs. That said, while the August 2014 reading is significantly higher than the historic low posted in February 2009 (when it stood at 25.3), it still needs to improve to achieve
confidence levels synonymous with expansions: consumer confidence averages 102 in economic expansions and 71 during recessions. In our view, the improving labor market, the strong stock market, and recovering home prices have boosted optimism. Improved consumer confidence could lead to stronger spending in 2014.
HOUSING RECOVERY LACKS MOMENTUM
The US housing market continued to recover in 2014 after improving in 2013, and it is probably safe to say that we are now well off the bottom. However, we think that the housing market remains weak compared with historical averages, and there are numerous reasons to suggest that we will not return to normalized levels in the near term. While Standard & Poor’s Economics is projecting that the pace of housing recovery will accelerate again in 2014 after strong but lower growth in 2013 (versus 2012), we think the weak macroeconomic drivers of the US economy could foreshadow a choppy recovery.
For instance, the pace of new-home sales fell to the slowest in four months in July 2014, signaling that the real estate industry still lacks the vigor to spur faster growth in the economy. Sales of new residential homes in July were 412,000 units (seasonally adjusted annual rate, or SAAR), 2.4% below the June 2014 rate of 422,000, but 12.3% above the July 2013 estimate of 367,000. These figures represent a significant improvement from the historic low of 274,000 new homes sold in August 2010.
Sales of existing homes (including single-family homes, townhomes, and condominiums) increased for the fourth straight month, hitting their highest pace in 2014 and climbing to an annual SAAR pace of 5.15 million in July, according to the National Association of Realtors (NAR), an industry trade group. Monthly sales growth of single-family homes was weaker than multifamily homes in 2011 and into early 2012. Since then, sales of single-family homes have accelerated and show year-over-year increases similar to multifamily homes. In July 2014, single-family home sales increased 2.7% to a SAAR of 4.55 million, from 4.43 million in June; however, it remained 4.2% below the 4.75 million pace a year ago. The drop in single-family homes followed the drop in overall sales of existing homes, which fell 4.3% to a SAAR of 5.38 million.
Annual housing start numbers provide another indicator of improvement in the housing market. In 2012, housing starts increased at an accelerated pace, rising 28.1% to 780,000 units from 608,800 in 2011. According to the US Department of Commerce, housing starts increased to 923,400 units in 2013, up 18.4% from 2012, and the highest annual total since 2007. In July 2014, housing starts increased to a SAAR of 1.09 million—15.7% above the revised June estimate of 945,000, and 21.7% above the July 2013 rate of 898,000. As of August 2014, Standard & Poor’s Economics expected housing starts to increase by about 10% in 2014 to 1,020,000 units.
The US Federal Reserve Board (the Fed) has tried to provide an impetus to the US housing markets by purchasing $40 billion of agency mortgage-backed securities (MBS) in each month since September 2012. It
Chart H07 Consumer conf. vs. retail sales
20
40
60
80
100
120
140
250
275
300
325
350
375
400
2003 04 05 06 07 08 09 10 11 12 13 *2014
CONSUMER CONFIDENCE VS. RETAIL SALES
Retail sales (left scale)Consumer confidence index (right scale)
*Data through July.Sources: US Department of Commerce; The Conference Board.
(Billions of dollars) (1985=100)
6 RETAILING: SPECIALTY / SEPTEMBER 2014 INDUSTRY SURVEYS
also continued its policy of increasing the average maturity of its securities’ holdings by investing $45 billion per month in long-term securities, and reinvesting the principal component in agency MBS. These combined actions boosted the Fed’s balance sheet by $85 billion per month, which in turn helped reduce the 30-year fixed rate mortgage to a historic low of 3.31% for the week ending November 21, 2012. This was the lowest rate since the Federal Home Loan Mortgage Corp. (Freddie Mac) first started recording mortgage rates in 1971. These efforts have led to improving home sales and housing starts. However, when the Fed in mid-2013 started hinting that it might taper off its latest quantitative easing program, interest rates began to rise. In June 2013, mortgage rates increased rather sharply, with the average rates on 15-year loans rising to 3.17% and on 30-year loans rising to 4.07%, from 2.72% and 3.54%, respectively, in May.
Then, on December 18, 2013, the Fed announced that it would begin tapering its monthly bond buying by $10 billion a month, reducing the total amount purchased to $75 billion a month. In January 2014, the average rate on the 15-year loan remained flat at 3.48% compared with December 2013, while 30-year loan rate averaged 4.43% versus 4.46% in December 2013.
Furthermore, on January 29, 2014, the Fed announced that it would taper the bond-buying program by another $10 billion, bringing down the total to $65 billion a month starting in February. It cited the strengthening US economy and improved labor market conditions as reasons for taking this action. According to data from Freddie Mac, the 30-year fixed mortgage rate averaged 4.28% for the week ended February 13, 2014, compared with 4.41% for the week ended January 16, 2014. The 15-year fixed mortgage rate averaged 3.33% in the week ended February 13, 2014, down from 3.45% for the week ended January 16, 2014.
The Federal Reserve announced in a July 2014 policy statement that it would reduce its monthly bond purchases to $25 billion, following a series of $10 billion cuts during the March, April, and June 2014 meetings. The 30-year fixed mortgage rate averaged 4.10% for the week ended August 21, 2014, remaining almost the same as the prior week and month. Meanwhile, the 15-year fixed mortgage rate averaged 3.23% in the week ended August 21, 2014, almost the same as the recorded 3.24% in the prior week, and slightly down from the 3.26% for the week ended July 24, 2014.
Household formation remains key to sustainable housing improvement Demand for housing is driven by three factors: investors; people trading up or trading down, which increases housing turnover, but creates no net change in demand; and household formation. In our view, much of the increased demand that we saw in 2012 was driven by investor demand, which tends to be highly variable and sensitive to changes in interest rates. Many Wall Street firms invested in distressed housing in 2012 with the goal of renting these homes out. After all, access to capital for them is easy, and the rental market is strong. In 2013, investor demand slowed down (compared with 2012), but remained strong. Although we expect investor demand to remain strong in 2014, we would become more cautious should interest rates rise meaningfully or if cap rates were to fall. It’s quite possible that investment demand, which tends to be fickle, could not only slow, but these very same buyers might even become sellers.
We think the key to a sustainable housing recovery is household formation. Population growth can certainly help household formation, but is likely to average only 1% growth annually, the average over the past decade. Therefore, in our opinion, the key to household formation lies with the labor market, as quality jobs will give more people the ability to afford new homes.
As we mentioned earlier in this section, job growth looks decent on the surface, with 9.0 million jobs created since employment troughed in December 2009. However, these numbers mask some of the more troubling issues, such as the labor force participation rate and the employment-to-population ratio showing no improvement over the past three years. Making matters worse is that the quality of jobs has been poor, and not conducive to increased household formation.
Some of that weakness is reflected in wage growth, which has averaged only about 2% since late 2009. However, a greater reflection of the weakness is the fact that many jobs created go to low-wage earners.
INDUSTRY SURVEYS RETAILING: SPECIALTY / SEPTEMBER 2014 7

Lending standards remain tight Despite the Fed’s best efforts to boost demand, stringent lending practices by the banks remain a hurdle for further improvement in the housing market. While it became common practice in the last decade to purchase a house with a down payment of 5% or less, banks in today’s environment are often asking homebuyers for a 20% down payment. In addition, banks are requiring higher Fair Isaac Credit Organization (FICO) scores in order for prospective homebuyers to qualify for a mortgage. In fact, a NAR spokesperson suggested that a credit score of 720 in recent years would have all but guaranteed getting a loan. Nowadays, a homebuyer with a score below 755 might be turned away. Largely as a result of banks’ tighter lending standards, contract failures for existing-home sales reached record highs in the latter part of 2011, surging to 33% in both November and December, up from 9% in both November and December 2010. (The NAR no longer publishes this figure.)
While bank-lending standards may have eased slightly over the past year, they remain prohibitive. Moreover, the Federal Housing Administration (FHA), which backs approximately 30% of new loans (most of which are for lower-income families), has actually tightened its standards. This action was made necessary due to the poor level of reserves at the FHA as a result of the bad loans it made. While the FHA is hopeful that it can avoid a taxpayer-funded bailout as long as the housing market continues to recover, it appears to us that lending standards will remain extremely tight over the near term.
Home inventories, foreclosures have fallen, but remain above historical averages The inventory of existing homes for sale in June 2014 rose 3.5% to 2.37 million, which represented a 5.5-month supply at the existing sales pace, according to the NAR, and a considerable drop from the 6.4 months of supply reported in June 2012. The current inventory level is almost consistent with the historical average, which is considered to be about six months of supply.
Despite the decline in inventory, this number does not take into account the “shadow” inventory that banks are holding on their books. (Shadow inventory is defined as real estate owned by banks and mortgage companies as a result of foreclosures and other actions, such as deeds in lieu of foreclosure, as well as real estate that is at least 90 days delinquent.) According to Black Knight Financial Services, formerly known as Lender Processing Services, a leading provider of mortgage and consumer loan processing services, as of July 2014, 3.79 million properties were either delinquent on their mortgages by 30 days or more, or in the process of foreclosure. This includes 935,000 homes that are currently in some stage of foreclosure. On a positive note, the number of foreclosures has been declining. According to RealtyTrac, a web-based firm that tracks and markets foreclosed homes, July 2014 was the 46th consecutive month in which US foreclosure activity was down on a year-over-year basis. As of the first half of 2014, total foreclosure filings amounted to 613,874, a 19% decrease from the previous six months and 23% below the first half of 2013.
In full year 2013, there were 1,361,795 foreclosure filings, which were down 26% from 2012 and down 53% from the peak in 2010. Furthermore, banks have been releasing foreclosed properties from their inventories at a slow trickle, which has reduced the number of distressed homes available for sale. In fact, there were only 1.84 million foreclosure filings in 2012, a 3% decline from 1.9 million filings in 2011 and a 36% decline from the record 2.9 million filings in 2010. That said, the number of delinquent mortgages is still almost double the long-term historical average, and will likely remain an overhang on the market for years to come.
Another metric of shadow inventory is also in a corrective phase. According to Zillow, a real estate marketplace, improving home prices in the second quarter of 2014 resulted in 8.7 million homeowners remaining underwater on their mortgages—the ninth consecutive quarter that negative equity has fallen. The negative equity rate fell to 17% in the second quarter of 2014 from 23.8% a year ago, and is expected to fall to 14.9% in the second quarter of 2015. Of course, some of these homeowners have been wanting to sell their homes for years, but couldn’t do so when they were underwater, so a continuing rise in prices will naturally bring more sellers forward. This should boost supply and keep the market from overheating again anytime soon.
8 RETAILING: SPECIALTY / SEPTEMBER 2014 INDUSTRY SURVEYS

HOME IMPROVEMENT AND HOME FURNISHING RETAILERS CONTINUE THEIR RECOVERY
While home improvement retailers reported significantly improved results in recent quarters, we think that macroeconomic concerns will challenge this group to grow sales in 2014. Homeowners tend to spend more to maintain and improve homes than do renters. The US Census Bureau reported that the homeownership rate declined to a 19-year low as rising prices and tight credit kept buyers out of the property market in the second quarter of 2014. Home ownership declined to 64.7%, down from the 64.8% rate observed in the previous three months, a level not seen since the second quarter of 1995. This figure had been trending lower over the past several years, and is now slightly below the long-term historical average of 65.4%.
Positive signs for housing-related retailers The housing slump crimped both the top and bottom lines of many specialty retailers, but the recent recovery in the housing market has aided the performance of the home improvement retailers. Net income for Home Depot rose 13.5% to $3.4 billion, in its second quarter financial results. Comparable-store sales increased 5.8% in the second quarter of 2014. Lowe’s, No. 2 in home improvement behind Home Depot, reported a 4.4% increase in comparable-store sales in the second quarter of 2014.
Will refinancing activity decline? With mortgage rates pushed to historic lows in 2012, refinancing activity perked up significantly during that year and through mid-2013. In fact, according to the Mortgage Bankers Association (MBA), a real estate finance industry trade group, refinancing activity increased 58% in 2012 from 2011 levels. However, the Fed tapering announcement in May 2013 led to an increase in mortgage rates, which resulted in a decline in refinancing activity. According to the MBA, refinancing applications have fallen in most weeks since then, hitting a five-year low in the week ended December 20, 2013. Historically, about 40% of the cash generated through home equity loans and refinancing has gone toward home improvement projects, so we think that the large increase in refinancing activity was a major tailwind for Home Depot and Lowe’s in 2012.
MBA published in its June 2014 forecast commentary that applications for home purchase mortgages are roughly 15% below last year’s pace, while refinance applications are almost 60% slower than in 2013.
We are much less sanguine on refinancing prospects going forward, as we think the majority of homeowners that are willing or able to refinance their homes have already done so. In addition, the recent hike in interest rates has further limited this activity.
Following a 12% decline in 2009, spending on home improvements rose 1.2% to $259.5 billion in 2010 and 3.8% to $269.4 billion in 2011, according to estimates from IHS Global Insight Inc., an economic research firm, and the Home Improvement Research Institute (HIRI), an industry trade group. We think that nesting has led to purchases of home décor or smaller home renovations, as consumers are less likely to move in the current environment. According to its latest long-term forecast released in 2014, HIRI estimated that sales of total home improvement products would increase 6.5% in 2014. Further, the HIRI expected sales to increase by an average 6.0% for both 2015 and 2016. While we view these assumptions to be slightly optimistic, we do expect improving labor and housing markets to boost home improvement spending over the coming years.
CONSUMER ELECTRONICS FIRMS SQUEEZED BY PRICE COMPETITION
Over the last several years, the consumer electronics industry had been enjoying a wave of demand in the US, as consumers traded up to flat-panel TVs, MP3 players, and digital cameras. In a January 2014 report by Consumer Electronics Association (CEA), an industry trade group, smartphone, UHD displays, and tablet computers, are expected to continue leading the surge in demand that had begun in 2011 and 2010, following a lackluster 2009. Overall, US consumers are expected to spend $208 billion on consumer electronics products in the US, an increase of 2.4% over 2013.
According to Strategy Analytics’ report, “United States Smart TV Vendor Market Share: Q4 2013,” Samsung had the largest chunk of smart TV sales with a 29.6% market share, followed by Vizio with
INDUSTRY SURVEYS RETAILING: SPECIALTY / SEPTEMBER 2014 9

24.4% market share. Japanese TV makers saw a decline of their market shares, with Sony dropping 3% year-on-year, and Panasonic, which has nearly 7% of the market share, dropping 1%.
Mass merchants, online retailers pressuring specialty retailers on price Although product demand remains relatively strong, there is fierce price competition among specialty electronics retailers, as well as between those retailers and discount stores. Wal-Mart Stores Inc., the discount giant and the world’s largest retailer, continues to expand its selection of consumer electronics. In addition, warehouse club stores such as Costco Wholesale Corp., best known for selling everyday items in bulk, are offering more electronics. Both Walmart and Costco often sell electronics for less than the specialty retailers do.
Walmart, which emphasizes its low prices, sells sophisticated flat-panel televisions, often at a discount compared with electronics retailers such as Best Buy. The company, which remodeled the electronics departments of its existing stores in 2006, continues to add to its wide selection of high-definition TVs and home-theater systems.
In addition, Amazon.com has seen tremendous growth in electronics, posting a 23% sales increase in its electronics and other general merchandise category in 2013, following a whopping 35% increase in 2012. The category grew 56% in 2011 and 66% in 2010. More and more consumers are becoming comfortable with purchasing electronics from Amazon, and the online retailer’s prices are often lower than those of most specialty retailers. We expect continued market share gains for mass merchants and online retailers in electronics, which will likely lead to pricing pressure and lower gross margins at specialty retailers.
INDUSTRY OUTLOOK
As of August 2014, our outlook for the specialty stores sub-industry remains neutral. Given soft employment trends and higher taxes, albeit partially offset by slightly looser credit, we estimate that total consumer spending will increase by 2.7% in 2014, after the 2.0% advance recorded in 2013. Although lackluster spending is relatively in line with the projected rate of overall real GDP growth, we think this will have an adverse impact on specialty retailers. Since this sub-industry is diverse—ranging from high-end stores selling luxury items, to those selling less discretionary items such as automotive parts—our outlook varies according to the unique prospects of individual companies and/or groups that constitute the sub-industry.
We expect mixed results for the specialty retailers in 2014. In our view, auto parts retailers are facing positive demographic trends and should post solid results, as consumers prefer maintaining current vehicles than purchasing new ones.
Our outlook for higher-end luxury and jewelry stores is also positive, as the wealthy have been relatively insulated from the economic challenges that have been affecting consumers. Pet supplies retailers are also expected to post relatively strong results, brought about by solid industry trends. However, expected weakness in consumer spending has resulted in us being somewhat cautious regarding other discretionary stores (such as bookstores and arts and crafts). In addition, office supply retailers are likely to struggle amid slowdown in spending by small business and the government. For the longer term, we expect superstore growth to slow with the prevalence of Internet services that enable US households to shop online. Favored products for Internet shopping include computers, books, apparel, electronics, and toys. Overall, we think that companies with a strong brand name, aggressive brand support, and a mix of traditional stores and websites will likely be solid performers in the long run.
Year to date through September 5, 2014, the S&P Specialty Stores Index declined 9.2%, vis-à-vis the 8.2% gain in the S&P 1500 Index. In contrast, this sub-industry outperformed, increasing 41.7% compared with a 30.1% rise in the S&P 1500 in 2013.
10 RETAILING: SPECIALTY / SEPTEMBER 2014 INDUSTRY SURVEYS

INDUSTRY PROFILE
Stores that specialize in a certain something
Specialty retail covers a diverse range of sub-industries and product classifications. Retailers in this industry typically sell either a single category of merchandise, such as shoes or office supplies, or carry a few closely related categories, such as home-related items (i.e., kitchen and bath ware). Other major specialty product categories include automobiles, furniture and appliances, apparel, building materials, jewelry, eyewear, consumer electronics, books, toys, pet supplies, sporting goods, gasoline service stations, and others.
Specialty retail is also a big industry, accounting for roughly 89% of the $2.6 trillion in US retail sales generated as of June 2014. Based on US Department of Commerce data, motor vehicle and parts dealers constitute the
largest single segment in specialty retail, with sales of $522.0 billion, or 23.0% of total retail sales.
Other large segments include food and beverage stores, such as supermarkets ($277.6 billion); gasoline stations ($271.1 billion); non-store retailers ($226.4 billion); building materials, garden equipment, and supplies dealers ($163.9 billion); health and personal care stores ($145.4 billion); clothing and clothing accessory stores ($115.1 billion); miscellaneous store retailers ($56.8 billion); furniture and home furnishing stores ($47.4 billion); electronics and appliance stores ($48.5 billion); and sporting goods, hobby, book, and music stores ($38.2 billion) as of June 2014. [Note: This report excludes supermarkets and drugstores, automobile dealers, gas stations, clothing and clothing accessory stores, and food services and drinking
Table B05: Total US retail trade
TOTAL US RETAIL TRADE(In billions of dollars)
10-YEARYR. END -------- AS OF JUNE -------- % CHG. GROWTH
2013 2004 2013 2014 2013-2014 RATE†Retail trade 4,528.2 1,664.9 2,195.4 2,272.9 3.5 3.2GAFO, total* 1,228.7 456.2 573.2 578.3 0.9 2.4Automotive group 978.1 331.3 364.3 393.1 7.9 1.7Furniture & appliance group 202.4 21.6 21.5 21.9 1.7 0.1Building materials, garden equip. & supplies 312.4 8.9 10.1 10.7 5.8 1.8Food group 649.1 14.8 21.7 22.9 5.2 4.4
Liquor stores 47.2 154.1 274.6 271.1 (1.2) 5.8Health & personal care stores 281.6 84.6 113.7 115.1 1.2 3.1Gasoline service stations 548.5 3.8 4.2 4.1 (0.7) 0.9Apparel group 248.6 16.4 19.2 19.8 3.3 1.9
Men's clothing stores 8.9 4.6 7.7 7.7 (1.0) 5.2Women's clothing stores 40.6 11.2 13.8 14.3 4.2 2.5Family clothing stores 97.6 11.5 14.7 15.3 4.3 2.9Shoe stores 29.9 13.1 21.0 19.3 (8.1) 3.9
Sporting goods, hobby, book, & music stores 88.1 7.7 5.5 5.1 (7.9) (4.0)General merchandise group 652.3 36.7 25.9 25.5 (1.6) (3.6)
Department stores 171.3 98.7 79.4 76.9 (3.0) (2.5)Other general merchandise stores 481.0 49.8 56.2 56.8 1.1 1.3
Miscellaneous retail stores 118.0 7.6 8.3 8.6 3.8 1.2Nonstore retailers 449.2 182.9 268.1 279.4 4.2 4.3*GAFO consists of the General Merchandise, Apparel, Furniture & Appliance, Sporting & Hobby, and Misc. Retail groups. †Computed by S&P Capital IQ.Source: US Department of Commerce.
INDUSTRY SURVEYS RETAILING: SPECIALTY / SEPTEMBER 2014 11
places, which are addressed in other S&P Capital IQ Industry Surveys, including Supermarkets & Drugstores, Autos & Auto Parts, Apparel & Footwear, and Restaurants.]
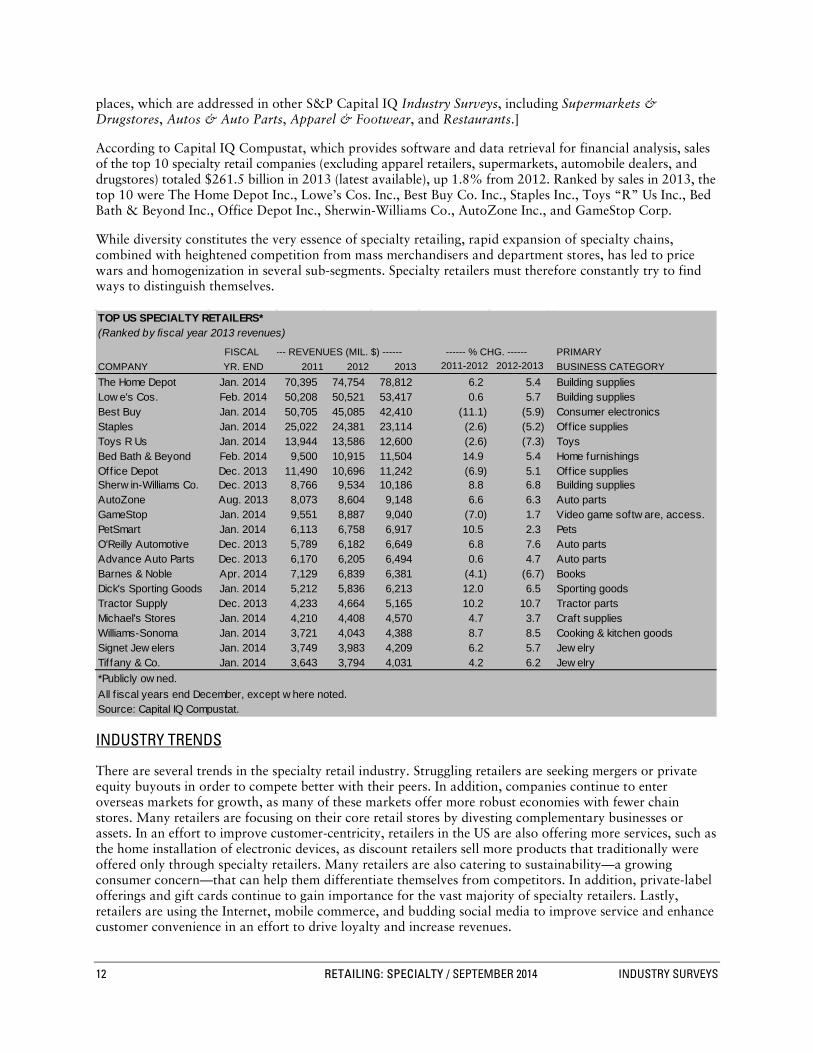
According to Capital IQ Compustat, which provides software and data retrieval for financial analysis, sales of the top 10 specialty retail companies (excluding apparel retailers, supermarkets, automobile dealers, and drugstores) totaled $261.5 billion in 2013 (latest available), up 1.8% from 2012. Ranked by sales in 2013, the top 10 were The Home Depot Inc., Lowe’s Cos. Inc., Best Buy Co. Inc., Staples Inc., Toys “R” Us Inc., Bed Bath & Beyond Inc., Office Depot Inc., Sherwin-Williams Co., AutoZone Inc., and GameStop Corp.
While diversity constitutes the very essence of specialty retailing, rapid expansion of specialty chains, combined with heightened competition from mass merchandisers and department stores, has led to price wars and homogenization in several sub-segments. Specialty retailers must therefore constantly try to find ways to distinguish themselves.
INDUSTRY TRENDS
There are several trends in the specialty retail industry. Struggling retailers are seeking mergers or private equity buyouts in order to compete better with their peers. In addition, companies continue to enter overseas markets for growth, as many of these markets offer more robust economies with fewer chain stores. Many retailers are focusing on their core retail stores by divesting complementary businesses or assets. In an effort to improve customer-centricity, retailers in the US are also offering more services, such as the home installation of electronic devices, as discount retailers sell more products that traditionally were offered only through specialty retailers. Many retailers are also catering to sustainability—a growing consumer concern—that can help them differentiate themselves from competitors. In addition, private-label offerings and gift cards continue to gain importance for the vast majority of specialty retailers. Lastly, retailers are using the Internet, mobile commerce, and budding social media to improve service and enhance customer convenience in an effort to drive loyalty and increase revenues.
Table B03: Top specialty retailers
TOP US SPECIALTY RETAILERS*(Ranked by fiscal year 2013 revenues)
FISCAL --- REVENUES (MIL. $) ------ ------ % CHG. ------ PRIMARY COMPANY YR. END 2011 2012 2013 2011-2012 2012-2013 BUSINESS CATEGORYThe Home Depot Jan. 2014 70,395 74,754 78,812 6.2 5.4 Building suppliesLow e's Cos. Feb. 2014 50,208 50,521 53,417 0.6 5.7 Building suppliesBest Buy Jan. 2014 50,705 45,085 42,410 (11.1) (5.9) Consumer electronicsStaples Jan. 2014 25,022 24,381 23,114 (2.6) (5.2) Office suppliesToys R Us Jan. 2014 13,944 13,586 12,600 (2.6) (7.3) ToysBed Bath & Beyond Feb. 2014 9,500 10,915 11,504 14.9 5.4 Home furnishingsOffice Depot Dec. 2013 11,490 10,696 11,242 (6.9) 5.1 Office suppliesSherw in-Williams Co. Dec. 2013 8,766 9,534 10,186 8.8 6.8 Building suppliesAutoZone Aug. 2013 8,073 8,604 9,148 6.6 6.3 Auto partsGameStop Jan. 2014 9,551 8,887 9,040 (7.0) 1.7 Video game softw are, access.PetSmart Jan. 2014 6,113 6,758 6,917 10.5 2.3 PetsO'Reilly Automotive Dec. 2013 5,789 6,182 6,649 6.8 7.6 Auto partsAdvance Auto Parts Dec. 2013 6,170 6,205 6,494 0.6 4.7 Auto partsBarnes & Noble Apr. 2014 7,129 6,839 6,381 (4.1) (6.7) BooksDick's Sporting Goods Jan. 2014 5,212 5,836 6,213 12.0 6.5 Sporting goodsTractor Supply Dec. 2013 4,233 4,664 5,165 10.2 10.7 Tractor partsMichael's Stores Jan. 2014 4,210 4,408 4,570 4.7 3.7 Craft suppliesWilliams-Sonoma Jan. 2014 3,721 4,043 4,388 8.7 8.5 Cooking & kitchen goodsSignet Jew elers Jan. 2014 3,749 3,983 4,209 6.2 5.7 Jew elryTiffany & Co. Jan. 2014 3,643 3,794 4,031 4.2 6.2 Jew elry*Publicly ow ned. All f iscal years end December, except w here noted.Source: Capital IQ Compustat.
12 RETAILING: SPECIALTY / SEPTEMBER 2014 INDUSTRY SURVEYS
MERGERS AND PRIVATE EQUITY DEALS
Declining sales, profitability, and market share have forced some specialty retailers in diverse businesses to seek out merger opportunities and private equity deals. In so doing, these retailers hope to achieve cost and revenue synergies, to focus on longer-term strategic initiatives without exposing themselves to the criticism of Wall Street with its near-term focus, and to attain a wider global presence to compete better in this challenging environment.
According PWC’s US retail and consumer deals insights: Q1 2014 update, private equity deals increased for the retailing industry. This was led by equity firm Cerberus Capital Management’s $85 billion acquisition of Safeway Inc., a California-based owner and operator of grocery stores. Another notable transaction is JoS. A. Bank Clothiers’ agreement to acquire Eddie Bauer—a Washington-based manufacturer and retailer of sports, outwear, and accessories—from Golden Gate Capital for $869.6 million.
Speedway to acquire Hess Retail Holdings. On May 22, 2014, Marathon Petroleum Corp. announced that its subsidiary, Speedway LLC, has signed a definitive agreement with Hess Corporation to acquire Hess Retail Holdings LLC. This transaction positions Speedway as one of the largest company-owned-and-operated convenience store chains in the US. The total consideration is $2.9 billion and is expected to be funded with a combination of debt and available cash, and is anticipated to close late in the third quarter of 2014. The combined business between Speedway and Hess, based on 2013 financials, will reach around $27 billion in revenues and $4.8 billion worth of annual merchandise sales at more than 2,700 retail locations.
Two office supply retailers merge. On November 5, 2013, OfficeMax and Office Depot merged in an all-stock deal. On a pro forma basis, the combined company (which will operate under the name Office Depot) would have annual sales of $18 billion. When the two companies announced their proposed merger in February 2013, they said they expected to achieve $400 million–$600 million in annual cost synergies by the third year following the closing of the transaction. OfficeMax and Office Depot also claimed that their merger would result in increased scale and competitiveness, give them a wider global presence, improve the customer experience, and accelerate innovation. Office Depot, in its first earnings call after the merger, reflected impacts of the merger and reported an unexpected fourth-quarter adjusted loss and disappointing sales. We think that the merged entity will be more able to compete with Staples, but the latter also reported disappointing sales and bottom line earnings in 2013. In our view, this raises concerns about the future of the office supply industry.
Advance Auto Parts. Despite the presence of a strong industry tailwind and a solid balance sheet, in our view, Advance Auto Parts Inc. was the source of takeover speculation in late 2012, when the company hired Blackstone Group LP to assess its strategic options. Buyout firms such as Carlyle Group LP, Leonard Green & Partners LP, KKR & Co. LP, and Clayton Dubilier & Rice LLC expressed interest in the limited auction process that was run by the company. However, in November 2012, the company stopped the auction as it failed to attract bids meeting the minimum price expectation. We think the company’s decision to explore a sale was initiated in an attempt to boost shareholder value at a time when its shares were being sold off due to unsatisfactory quarterly results. Then, on October 16, 2013, the company entered into a definitive agreement to acquire General Parts International Inc. in an all-cash transaction for $2.04 billion. The acquisition was completed on January 2, 2014. The combined company is expected to generate $9.30 billion in annual sales and would be the largest auto parts retailer in North America.
Barnes & Noble. On February 25, 2013, Barnes & Noble Inc. announced that Leonard Riggio, its chairman and largest stockholder (with about 30% of the stock), had proposed buying all the assets of the company’s retail business, including, Barnes & Noble Booksellers Inc. and barnesandnoble.com. Excluded from the deal was NOOK Media LLC (comprising the digital and college businesses), which has performed poorly in recent quarters. In August 2013, Riggio suspended his plans to acquire the company in order to focus on the business at hand, but sold two million shares in December, lessening his stake in the company from 30% to 26%. In April 2014, Riggio dropped his stake to 20% by selling another 3.7 million shares ($17.30 per share) amounting to $64 million. The deal was, according to Riggio, a part of a “long-term financial and estate planning.” The chairman announced that he has no plans to sell more shares in 2014.
INDUSTRY SURVEYS RETAILING: SPECIALTY / SEPTEMBER 2014 13

For the fourth quarter of fiscal 2014, ended May 3, the Nook segment posted a 22% decline to $87 million. Digital content sales fell 19% to $62 million. In June 2014, Barnes & Noble announced its plan to split off its Nook e-reader division after years of heavy investing but struggling to remain profitable. The company expects the separation to be complete by the end of the first quarter of 2015.
STORE RATIONALIZATION AND CONTINUED FOCUS ON THE CORE
Over the past several years, a number of struggling retailers decided to sell off or shut down their non-core operations in an effort to streamline their businesses. In addition, the challenging economy spurred many companies to close underperforming or unprofitable locations. More recently, as the worst of the recession has passed, store closures have become less frequent, and many chains are slowly starting to expand again. We note, however, that despite the availability of attractive leasing rates, expansion has remained relatively slow.
Home Depot. In August 2007, Home Depot sold its HD Supply business to a group of private equity firms. HD Supply, which was a conglomeration of several businesses purchased by Home Depot earlier in the decade, was thought to be complementary to the retail stores. However, faced with a slump in the housing market, along with what we had viewed as waning customer service and employee morale at its core retail stores, the company decided to focus all of its efforts and capital on the revitalization of its retail store base.
While we think customer service and employee morale have since rebounded modestly, Home Depot’s focus on its core operations has only grown stronger over the past five years. In January 2009, the company made the decision to shutter all of its non-core retail stores, including its EXPO, YardBIRDS, Design Center, and HD Bath stores. In September 2012, the company announced that it would shut down all of its seven big-box home improvement stores in China and focus only on its specialty stores and online offerings in that country. In both 2011 and 2012, Home Depot opened four net new stores (including international locations), after closing 30 net stores in 2010. Through the third quarter of 2013, the company opened four new stores (three in Mexico and one in Puerto Rico). Furthermore, the company, in a conference call on December 11, 2013, stated that it plans to open eight new stores (primarily in Mexico) in 2014. However, these figures pale in comparison with the 157 net new stores opened in 2005.
As of the end of the second quarter of 2014, Home Depot operated 2,264 retail stores in all 50 states, the District of Columbia, Puerto Rico, U.S. Virgin Islands, Guam, and Mexico, as well as in 10 Canadian provinces. For decades, Home Depot has excelled at the traditional retail expansion model by adding new locations. However, the company is now tapping into e-commerce in order to put a hard stop on store growth and focusing on online distribution centers. Although Home Depot’s online sales accounted for only 3.5% of its $78.8 billion sales in 2013, the sales in this category is growing faster than the rest, so the company is investing $1.5 billion in 2014 for supply chain and technology improvements in an attempt to improve product delivery.
Lowe’s. Until 2011, Lowe’s had followed a store expansion plan that was notably stronger than Home Depot’s. Then, in October 2011, Lowe’s announced that it would be closing 20 underperforming locations, and would only be opening approximately 10–15 new stores per year in North America going forward, versus previous growth of 30 stores annually. We think that the US market is relatively saturated with home improvement stores, and that much of this store unit growth will come from Canada and Mexico. Should the housing market continue its recovery, however, there is a chance that future expansion will accelerate. Best Buy. The traffic to Best Buy’s brick and mortar stores has continued to decline due to the shift in consumer behavior toward purchasing online. In November 2011, Best Buy announced that it would shutter its 11 big-box UK stores. We think this decision was made primarily because of the challenging economic environment in Europe, but also reflects a shift in consumer preferences to mobile electronic goods such as tablets, smartphones, and e-readers, which require less store space. In January 2013, Best Buy announced that it would close down eight Future Shop stores and seven big-box stores in Canada, in line with its transformation strategy (called the Renew Blue plan) designed to grow business, enhance the in-store customer experience, and leverage omni-channel capabilities. According to Best Buy, this move would result
14 RETAILING: SPECIALTY / SEPTEMBER 2014 INDUSTRY SURVEYS
in layoffs affecting around 5% of the company’s workforce in Canada. In late April 2013, Best Buy announced an agreement to sell its 50% stake in Best Buy Europe, to Carphone Warehouse, its joint venture partner, for approximately $775 million. With this step, Best Buy put an end to its five-year association with Carphone Warehouse. Furthermore, at a shareholders’ meeting in June 2013, the company noted that it had closed seven stores in the US and 16 stores in Canada since the third quarter of 2012. These initiatives were taken as a result of the company’s cost reduction and capital allocation program. As of August 2014, the strategy has cut operational costs by approximately $765 million.
Office Depot. In December 2008, Office Depot announced that it would close 112 underperforming retail stores in North America and reduce new store openings in 2009 to around 20 (from a previous estimate of 40). The economy failed to improve for office supply retailers, and Office Depot ended up closing 121 stores and opening only six in 2009. The recession hit office supply retailers particularly hard, and Office Depot’s actions reflected the need to conserve cash in this environment. Office Depot closed 16 net stores in 2011 and 19 net stores in 2012 in its North American retail division. Through 2013, the company closed 33 net stores and opened only four new stores in the North American retail division. We expect the company will look to close additional unprofitable locations in future years. Since the completion of the merger with Office Max, Office Depot operates more than 2,000 stores in total. The company announced that it would close at least 400 locations in the US to reduce overlap between the two businesses. The move is expected to save the company $75 million a year by the end of 2016.
Pier 1 Imports. This retailer saw its market share in the home furnishings category decline significantly throughout the economic downturn due to increased competitive pressures, the company’s merchandising miscues, and a slowdown in consumer spending on home-related goods. To combat this slump, the company streamlined its focus, and has been regaining market share over the past few years. Pier 1 rationalized its store base throughout 2007 by closing 36 Pier 1 stores; it closed all 36 of its Pier 1 Kids stores later that year. In March 2006, the company sold its UK-based subsidiary, The Pier Retail Group Ltd. In 2009, despite successfully renegotiating many lease contracts, Pier 1 still closed 38 stores; in 2010, it closed eight stores (net). In 2011, it opened only six net new stores, followed by 10 net new stores in 2012. At November 30, 2013, the company operated 993 Pier 1 Imports stores in the US and 81 in Canada, and was projecting only limited store growth in future years.
Early returns of Pier 1’s store rationalization are favorable: when the company reported results for fiscal 2010 (ended February 2010), it posted its first yearly comparable-store increase in seven years. Fiscal 2011
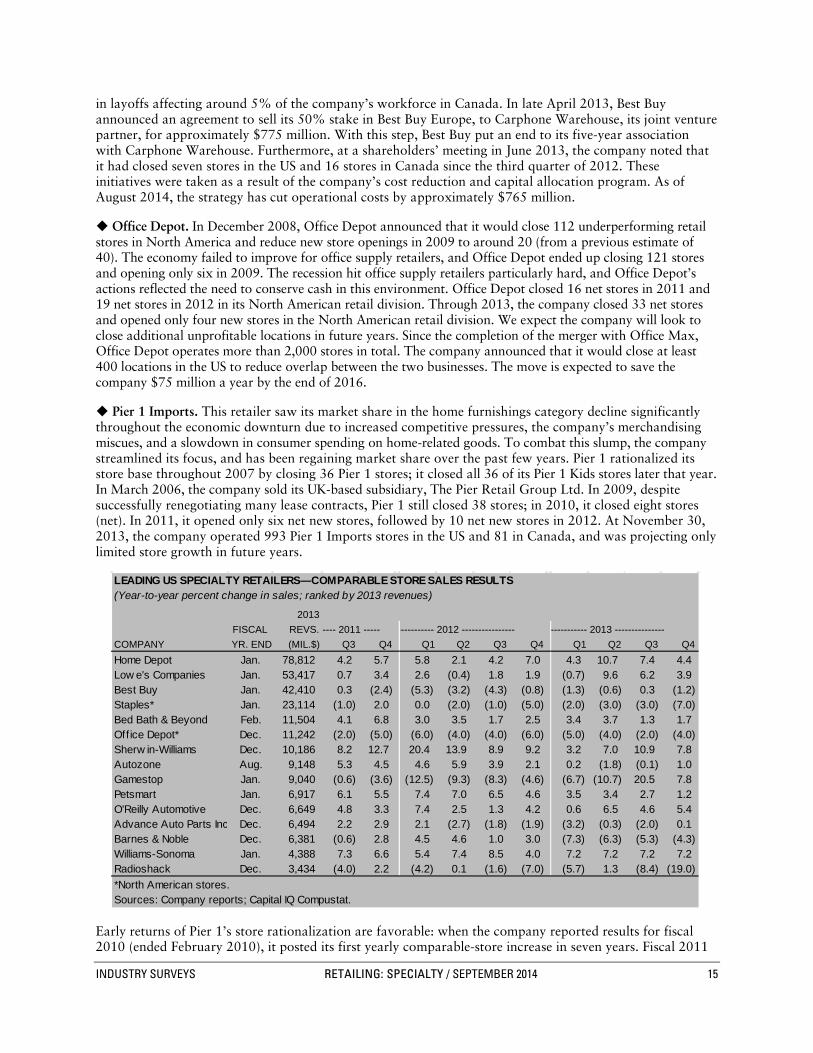
Table B02: LEADING US SPECIALTY RETAILERS—COMPARABLE STORE SALES RESULTS
LEADING US SPECIALTY RETAILERS—COMPARABLE STORE SALES RESULTS(Year-to-year percent change in sales; ranked by 2013 revenues)
2013FISCAL REVS.----- 2011 -----
COMPANY YR. END (MIL.$) Q3 Q4 Q1 Q2 Q3 Q4 Q1 Q2 Q3 Q4Home Depot Jan. 78,812 4.2 5.7 5.8 2.1 4.2 7.0 4.3 10.7 7.4 4.4Low e's Companies Jan. 53,417 0.7 3.4 2.6 (0.4) 1.8 1.9 (0.7) 9.6 6.2 3.9Best Buy Jan. 42,410 0.3 (2.4) (5.3) (3.2) (4.3) (0.8) (1.3) (0.6) 0.3 (1.2)Staples* Jan. 23,114 (1.0) 2.0 0.0 (2.0) (1.0) (5.0) (2.0) (3.0) (3.0) (7.0)Bed Bath & Beyond Feb. 11,504 4.1 6.8 3.0 3.5 1.7 2.5 3.4 3.7 1.3 1.7Office Depot* Dec. 11,242 (2.0) (5.0) (6.0) (4.0) (4.0) (6.0) (5.0) (4.0) (2.0) (4.0)Sherw in-Williams Dec. 10,186 8.2 12.7 20.4 13.9 8.9 9.2 3.2 7.0 10.9 7.8Autozone Aug. 9,148 5.3 4.5 4.6 5.9 3.9 2.1 0.2 (1.8) (0.1) 1.0Gamestop Jan. 9,040 (0.6) (3.6) (12.5) (9.3) (8.3) (4.6) (6.7) (10.7) 20.5 7.8Petsmart Jan. 6,917 6.1 5.5 7.4 7.0 6.5 4.6 3.5 3.4 2.7 1.2O'Reilly Automotive Dec. 6,649 4.8 3.3 7.4 2.5 1.3 4.2 0.6 6.5 4.6 5.4Advance Auto Parts Inc Dec. 6,494 2.2 2.9 2.1 (2.7) (1.8) (1.9) (3.2) (0.3) (2.0) 0.1Barnes & Noble Dec. 6,381 (0.6) 2.8 4.5 4.6 1.0 3.0 (7.3) (6.3) (5.3) (4.3)Williams-Sonoma Jan. 4,388 7.3 6.6 5.4 7.4 8.5 4.0 7.2 7.2 7.2 7.2Radioshack Dec. 3,434 (4.0) 2.2 (4.2) 0.1 (1.6) (7.0) (5.7) 1.3 (8.4) (19.0)*North American stores. Sources: Company reports; Capital IQ Compustat.
----------- 2012 ---------------- ------------ 2013 ---------------
INDUSTRY SURVEYS RETAILING: SPECIALTY / SEPTEMBER 2014 15

was a fantastic year for Pier 1, with same-store sales increasing by double-digits in each of the company’s first three fiscal quarters, and ending at 11% for the year. In fiscal 2012 and 2013, the company reported same-store sales growth of 9.5% and 7.5%, respectively. Through its fiscal 2013 third quarter (ended November 30, 2013), the company registered same-store sales growth of 6.9%. We expect such sales growth to moderate in future years, but regard Pier 1 as an example of a struggling retailer that was able to successfully rationalize its store basis and merchandising focus. We think it has emerged as a significantly stronger competitor.
According to Pier 1 Imports, fiscal 2014 has been a transformational year for the company as it has evolved its business model from a board portfolio of stores to a true omni-channel retail business. E-commerce delivered 4% of total sales in its second year of implementation, and the company is on its way to achieving its targeted sales contribution of 10% by the end of fiscal year 2016.
Barnes & Noble. In fiscal 2010, Barnes & Noble closed the remainder of its mall-based B. Dalton retail stores. From a peak of around 1,000 stores in the late 1980s, B. Dalton stores have been gradually phased out over the past two decades in favor of Barnes & Noble superstores. The number of superstores peaked in fiscal 2009 at 726 stores. In recent years, the company has closed some underperforming superstores: six in fiscal 2010 (ended April 2010), 16 in fiscal 2011, 14 in fiscal 2012, and 18 in fiscal 2013. Through its fiscal 2014 third quarter (ended January 2014), the company closed 15 retail bookstores (and opened three), and closed 14 college bookstores (and opened 24). The company expects to close up to one-third of its remaining retail stores over the next decade, or about 12–20 stores per year, as consumers shift towards digital books. With its primary focus now squarely on the growth of its digital books strategy, we expect Barnes & Noble to continue to shutter superstores over the next several years. Even if Chairman Leonard Riggio changes his mind and decides to buy the retail assets of Barnes & Noble (as discussed in more detail earlier in this section), we project that the company will continue to close underperforming superstores at nearly the current pace.
Even profitable specialty retailers have been rationalizing their store bases by closing underperforming stores. We think that more often than not, retailers that employ this strategy are struggling for one reason or another and may choose to exit a store that is cash flow negative. Radio Shack, OfficeMax, and The Pep Boys—Manny, Moe & Jack are three companies that have rationalized their store bases over the last several years.
RETAILERS MOVE INTO OVERSEAS MARKETS
Seeking growth away from saturated US markets, many retailers are looking to overseas markets, especially Asia, for new store locations. International sales already account for a large chunk of some retailers’ results. In 2013, Best Buy generated 15.5% of sales overseas, while Staples generated 17.3%. Amazon.com Inc., the world’s largest Internet retailer, generated 40.1% of its 2013 sales abroad; it has continued to open distribution centers over the past several years in an effort to improve customer service and fulfillment. Data from the first half of 2014 show that Best Buy, Staples, and Amazon.com earned overseas sales of 17.6%, 38.8%, and 39.0%, respectively. While international sales are expected to increase over time, the recent pace of expansion has slowed somewhat, attributable to the sluggish economic growth in other countries, particularly the emerging markets. We think future growth in these markets may someday outpace domestic expansion.
China lures home improvement retailers, but is currently facing uncertainty China’s swelling ranks of homeowners are attracting do-it-yourself (DIY) retailers. The Home Depot Inc., the world’s biggest home improvement retailer, acquired China’s Home Way, a home improvement retailer with 12 stores in six cities, in December 2006. In that year, Atlanta-based Home Depot estimated revenue for China’s DIY market at $50 billion, and growing at a compound annual growth rate (CAGR) of 20%. China was already home to UK-based Kingfisher PLC’s B&Q home improvement chain, which entered the country in 2005 and operated 39 stores there as of November 2, 2013. According to Kingfisher estimates, China has about 393 million households, with a fast-growing urban middle class of about 130 million people. Given such growth potential, it’s no surprise that retailers are entering this market.
Still, in the DIY business, there are important differences between the US and China. Whereas many US consumers put the finishing touches on a home or replace existing fixtures, most homes in China are sold as
16 RETAILING: SPECIALTY / SEPTEMBER 2014 INDUSTRY SURVEYS

empty shells. The low cost of labor in China means many homeowners pay others to do work for them, rather than viewing home improvement as a hobby. About 70% of home improvement sales in China are related to the completion of interior space in new homes, according to Home Depot.
China’s weakening housing market over the past few of years may have diminished Home Depot’s expectations for this burgeoning market. In fact, Kingfisher estimated that the market size would be about $30.9 billion in April 2012 (latest available), less than the $50 billion Home Depot had estimated back in 2006. After much deliberation, Home Depot decided to exit the China market in September 2012. While the longer-term growth profile in that country remains attractive, the differences between the Chinese market and North American markets (along with lower profitability) ultimately proved too much to overcome, in our view.
Consumer electronics retailers more successful in China China is a growth market for consumer electronics. In May 2006, Best Buy Co. Inc. acquired a 75% stake in electronics retailer Jiangsu Five Star Appliance Co. Ltd. for $184 million, and in February 2009, was granted a business license to acquire the remaining 25% interest in Five Star for $191 million. Five Star is China’s third-largest electronics chain and, in fiscal 2013 (for the 11-month period ended January 2013), it had sales of about $1.6 billion, according to Best Buy. At the end of its fiscal 2015, first quarter (ended May 2014), Best Buy was operating 186 Five Star stores.
Best Buy is considering options for Five Star, including selling the business to withdraw from China. Partly due to its operations in China, Best Buy’s international revenue dropped 10.5% in the second quarter of 2014 on the back of a 5.8% drop in international comparable sales.
Potential for specialty retailers in India Aside from China, perhaps no other market carries the potential for future growth in specialty retail than does India. According to the India Brand Equity Foundation (IBEF), India is the fifth largest retail destination globally, and the country’s retail industry has experienced tremendous growth over the last decade. Currently estimated at around $490 billion, the overall retail market in India is expected to reach $792.8 billion by 2017 and $865 billion by 2023.
In early 2006, India began allowing foreign companies to own 51% in single-brand stores. The regulation allowed a Nike Inc. store to sell goods under the athletic company’s brand, for example, though it did not allow a multi-brand retailer such as Home Depot the same latitude. In January 2012, the Department of Industrial Policy and Promotion (DIPP) revised its position on foreign direct investment. It now permits 100% foreign direct investment in single-brand retail stores under certain conditions. Furthermore, as of September 2012, the government agreed to allow up to 51% foreign direct investment in multi-brand retail on the condition that a retailer make a minimum investment of $100 million, with 50% to be invested in back-end infrastructure. In addition, the retailer must source at least 30% of its goods from India.
According to Kroll Inc., a global risk consulting company, India’s government appears to be committed to increasing the amount of foreign direct investment in the retail sector, albeit incrementally. The government thinks such investment needs to be done at a slow pace in order not to dislocate family-run stores. However, the potential offset is that increased foreign direct investment will likely lead to abundant job creation, benefiting the country.
There are other challenges as well. Kroll thinks that retailers aiming to enter India face an inefficient supply chain and logistics. In addition, poorly written and enforced industry standards are cumbersome and difficult to follow. Lastly, suppliers are fragmented and susceptible to counterfeit products, stock-outs, and quality inconsistencies. Nevertheless, we think the benefits to retailers investing in India far outweigh the negatives, and we expect to see more companies expand there over the coming years.
Non-US Western and emerging economies see specialty retail expansion Best Buy is expanding in the more conventional, Western economies. In Canada, the company operated 137 Future Shop, 72 Best Buy, and 56 Best Buy mobile stand-alone stores at the end of its fiscal 2015 first quarter (ended May 2014). This expansion has resulted in a market share of more than 56.4% in Canada.
INDUSTRY SURVEYS RETAILING: SPECIALTY / SEPTEMBER 2014 17
Staples Inc. is another company that has pursued international expansion with vigor in recent years. In 2004, Staples acquired Officenet SA in order to gain access to Brazil and Argentina, two emerging economies in South America. That same year, the company also entered China through a joint venture with an office supply delivery business based in Shanghai, and it has since expanded its presence by launching operations in Beijing. Other forays by Staples into international markets include its entry into Taiwan in 2006 and India in January 2007 through joint ventures. The company also operates internationally—in Canada, UK, Germany, Netherlands, Portugal, China, Norway, Australia, Sweden, Finland and Australia. Other potential growth markets that bear watching include Central and Eastern Europe, as well as Central and South America. In 2009, Lowe’s entered Mexico’s growing market by opening two stores in Monterrey. The company also expanded into Canada and operated 35 stores in that country as of March 2014. As of August 2014, Lowe’s had eight stores in Mexico.
The company announced that instead of opening new stores, overseas expansion would be through acquisitions from now on. In 2009, the company launched a joint venture with Australian retailer Woolworths to open home improvement stores under the name Masters. In 2012, Lowe’s attempted to acquire Canadian home improvement retailer Rona, but its $1.8 billion bid was rejected. In 2013, Lowe’s purchased Orchard Supply Hardware, a 72-store California home improvement retailer that was coming out of bankruptcy. This transaction gave Lowe’s bigger presence in California and entry into cities where local regulations prohibit new big-box store. The company expects to open 15 stores in 2014, less than 1% growth in its store count.
SERVICE OFFERINGS PROVIDE DIFFERENTIATION FROM MASS MERCHANTS
Many specialty retailers are moving beyond simply offering consumers a wide variety of goods in a particular niche, and are now selling services as well. The service offerings are a way for specialty retailers to distinguish themselves from rivals, but perhaps more importantly, from discounters such as Wal-Mart Stores Inc. that are stocking more pet supplies, high-end electronics, and home goods.
Best Buy. The biggest US consumer electronics retailer prides itself on customer centricity, and has found success with its Geek Squad, whose members offer computer repair, support, and installation services at all US Best Buy stores. The approximately 20,000 Geek Squad members, known as “agents,” dress in short-sleeved white shirts with clip-on-ties, black pants, and shoes.
Best Buy has also capitalized on the increased complexity of consumer electronics by offering home installation of televisions and home theater systems. These services are intended to keep shoppers from migrating to Walmart and Amazon.com, which over the past several years have significantly added to their assortments of flat-panel televisions, usually at lower prices than rivals.
In July 2012, Best Buy announced that it would lay off approximately 2,400 workers, including about 600 Geek Squad employees (approximately 3% of the Geek Squad workforce) as the company copes with market share losses, largely to Amazon.com. In February 2013, the company cut 400 jobs at its headquarters in Minneapolis, Minnesota. Furthermore, on January 30, 2014, Best Buy Canada announced plans to lay off 950 employees at its Best Buy and Future Shop stores.
Staples. Office supply retailer Staples offers copy centers to capture incremental revenue from customers who do not want to make an additional trip to a copy center such as FedEx Kinko’s.
In addition, the company now offers a computer repair department called EasyTech, analogous to Best Buy’s Geek Squad. All stores are currently staffed with at least one EasyTech associate who can help customers with hardware and software installation, computer repair, and security and data protection. Staples is adding sales staff to its delivery business for corporate customers, which is its fastest-growing unit. Delivery (now known as North American Commercial) is Staples’ second largest business unit, making up 37.3% of the company’s $10.9 billion in sales for the second quarter of 2014, higher than the 35.8% share in the same period in 2013. We expect that percentage to grow over the coming years.
18 RETAILING: SPECIALTY / SEPTEMBER 2014 INDUSTRY SURVEYS

PetSmart. Pet owners are getting the service pitch as well. PetSmart Inc., the largest US pet supplies retailer, is also No. 1 in pet services such as grooming and training. The services are not only a source of revenue (pet services made up 11.1% of PetSmart sales in the first quarter of fiscal 2015), but they also boost traffic to stores and increase customer loyalty, according to the company.
In 2006, the company introduced PetsHotel, a boarding facility located inside PetSmart stores. As of August 3, 2014, PetSmart operated 200 PetsHotels. The company operates Doggie Day Camps in the hotels, which allow dogs to spend their days romping with other dogs in a playroom. The company also offers full-service veterinary hospitals in about two-thirds of its retail stores through a partnership with operator Banfield, The Pet Hospital.
Consumers have shown a desire to lavish their pets with gifts and treatments. About 75% of dog owners and more than half of cat owners view their pets as children, according to a survey conducted by the American Pet Products Manufacturers Association (APPMA), an industry trade group. Given this, it is perhaps unsurprising that the pet industry was unfazed by the recent recession. In fact, according to the APPMA, the US pet industry grew from $43.2 billion in 2008 to $45.5 billion in 2009. The industry has continued growing in 2010, 2011, 2012, and 2013, generating $48.4 billion, $51.0 billion, $53.3 billion, and $55.72 billion, respectively, in total sales (up 6.4%, 5.4%, 4.7%, and 4.5%). In fact, since 2001—when the APPMA began keeping track of yearly sales statistics—the US pet industry has been growing at a compound annual growth rate (CAGR) of 6.1%, with its worst year (2002) having an increase of only 3.5%. Furthermore, according to the 2013-2014 American Pet Products Association (APPA) National Pet Owners Survey Statistics: Pet Ownership & Annual Expenses, pet ownership was at a record high 68% of US households, or 82.5 million.
PRIVATE LABEL MARKET SHARE GROWS
At the same time that stores are offering shoppers more than just merchandise, they are also trying to expand their profits on the goods that consumers do buy. For many retailers, this means introducing or expanding the variety of private-label goods, which usually provide the retailer with higher margins than selling products from third-party providers.
Over the 10 years through 2013, Staples’ gross margin rose from 25.4% to 26.1%, helped by the growth in private-label sales. The company’s more than 2,000 private-label offerings include paper shredders, notebooks, office chairs, and other products in which consumers are not necessarily brand conscious. Staples’ branded products typically sell at prices that are 10%–15% lower than national brands, while also generating higher gross margins. Longer term, Staples plans to increase private-label sales to over 30% of total revenue, up from 28% in 2012.
Consumer electronics retailers are sourcing TVs, MP3 players, and other products from low-cost Chinese manufacturers; they then sell these products under their own brand names. Best Buy offers its Insignia label, with prices that are usually lower than products from manufacturers such as Sony Corp. and LG Electronics Inc. For example, in March 2014, Best Buy offered an Insignia 50-inch LCD HDTV for $700, while a Samsung television with similar specifications was priced at $830.
GIFT CARDS: A POPULAR CHOICE
Gift cards—those credit-card sized gift certificates that shoppers can load with a choice of dollar amounts—have become a favorite holiday gift, providing benefits to consumers and retailers alike. They remain popular among consumers, as buying a gift card tends to be less stressful than seeking out the perfect gift for friends and loved ones. Gift cards continue to gain in popularity among gift recipients as well.
Retailers can profit handsomely from gift cards in several ways. First, gift cards provide a steady source of revenue throughout the holiday season. Then, retailers may offer fresh merchandise at the start of the year in an attempt to entice gift card recipients into spending more on full-price items. How gift card recipients use the cards provides benefits as well. While some consumers spend more in the store than the card’s
INDUSTRY SURVEYS RETAILING: SPECIALTY / SEPTEMBER 2014 19

amount, others do not. In the latter case, however, the retailer can eventually cash in through what is called gift card “breakage”—recording the gift card’s sale as revenues, whether or not the entire amount was used.
According to the latest available estimates from the National Retail Federation (NRF), a trade group, and Prosper Insights and Analytics, which analyzes consumer behavior, 80.6% of consumers purchased a gift card over the 2013 holiday season, with sales of gift cards estimated to have reached $29.8 billion. In July 2014, for instance, NRF estimated that gift cards given during Father’s Day amounted to $1.8 billion, while for Valentine’s Day, 14% of consumers were estimated to have given gift cards to their loved ones. We think gift card popularity will continue to increase in 2014 and beyond.
EXPANDING IN THE VIRTUAL WORLD
Online sales are increasing faster than traditional retail sales, and we think that significant growth still lies ahead as sellers in all categories develop ways to increase their customer reach. According to the US Department of Commerce, online retail sales increased to $75.0 billion during the second quarter of 2014, up 15.7% from $64.8 billion during the same period in the previous year. In 2013, online retail sales totaled $263.3 billion, up from $224.6 billion in 2012, $193.7 billion in 2011 and $168.3 billion in 2010. Online
sales, as a percentage of total retail sales, rose to 5.9% in the second quarter of 2014 from 5.8% during the same period in the previous year. This percentage was 5.8% in 2013, 5.2% in 2012, 4.7% in 2011, and 4.4% in 2010.
Sales over the Internet should continue to rise, though growth is expected to decelerate from previous years.
Even as online sales growth eventually slows, consumers may increasingly use the Internet to research products before purchasing. Many specialty retailers offer information on the qualities of various products and comparisons among goods, realizing shoppers are there as much to learn as to shop.
Some online retailers rely on free shipping offers to lure consumers who do not want to pay extra for the convenience of online
shopping. Amazon.com Inc., the largest online retailer, offers unlimited two-day free shipping to shoppers who pay an annual $79 fee. With sales of $74.5 billion in 2013, up 22% from the previous year, Amazon.com continues to lead the way for online retailers.
M-commerce fuels comparison shopping An additional driver of Internet sales has been the emergence of mobile commerce (or m-commerce) as a shopping tool for consumers. Increasingly, consumers are using smartphones to compare prices of goods while they are in a retail store. While many retailers currently offer price-match guarantees, these guarantees typically do not apply to online retail (in general, retailers will only match the price of a competitor from a newspaper flyer).
We expect m-commerce to become more common, as demands by consumers to price-comparison shop prompts retailers to enable Wi-Fi hot spots in their stores. In addition, we think that sales clerks, like consumers, will also be empowered by the greater access to information that smartphones provide. As US smartphone usage approaches the 100-million mark, consumers are armed with devices supporting immediate price comparisons, product research, and consumer reviews that are changing in-store purchasing behavior.
Chart H06: ecommerce sales as a % of total retail sales
0
1
2
3
4
5
6
7
0
10
20
30
40
50
60
70
2004 2005 2006 2007 2008 2009 2010 2011 2012 2013 *2014
e-Commerce retail sales, in billions of dollars (left scale)
e-Commerce sales as a percent of total retail sales (right scale)
E-COMMERCE SALES AS A % OF TOTAL RETAIL SALES
*Data through June.Sources: US Department of Commerce; Bureau of Economic Analysis.
(% of total retail sales)(Billions of dollars)
20 RETAILING: SPECIALTY / SEPTEMBER 2014 INDUSTRY SURVEYS
According to Nielsen, a global marketing and advertising company, 70% of US consumers were using smartphones during the first quarter of 2014. In the second quarter of 2014, worldwide sales of smartphones grew 25% year-on-year to a new single quarter record of 301.1 million shipments, according to IDC, a global market intelligence firm. In 2013, worldwide sales of smartphones totaled more than one billion units in 2013, up about 38% from 725.3 million units in 2012. As of June 2014, an estimated 173 million people in the US were using smartphones, according to comScore.
According to the 2013 Our Mobile Planet Smartphone Research, published in May 2013 (latest available) by Google/Ipsos, which surveyed over 1,000 US smartphone users, 77% responded that they used a smartphone to research a product or service, and 60% purchased products or services using the smartphone at least once a month. Smartphone usage for shopping varied across locations: 55% used them at home, 35% used them on the go, 31% in stores, 28% at work, 21% in restaurants, 15% in cafés or coffee shops, and 7% while traveling on public transportation. In May 2014, Forrester Research Inc., an independent technology and market research firm, estimated that mobile and e-commerce through tablets and smartphones amounted to $114 billion in 2013—$76 billion in payments were made on tablets and $38 billion on smartphones. Total smartphone and tablet payments are expected to reach $293 billion by 2018.
While increased m-commerce usage suggests that retailers will increasingly be forced to compete on price, eroding retailer margins, it is a major boon to consumers, who now have greater knowledge that they are getting the best possible price for a particular item. In addition, pure online retailers such as Amazon.com will likely benefit as they can better compete on price. However, to compete better against its peers, Best Buy announced a permanent price-matching policy in February 2013. Under this new policy, Best Buy will match the price of retail and online competitors on all of its products.
Impact of social networking on retail Over the past couple of years, social networking sites such as Facebook, Twitter, and LinkedIn have made the transition from being simply a way to connect with friends (particularly Generation Y members) to a platform where retailers can market to consumers and provide valuable customer service. According to Mediabistro, a media news and analysis website, online retail sales are growing 17% per year and are expected to reach $370 billion by 2017. Global social commerce sales were estimated to have reached $13 billion in 2013 and are expected to reach $30 billion by 2015, while US social commerce sales were expected to have reached $5 billion in 2013 and are projected to surge to $14 billion by 2015.
With over one billion active users worldwide, Facebook is the behemoth of the social media platforms. The number of social network users worldwide totaled 1.47 billion in 2012, according to eMarketer’s June 2013 report, and is expected to increase ) to 2.55 billion in 2017. According to Social Media Today’s 2014 Social Customer Engagement Index, 52% of companies surveyed say that Facebook is the most effective social channel for customer services, with Twitter following at 25%. Customer service is also widely provided via mobile devices, with 50% of the surveyed companies saying that they provided this service in 2013, up from 38% in 2012.
Social media enables businesses to listen to their customers in real time and to gather information on price, product, marketing mix, brand perception, and consumer sentiment. In our view, engaging in social media supports improved customer service and boosts brand equity, enhancing customer loyalty and engagement.
Social media provides retailers a tremendous opportunity for low-cost marketing and promotion. Customers primarily interact with retailers on social media sites in order to learn about products and promotions; only 5% currently use social media for customer support. However, providing solid customer support is essential for retailers that engage in social media. Because consumers enjoy blogging about products they purchase or are planning to purchase, social media can help or harm sales. Bad experiences are blogged about far more often than good ones, so the retailer that can respond to these complaints in a public forum may be more apt to not only satisfy the complaining party but also assuage the potential fears of other shoppers.
Forrester Research highlighted Best Buy and Amazon.com as two of the companies that were social media standouts. Best Buy interacts with customers and solves problems through Twelpforce. People can send a tweet about any consumer electronics or customer service problem to @twelpforce and it will be answered
INDUSTRY SURVEYS RETAILING: SPECIALTY / SEPTEMBER 2014 21

by one of the 2,500 Best Buy employees that share this account. Amazon.com’s success is largely predicated on its ratings and reviews. In addition, recommendations made to consumers based on browsing history represent a social feature that works without requiring any activity from consumers. Amazon’s e-book reader, the Kindle, also includes social features by allowing readers to see what passages of a book other readers have highlighted.
It is clear to S&P Capital IQ that social media will grow in importance over the next several years, and that retailers will use this medium to better communicate with customers and drive loyalty. While many retailers may look upon this social networking revolution as a nuisance or disregard it completely, we think it can be a tremendous opportunity for those willing to invest valuable resources.
HOW THE INDUSTRY OPERATES
Retailing includes all business activities that involve the sale of goods and services to consumers for personal, family, or household use. Retailers also sell their goods and services to businesses, large and small, for commercial and industrial purposes. In this Survey, we focus on specialty retail stores, which operate in narrower merchandise and service categories than department stores or full-line mass merchandisers. (Those retailers are addressed in the Retailing: General issue of Industry Surveys.)
Specialty retailers sell products in specific merchandise categories, such as apparel, footwear, office supplies, home furnishings, sports equipment, books, jewelry, and so forth. A host of other specialized businesses—from New England antique dealers to California farm stands—fall under the umbrella of specialty retail.
Despite the proliferation of large chains and superstore formats, the specialty retailing landscape remains fragmented, with thousands of small- to medium-sized businesses, often catering to local tastes and preferences. Because specialty retailing generally requires less start-up capital than other industries, it continues to offer opportunities for entrepreneurs with new product ideas.
Given their heavy concentration in a particular product or service category, the performance of specialty retailing companies is often less sensitive to broader macroeconomic and retail trends than is the case for general merchandisers. On the other hand, specialty retailers may be more susceptible—for better or worse—to shifts in narrowly defined cultural, lifestyle, or demographic factors. For example, as children became increasingly enamored with video games in the 1980s and 1990s, retailers of consumer electronics such as Best Buy Co. Inc. and GameStop Corp. benefited greatly at the expense of more traditional toy retailers like Toys “R” Us Inc.
EVOLUTION OF THE SPECIALTY STORE
Specialty stores have been around from the earliest days of retailing, starting as small, locally managed shops selling a narrow range of full-price, high-quality merchandise. During the 1800s, specialty stores and small general stores were the dominant form of retailing. Department stores did not enter the scene until late in the middle of the nineteenth century. Most stores routinely sold merchandise at full price. It was not until the 1960s that discount stores began to pose a threat to specialty and department stores.
With the growth of shopping malls in the 1970s and 1980s, total retail square footage exploded, outpacing population growth. As the retail landscape became increasingly crowded and competitive, many retailers began to specialize in order to survive, leading to renewed growth in specialty retailing.
Malls offer several benefits to specialty retailers. Malls attract more potential customers than a stand-alone specialty store would. In addition, malls provide a ready-made, standardized retailing space and manage several important aspects of store operations such as security, customer access and parking, and climate control. This is particularly important to smaller retailers, which typically do not have the sales needed to cover the expenses involved in running a full-fledged stand-alone store. Although rents are usually higher in malls than in strip locations, malls often work out more cheaply for smaller stores because certain costs (such as security) are shared with other tenants.
22 RETAILING: SPECIALTY / SEPTEMBER 2014 INDUSTRY SURVEYS

BIRTH OF THE CATEGORY KILLER
Since the mid-1980s, the specialty retail industry has become increasingly populated by giant superstores, dubbed “category killers.” These warehouse-style stores typically carry a deep assortment of merchandise devoted to a specific category. For example, AutoZone Inc., a leading auto parts specialty retailer, operates stores that carry approximately 21,000 items for a broad range of vehicles.
Depending on the market segment, category killer stores range from 5,000 square feet for auto parts stores to more than 100,000 square feet for home improvement centers. When combined with low prices, their size creates the opportunity to gain significant market share from smaller competitors. Bed Bath & Beyond Inc., a highly successful category killer in the home goods business, has more than tripled its sales over the past decade by offering time-pressed shoppers a broad assortment at prices below those of department stores.
Category killers are not the only retailers adopting a superstore format. As consumers have demanded lower prices and greater selection, general merchandisers such as Wal-Mart Stores Inc. and warehouse clubs such as Costco Wholesale Corp. also have opened superstores.
Some specialty superstores have emerged to serve new markets. For example, as more people have begun to work at home, office product retailers have started to favor the warehouse format to offer these customers a larger selection, including furniture, computers, and printers, often at lower prices than local stationery stores.
Consolidating fragmented markets Most category-focused retailers have been successful largely because they targeted highly fragmented markets, typically those that were comprised of mom-and-pop stores or small regional chains.
Category-dominant retailers serve their customers by offering an unequaled selection of merchandise, albeit in a narrowly defined category. They are more likely to offer the same low prices every day, which reduces consumers’ propensity to comparison shop or wait for promotions. If the price and quality are right, customers seem willing to forgo the neighborhood feel and customized service of smaller shops in favor of the no-frills warehouse environment offered by category killers. To keep their customers’ loyalty, these specialty retailers emphasize adequate in-stock positions and lower prices.
Toys “R” Us was one of the first successful category-dominant retailers. The company opened its first store in the late 1950s, offering a giant selection of toys at low prices. At the time, toys were available in many places—predominantly specialty and department stores. However, department stores generally limited their toy assortments to the Christmas season. The field was scattered with small chains and many mom-and-pop stores. With its large, warehouse-style stores and lower prices, Toys “R” Us gobbled up market share for years. Over the past several years, however, the company has suffered declining market share with the growth of discounters Wal-Mart Stores Inc. and Target Corp., along with the emergence of online retailer Amazon.com, all of which offer a wide variety of toys, often at lower prices.
Professional builders and neighborhood hardware stores once dominated another category—the home improvement market. Other retailers largely ignored the do-it-yourself (DIY) market as insignificant. Then, The Home Depot Inc. opened its first three stores in Atlanta, Georgia, in 1979. While its early stores were small, the company soon adopted the superstore format and rapidly grew to become the world’s largest retailer of home improvement products. As Home Depot expanded its store base, numerous smaller regional retailers and local hardware stores, which could not compete with its selection and prices, were forced to close.
Lower costs mean lower prices Category killers tend to have lower cost structures than traditional retailers, which allow them to pass on savings to their customers. Their superstores are usually located as stand-alone units or as part of a strip mall, where occupancy costs are lower than at malls or downtown locations. Initially modeled after large warehouses, superstores are mostly self-service with fewer employees devoted to customer service functions than department stores. This further reduces their expenses. Finally, since they buy their inventory in tremendous volumes, they are able to exert bargaining power over their suppliers, something that smaller chains and independents may find difficult to do.
INDUSTRY SURVEYS RETAILING: SPECIALTY / SEPTEMBER 2014 23

For example, as Home Depot expanded in the home improvement category, its market share and buying power continually increased. Many of its smaller competitors, such as Grossman’s, Rickel Home Centers, Hechingers Co., and Builders Square, were not able to compete and went out of business, further bolstering Home Depot’s power—both in the market and with suppliers. Given such retailers’ market power, manufacturers that ignore them do so at their own risk; their own profit growth may depend on whether this major customer stocks their merchandise.
As superstore chains grow in size and buying power, they receive larger and larger sales rebates from vendors, which help them to lower retail prices further. However, customers, while price-conscious, still demand a certain level of customer service and a comfortable shopping environment. Given today’s crowded retail environment, many category killers are now using some of their savings in merchandise procurement to increase service levels and enhance merchandise displays in an effort to attract customers.
Some disadvantages Category killers do have their drawbacks. Their more distant locations mean they are harder to reach, and gasoline costs are a concern for many potential customers. Some shoppers may also prefer to walk through a mall or along a downtown avenue to buy all they need in a single trip, rather than making different stops for various merchandise categories in one store. Some categories of merchandise, such as high-tech consumer electronics products, require greater support at retail, from specially trained, knowledgeable employees, than the support typically offered at category killer stores.
Huge size and massive selection can be a disadvantage as well. For some consumers, the dizzying range of product sizes, styles, and colors at a superstore can be overwhelming. Shoppers looking for just one or a few basic items and a quick checkout may not want to scour a cavernous warehouse to find what they need. In addition, bulk packaging may not appeal to shoppers who need smaller quantities.
BEHIND THE SCENES: INVENTORY MANAGEMENT
A variety of retailing variables influence consumers’ buying decisions, including price, location, and service. Primarily, however, merchandise is what lures consumers to a particular store, building customer loyalty over time. Thus, having “the right merchandise in the right place at the right time” is the Holy Grail of retailing.
Merchandise inventory is a retailer’s most important asset, although buildings, property, and equipment usually exceed it in dollar value. Inventory generates sales, making it the key determinant of a retailer’s success or failure, profitability or loss. Carefully managing the way inventory is ordered, transported, received, distributed, reordered—and generally watched over—is a driving factor in lowering costs and increasing the business’s profitability.
Depending on the retail segment, superstores can carry as many as 60,000 different stockkeeping units (SKUs) from thousands of suppliers under one roof. This merchandise must be ordered, shipped, stored, delivered, and displayed. Stores must be staffed, payrolls met, and merchandise advertised and promoted. Below, we outline some of the steps it takes to get this merchandise from the manufacturer to the sales floor.
Types of merchandise The type of products carried by a specialty retailer affects its inventory management in various ways, from order lead times to distribution methods. For instance, different product classes typically sell at different speeds and with varying predictability. In addition, while all retailers hold merchandise in their stores as inventory, large retail chains also keep goods in distribution centers.
Retail merchandise can be classified as either soft goods or hard goods. The soft goods category comprises fashion and basic apparel, accessories, sheets, towels, and other linens. Hard goods are divided into three categories: hardlines, hardlines consumables, and seasonal hardlines.
Hardlines comprise electronics, hardware/paint, large and small appliances, stationery/office supplies, and certain impulse merchandise. Hardlines consumables consist of health and beauty aids, over-the-counter
24 RETAILING: SPECIALTY / SEPTEMBER 2014 INDUSTRY SURVEYS

medicines, cosmetics, candy, tobacco, paper goods, and pet supplies. Seasonal hardlines include sporting goods, toys, lawn/garden, automotive supplies, and seasonal/holiday merchandise.
Buying the inventory Merchandise inventories offer both opportunity and risk. When a retailer correctly anticipates a trend, the merchandise sails out the door to the ringing of cash registers. However, when the “wrong” products are stocked, sales may stall, and merchandise may have to be sold at a loss to make room for more attractive wares.
The process of getting the inventory in place involves various steps and levels of personnel. First, a store’s senior management establishes corporate objectives based on the outlook for the economy and consumer spending. These objectives include goals for sales, expenses, margins, and profitability.
Next, the retailer’s buyer develops a merchandise plan consistent with the objectives. The buyer is responsible for planning which goods to stock and in what quantities. When developing a plan for the year and deciding on what merchandise to obtain, buyers consider many factors, including fashion trends, demographic changes, and weather forecasts.
A company’s managers create a sales plan for comparable stores (those that have been open for a year or more), as well as for new retail square footage that results from the opening of new stores. The number of competitive openings or closings in a given trade area, which may relax or intensify competitive pressures, is also factored into the plan.
Because year-to-year changes in the calendar can affect demand, retailers need to factor them into their buying plans. For example, Easter might fall in March one year and in April the next. Because the week before Easter Sunday is a heavy shopping period, buyers will adjust inventory orders to reflect such shifts in demand.
Other steps in formulating a merchandise plan include anticipating price reductions in the form of promotions, special sales, and buying errors (merchandise that customers do not appear to want). Buyers must also take into account shortages in inventory that may occur through shoplifting, employee pilferage, vendor fraud, and inventory spoilage—what the industry refers to as shrinkage.
Intermediate steps in the supply chain Once ordered, merchandise must be shipped and received. To receive merchandise, leading retail chains typically operate one or more distribution centers serving stores in a region. These giant facilities, which range from 200,000 to 800,000 square feet on average, act as an intermediate point between manufacturers (vendors) and retail stores. Some merchandise arrives from vendors pre-distributed by store, ready to be split into shipments. From the distribution center, products are shipped to stores on an as-needed basis. As a retailer expands into new regions, additional distribution facilities may be needed.
In state-of-the-art distribution centers, the process is mostly automated: bar coding equipment scans merchandise as items pass by on a conveyor belt. Automated conveyance systems then move merchandise throughout the distribution center, where it is housed until picked up for distribution and loaded onto trucks to be sent to stores. Automation helps to minimize the retailer’s overall inventory levels: it speeds up the stocking process, so retailers do not have to order goods far in advance of the time they will be needed. It also allows for a more accurate count of inventory and quicker reordering when goods are in short supply, thus maintaining optimal in-stock positions at the store level. Centralized purchasing and distribution systems also permit store employees to spend more time on customer service and store presentation.
Pricing the goods In pricing merchandise, the retailer determines the “initial markon”—the difference between an item’s cost and its retail price, usually computed as a percentage of the retail price. For example, if an item costs $100 and the retailer sells it for $200, the initial dollar markon is $100 and the markon percentage is 50% ($100 ÷ $200 = 0.5 or 50%). Retailers can raise their merchandise margin by increasing the initial markon. In times of sharp price competition, they may lower it. In the case of a fast-selling item, a retailer may raise the price by adding another price increase, called a markup.
INDUSTRY SURVEYS RETAILING: SPECIALTY / SEPTEMBER 2014 25

When merchandise does not appeal to customers, the retailer must reduce prices to move it and make room for new—and hopefully more salable—items. The term “markdown” is used when a retail price is lowered. Markdowns help to clear out inventories and to draw customers into stores. Merchants always plan for some price reductions, especially during season-ending clearances, but excessive markdowns erode profitability.
TECHNOLOGY’S KEY ROLE
A commitment to information technology has become a hallmark of successful specialty retailers. New technologies help reduce costs and can provide key information about the business. Successful retailers demand sophisticated planning and accounting methods that allow them to make decisions based on data rather than intuition.
As retailing technology has evolved, it has become a powerful competitive tool. Inventory management systems, for example, are critical to today’s retailer: improperly stocked shelves can mean lost sales and customers. The computerization of purchasing orders, invoice processing, and credit card authorization has significantly streamlined operations. The benefits of technology include reduced prices and enhanced service for consumers, as well as market share gains and lower cost structures for retailers.
Quick Response aids inventory management To speed inventory replenishment, retailers and their vendors have undertaken Quick Response (QR) projects. The goal of QR is to maintain lean inventories and avoid overstocking, while ensuring that retailers have on hand the merchandise that customers want to buy. The “sell one, send one” approach of QR can improve in-stock positions and inventory turnover by ensuring that each item sold in a store is replenished.
The technology used to support QR programs is called electronic data interchange (EDI). An EDI system allows large amounts of information to be transmitted between retailer and vendor via interconnected computers. At the retailer’s checkout counter, electronic point-of-sale (POS) scanners read a bar code attached to each item and record the item sold, its price, and such details as color and size. Up-to-the-minute reports on store sales are relayed to the retailer and its vendors.
Having such data allows the retailer to gauge merchandise trends. By notifying vendors immediately when merchandise is sold, EDI speeds inventory replenishment. Packages shipped to a retailer’s warehouse have their bar code labels scanned, at which point the EDI system indicates the store to which each should be routed. The merchandise thus spends only a few hours at the warehouse, instead of a few days.
Because EDI networks are very costly and complex to set up, smaller retailers and manufacturers are now turning to the Internet to handle the task. New Internet applications allow retailers and manufacturers not only to generate orders and invoices—functions in which EDI is limited—but also to receive other information, such as sales projections and product brochures.
The Internet: opportunity and challenge Almost all specialty retail companies now have a presence on the Internet. Their websites can serve as an extension of existing stores, allowing consumers to order products 24 hours a day, seven days a week, often more easily and with more choices than through a mail order catalog. In addition, consumers can use a website to learn about a product or to compare prices before making a purchase in a nearby store. In such instances, the Internet largely serves as an advertising medium for the retailer.
Established specialty retailers such as Barnes & Noble Inc., Best Buy, and Williams-Sonoma Inc. have a sizable presence in e-commerce. Their well-known brands and long-time relationships with customers have helped to attract people to their websites. However, the Internet has also provided opportunities for newer businesses to gain a broad reach without opening a single traditional store, with Amazon.com Inc. the best-known example. While it was established largely through the sale of electronics, books, music, and movies—products that can be purchased without sales assistance, customization, or fitting (as with clothing)—Amazon.com has grown into a company with $74.5 billion in annual sales through the end of 2013. Nowadays, after establishing a strong reputation with customers and a friendly return policy, Amazon now successfully sells a vast array of retail products, including furniture, clothing, and automotive supplies.
26 RETAILING: SPECIALTY / SEPTEMBER 2014 INDUSTRY SURVEYS

For Internet retailers, the major areas of fixed costs include software spending to create and maintain a website and distribution expenses related to fulfilling orders. For traditional brick-and-mortar retailers, the cost structure is likely to be more weighted toward labor (salaries for workers staffing the stores), real estate, insurance, and utilities.
While the Internet can significantly broaden the reach of specialty retailers, the level of success that web-based businesses ultimately attain will likely depend on many of the factors that affect traditional stores. Customers generally look for selection, attractive prices, convenience, and good service. Simply establishing a website does not mean that many people will visit it: businesses must find ways to make potential customers aware of their presence and to differentiate themselves.
Although the Internet has many benefits for retailers, it also encourages price competition. An educated, price-sensitive consumer can now more readily compare the offerings of one retailer with those of others. This can increase the pressure for businesses to operate efficiently if they are to be profitable.
Building customer loyalty Compared with department stores or general merchandisers, specialty retailers carry a relatively narrow range of products, and because they appeal to a narrow niche market, they typically have fewer customers. To succeed, specialty retailers must keep their smaller brood of customers happy. Thus, specialty retailers have a greater need to build customer loyalty and ensure return visits than general merchandisers.
Effective marketing is a crucial way for retailers to tie their brands with perceptions of quality, status, or value in customers’ minds. However, building brand loyalty is expensive and, in an environment where consumers are bombarded with messages, increasingly difficult. Hence, retailers have turned to other initiatives, such as programs that reward repeat customers. Barnes & Noble provides an example of a successful customer loyalty program: this book retailer’s $25 membership program provides members with significant discounts on retail items. Members receive free express shipping, along with 40% off the list price of all hardcover bestsellers and 10% off almost anything else in the store.
Another tactic used by specialty retailers is issuing private-label credit cards. These cards help drive sales because they allow customers to buy on credit—but only for the retailer’s merchandise. They also permit retailers to track each customer’s purchases, income level, marital status, etc.—information that can be used to customize marketing efforts. Finally, interest charged on outstanding balances is a source of revenue.
While most specialty retailers rely on offering well-known product brands supplied by established manufacturers, many are increasingly introducing and aggressively promoting their own private-label brands. Unlike leading brands, which customers can buy at different retailers, private-label products can be found only at the particular retailer’s stores, catalog, or website. Thus, getting customers to buy private-label products can build customer loyalty.
Other benefits of private labels include higher margins due to lower sourcing costs and better control over product quality and the supply chain. Customers cannot compare prices across retailers and channels as effectively as they can with widely distributed brands. This helps specialty retailers keep firmer price points.
For example, while Home Depot still carries well-known tool brands like Black & Decker, the company is trying to differentiate itself from the competition by offering products that are tailor-made for its target customer. Office products retailer Staples offers a number of private-label products, including office furniture and paper shredders, usually costing 10%–15% less than brand-name alternatives.
Real estate: location, location, location As specialty retailers (both mall-based and superstore chains) confront a crowded retail landscape with fewer choice locations, they are investing more resources in their real estate operations. To locate stores optimally, these companies buy (or generate in-house) copious amounts of demographic data and market research. Faced with rising public opposition to urban sprawl, superstore chains also invest in public relations campaigns to convince communities of the benefits of having a store in their neighborhood.
INDUSTRY SURVEYS RETAILING: SPECIALTY / SEPTEMBER 2014 27
When locating their stores, retailers have two choices: leasing stores (as most retailers do) or owning the real estate. Retailers decide whether to buy or to lease only after a careful financial analysis of the alternative cash flows, including the tax effect. Generally, the large category killers build their own stores from the ground up. However, they usually lease the land in order to preserve capital for future expansion. When a company buys real estate, it must pay the purchase price. Such purchases are financed either by obtaining a loan or by using currently available funds. In the case of leasing, the retailer pays a yearly rental fee.
Both leasing and ownership have their pros and cons. Leasing can be restrictive with regard to subleases, store expansion, and the ability to close unprofitable stores. However, leases eventually expire, which gives retailers the flexibility to relocate or close units. Purchased real estate gives the retailer more control over the property, but usually requires a larger up-front commitment of capital than leasing does.
Normally, a store or group of stores might be closed when the lease or leases expire, so the company would face no real estate liability. However, with the current competitive state of retailing and the pressure to raise earnings, some retailers are closing unprofitable units with unexpired leases. In such cases, the company will often need to take a charge to earnings related to its unexpired leasehold liability.
Having opened stores in many suburban markets, retailers including Best Buy and Home Depot adapted their store models to move into urban areas such as New York City. Many of these stores are smaller than their suburban counterparts and stocked with goods that would appeal to an apartment dweller.
KEY INDUSTRY RATIOS AND STATISTICS
Real growth in gross domestic product (GDP). Reported quarterly by the US Department of Commerce, real (inflation-adjusted) growth in GDP indicates the overall health of the US economy. GDP encompasses four major expenditure categories: consumption, investment, government purchases of goods and services, and net exports of goods and services. Consumption (spending by domestic households on final goods and services) is the largest component of expenditures; changes here offer a good measure of consumers’ willingness to spend.
The US economy is cyclical, advancing and contracting with the business cycle. One rule of thumb is that two consecutive quarters of declining real GDP signal a recession. For the $15.7 trillion US economy, however, this is overly simplistic. According to the National Bureau of Economic Research (NBER), a private nonprofit economic research group, a recession is a significant decline in economic activity (as measured by numerous indicators, including industrial production, employment, real income, and wholesale-retail trade) spread across the country and lasting more than a few months. The Business Cycle Dating Committee of the NBER establishes the beginning and the end of recessions. According to this group, the US economy was in recession for 18 months from December 2007 to June 2009, the longest and deepest recession since the Great Depression. Following a 2.6% decline in 2009, the economy has been growing at a half-speed rate of recovery. Real GDP grew 2.5% in 2010, 1.6% in 2011, 2.3% in 2012, and 2.2% in 2013. As of August 2014, Standard & Poor’s Economics (which operates separately from S&P Capital IQ) was projecting growth of 2.1% in 2014 and 3.0% in 2015, following an increase of 1.9% in 2013. Consumer spending. The US economy depends heavily on consumer spending on goods and services, which accounts for approximately 70% of US GDP. Consumer spending, in turn, is influenced by the economy’s health. Because consumer spending drives retail sales, knowledge of current and anticipated economic conditions is key to understanding the general retail environment and evaluating individual companies. Various US government numbers, along with data provided by other organizations, help the analyst gauge the health of both the economy and the retail sector.
28 RETAILING: SPECIALTY / SEPTEMBER 2014 INDUSTRY SURVEYS

When looking at such numbers, it is important to know whether the percentage changes reflect year-over-year comparisons, are seasonally adjusted, and/or are adjusted for inflation.
Disposable personal income. Reported each month by the Department of Commerce, this measure calculates consumers’ after-tax income. Growth in disposable personal income indicates consumers’ ability to purchase “nonessential” goods, such as many of the products sold by specialty retailers.
When personal income is growing, consumers tend to feel more confident and are more willing to loosen their purse strings. On the other hand, when disposable income levels are growing sluggishly or not at all, consumers are less willing to spend. They may trade down to less expensive products, or postpone or forgo purchases, particularly in the case of big-ticket items.
Disposable personal income (DPI) rose 5.0% in 2011, 4.9% in 2012, and 1.0% in 2013, according to the latest annual revision of the national income and product accounts released on August 1, 2014.
Retail sales. The US Department of Commerce provides monthly retail sales data for various categories. Individual companies, trade periodicals, and research firms also provide such data. Since much of the retail industry is seasonal, with the volume weighted toward the end of the year, it is important to compare results from one period with those of the corresponding year-earlier period.
Comparable-store sales are an important barometer of the extent to which older stores (those open at least a year) are generating revenue growth. Total retail sales increased 4.4% in 2013 to $4.53 trillion, 5.1% in 2012 to $4.34 trillion, and 7.5% in 2011 to $4.13 trillion.
Consumer confidence. The Conference Board, a research organization, conducts the most widely followed consumer
Chart H02: Disp. Pers. Income & retail sales
Table B01: consumer expenditures
Chart H12: US Pers. Consumption Expends.
0
1,000
2,000
3,000
4,000
5,000
6,000
7,000
8,000
1990 92 94 96 98 00 02 04 06 08 10 12 †2014
US PERSONAL CONSUMPTION EXPENDITURES*(In billions of dollars)
Durable goods Nondurable goods Services
*A component of GDP. †Average data through June.Source: US Department of Commerce.
CONSUMER EXPENDITURES(In billions of dollars, seasonally adjusted annual rate)
YR. END 2QTR 2QTR2013 2013 2014
Total 11,499 11,383 11,798Food, beverages, & tobacco 1,625 1,583 1,618
Food at home 884 868 883Purchased meals & beverages 616 590 612
Clothing, footw ear, & personal care 682 682 689Housing, furnishings, & household operation 2,858 2,848 2,955Medical care 2,369 2,341 2,437Personal business services 1,019 982 1,045Transportation 1,131 1,125 1,156Entertainment & travel* 1,088 1,096 1,128Other expenses 728 726 771*Excluding purchased meals and beverages.Source: US Bureau of Economic Analysis.
0
600
1,200
1,800
2,400
3,000
3,600
4,200
4,800
5,400
1999 00 01 02 03 04 05 06 07 08 09 10 11 12 13 *2014
DISPOSABLE PERSONAL INCOME AND RETAIL SALES
(Billions of dollars)
*Data through June.Sources: US Department of Commerce; Bureau of Economic Analysis.
32
33
34
35
36
37
38
39
40
41
Retail sales (left scale)Retail sales as % of disposable personal income (right scale)
(%)
INDUSTRY SURVEYS RETAILING: SPECIALTY / SEPTEMBER 2014 29

confidence survey, polling 5,000 representative US households to gauge consumer sentiment. The results are expressed as an index, with 1985 as a base year (1985=100).
The Conference Board’s consumer confidence index (CCI) is compiled from monthly surveys that tally responses to a series of questions. It has two components: the present situation index, which measures consumers’ feelings about their current economic situation, and the expectations index, which tracks consumers’ feelings about the future. Factors that influence the index include perceptions of employment availability and current and projected income levels. When consumer confidence is high or rising, spending and borrowing usually increase. Consumers who are uncertain about the future are likely to pare or postpone their expenditures.
The Conference Board’s CCI reached 111.2 in February 2007, a five-year high. Over the course of the next two years, however, consumer confidence eroded significantly, as consumers expressed pessimism about the short-term health of the economy, according to the Conference Board. In February 2009, a historic low of 25.3 was reached. Confidence has since recovered somewhat, although it remains near levels synonymous with recessions. In August 2014, the index stood at 92.4 (in expansions, consumer confidence averages 102; in recessions it averages 71). We think consumers are less worried about job losses than they were at the nadir of the cycle (late 2008/early 2009), and the continued improvement in readings over the past few months suggests a positive impact on spending.
Consumer price index (CPI). Compiled by the Bureau of Labor Statistics (BLS), the consumer price index measures changes in the prices of commodities, fuel, oil, electricity, utilities, telephone services, food, and energy. The “core” CPI smoothes out the index by removing the more volatile food and energy categories.
The inflation rate in consumer goods, such as apparel and housewares, influences pricing trends in those products. Most companies try to pass on their cost increases to the consumer. When these increases are large, stunned consumers may hold back on spending; this reaction is referred to as “sticker shock.”
For the most part, core inflation has been relatively tame in recent years. In 2013, the CPI for all urban consumers increased at a rate of just 1.5% on a calendar-year basis (1.7% if food and energy are excluded—i.e., core inflation), following a 1.7% rise in 2012 (1.9%, excluding food and energy), according to the US Bureau of Labor Statistics. As of August 2014, Standard & Poor’s Economics was forecasting an average annual increase of 1.9% in the overall CPI for 2014, following an increase of 1.5% in 2013.
Interest rates. The cost of borrowing money influences the spending decisions of companies and individuals alike. High or rising interest rates increase the cost of borrowing; falling rates lower it. Either way, interest rates affect corporate decisions relating to acquisitions, capital expenditures, and stock repurchases, influencing management’s willingness to borrow money to fund these programs. While the level of interest rates also affects consumer-purchasing patterns, charging purchases on credit cards has nonetheless become a way of life for most Americans.
The US Federal Reserve Board (the Fed) sets US monetary policy and can take actions that directly affect short-term interest rates in the US banking system. In an attempt to bring the federal funds rate back to reasonable levels, the Fed began raising interest rates in June 2004. The central bank implemented 17 quarter-point rate hikes through June 2006, reaching a target federal funds rate of 5.25%. In September 2007, fueled by concerns of slowing economic growth, the Fed began a series of rate cuts. On December 16, 2008, it cut rates to a range of 0.00% to 0.25%, a record low that the Fed maintained into 2013. However, when the Fed in mid-2013 started hinting that it might taper off its latest quantitative easing program, interest rates began to rise. In June 2013, mortgage rates increased rather sharply, with the average rates on 15-year loans rising to 3.17% and on 30-year loans rising to 4.07%, from 2.72% and 3.54%, respectively, in May.
Then, on December 18, 2013, the Fed announced that it would begin tapering its monthly bond buying by $10 billion a month, reducing the total amount purchased to $75 billion a month. In January 2014, the average rate on the 15-year loan remained flat at 3.48% compared with December 2013, while the 30-year loan rate averaged 4.43% versus 4.46% in December 2013.
30 RETAILING: SPECIALTY / SEPTEMBER 2014 INDUSTRY SURVEYS

Furthermore, on January 29, 2014, the Fed announced that it would taper the bond-buying program by another $10 billion, bringing down the total to $65 billion a month starting in February. It cited the strengthening US economy and improved labor market conditions as reasons for taking this action. According to data from the Federal Home Loan Mortgage Corporation (also known as Freddie Mac), the 30-year fixed mortgage rate averaged 4.28% for the week ending February 13, 2014 compared with 4.41% for the week ending January 16, 2014. In the week ending February 13, 2014, the 15-year fixed mortgage rate averaged 3.33% compared with 3.45% for the week ending January 16, 2014.
HOW TO ANALYZE A SPECIALTY RETAIL COMPANY
A good starting point for analyzing a specialty retail company is to evaluate the current macroeconomic environment, as well as broad demographic and lifestyle trends. These factors affect the fortunes of retailers as they influence consumer sentiment, demand, and spending patterns. Broad economic gauges to look at include changes in the nation’s gross domestic product (GDP), inflation, unemployment, and interest rates.
Once an analyst has a feel for the state of the overall economy as well as the general retail climate, the next step is to evaluate the particular specialty retail segment in which the company competes. An analyst could look at how this segment fits into the overall retail landscape, the level of competition within the segment and with other segments, and the prospects for growth in the segment’s target markets.
An analyst should then examine the specific specialty retail company. Its financial performance should be analyzed in light of how its segment and competitors fared. The company’s future prospects should be assessed, taking into account its business plan and strategy, competitive position, as well as the outlook for its segment, the retail industry, and the economy. Analysis should focus on a range of factors—both qualitative and quantitative—that may vary from company to company and from segment to segment.
QUALITATIVE ISSUES: DECIDING WHERE THE COMPANY STANDS
One advantage in analyzing a retailer, as opposed to another kind of company, is that the analyst can visit its stores and observe its operations firsthand. Things to note include store layout, merchandise presentation, prices, items on sale and percentage off marked prices, the number of shoppers in the store and what they are buying, and the level of customer service provided to shoppers. Although the operations in one or two stores may not be indicative of the entire chain, the analyst can get a general understanding of a retailer’s store concept and how effectively it is being implemented. Understanding the company’s business strategy and management expertise are essential qualitative factors to examine when analyzing a specialty retailer.
Business strategy Following are several key factors to consider when evaluating a company’s business strategy.
Concept and format. There are many specialty retail concepts and formats, with locations ranging from mall stores to strip center outlets to destination superstores. Some stores have narrow product lines but deep inventory levels, while others carry broader product lines with limited selections in each category. Some retailers focus on low prices and bare-bones service, while others seek to differentiate themselves through high-quality service. Strategies vary depending on the type of merchandise and the target audience.
Target market. The growth potential of a specialty retailer depends primarily on three factors: the size of the target market for the company’s products, the market’s growth rate, and the company’s market share. A retailer’s target market represents the potential demand for its products. Estimates of these figures can sometimes be found in trade publications or companies’ annual reports.
For category-dominant companies in an established segment, sales growth is typically driven by gains in market share rather than by overall market growth. Retailers operating in emerging or fast-growing segments often benefit from growth in total sector sales.
INDUSTRY SURVEYS RETAILING: SPECIALTY / SEPTEMBER 2014 31

Real estate. “Location, location, location”—a mantra of the real estate business—also holds true for retailers. In assessing the potential profitability of a store’s location, many factors come into play. A good location draws traffic, which is essential in order to boost sales. Areas with growing populations can bolster a company’s long-term viability in those regions. If a site is located in a wealthy community, it can lead to a store generating higher sales and profits than are produced elsewhere, as residents are likely to have more disposable income. Stores in such an area may have better opportunities to sell higher-margin products.
Ideally, a store should be located in an area with a demographic profile that closely matches the store’s target demographic. Analysts should evaluate the availability of transportation and other factors governing a location’s accessibility to its target customer.
Many specialty chains are heavily concentrated in certain regions of the country, often in and around areas where they were founded. In analyzing them, it is important to evaluate the economic environment or other characteristics (such as weather patterns) of those regions and their influence on the particular retail segment. The geographic concentration of a retailer’s stores can influence how its sales are affected by regional events such as power outages, earthquakes, and hurricanes—even civil unrest.
Retailers can choose to own or lease their stores. These options give them some financial flexibility that companies in other industries may not have.
Merchandising and store presentation. Merchandising involves deciding which items to buy and stock. Presentation encompasses strategies for displaying the items for sale, including store layout, lighting, and décor. Both processes are essential to a store’s success; if a store does not stock desirable goods and present them in a compelling way, it simply will not make sufficient sales to survive.
Once a chain has developed a proven format and appearance, it may employ the same look throughout its system in order to attract and maintain a loyal customer base. Retailers are constantly testing new formats with an eye to attracting customers, improving customer traffic flow, and increasing store productivity.
Technology. A company’s commitment to technology is key to its future profitability. Organizations must be adept at gathering, understanding, and using information if they are to improve merchandising and distribution, expand customer service, and increase their market share. Investing in information systems can help a company accomplish these goals by tying its stores into supplier and vendor networks and by integrating its internal systems, which can streamline its workflow and reduce expenses. Well-designed information systems can give a retailer a competitive edge over its peers by providing valuable data on the preferences and buying patterns of its customers.
Management expertise The success of a company’s business strategy often hinges on the ability of its management team to execute. Questions to ask include: Can the present management execute the strategy? What are the managers’ track records, both individually and as a team? How successful is the buying team in selecting merchandise that consumers want to buy? How adept has management been at selecting locations for the company’s stores? It is important to keep in mind that a company is likely to portray its operations as favorably as possible. Therefore, the analyst must compare the company’s rhetoric with its results.
QUANTITATIVE ANALYSIS: GETTING DOWN TO BASICS
After gaining an understanding of a particular company and the industry in which it operates, it is time to focus on the numbers. The best places to find information to assess the long-term prospects of a company are on its income statement, statement of cash flows, and balance sheet. Important quantitative measures to consider include sales growth, profit margins, earnings growth, cash flow from operations, working capital, and inventory turnover.
The income statement The first step in financial analysis is to dissect the components of the income statement, also known as a profit and loss statement. The following income statement items are key.
32 RETAILING: SPECIALTY / SEPTEMBER 2014 INDUSTRY SURVEYS

Sales. Specialty retailers are subject to seasonal sales swings to differing degrees, depending on the nature of their products. Therefore, year-over-year changes are usually more meaningful than sequential comparisons (comparing one quarter with the preceding quarter).
Total sales growth comprises contributions from both newly opened and existing stores. Companies that operate in a high-growth segment or that have developed a popular store concept typically open new units at a rapid rate, so looking only at the overall year-to-year sales change can be misleading. A company that aggressively opens new stores can generate strong sales gains, even if the stores are unprofitable. Conversely, a company that closes unprofitable stores may report lower total sales, but its financial health may be improving.
That is why the most closely watched indicator is comparable-store sales, or same-store sales: the sales trends for stores that have been open at least one year. This figure is regarded as a good barometer of basic demand because it excludes growth from newly opened stores. Although some specialty retail companies report same-store sales data on a monthly basis, analysts should also look at longer-term trends in same-store sales as they can give a better indication of the state of business. In general, same-store sales should grow at least as fast as the particular market in which the retailer operates.
It is also important to look at a company’s sales per square foot. This figure, when compared with other retailers in the same segment, provides a measure of how effectively a retailer’s space is utilized. Other measures that can be used to gauge a company’s sales performance include sales per store, number of units sold, average unit price, customer traffic, customer transactions, and average ticket (in dollars) per customer.
Gross profit margin. The gross margin is calculated as net sales minus the cost of goods sold, expressed as a percentage of net sales. It generally reflects a company’s product mix and operational efficiency. The cost-of-goods-sold line comprises a number of items other than merchandise: costs of purchasing, warehousing, distribution, freight, occupancy, and insurance can also be included.
Does a retailer make more than 10% of its product purchases from a single vendor, and does any such relationship looks strong and favorable to the retailer? Are there any sourcing issues (e.g., raw materials costs or foreign trade agreements) that would likely cause the retailer’s sales or profits to change significantly?
Pricing has a strong influence on gross margins. Markdowns—lowering retail prices—are especially prevalent in retailing because they help draw customers into stores. However, a company that must lower prices to defend market share or to dispose of slow-selling merchandise could find its margins squeezed.
A retailer’s sales mix also influences gross margins. A higher percentage of full-price sales can benefit margins. A greater share of sales derived from high-end or custom-made products (versus lower-priced commodity-type items) can also drive gross margin expansion. In addition, private-label merchandise (products made exclusively for the retailer and marketed under its own brand names) carries higher margins.
A retailer’s investments in supply chain infrastructure and technology should be assessed. A retailer that more efficiently sources, stores, and moves products is likely to have a better gross margin than its peers. Another important metric is shrinkage—the amount of products lost, stolen, or damaged. A retailer that is able to reduce shrinkage through improved security systems could see gains in gross margin.
Operating profit margin. This is gross profit minus operating expenses, expressed as a percentage of total sales. Although companies define operating expenses differently, the figure typically includes selling, general, and administrative expenses, and excludes interest payments and other nonoperating expenses.
Because the operating margin reflects costs that can be managed to some degree (e.g., salaries, commissions, and advertising), it is usually more easily controlled than the gross margin. An increase in the operating margin usually indicates that management is using its resources more efficiently, allowing fixed costs to be spread across greater volumes. Conversely, a trend of narrowing operating margins may be a warning sign that management is not operating at its most efficient level.
INDUSTRY SURVEYS RETAILING: SPECIALTY / SEPTEMBER 2014 33

Net income and net profit margin. Net income operating profits minus interest payments, other nonoperating expenses, and taxes—the difference between total sales and total expenses, what is commonly called the bottom line. Net income as a percentage of sales is the net profit margin.
Analysts like to see a trend of improvement in net profit margins. All things being equal, rising profit margins usually translate into higher returns to shareholders. In practice, however, all things are rarely equal, and special items can distort this number. When looking at profits, try to determine if any sizable one-time or unusual factors (such as “extraordinary items” or “accounting changes”) have inflated or depressed results. For example, earnings may be unsustainably high due to a gain from an asset sale, or they may be unusually low because of a restructuring charge.
The statement of cash flows The statement of cash flows records all changes affecting cash in the categories of operations, investments, and financing. These cash receipts and outflows are reported quarterly.
Reported earnings may not accurately reflect a company’s cash flow generation or financial strength. Keep in mind that some expenses on a company’s income statement—such as depreciation, amortization, and write-downs—are noncash items (i.e., they do not represent an actual cash outlay). Conversely, companies frequently have cash expenditures—such as spending for new, unopened stores, debt repayment, and shareholder dividends—that are not included on the income statement.
If operating cash flow is significantly out of line with reported net income, it is important to understand why. If a company is operating with net cash outflows because of working capital needs (e.g., inventory purchases) and capital expenditures, check the cash level on the balance sheet to determine how long the company can fund itself before it needs to tap capital markets for financing. Also assess whether such additional financing is likely to be put to good use—to take advantage of growth opportunities, for example.
For companies with low liquidity, a cash crunch can be devastating. If a retailer’s merchandise delivery is interrupted—for example, an electronics manufacturer will not ship for fear of not getting paid—sales will decline and cash flow will fall short of expectations. Retailers often survive losses on the earnings line, but if they do not have cash to pay suppliers or meet their debt payments, they can be forced into bankruptcy.
At the opposite and more desirable end of the cash flow spectrum, a company with excess cash should have a clear plan for how to use it. Possibilities include repurchasing shares of common stock, paying dividends, and reinvesting in the business. Generally, a company in a growth stage will pump cash back into its business to fuel further growth. Mature companies that do not earn a high enough return on their reinvested capital may elect to pay out cash to shareholders as dividends or through share repurchase.
The balance sheet The balance sheet identifies categories and amounts of assets, liabilities, and stockholder’s equity at a specific point in time. Analysts appreciate a strong balance sheet, because a company without one (for example, a highly leveraged company) has little or no margin for error.
Liquidity. For a company with a heavy debt load, interest payments take a bite out of funds that might otherwise go toward upgrading and remodeling stores or investing in technology. High interest payments can also affect a company’s ability to meet its working capital needs. Generally, a debt-to-capital ratio below 50% is considered healthy for a specialty retail company. Analysts should look to see if any of the company’s debt has been assessed by a major credit rating agency, such as Standard & Poor’s Ratings Services or Moody’s Corp., and if there has been any change in ratings assigned by these agencies.
Inventory trends. The importance of planning, buying, and controlling merchandise inventory cannot be overstated. (These subjects are discussed in this Survey’s “How the Industry Operates” section.) Here, we focus on the signals an analyst watches to determine just how well a retailer is managing its inventory.
Merchandise inventory is an asset on the balance sheet, and its year-over-year growth can be measured. This growth should generally be in line with expected overall sales growth, which can come through either
34 RETAILING: SPECIALTY / SEPTEMBER 2014 INDUSTRY SURVEYS

comparable-store sales gains or the presence of new stores. If a company were adding new stores, growth in inventory would often be at least partly linked to the new merchandise needed to stock those stores. Sequential (quarter-to-quarter) inventory growth can be misleading because of the seasonal adjustments retailers make to accommodate higher expected sales for certain periods.
The speed at which inventory turns (or sells) is a measure of the flow of merchandise through the store. It is calculated by dividing the store’s cost of goods sold by its average inventory. A retailer’s turnover rate should be compared with those of other retailers in the same business segment. A relatively high turnover rate indicates that goods are selling well relative to the average amount of inventory kept in stock. Conversely, a low turnover rate indicates that goods are not moving rapidly.
Inventory buildup is less of a concern for basic merchandise, which can be sold throughout the year, than it is for fashion-oriented products. Trendy or seasonal merchandise may need to be sold at a discount once demand for those items fades. Furthermore, low-margin, commodity-type products tend to require higher turnover to be profitable.
Other items. When looking at a balance sheet, it is also important to judge whether the values reported are accurate measures of the assets’ total worth. For example, intangible assets, such as brand names or management ability, may not be reflected. At the same time, the value of some assets may need to be revised—such as those obtained through an acquisition, or an investment in merchandise that turns out to be a failure. Such assets will likely be reappraised downward in the future.
Look for non-core assets that could possibly be divested, generating proceeds that could be used to reduce debt, repurchase stock, or invest in other businesses. Finally, consider whether the company has potential liabilities or obligations that are not clearly reflected on the balance sheet. This could include, for example, guaranteeing payment of a loan that was made to another party.
EQUITY VALUATION AND TARGET PRICES
One method for investors to value a retailer is by forecasting forward 12-month sales, margins, and earnings, and comparing its price-to-earnings (P/E) multiple to its historical range, those of its competitors, and a peer-group average. Investors can also look up securities analysts’ earnings per share (EPS) estimates and P/E multiples at online resources. For a well-run retailer with a solid sales and earnings history and strong growth prospects, a low P/E multiple relative to peers could signal a buying opportunity. By comparison, a retailer losing business due to heightened competitive pressures and an ineffective growth strategy may deserve to trade at a lower P/E multiple than its peers. The investor has to make this decision.
Other metrics that are commonly used to value retailers include price-to-sales (P/S), price-to-book (P/B) and enterprise value-to-EBITDA (EV/EBITDA). Low relative valuations in these metrics could alert investors that a stock may be undervalued. Lastly, in terms of relative valuation metrics, investors should look at P/E-to-growth rates (PEG) as a determinant to see if a high P/E is supported by strong growth potential (or if a low P/E is justified by a company’s poor future growth prospects).
Discounted cash flow (DCF) analysis may also be conducted to assess the intrinsic value of the company. While this analysis can be time-consuming, an estimation of the present value of future expected cash flows can offer an analyst or investor additional insight into what the shares should ultimately be worth.
Coming up with a target price is the next step. A target price assigns a “fair value” to the shares. To arrive at a peer-based target price for a retailer, you need to multiply the EPS estimate by the peer-average P/E multiple. For example, assume that you have calculated (or looked up) an EPS estimate of $2.00 for Shop Me Inc. for the current year and a peer-average P/E multiple of 12. By multiplying these two values, you come up with a target price of $24. A target price conducted by using DCF analysis is simply the implied intrinsic value that is calculated after discounting future expected cash flows back to the present. Investors can also derive target prices by averaging the target prices attained by relative valuation, along with that implied by DCF analysis.
INDUSTRY SURVEYS RETAILING: SPECIALTY / SEPTEMBER 2014 35

GLOSSARY
Allowance from vendors—Price adjustment to a buyer for damaged merchandise or for the return of unsatisfactory merchandise.
Associated buying office—A central buying office, maintained by a group of noncompeting independent stores, for purchasing merchandise.
Assortment—The items that a store carries. Assortment in a specific product category refers to an item’s size, color, flavor, or packaging; the quantities ordered; and the space given to each item.
Assortment plan—The amount of merchandise in each category that is available in the store.
Basic item—Merchandise whose style and demand are generally constant and which must remain in stock to satisfy customers.
Brand—A name that identifies the goods of one seller.
Buyer—The person responsible for acquiring merchandise for a retail outlet or a specific department.
Carryover merchandise—Goods left over from one season to the next.
Cash discount—A reduction made against the supplier’s price for paying the invoice before the end of a stated discount period.
Category killer—A specialty retailer that carries a deep assortment of merchandise in a specific retail category. When combined with high sales volume, this focus creates an opportunity to gain significant market share from smaller competitors.
Centralized buying—A retail chain practice in which merchandise is purchased by staff from corporate headquarters.
Click-through rate—The percentage of Internet users who click on an online advertisement or a product link to request additional information.
Conversion rate—The percentage of visitors to an e-commerce site who make purchases.
Co-op money—A vendor’s contribution to a retailer for the promotion of merchandise.
Direct buying—The process of purchasing items directly from a manufacturer without going through an intermediary.
e-Book—An electronic version of a traditional print book that can be read on a personal computer, smartphone, or e-book reader.
Electronic data interchange (EDI)—A computer network in which retailers are linked with manufacturers to exchange information on merchandise sales and inventory positions. The electronic transfer of data smoothes the flow of merchandise, saves time, and reduces costs.
Inventory turnover—The number of times during the year that inventory is sold. The figure is derived by dividing total cost of goods sold by the average value of inventory.
Knockoff—An item that is similar to or an exact reproduction of an item made by another manufacturer.
Leader price—A special low price that a retail outlet places on an item to attract customers into the store.
Loss leader—Merchandise sold at or below cost to attract customers.
Markdown—A reduction in the retail price of an item, expressed as a percentage of the original price of the merchandise.
36 RETAILING: SPECIALTY / SEPTEMBER 2014 INDUSTRY SURVEYS

Markon—The difference between the retailer’s cost as billed (before deductions for cash discount) and the retail price.
Markup—An increase in an item’s price.
M-commerce—The buying or selling of goods and services through wireless handheld devices such as cellular phones and personal digital assistants (PDAs). Also known as mobile commerce.
Open to buy—The amount of merchandise a buyer can order during a given period, usually one month.
Out of stock—A store’s lack of merchandise in certain styles, sizes, and/or colors.
Point-of-sale (POS) terminal—A cash register that transacts and monitors all sales at checkout through a computer database.
Preticketing—Merchandise priced by the vendor, either on the package or on product price tags.
Price point—The price range at which a line of merchandise is available for sale.
Private label—Merchandise designed by the retailer that carries the store’s own brand name(s).
Quick Response (QR)—A partnership between vendor and retailer in which orders are automatically placed via computer links to replenish inventory.
Racetrack layout—A layout design that creates an oval within the store, rather than aisles, thus leading the customer around in a circular fashion. Different departments located around the oval are both visible and accessible.
Scanner—Electronic devices at store checkout counters that read the universal product code (UPC), also known as the bar code, on product labels. This yields such product information as price, color, and size, and enables a store to track each customer’s purchases. This data can help a retailer identify the best-selling mix of merchandise and assess the effectiveness of its promotions.
Shrinkage—Retailer loss of inventory due to accounting errors, misdirected shipments, mistakes in ringing up charges or pricing goods, bookkeeping errors, spoilage, breakage, and thefts by employees, vendors, or customers.
Smartphone—A cellular telephone with built-in applications and Internet access. Smartphones provide digital voice service as well as text messaging, e-mail, web browsing, still and video cameras, MP3 player and video viewing.
Stockkeeping unit (SKU)—A single merchandise item, as measured for inventory management purposes.
Stock turnover or turns—The number of times during the year that inventory is sold out; derived by dividing total sales by average inventory value.
Superstore—A retail store that is larger than a traditional retail store and offers a wide assortment of products, typically at prices favorable to the consumer.
INDUSTRY SURVEYS RETAILING: SPECIALTY / SEPTEMBER 2014 37

INDUSTRY REFERENCES
PERIODICALS
Chain Store Age http://www.chainstoreage.com Monthly; provides merchandising information and industry news.
Retailing Today http://www.retailingtoday.com Semimonthly; provides information mainly about discount store retailing.
HFN (Home Furnishings News) http://www.hfnmag.com Weekly newspaper; features in-depth news and analysis of home furnishings products and retail trends.
Home Textiles Today http://www.hometextilestoday.com Weekly; provides business and fashion news about the home textiles industry.
Internet Retailer http://www.internetretailer.com Monthly; provides news about the Internet retailing industry.
Kids Today http://www.kidstodayonline.com Monthly; focuses on the infant and juvenile home furnishings and textiles industries.
Playthings http://www.playthings.com Monthly; provides information about the toy industry.
Retail Merchandiser http://www.retail-merchandiser.com Monthly; provides retail industry information.
Stores http://www.stores.org Monthly; covers trends pertinent to retailing.
TRADE ASSOCIATIONS
American Home Furnishings Alliance (AHFA) http://www.ahfanews.com Collects and disseminates data and provides economic forecasts on the furniture industry.
American Pet Products Association Inc. (APPA) http://www.americanpetproducts.org Trade group representing pet product manufacturers, importers, and livestock suppliers.
Association of American Publishers (AAP) http://www.publishers.org Compiles book publishing statistics.
Automotive Aftermarket Industry Association (AAIA) http://www.aftermarket.org Source of automotive aftermarket information.
Consumer Electronics Association (CEA) http://www.ce.org Conducts market research and sponsors trade events.
The Home Improvement Research Institute (HIRI) http://www.hiri.org Organization of manufacturers, retailers, wholesalers, and allied groups in the home improvement industry; provides research on the industry.
International Council of Shopping Centers (ICSC) http://www.icsc.org Global trade association of the shopping center industry.
National Association of Realtors (NAR) http://www.realtor.org Represents over one million members comprised of real estate brokers, salespeople, property managers, appraisers, and others involved in the real estate industry.
National Retail Federation Inc. http://www.nrf.com Retailing trade organization concerned mainly about governmental issues and education.
National Sporting Goods Association (NSGA) http://www.nsga.org Represents more than 22,000 sporting goods retailer/dealer outlets and 3,000 product manufacturers, suppliers, and sales agents.
Sports and Fitness Industry Association (SFIA) http://www.sfia.org A national association providing manufacturers, producers, and distributors with information and statistics related to the sports apparel, athletic footwear, and sporting goods equipment industries. Formerly called SGMA International.
38 RETAILING: SPECIALTY / SEPTEMBER 2014 INDUSTRY SURVEYS

Toy Industry Association Inc. (TIA) http://www.toyassociation.org Publishes comprehensive statistics on toy manufacturing and retailing.
MARKET RESEARCH FIRMS
ACNielsen Worldwide http://www.nielsen.com Provides retail sales data on product movement, market share, distribution, and prices, as well as other information.
The Conference Board http://www.conference-board.org A not-for-profit, nonadvocacy, business research organization that calculates and disseminates the consumer confidence index (CCI) and leading economic indicators.
Forrester Research Inc. http://www.forrester.com Analyzes technology’s impact on businesses, consumers, and society.
NPD Group Inc. http://www.npd.com Consumer market research firm; provides apparel retail sales data, among other things.
GOVERNMENT AGENCIES
Bureau of Labor Statistics (BLS) http://www.bls.gov This division of the US Department of Labor is the principal fact-finding agency of the federal government in the broad fields of labor, economics, and statistics. Its major programs include the consumer price index (CPI), the producer price index, the employment cost index, and the national compensation survey.
US Department of Commerce http://www.commerce.gov This cabinet-level department houses various government agencies that monitor and regulate US commerce. Its divisions include the Bureau of the Census (population statistics and projections), the Economics and Statistics Administration (ESA; key economic and demographic data), and the Bureau of Economic Analysis (BEA; comprehensive statistics for the US economy).
CORPORATE INFORMATION
EDGAR Database http://www.sec.gov/edgar/searchedgar/webusers.htm A site maintained by the US Securities and Exchange Commission that provides access to corporate documents, such as 10-Ks and 10-Qs. In addition, most specialty retailers operate their own corporate and e-commerce websites.
INDUSTRY SURVEYS RETAILING: SPECIALTY / SEPTEMBER 2014 39
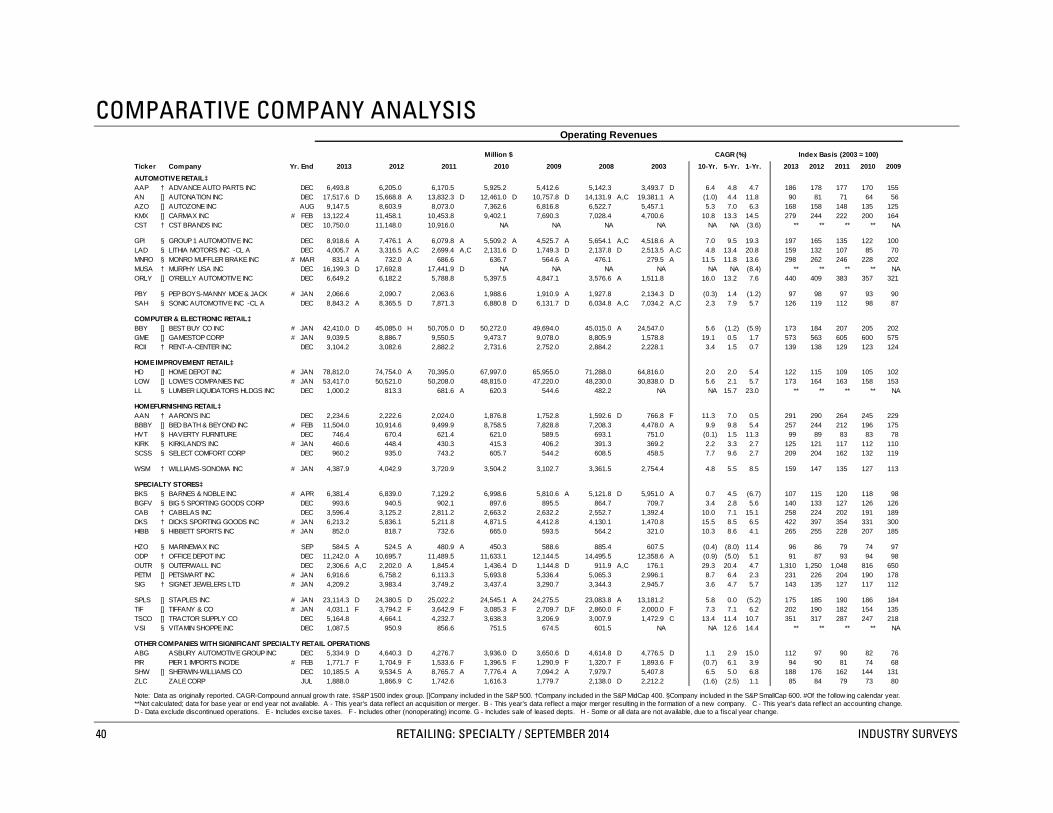
Operating Revenues
Million $ CAGR (%) Index Basis (2003 = 100)Ticker Company Yr. End 2013 2012 2011 2010 2009 2008 2003 10-Yr. 5-Yr. 1-Yr. 2013 2012 2011 2010 2009AUTOMOTIVE RETAIL‡AAP † ADVANCE AUTO PARTS INC DEC 6,493.8 6,205.0 6,170.5 5,925.2 5,412.6 5,142.3 3,493.7 D 6.4 4.8 4.7 186 178 177 170 155AN [] AUTONATION INC DEC 17,517.6 D 15,668.8 A 13,832.3 D 12,461.0 D 10,757.8 D 14,131.9 A,C 19,381.1 A (1.0) 4.4 11.8 90 81 71 64 56AZO [] AUTOZONE INC AUG 9,147.5 8,603.9 8,073.0 7,362.6 6,816.8 6,522.7 5,457.1 5.3 7.0 6.3 168 158 148 135 125KMX [] CARMAX INC # FEB 13,122.4 11,458.1 10,453.8 9,402.1 7,690.3 7,028.4 4,700.6 10.8 13.3 14.5 279 244 222 200 164CST † CST BRANDS INC DEC 10,750.0 11,148.0 10,916.0 NA NA NA NA NA NA (3.6) ** ** ** ** NA
GPI § GROUP 1 AUTOMOTIVE INC DEC 8,918.6 A 7,476.1 A 6,079.8 A 5,509.2 A 4,525.7 A 5,654.1 A,C 4,518.6 A 7.0 9.5 19.3 197 165 135 122 100LAD § LITHIA MOTORS INC -CL A DEC 4,005.7 A 3,316.5 A,C 2,699.4 A,C 2,131.6 D 1,749.3 D 2,137.8 D 2,513.5 A,C 4.8 13.4 20.8 159 132 107 85 70MNRO § MONRO MUFFLER BRAKE INC # MAR 831.4 A 732.0 A 686.6 636.7 564.6 A 476.1 279.5 A 11.5 11.8 13.6 298 262 246 228 202MUSA † MURPHY USA INC DEC 16,199.3 D 17,692.8 17,441.9 D NA NA NA NA NA NA (8.4) ** ** ** ** NAORLY [] O'REILLY AUTOMOTIVE INC DEC 6,649.2 6,182.2 5,788.8 5,397.5 4,847.1 3,576.6 A 1,511.8 16.0 13.2 7.6 440 409 383 357 321
PBY § PEP BOYS-MANNY MOE & JACK # JAN 2,066.6 2,090.7 2,063.6 1,988.6 1,910.9 A 1,927.8 2,134.3 D (0.3) 1.4 (1.2) 97 98 97 93 90SAH § SONIC AUTOMOTIVE INC -CL A DEC 8,843.2 A 8,365.5 D 7,871.3 6,880.8 D 6,131.7 D 6,034.8 A,C 7,034.2 A,C 2.3 7.9 5.7 126 119 112 98 87
COMPUTER & ELECTRONIC RETAIL‡BBY [] BEST BUY CO INC # JAN 42,410.0 D 45,085.0 H 50,705.0 D 50,272.0 49,694.0 45,015.0 A 24,547.0 5.6 (1.2) (5.9) 173 184 207 205 202GME [] GAMESTOP CORP # JAN 9,039.5 8,886.7 9,550.5 9,473.7 9,078.0 8,805.9 1,578.8 19.1 0.5 1.7 573 563 605 600 575RCII † RENT-A-CENTER INC DEC 3,104.2 3,082.6 2,882.2 2,731.6 2,752.0 2,884.2 2,228.1 3.4 1.5 0.7 139 138 129 123 124
HOME IMPROVEMENT RETAIL‡HD [] HOME DEPOT INC # JAN 78,812.0 74,754.0 A 70,395.0 67,997.0 65,955.0 71,288.0 64,816.0 2.0 2.0 5.4 122 115 109 105 102LOW [] LOWE'S COMPANIES INC # JAN 53,417.0 50,521.0 50,208.0 48,815.0 47,220.0 48,230.0 30,838.0 D 5.6 2.1 5.7 173 164 163 158 153LL § LUMBER LIQUIDATORS HLDGS INC DEC 1,000.2 813.3 681.6 A 620.3 544.6 482.2 NA NA 15.7 23.0 ** ** ** ** NA
HOMEFURNISHING RETAIL‡AAN † AARON'S INC DEC 2,234.6 2,222.6 2,024.0 1,876.8 1,752.8 1,592.6 D 766.8 F 11.3 7.0 0.5 291 290 264 245 229BBBY [] BED BATH & BEYOND INC # FEB 11,504.0 10,914.6 9,499.9 8,758.5 7,828.8 7,208.3 4,478.0 A 9.9 9.8 5.4 257 244 212 196 175HVT § HAVERTY FURNITURE DEC 746.4 670.4 621.4 621.0 589.5 693.1 751.0 (0.1) 1.5 11.3 99 89 83 83 78KIRK § KIRKLAND'S INC # JAN 460.6 448.4 430.3 415.3 406.2 391.3 369.2 2.2 3.3 2.7 125 121 117 112 110SCSS § SELECT COMFORT CORP DEC 960.2 935.0 743.2 605.7 544.2 608.5 458.5 7.7 9.6 2.7 209 204 162 132 119
WSM † WILLIAMS-SONOMA INC # JAN 4,387.9 4,042.9 3,720.9 3,504.2 3,102.7 3,361.5 2,754.4 4.8 5.5 8.5 159 147 135 127 113
SPECIALTY STORES‡BKS § BARNES & NOBLE INC # APR 6,381.4 6,839.0 7,129.2 6,998.6 5,810.6 A 5,121.8 D 5,951.0 A 0.7 4.5 (6.7) 107 115 120 118 98BGFV § BIG 5 SPORTING GOODS CORP DEC 993.6 940.5 902.1 897.6 895.5 864.7 709.7 3.4 2.8 5.6 140 133 127 126 126CAB † CABELAS INC DEC 3,596.4 3,125.2 2,811.2 2,663.2 2,632.2 2,552.7 1,392.4 10.0 7.1 15.1 258 224 202 191 189DKS † DICKS SPORTING GOODS INC # JAN 6,213.2 5,836.1 5,211.8 4,871.5 4,412.8 4,130.1 1,470.8 15.5 8.5 6.5 422 397 354 331 300HIBB § HIBBETT SPORTS INC # JAN 852.0 818.7 732.6 665.0 593.5 564.2 321.0 10.3 8.6 4.1 265 255 228 207 185
HZO § MARINEMAX INC SEP 584.5 A 524.5 A 480.9 A 450.3 588.6 885.4 607.5 (0.4) (8.0) 11.4 96 86 79 74 97ODP † OFFICE DEPOT INC DEC 11,242.0 A 10,695.7 11,489.5 11,633.1 12,144.5 14,495.5 12,358.6 A (0.9) (5.0) 5.1 91 87 93 94 98OUTR § OUTERWALL INC DEC 2,306.6 A,C 2,202.0 A 1,845.4 1,436.4 D 1,144.8 D 911.9 A,C 176.1 29.3 20.4 4.7 1,310 1,250 1,048 816 650PETM [] PETSMART INC # JAN 6,916.6 6,758.2 6,113.3 5,693.8 5,336.4 5,065.3 2,996.1 8.7 6.4 2.3 231 226 204 190 178SIG † SIGNET JEWELERS LTD # JAN 4,209.2 3,983.4 3,749.2 3,437.4 3,290.7 3,344.3 2,945.7 3.6 4.7 5.7 143 135 127 117 112
SPLS [] STAPLES INC # JAN 23,114.3 D 24,380.5 D 25,022.2 24,545.1 A 24,275.5 23,083.8 A 13,181.2 5.8 0.0 (5.2) 175 185 190 186 184TIF [] TIFFANY & CO # JAN 4,031.1 F 3,794.2 F 3,642.9 F 3,085.3 F 2,709.7 D,F 2,860.0 F 2,000.0 F 7.3 7.1 6.2 202 190 182 154 135TSCO [] TRACTOR SUPPLY CO DEC 5,164.8 4,664.1 4,232.7 3,638.3 3,206.9 3,007.9 1,472.9 C 13.4 11.4 10.7 351 317 287 247 218VSI § VITAMIN SHOPPE INC DEC 1,087.5 950.9 856.6 751.5 674.5 601.5 NA NA 12.6 14.4 ** ** ** ** NA
OTHER COMPANIES WITH SIGNIFICANT SPECIALTY RETAIL OPERATIONSABG ASBURY AUTOMOTIVE GROUP INC DEC 5,334.9 D 4,640.3 D 4,276.7 3,936.0 D 3,650.6 D 4,614.8 D 4,776.5 D 1.1 2.9 15.0 112 97 90 82 76PIR PIER 1 IMPORTS INC/DE # FEB 1,771.7 F 1,704.9 F 1,533.6 F 1,396.5 F 1,290.9 F 1,320.7 F 1,893.6 F (0.7) 6.1 3.9 94 90 81 74 68SHW [] SHERWIN-WILLIAMS CO DEC 10,185.5 A 9,534.5 A 8,765.7 A 7,776.4 A 7,094.2 A 7,979.7 5,407.8 6.5 5.0 6.8 188 176 162 144 131ZLC ZALE CORP JUL 1,888.0 1,866.9 C 1,742.6 1,616.3 1,779.7 2,138.0 D 2,212.2 (1.6) (2.5) 1.1 85 84 79 73 80
Note: Data as originally reported. CAGR-Compound annual grow th rate. ‡S&P 1500 index group. []Company included in the S&P 500. †Company included in the S&P MidCap 400. §Company included in the S&P SmallCap 600. #Of the follow ing calendar year. **Not calculated; data for base year or end year not available. A - This year's data reflect an acquisition or merger. B - This year's data reflect a major merger resulting in the formation of a new company. C - This year's data reflect an accounting change. D - Data exclude discontinued operations. E - Includes excise taxes. F - Includes other (nonoperating) income. G - Includes sale of leased depts. H - Some or all data are not available, due to a f iscal year change.
COMPARATIVE COMPANY ANALYSIS
40 RETAILING: SPECIALTY / SEPTEMBER 2014 INDUSTRY SURVEYS

Net Income
Million $ CAGR (%) Index Basis (2003 = 100)Ticker Company Yr. End 2013 2012 2011 2010 2009 2008 2003 10-Yr. 5-Yr. 1-Yr. 2013 2012 2011 2010 2009AUTOMOTIVE RETAIL‡AAP † ADVANCE AUTO PARTS INC DEC 391.8 387.7 394.7 346.1 270.4 238.0 125.3 12.1 10.5 1.1 313 309 315 276 216AN [] AUTONATION INC DEC 375.8 317.3 284.2 235.3 234.2 (1,225.4) 506.1 (2.9) NM 18.4 74 63 56 46 46AZO [] AUTOZONE INC AUG 1,016.5 930.4 849.0 738.3 657.0 641.6 517.6 7.0 9.6 9.3 196 180 164 143 127KMX [] CARMAX INC # FEB 492.6 434.3 413.8 380.9 281.7 59.2 116.4 15.5 52.8 13.4 423 373 355 327 242CST † CST BRANDS INC DEC 139.0 210.0 214.0 NA NA NA NA NA NA (33.8) ** ** ** ** NA
GPI § GROUP 1 AUTOMOTIVE INC DEC 114.0 100.2 82.4 50.3 34.8 (29.5) 76.1 4.1 NM 13.8 150 132 108 66 46LAD § LITHIA MOTORS INC -CL A DEC 105.2 79.4 55.8 14.1 6.1 (199.1) 35.6 11.4 NM 32.5 295 223 156 40 17MNRO § MONRO MUFFLER BRAKE INC # MAR 54.5 42.6 54.6 45.8 33.2 24.1 17.0 12.3 17.7 27.9 320 250 321 270 195MUSA † MURPHY USA INC DEC 156.3 83.6 205.3 NA NA NA NA NA NA 87.1 ** ** ** ** NAORLY [] O'REILLY AUTOMOTIVE INC DEC 670.3 585.7 507.7 419.4 307.5 186.2 100.1 20.9 29.2 14.4 670 585 507 419 307
PBY § PEP BOYS-MANNY MOE & JACK # JAN 7.1 13.2 29.1 37.2 24.1 (28.8) (15.1) NM NM (46.4) NM NM NM NM NMSAH § SONIC AUTOMOTIVE INC -CL A DEC 84.7 91.3 77.6 95.9 55.6 (634.1) 87.8 (0.4) NM (7.2) 96 104 88 109 63
COMPUTER & ELECTRONIC RETAIL‡BBY [] BEST BUY CO INC # JAN 687.0 (443.0) (1,057.0) 1,277.0 1,317.0 1,003.0 800.0 (1.5) (7.3) NM 86 (55) (132) 160 165GME [] GAMESTOP CORP # JAN 354.2 (269.7) 339.9 408.0 377.3 398.3 63.5 18.8 (2.3) NM 558 (425) 536 643 594RCII † RENT-A-CENTER INC DEC 128.2 183.5 164.6 171.6 167.9 139.6 181.5 (3.4) (1.7) (30.1) 71 101 91 95 92
HOME IMPROVEMENT RETAIL‡HD [] HOME DEPOT INC # JAN 5,385.0 4,535.0 3,883.0 3,338.0 2,620.0 2,312.0 4,304.0 2.3 18.4 18.7 125 105 90 78 61LOW [] LOWE'S COMPANIES INC # JAN 2,286.0 1,959.0 1,839.0 2,010.0 1,783.0 2,195.0 1,862.0 2.1 0.8 16.7 123 105 99 108 96LL § LUMBER LIQUIDATORS HLDGS INC DEC 77.4 47.1 26.3 26.3 26.9 22.1 NA NA 28.4 64.4 ** ** ** ** NA
HOMEFURNISHING RETAIL‡AAN † AARON'S INC DEC 120.7 173.0 113.8 118.4 112.9 85.8 36.4 12.7 7.1 (30.3) 331 475 312 325 310BBBY [] BED BATH & BEYOND INC # FEB 1,022.3 1,037.8 989.5 791.3 600.0 425.1 399.5 9.9 19.2 (1.5) 256 260 248 198 150HVT § HAVERTY FURNITURE DEC 32.3 14.9 15.5 8.4 (4.2) (12.1) 24.3 2.9 NM 116.4 133 61 64 35 (17)KIRK § KIRKLAND'S INC # JAN 14.5 13.8 19.1 26.4 34.6 9.3 18.1 (2.2) 9.3 5.3 80 76 105 146 191SCSS § SELECT COMFORT CORP DEC 60.1 78.1 60.5 31.6 35.6 (70.2) 27.2 8.3 NM (23.1) 221 287 223 116 131
WSM † WILLIAMS-SONOMA INC # JAN 278.9 256.7 236.9 200.2 77.4 30.0 157.2 5.9 56.2 8.6 177 163 151 127 49
SPECIALTY STORES‡BKS § BARNES & NOBLE INC # APR (47.3) (157.8) (68.9) (73.9) 36.7 85.4 151.9 NM NM NM (31) (104) (45) (49) 24BGFV § BIG 5 SPORTING GOODS CORP DEC 27.9 14.9 11.7 20.6 21.8 13.9 26.3 0.6 15.0 87.4 106 57 44 78 83CAB † CABELAS INC DEC 224.4 173.5 142.6 112.2 49.6 76.4 51.4 15.9 24.0 29.3 437 338 278 218 97DKS † DICKS SPORTING GOODS INC # JAN 337.6 290.7 263.9 182.1 135.4 (35.1) 52.4 20.5 NM 16.1 644 555 504 347 258HIBB § HIBBETT SPORTS INC # JAN 70.9 72.6 59.1 46.4 32.5 29.4 20.3 13.3 19.2 (2.3) 348 357 290 228 160
HZO § MARINEMAX INC SEP 15.0 1.1 (11.5) 2.5 (76.8) (134.3) 19.7 (2.7) NM 1,267.1 76 6 (59) 13 (390)ODP † OFFICE DEPOT INC DEC (20.0) (77.1) 95.7 (44.6) (596.5) (1,478.9) 302.0 NM NM NM (7) (26) 32 (15) (197)OUTR § OUTERWALL INC DEC 208.1 150.2 115.0 65.9 25.6 14.1 19.6 26.7 71.3 38.5 1,064 768 588 337 131PETM [] PETSMART INC # JAN 419.5 389.5 290.2 239.9 198.3 192.7 139.5 11.6 16.8 7.7 301 279 208 172 142SIG † SIGNET JEWELERS LTD # JAN 368.0 359.9 324.4 200.4 164.1 (393.7) 249.9 3.9 NM 2.3 147 144 130 80 66
SPLS [] STAPLES INC # JAN 707.0 (160.7) 984.7 881.9 738.7 805.3 490.2 3.7 (2.6) NM 144 (33) 201 180 151TIF [] TIFFANY & CO # JAN 181.4 416.2 439.2 368.4 265.7 220.0 215.5 (1.7) (3.8) (56.4) 84 193 204 171 123TSCO [] TRACTOR SUPPLY CO DEC 328.2 276.5 222.7 168.0 115.5 81.9 58.4 18.8 32.0 18.7 562 473 381 288 198VSI § VITAMIN SHOPPE INC DEC 66.5 60.8 44.9 29.2 12.7 8.2 NA NA 52.0 9.4 ** ** ** ** NA
OTHER COMPANIES WITH SIGNIFICANT SPECIALTY RETAIL OPERATIONSABG ASBURY AUTOMOTIVE GROUP INC DEC 101.1 83.3 48.0 37.3 24.2 (323.1) 19.8 17.7 NM 21.4 511 421 242 188 122PIR PIER 1 IMPORTS INC/DE # FEB 107.5 129.4 168.9 100.1 86.8 (129.3) 118.0 (0.9) NM (16.9) 91 110 143 85 74SHW [] SHERWIN-WILLIAMS CO DEC 752.6 631.0 441.9 462.5 435.8 476.9 332.1 8.5 9.6 19.3 227 190 133 139 131ZLC ZALE CORP JUL 10.0 (26.9) (112.0) (95.8) (189.5) 3.7 (40.6) NM 21.9 NM NM NM NM NM NM
Note: Data as originally reported. CAGR-Compound annual grow th rate. ‡S&P 1500 index group. []Company included in the S&P 500. †Company included in the S&P MidCap 400. §Company included in the S&P SmallCap 600. #Of the follow ing calendar year. **Not calculated; data for base year or end year not available.
INDUSTRY SURVEYS RETAILING: SPECIALTY / SEPTEMBER 2014 41

Return on Revenues (%) Return on Assets (%) Return on Equity (%)Ticker Company Yr. End 2013 2012 2011 2010 2009 2013 2012 2011 2010 2009 2013 2012 2011 2010 2009
AUTOMOTIVE RETAIL‡AAP † ADVANCE AUTO PARTS INC DEC 6.0 6.2 6.4 5.8 5.0 7.7 9.4 11.3 10.8 9.0 28.7 37.7 41.8 29.8 22.9AN [] AUTONATION INC DEC 2.1 2.0 2.1 1.9 2.2 5.0 4.7 4.7 4.1 4.1 20.0 17.7 14.3 10.7 10.4AZO [] AUTOZONE INC AUG 11.1 10.8 10.5 10.0 9.6 15.5 15.3 14.8 13.6 12.4 NA NA NA NA NA KMX [] CARMAX INC # FEB 3.8 3.8 4.0 4.1 3.7 4.6 4.8 5.5 8.1 11.4 15.5 15.3 16.7 18.0 16.0CST † CST BRANDS INC DEC 1.3 1.9 2.0 NA NA 6.9 12.4 NA NA NA 14.8 16.8 NA NA NA
GPI § GROUP 1 AUTOMOTIVE INC DEC 1.3 1.3 1.4 0.9 0.8 3.3 3.6 3.5 2.4 1.6 12.0 12.0 10.4 6.7 5.2LAD § LITHIA MOTORS INC -CL A DEC 2.6 2.4 2.1 0.7 0.3 6.5 6.0 5.3 1.5 0.6 21.9 20.0 16.2 4.5 2.2MNRO § MONRO MUFFLER BRAKE INC # MAR 6.6 5.8 8.0 7.2 5.9 7.4 6.9 11.3 10.2 8.0 13.9 12.2 17.9 17.8 15.5MUSA † MURPHY USA INC DEC 1.0 0.5 1.2 NA NA 8.1 4.4 NA NA NA 17.8 7.5 NA NA NAORLY [] O'REILLY AUTOMOTIVE INC DEC 10.1 9.5 8.8 7.8 6.3 11.3 10.4 9.6 8.5 6.9 32.9 23.7 16.8 14.2 12.4
PBY § PEP BOYS-MANNY MOE & JACK # JAN 0.3 0.6 1.4 1.9 1.3 0.4 0.8 1.8 2.4 1.6 1.3 2.5 5.9 8.1 5.6SAH § SONIC AUTOMOTIVE INC -CL A DEC 1.0 1.1 1.0 1.4 0.9 2.9 3.6 3.4 4.4 2.5 14.9 17.4 15.7 23.0 19.9
COMPUTER & ELECTRONIC RETAIL‡BBY [] BEST BUY CO INC # JAN 1.6 NM NM 2.5 2.7 4.5 NM NM 7.1 7.7 19.5 NM NM 19.8 24.0GME [] GAMESTOP CORP # JAN 3.9 NM 3.6 4.3 4.2 8.6 NM 6.9 8.1 8.0 15.6 NM 11.4 14.5 15.0RCII † RENT-A-CENTER INC DEC 4.1 6.0 5.7 6.3 6.1 4.4 6.5 6.0 6.7 6.8 9.1 13.0 12.1 13.2 14.4
HOME IMPROVEMENT RETAIL‡HD [] HOME DEPOT INC # JAN 6.8 6.1 5.5 4.9 4.0 13.2 11.1 9.6 8.2 6.4 35.5 25.4 21.1 17.4 14.1LOW [] LOWE'S COMPANIES INC # JAN 4.3 3.9 3.7 4.1 3.8 7.0 5.9 5.5 6.0 5.4 17.8 12.9 10.6 10.8 9.6LL § LUMBER LIQUIDATORS HLDGS INC DEC 7.7 5.8 3.9 4.2 4.9 19.9 14.7 9.8 11.7 15.0 28.5 20.9 13.3 16.0 20.5
HOMEFURNISHING RETAIL‡AAN † AARON'S INC DEC 5.4 7.8 5.6 6.3 6.4 6.6 9.8 7.0 8.4 8.8 10.6 16.4 11.6 12.7 13.7BBBY [] BED BATH & BEYOND INC # FEB 8.9 9.5 10.4 9.0 7.7 16.2 17.3 17.4 14.7 12.7 25.5 25.9 25.2 20.9 18.0HVT § HAVERTY FURNITURE DEC 4.3 2.2 2.5 1.4 NM 7.9 3.8 4.1 2.3 NM 11.6 5.7 6.0 3.4 NMKIRK § KIRKLAND'S INC # JAN 3.2 3.1 4.4 6.4 8.5 6.5 6.7 9.6 14.7 23.7 11.5 11.7 16.2 25.6 49.1SCSS § SELECT COMFORT CORP DEC 6.3 8.4 8.1 5.2 6.5 16.6 25.8 28.0 21.9 28.0 28.7 48.3 64.6 78.5 NA
WSM † WILLIAMS-SONOMA INC # JAN 6.4 6.4 6.4 5.7 2.5 12.3 12.1 11.3 9.5 3.9 21.7 20.0 18.8 16.2 6.6
SPECIALTY STORES‡BKS § BARNES & NOBLE INC # APR NM NM NM NM 0.6 NM NM NM NM 1.1 NM NM NM NM 4.0BGFV § BIG 5 SPORTING GOODS CORP DEC 2.8 1.6 1.3 2.3 2.4 6.6 3.7 3.0 5.4 5.8 15.7 9.3 7.6 14.6 17.9CAB † CABELAS INC DEC 6.2 5.6 5.1 4.2 1.9 3.7 3.2 3.0 3.2 2.0 15.0 13.6 12.9 11.2 5.2DKS † DICKS SPORTING GOODS INC # JAN 5.4 5.0 5.1 3.7 3.1 11.3 9.9 9.4 7.5 6.4 20.6 18.1 17.6 14.9 13.7HIBB § HIBBETT SPORTS INC # JAN 8.3 8.9 8.1 7.0 5.5 17.9 21.0 18.8 15.7 12.7 26.1 32.8 29.2 24.7 20.9
HZO § MARINEMAX INC SEP 2.6 0.2 NM 0.6 NM 4.0 0.3 NM 0.7 NM 7.1 0.6 NM 1.2 NMODP † OFFICE DEPOT INC DEC NM NM 0.8 NM NM NM NM 1.4 NM NM NM NM 8.4 NM NMOUTR § OUTERWALL INC DEC 9.0 6.8 6.2 4.6 2.2 12.0 9.9 8.4 5.3 2.2 39.0 27.8 23.6 15.4 7.0PETM [] PETSMART INC # JAN 6.1 5.8 4.7 4.2 3.7 16.6 15.3 11.6 9.7 8.2 37.8 34.2 25.0 20.5 17.1SIG † SIGNET JEWELERS LTD # JAN 8.7 9.0 8.7 5.8 5.0 9.5 9.8 9.7 6.7 5.6 15.0 15.6 15.4 10.7 9.6
SPLS [] STAPLES INC # JAN 3.1 NM 3.9 3.6 3.0 6.0 NM 7.2 6.4 5.5 11.5 NM 14.1 12.9 12.0TIF [] TIFFANY & CO # JAN 4.5 11.0 12.1 11.9 9.8 3.9 9.5 11.1 10.2 8.1 6.8 16.8 19.4 18.1 15.3TSCO [] TRACTOR SUPPLY CO DEC 6.4 5.9 5.3 4.6 3.6 18.2 16.7 14.6 12.5 10.0 28.9 27.2 22.9 20.2 17.2VSI § VITAMIN SHOPPE INC DEC 6.1 6.4 5.2 3.9 1.9 10.5 11.3 9.2 6.1 2.7 13.6 15.1 13.7 11.0 6.3
OTHER COMPANIES WITH SIGNIFICANT SPECIALTY RETAIL OPERATIONSABG ASBURY AUTOMOTIVE GROUP INC DEC 1.9 1.8 1.1 0.9 0.7 5.7 5.4 3.3 2.6 1.6 22.6 22.8 15.6 14.1 10.4PIR PIER 1 IMPORTS INC/DE # FEB 6.1 7.6 11.0 7.2 6.7 12.9 15.4 21.6 14.4 13.4 21.8 25.1 37.3 28.0 38.8SHW [] SHERWIN-WILLIAMS CO DEC 7.4 6.6 5.0 5.9 6.1 11.9 11.0 8.5 9.7 10.0 42.2 38.1 28.3 29.8 28.2ZLC ZALE CORP JUL 0.5 NM NM NM NM 0.8 NM NM NM NM 5.5 NM NM NM NM
Note: Data as originally reported. ‡S&P 1500 index group. []Company included in the S&P 500. †Company included in the S&P MidCap 400. §Company included in the S&P SmallCap 600. #Of the follow ing calendar year.
42 RETAILING: SPECIALTY / SEPTEMBER 2014 INDUSTRY SURVEYS

Debt as a % ofCurrent Ratio Debt / Capital Ratio (%) Net Working Capital
Ticker Company Yr. End 2013 2012 2011 2010 2009 2013 2012 2011 2010 2009 2013 2012 2011 2010 2009
AUTOMOTIVE RETAIL‡AAP † ADVANCE AUTO PARTS INC DEC 1.4 1.2 1.0 1.1 1.3 39.6 31.6 31.1 21.6 13.2 86.0 96.8 391.8 108.9 48.1AN [] AUTONATION INC DEC 1.0 1.0 1.1 1.1 1.2 45.4 53.8 45.5 38.9 32.2 NM NM 765.2 583.6 285.4AZO [] AUTOZONE INC AUG 0.8 0.8 0.8 0.9 0.9 169.4 169.0 159.0 133.4 118.6 NM NM NM NM NMKMX [] CARMAX INC # FEB 3.0 3.4 2.9 2.8 3.3 68.9 66.6 64.5 63.0 1.4 415.2 369.6 402.9 433.5 2.5CST † CST BRANDS INC DEC 1.7 1.7 2.3 NA NA 58.3 0.3 0.4 NA NA 332.0 2.6 1.8 NA NA
GPI § GROUP 1 AUTOMOTIVE INC DEC 1.1 1.1 1.1 1.1 1.1 35.3 36.0 35.3 32.9 37.1 645.9 325.3 369.4 332.2 430.3LAD § LITHIA MOTORS INC -CL A DEC 1.2 1.3 1.4 1.5 1.3 31.5 40.1 43.2 45.6 43.2 117.4 135.4 145.4 165.2 240.6MNRO § MONRO MUFFLER BRAKE INC # MAR 1.2 1.2 1.2 1.2 1.2 31.0 33.7 13.3 12.9 29.3 596.1 622.3 208.8 217.1 390.2MUSA † MURPHY USA INC DEC 1.3 1.1 1.2 NA NA 41.5 0.1 0.1 NA NA 351.2 1.3 1.2 NA NAORLY [] O'REILLY AUTOMOTIVE INC DEC 1.2 1.2 1.7 1.9 1.8 40.5 33.4 21.4 9.8 20.2 338.7 238.2 77.6 33.3 68.7
PBY § PEP BOYS-MANNY MOE & JACK # JAN 1.2 1.2 1.3 1.4 1.4 26.7 26.9 36.8 38.2 40.9 152.3 156.5 176.5 145.1 149.0SAH § SONIC AUTOMOTIVE INC -CL A DEC 1.1 1.1 1.0 1.1 1.1 53.1 53.2 50.6 54.0 60.0 530.4 703.1 NM 644.6 703.5
COMPUTER & ELECTRONIC RETAIL‡BBY [] BEST BUY CO INC # JAN 1.4 1.1 1.2 1.2 1.2 28.7 27.3 30.9 9.6 14.6 52.9 93.2 116.9 39.3 69.5GME [] GAMESTOP CORP # JAN 1.1 1.2 1.2 1.2 1.3 0.1 0.0 0.0 7.7 14.0 0.7 0.0 0.0 61.2 94.9RCII † RENT-A-CENTER INC DEC NA NA NA NA NA 34.4 27.2 30.9 30.9 34.2 NA NA NA NA NA
HOME IMPROVEMENT RETAIL‡HD [] HOME DEPOT INC # JAN 1.4 1.3 1.5 1.3 1.3 53.0 34.4 37.1 31.2 30.5 324.3 242.3 209.1 259.4 244.9LOW [] LOWE'S COMPANIES INC # JAN 1.2 1.3 1.3 1.4 1.3 45.4 38.7 29.2 26.0 18.7 710.3 435.0 322.6 229.5 190.5LL § LUMBER LIQUIDATORS HLDGS INC DEC 3.3 2.9 3.4 3.6 3.2 0.0 0.0 0.0 0.0 0.0 0.0 0.0 0.0 0.0 0.0
HOMEFURNISHING RETAIL‡AAN † AARON'S INC DEC NA NA NA NA NA 7.8 9.1 10.9 2.3 3.8 NA NA NA NA NABBBY [] BED BATH & BEYOND INC # FEB 2.1 2.4 3.1 3.1 3.1 2.7 2.6 0.0 0.0 0.0 5.5 4.9 0.0 0.0 0.0HVT § HAVERTY FURNITURE DEC 2.6 2.0 2.5 2.5 2.4 5.2 6.6 4.5 3.3 2.7 13.2 20.5 11.7 8.1 7.0KIRK § KIRKLAND'S INC # JAN 2.9 3.0 3.0 3.2 2.6 0.0 0.0 0.0 0.0 0.0 0.0 0.0 0.0 0.0 0.0SCSS § SELECT COMFORT CORP DEC 1.4 1.6 1.6 1.2 0.7 0.0 0.0 0.1 0.5 1.2 0.0 0.0 0.1 1.5 NM
WSM † WILLIAMS-SONOMA INC # JAN 1.6 2.0 2.2 2.2 2.1 0.2 0.3 0.4 0.6 0.7 0.4 0.6 0.8 1.0 1.4
SPECIALTY STORES‡BKS § BARNES & NOBLE INC # APR 1.2 1.2 1.1 1.0 1.0 8.9 14.5 28.2 29.6 25.3 54.4 77.5 278.1 NM NMBGFV § BIG 5 SPORTING GOODS CORP DEC 2.0 1.9 2.1 1.8 1.8 19.0 23.4 29.8 24.9 30.3 26.4 33.5 42.5 38.2 47.5CAB † CABELAS INC DEC 4.5 3.2 2.5 2.0 1.9 68.8 67.2 64.6 61.0 41.1 91.6 89.8 88.6 91.7 113.3DKS † DICKS SPORTING GOODS INC # JAN 1.6 1.6 2.0 1.8 1.5 0.4 0.5 8.5 9.3 11.5 1.0 1.3 16.3 19.5 33.1HIBB § HIBBETT SPORTS INC # JAN 3.5 2.7 2.9 2.9 2.8 0.9 0.9 1.0 1.1 0.1 1.2 1.1 1.2 1.3 0.1
HZO § MARINEMAX INC SEP 1.7 1.6 1.6 1.8 1.5 0.0 0.0 0.0 0.0 0.0 0.0 0.0 0.0 0.0 0.0ODP † OFFICE DEPOT INC DEC 1.5 1.3 1.3 1.3 1.3 41.1 31.0 36.4 38.6 36.7 105.5 74.6 93.1 96.4 85.2OUTR § OUTERWALL INC DEC 1.1 1.0 1.4 0.8 1.0 53.3 34.2 36.2 26.0 51.0 882.2 NM 201.9 NM NMPETM [] PETSMART INC # JAN 1.7 1.7 1.9 2.0 1.9 29.2 29.3 30.5 30.8 31.3 86.2 82.6 86.7 94.8 106.4SIG † SIGNET JEWELERS LTD # JAN 3.6 3.5 3.5 3.6 3.9 0.0 0.0 0.0 0.0 13.5 0.0 0.0 0.0 0.0 15.4
SPLS [] STAPLES INC # JAN 1.6 1.4 1.5 1.5 1.6 14.0 14.1 18.6 22.5 27.0 53.5 56.2 72.1 92.6 104.5TIF [] TIFFANY & CO # JAN 4.6 5.4 4.6 5.6 4.1 21.6 22.7 18.6 21.3 21.6 29.7 29.8 23.8 26.7 28.2TSCO [] TRACTOR SUPPLY CO DEC 2.3 2.0 2.4 2.4 2.0 0.1 0.1 0.1 0.1 0.2 0.2 0.2 0.2 0.2 0.3VSI § VITAMIN SHOPPE INC DEC 2.7 2.7 1.8 2.0 1.6 0.0 0.0 0.0 15.0 28.7 0.0 0.1 0.0 73.8 203.1
OTHER COMPANIES WITH SIGNIFICANT SPECIALTY RETAIL OPERATIONSABG ASBURY AUTOMOTIVE GROUP INC DEC 1.3 1.3 1.2 1.4 1.4 52.5 53.4 57.3 65.1 68.5 198.0 223.3 281.1 221.5 243.9PIR PIER 1 IMPORTS INC/DE # FEB 2.2 2.7 2.7 2.8 2.3 2.0 1.7 1.9 2.2 5.9 3.1 2.3 2.3 2.3 6.0SHW [] SHERWIN-WILLIAMS CO DEC 1.2 1.7 1.0 1.1 1.3 38.7 47.7 29.6 28.7 34.4 178.1 128.2 646.1 432.8 208.0ZLC ZALE CORP JUL 2.0 2.1 2.0 2.0 2.3 68.2 71.7 65.0 48.0 45.4 95.9 106.4 99.0 74.3 67.4
Note: Data as originally reported. ‡S&P 1500 index group. []Company included in the S&P 500. †Company included in the S&P MidCap 400. §Company included in the S&P SmallCap 600. #Of the follow ing calendar year.
INDUSTRY SURVEYS RETAILING: SPECIALTY / SEPTEMBER 2014 43

Price / Earnings Ratio (High-Low) Dividend Payout Ratio (%) Dividend Yield (High-Low, %)Ticker Company Yr. End 2013 2012 2011 2010 2009 2013 2012 2011 2010 2009
AUTOMOTIVE RETAIL‡AAP † ADVANCE AUTO PARTS INC DEC 21 - 13 18 - 12 14 - 10 17 - 10 17 - 10 4 5 5 6 8 0.3 - 0.2 0.4 - 0.3 0.5 - 0.3 0.6 - 0.3 0.8 - 0.5AN [] AUTONATION INC DEC 18 - 13 19 - 12 21 - 14 19 - 11 16 - 6 0 0 0 0 0 0.0 - 0.0 0.0 - 0.0 0.0 - 0.0 0.0 - 0.0 0.0 - 0.0AZO [] AUTOZONE INC AUG 17 - 12 17 - 13 17 - 12 18 - 10 14 - 11 0 0 0 0 0 0.0 - 0.0 0.0 - 0.0 0.0 - 0.0 0.0 - 0.0 0.0 - 0.0KMX [] CARMAX INC # FEB 24 - 17 20 - 13 20 - 12 21 - 11 19 - 5 0 0 0 0 0 0.0 - 0.0 0.0 - 0.0 0.0 - 0.0 0.0 - 0.0 0.0 - 0.0CST † CST BRANDS INC DEC 20 - 15 NA - NA NA - NA NA - NA NA - NA 7 NA NA NA NA 0.5 - 0.3 NA - NA NA - NA NA - NA NA - NA
GPI § GROUP 1 AUTOMOTIVE INC DEC 17 - 12 15 - 10 15 - 10 19 - 10 23 - 5 14 13 14 5 0 1.2 - 0.8 1.4 - 0.9 1.4 - 0.9 0.5 - 0.2 0.0 - 0.0LAD § LITHIA MOTORS INC -CL A DEC 18 - 9 12 - 7 12 - 6 27 - 10 59 - 7 10 15 12 28 0 1.0 - 0.5 2.3 - 1.2 2.0 - 1.0 2.9 - 1.0 0.0 - 0.0MNRO § MONRO MUFFLER BRAKE INC # MAR 34 - 19 35 - 23 23 - 16 24 - 14 21 - 13 26 29 20 21 16 1.3 - 0.8 1.3 - 0.8 1.2 - 0.8 1.6 - 0.9 1.3 - 0.8MUSA † MURPHY USA INC DEC 14 - 11 NA - NA NA - NA NA - NA NA - NA 0 NA NA NA NA 0.0 - 0.0 NA - NA NA - NA NA - NA NA - NAORLY [] O'REILLY AUTOMOTIVE INC DEC 22 - 14 22 - 16 22 - 14 21 - 12 19 - 12 0 0 0 0 0 0.0 - 0.0 0.0 - 0.0 0.0 - 0.0 0.0 - 0.0 0.0 - 0.0
PBY § PEP BOYS-MANNY MOE & JACK # JAN NM- 75 62 - 33 29 - 15 20 - 11 24 - 6 0 0 22 17 26 0.0 - 0.0 0.0 - 0.0 1.5 - 0.8 1.5 - 0.8 4.6 - 1.1SAH § SONIC AUTOMOTIVE INC -CL A DEC 16 - 12 13 - 7 11 - 7 8 - 5 12 - 1 6 6 7 1 0 0.5 - 0.4 0.8 - 0.5 1.0 - 0.6 0.3 - 0.2 0.0 - 0.0
COMPUTER & ELECTRONIC RETAIL‡BBY [] BEST BUY CO INC # JAN 22 - 6 NM- NM NM- NM 16 - 10 14 - 8 34 NM NM 18 18 6.0 - 1.5 5.9 - 2.4 2.8 - 1.7 1.9 - 1.2 2.3 - 1.2GME [] GAMESTOP CORP # JAN 19 - 7 NM- NM 12 - 8 10 - 6 14 - 9 36 NM 0 0 0 4.9 - 1.9 5.2 - 2.8 0.0 - 0.0 0.0 - 0.0 0.0 - 0.0RCII † RENT-A-CENTER INC DEC 17 - 14 13 - 10 14 - 8 13 - 7 9 - 6 37 22 22 5 0 2.6 - 2.1 2.2 - 1.7 2.8 - 1.6 0.7 - 0.4 0.0 - 0.0
HOME IMPROVEMENT RETAIL‡HD [] HOME DEPOT INC # JAN 22 - 17 22 - 14 17 - 11 18 - 13 19 - 11 41 38 42 47 58 2.5 - 1.9 2.8 - 1.8 3.7 - 2.4 3.5 - 2.6 5.1 - 3.1LOW [] LOWE'S COMPANIES INC # JAN 24 - 16 22 - 15 19 - 13 20 - 14 20 - 11 33 37 37 30 29 2.0 - 1.3 2.5 - 1.7 2.9 - 1.9 2.2 - 1.5 2.7 - 1.4LL § LUMBER LIQUIDATORS HLDGS INC DEC 43 - 19 34 - 10 30 - 14 35 - 20 29 - 7 0 0 0 0 0 0.0 - 0.0 0.0 - 0.0 0.0 - 0.0 0.0 - 0.0 0.0 - 0.0
HOMEFURNISHING RETAIL‡AAN † AARON'S INC DEC 19 - 16 14 - 11 20 - 13 17 - 11 17 - 10 5 3 4 3 3 0.3 - 0.2 0.3 - 0.2 0.3 - 0.2 0.3 - 0.2 0.3 - 0.2BBBY [] BED BATH & BEYOND INC # FEB 17 - 11 16 - 12 15 - 11 16 - 9 17 - 8 0 0 0 0 0 0.0 - 0.0 0.0 - 0.0 0.0 - 0.0 0.0 - 0.0 0.0 - 0.0HVT § HAVERTY FURNITURE DEC 22 - 11 26 - 15 19 - 13 47 - 25 NM- NM 17 162 17 26 NM 1.5 - 0.8 10.8 - 6.4 1.3 - 0.9 1.0 - 0.6 0.3 - 0.2KIRK § KIRKLAND'S INC # JAN 32 - 12 22 - 10 17 - 8 19 - 8 11 - 1 0 0 0 0 0 0.0 - 0.0 0.0 - 0.0 0.0 - 0.0 0.0 - 0.0 0.0 - 0.0SCSS § SELECT COMFORT CORP DEC 26 - 15 25 - 13 20 - 8 21 - 8 9 - 0 0 0 0 0 0 0.0 - 0.0 0.0 - 0.0 0.0 - 0.0 0.0 - 0.0 0.0 - 0.0
WSM † WILLIAMS-SONOMA INC # JAN 21 - 15 19 - 13 20 - 12 20 - 10 31 - 9 43 34 32 31 66 2.9 - 2.0 2.7 - 1.8 2.6 - 1.6 3.1 - 1.6 7.3 - 2.1
SPECIALTY STORES‡BKS § BARNES & NOBLE INC # APR NM- NM NM- NM NM- NM NM- NM 45 - 23 NM NM NM NM 156 0.0 - 0.0 0.0 - 0.0 0.0 - 0.0 6.3 - 3.0 6.8 - 3.5BGFV § BIG 5 SPORTING GOODS CORP DEC 20 - 10 20 - 9 30 - 10 19 - 11 18 - 4 31 43 56 21 20 3.1 - 1.6 4.9 - 2.1 5.6 - 1.9 1.9 - 1.1 4.7 - 1.1CAB † CABELAS INC DEC 23 - 13 23 - 10 16 - 9 14 - 8 24 - 7 0 0 0 0 0 0.0 - 0.0 0.0 - 0.0 0.0 - 0.0 0.0 - 0.0 0.0 - 0.0DKS † DICKS SPORTING GOODS INC # JAN 21 - 16 23 - 14 20 - 13 24 - 14 22 - 9 18 105 23 0 0 1.1 - 0.9 7.3 - 4.6 1.7 - 1.2 0.0 - 0.0 0.0 - 0.0HIBB § HIBBETT SPORTS INC # JAN 25 - 18 23 - 15 22 - 14 24 - 13 20 - 11 0 0 0 0 0 0.0 - 0.0 0.0 - 0.0 0.0 - 0.0 0.0 - 0.0 0.0 - 0.0
HZO § MARINEMAX INC SEP 26 - 13 NM- NM NM- NM NM- 56 NM- NM 0 0 NM 0 NM 0.0 - 0.0 0.0 - 0.0 0.0 - 0.0 0.0 - 0.0 0.0 - 0.0ODP † OFFICE DEPOT INC DEC NM- NM NM- NM 28 - 8 NM- NM NM- NM NM NM 0 NM NM 0.0 - 0.0 0.0 - 0.0 0.0 - 0.0 0.0 - 0.0 0.0 - 0.0OUTR § OUTERWALL INC DEC 9 - 6 14 - 8 16 - 10 32 - 12 45 - 22 0 0 0 0 0 0.0 - 0.0 0.0 - 0.0 0.0 - 0.0 0.0 - 0.0 0.0 - 0.0PETM [] PETSMART INC # JAN 19 - 15 20 - 14 20 - 15 20 - 12 17 - 10 18 18 21 23 20 1.2 - 0.9 1.3 - 0.9 1.4 - 1.0 1.9 - 1.2 2.0 - 1.2SIG † SIGNET JEWELERS LTD # JAN 17 - 11 13 - 9 13 - 8 19 - 11 15 - 3 13 11 5 0 0 1.1 - 0.8 1.2 - 0.8 0.6 - 0.4 0.0 - 0.0 0.0 - 0.0
SPLS [] STAPLES INC # JAN 16 - 11 NM- NM 17 - 8 21 - 14 24 - 14 44 NM 28 29 32 4.2 - 2.8 4.2 - 2.6 3.4 - 1.7 2.1 - 1.4 2.3 - 1.3TIF [] TIFFANY & CO # JAN 66 - 40 23 - 15 24 - 16 23 - 12 21 - 8 94 38 32 33 32 2.3 - 1.4 2.5 - 1.7 2.1 - 1.3 2.7 - 1.4 4.1 - 1.5TSCO [] TRACTOR SUPPLY CO DEC 33 - 19 27 - 18 25 - 15 21 - 11 17 - 9 21 19 14 12 0 1.1 - 0.6 1.1 - 0.7 1.0 - 0.5 1.1 - 0.6 0.0 - 0.0VSI § VITAMIN SHOPPE INC DEC 30 - 18 30 - 19 31 - 19 32 - 18 31 - 22 0 0 0 0 0 0.0 - 0.0 0.0 - 0.0 0.0 - 0.0 0.0 - 0.0 0.0 - 0.0
OTHER COMPANIES WITH SIGNIFICANT SPECIALTY RETAIL OPERATIONSABG ASBURY AUTOMOTIVE GROUP INC DEC 17 - 10 12 - 8 15 - 10 16 - 8 20 - 2 0 0 0 0 0 0.0 - 0.0 0.0 - 0.0 0.0 - 0.0 0.0 - 0.0 0.0 - 0.0PIR PIER 1 IMPORTS INC/DE # FEB 25 - 18 17 - 11 9 - 6 13 - 5 7 - 0 20 14 0 0 0 1.1 - 0.8 1.2 - 0.8 0.0 - 0.0 0.0 - 0.0 0.0 - 0.0SHW [] SHERWIN-WILLIAMS CO DEC 26 - 21 26 - 15 21 - 16 20 - 14 17 - 11 27 25 35 34 37 1.3 - 1.0 1.7 - 1.0 2.1 - 1.6 2.5 - 1.7 3.4 - 2.2ZLC ZALE CORP JUL 55 - 12 NM- NM NM- NM NM- NM NM- NM 0 NM NM NM NM 0.0 - 0.0 0.0 - 0.0 0.0 - 0.0 0.0 - 0.0 0.0 - 0.0
Note: Data as originally reported. ‡S&P 1500 index group. []Company included in the S&P 500. †Company included in the S&P MidCap 400. §Company included in the S&P SmallCap 600. #Of the follow ing calendar year.
20092013 2012 2011 2010
44 RETAILING: SPECIALTY / SEPTEMBER 2014 INDUSTRY SURVEYS

Earnings per Share ($) Tangible Book Value per Share ($) Share Price (High-Low, $)
Ticker Company Yr. End 2013 2012 2011 2010 2009 2013 2012 2011 2010 2009 2013 2012 2011 2010 2009
AUTOMOTIVE RETAIL‡AAP † ADVANCE AUTO PARTS INC DEC 5.36 5.29 5.21 4.00 2.85 17.39 15.06 10.17 11.95 13.05 111.94 - 71.48 93.08 - 60.87 72.32 - 49.50 69.51 - 38.38 47.41 - 29.50AN [] AUTONATION INC DEC 3.10 2.56 1.96 1.50 1.33 3.86 1.32 3.72 4.95 5.84 54.49 - 38.93 48.56 - 31.57 41.55 - 27.32 28.50 - 17.18 21.60 - 7.62AZO [] AUTOZONE INC AUG 28.28 24.04 19.91 15.23 11.89 (61.44) (49.98) (38.82) (23.09) (14.48) 484.16 - 341.98 399.10 - 313.11 343.90 - 246.26 276.00 - 152.32 169.99 - 125.80KMX [] CARMAX INC # FEB 2.20 1.90 1.83 1.70 1.27 14.92 13.32 11.73 10.10 8.62 53.08 - 36.95 38.24 - 24.83 37.02 - 22.77 36.00 - 18.62 24.75 - 6.92CST † CST BRANDS INC DEC 1.84 2.76 2.82 NA NA 7.67 NA NA NA NA 36.92 - 27.01 NA - NA NA - NA NA - NA NA - NA
GPI § GROUP 1 AUTOMOTIVE INC DEC 4.72 4.39 3.50 2.21 1.52 (0.15) 3.60 4.62 4.95 2.53 82.40 - 54.91 65.99 - 43.63 52.16 - 33.31 43.05 - 22.22 35.30 - 7.14LAD § LITHIA MOTORS INC -CL A DEC 4.08 3.09 2.13 0.54 0.28 15.99 12.99 11.14 10.23 10.25 74.94 - 37.54 37.80 - 20.62 24.85 - 13.28 14.45 - 5.18 16.49 - 1.85MNRO § MONRO MUFFLER BRAKE INC # MAR 1.72 1.36 1.77 1.52 1.12 3.70 3.24 5.82 5.52 4.29 58.00 - 33.00 47.62 - 30.72 41.45 - 28.70 36.49 - 20.77 23.23 - 14.36MUSA † MURPHY USA INC DEC 3.34 1.75 4.31 NA NA 14.04 NA NA NA NA 46.91 - 36.12 NA - NA NA - NA NA - NA NA - NAORLY [] O'REILLY AUTOMOTIVE INC DEC 6.14 4.83 3.77 3.02 2.26 11.25 11.75 16.27 17.24 13.82 135.62 - 87.06 107.13 - 75.61 82.17 - 53.33 63.05 - 37.47 42.92 - 26.47
PBY § PEP BOYS-MANNY MOE & JACK # JAN 0.13 0.25 0.55 0.71 0.46 9.23 9.24 8.67 9.10 8.46 14.07 - 9.76 15.46 - 8.31 15.96 - 8.18 14.21 - 7.86 10.83 - 2.62SAH § SONIC AUTOMOTIVE INC -CL A DEC 1.60 1.68 1.46 1.82 1.26 0.94 0.03 (0.42) (1.57) (3.48) 25.51 - 19.77 21.11 - 11.88 16.27 - 10.11 13.74 - 8.21 15.15 - 0.72
COMPUTER & ELECTRONIC RETAIL‡BBY [] BEST BUY CO INC # JAN 2.01 (1.31) (2.89) 3.14 3.16 9.98 6.33 5.84 9.52 7.97 44.66 - 11.38 27.95 - 11.20 36.33 - 21.79 48.83 - 30.90 45.55 - 23.97GME [] GAMESTOP CORP # JAN 3.02 (2.13) 2.43 2.69 2.29 5.57 6.34 5.95 4.43 3.26 57.74 - 22.30 28.35 - 15.32 28.66 - 18.34 25.75 - 17.12 32.82 - 20.02RCII † RENT-A-CENTER INC DEC 2.34 3.11 2.69 2.64 2.54 (0.57) 2.02 0.14 0.44 (0.33) 40.81 - 32.83 39.50 - 31.22 38.26 - 21.30 33.05 - 17.23 23.14 - 14.45
HOME IMPROVEMENT RETAIL‡HD [] HOME DEPOT INC # JAN 3.78 3.03 2.49 2.03 1.56 8.14 11.19 10.92 10.91 10.73 82.47 - 62.38 65.92 - 41.92 42.47 - 28.13 37.03 - 26.62 29.44 - 17.49LOW [] LOWE'S COMPANIES INC # JAN 2.14 1.69 1.43 1.42 1.21 11.51 J 12.48 13.32 13.38 13.07 52.08 - 34.43 36.47 - 24.76 27.45 - 18.07 28.54 - 19.35 24.50 - 13.00LL § LUMBER LIQUIDATORS HLDGS INC DEC 2.82 1.71 0.95 0.96 1.00 10.84 8.23 7.33 6.50 5.38 119.98 - 52.56 58.80 - 17.22 28.96 - 13.43 33.41 - 19.33 28.93 - 7.02
HOMEFURNISHING RETAIL‡AAN † AARON'S INC DEC 1.59 2.28 1.46 1.46 1.39 12.30 11.83 9.93 9.65 8.45 30.90 - 26.20 32.53 - 24.57 29.34 - 19.16 24.32 - 16.16 23.47 - 13.91BBBY [] BED BATH & BEYOND INC # FEB 4.85 4.62 4.12 3.11 2.33 15.40 14.92 15.68 14.71 13.02 80.54 - 54.62 75.84 - 54.33 63.83 - 44.79 50.95 - 26.50 40.23 - 19.11HVT § HAVERTY FURNITURE DEC 1.45 0.69 0.71 0.39 (0.20) 13.25 11.66 11.97 11.59 11.41 31.67 - 16.16 17.62 - 10.39 13.79 - 9.47 18.16 - 9.56 13.93 - 7.61KIRK § KIRKLAND'S INC # JAN 0.84 0.79 0.97 1.33 1.76 7.81 6.90 6.41 5.94 4.48 26.52 - 10.41 17.42 - 8.26 16.23 - 7.69 25.38 - 10.62 19.25 - 2.17SCSS § SELECT COMFORT CORP DEC 1.10 1.41 1.10 0.58 0.78 3.80 3.41 2.24 0.99 0.36 28.94 - 16.62 35.60 - 19.00 22.19 - 9.22 12.06 - 4.92 7.01 - 0.20
WSM † WILLIAMS-SONOMA INC # JAN 2.89 2.59 2.27 1.87 0.73 13.15 13.20 12.30 12.00 11.33 61.56 - 43.49 48.07 - 32.67 45.48 - 27.90 36.82 - 18.42 22.49 - 6.58
SPECIALTY STORES‡BKS § BARNES & NOBLE INC # APR (1.12) (3.02) (1.41) (1.31) 0.64 (6.14) (5.62) (5.83) (4.75) (3.73) 23.71 - 12.59 26.00 - 9.35 21.06 - 8.45 24.71 - 11.89 28.78 - 14.81BGFV § BIG 5 SPORTING GOODS CORP DEC 1.28 0.70 0.54 0.95 1.02 8.36 7.36 6.95 6.70 5.91 25.00 - 12.88 14.30 - 6.12 15.96 - 5.34 18.39 - 10.77 18.15 - 4.22CAB † CABELAS INC DEC 3.18 2.48 2.06 1.65 0.74 22.68 19.58 17.10 14.95 14.54 72.54 - 42.32 56.78 - 23.65 32.37 - 19.12 23.45 - 12.83 17.73 - 5.16DKS † DICKS SPORTING GOODS INC # JAN 2.75 2.39 2.19 1.57 1.20 11.52 10.47 11.39 9.37 7.27 58.40 - 45.00 54.24 - 34.42 42.97 - 29.10 38.10 - 22.08 26.00 - 10.26HIBB § HIBBETT SPORTS INC # JAN 2.74 2.78 2.19 1.63 1.14 11.78 9.26 7.72 7.17 6.11 68.31 - 50.01 63.39 - 43.02 47.22 - 29.83 39.84 - 20.77 22.80 - 12.82
HZO § MARINEMAX INC SEP 0.65 0.05 (0.52) 0.11 (4.11) 9.42 8.77 8.66 9.12 9.11 16.95 - 8.60 11.24 - 6.34 10.63 - 5.50 12.79 - 6.17 9.46 - 1.19ODP † OFFICE DEPOT INC DEC (0.29) (0.39) 0.22 (0.30) (2.30) 2.92 2.03 2.29 2.36 2.70 6.10 - 3.40 3.81 - 1.51 6.25 - 1.75 9.19 - 3.36 7.84 - 0.59OUTR § OUTERWALL INC DEC 7.65 4.96 3.76 2.11 0.85 (4.59) 6.65 8.30 5.21 3.12 72.09 - 46.25 71.82 - 40.50 60.71 - 37.43 67.56 - 25.37 38.28 - 18.84PETM [] PETSMART INC # JAN 4.06 3.61 2.59 2.05 1.62 10.46 10.25 10.08 9.75 9.36 77.32 - 61.30 72.75 - 50.18 52.62 - 37.76 40.76 - 25.01 27.50 - 16.17SIG † SIGNET JEWELERS LTD # JAN 4.59 4.37 3.76 2.34 1.92 31.62 28.32 26.23 22.18 20.74 79.32 - 52.60 56.95 - 40.74 48.30 - 30.93 44.48 - 25.72 29.07 - 5.91
SPLS [] STAPLES INC # JAN 1.08 (0.24) 1.42 1.23 1.04 3.83 3.75 3.68 3.23 2.86 17.30 - 11.40 16.93 - 10.57 23.75 - 11.94 26.00 - 17.45 25.10 - 14.35TIF [] TIFFANY & CO # JAN 1.42 3.28 3.45 2.91 2.14 20.50 19.74 18.36 16.96 14.71 93.02 - 57.11 74.20 - 49.72 84.49 - 54.58 65.76 - 35.81 44.49 - 16.70TSCO [] TRACTOR SUPPLY CO DEC 2.35 1.95 1.55 1.15 0.80 8.85 7.30 7.00 6.34 5.01 78.17 - 44.27 51.87 - 34.25 39.11 - 22.63 24.74 - 12.28 13.63 - 7.17VSI § VITAMIN SHOPPE INC DEC 2.22 2.06 1.56 1.07 0.78 8.07 6.66 3.75 1.77 (0.50) 65.93 - 39.92 61.89 - 39.43 48.36 - 30.00 34.37 - 19.31 24.00 - 17.35
OTHER COMPANIES WITH SIGNIFICANT SPECIALTY RETAIL OPERATIONSABG ASBURY AUTOMOTIVE GROUP INC DEC 3.29 2.68 1.51 1.16 0.76 12.92 10.84 8.76 7.07 6.94 55.82 - 31.64 32.77 - 20.59 22.00 - 14.96 18.90 - 9.69 14.95 - 1.60PIR PIER 1 IMPORTS INC/DE # FEB 1.03 1.22 1.50 0.86 0.86 4.55 5.05 4.50 3.51 2.62 25.28 - 19.00 21.24 - 13.84 14.14 - 8.60 10.99 - 4.65 5.74 - 0.10SHW [] SHERWIN-WILLIAMS CO DEC 7.41 6.15 4.22 4.28 3.84 2.82 2.79 0.99 1.74 1.80 195.32 - 153.94 159.80 - 90.21 90.42 - 69.47 84.99 - 57.86 64.13 - 42.19ZLC ZALE CORP JUL 0.31 (0.84) (3.49) (2.99) (5.94) 2.66 2.43 3.36 6.53 8.73 17.16 - 3.76 7.66 - 2.18 6.90 - 2.06 5.08 - 1.35 8.51 - 0.89
Note: Data as originally reported. ‡S&P 1500 index group. []Company included in the S&P 500. †Company included in the S&P MidCap 400. §Company included in the S&P SmallCap 600. #Of the follow ing calendar year. J-This amount includes intangibles that cannot be identif ied.
The analysis and opinion set forth in this publication are provided by S&P Capital IQ Equity Research and are prepared separately from any other analytic activity of Standard & Poor’s.In this regard, S&P Capital IQ Equity Research has no access to nonpublic information received by other units of Standard & Poor’s.
The accuracy and completeness of information obtained from third-party sources, and the opinions based on such information, are not guaranteed.
INDUSTRY SURVEYS RETAILING: SPECIALTY / SEPTEMBER 2014 45

General Disclaimers S&P Capital IQ’s Industry Surveys Reports (the “Industry Surveys”) have been prepared and issued by S&P Capital IQ and/or one of its affiliates. In the United States and United Kingdom, the Industry Surveys are prepared and issued by Standard & Poor’s Financial Services LLC; in Hong Kong, by Standard & Poor’s Investment Advisory Services (HK) Limited, which is regulated by the Hong Kong Securities Futures Commission; in Singapore, by McGraw Hill Financial Singapore Pte. Limited, which is regulated by the Monetary Authority of Singapore; in Malaysia, by Standard & Poor’s Malaysia Sdn Bhd, which is regulated by the Securities Commission of Malaysia; in Australia, by Standard & Poor’s Information Services (Australia) Pty Ltd, which is regulated by the Australian Securities & Investments Commission; and in Japan, by McGraw Hill Financial Japan KK, which is registered by Kanto Financial Bureau. No content (including ratings, credit-related analyses and data, valuations, model, software or other application or output therefrom) or any part thereof (Content) may be modified, reverse engineered, reproduced or distributed in any form by any means, or stored in a database or retrieval system, without the prior written permission of Standard & Poor’s Financial Services LLC or its affiliates (collectively, S&P). The Content shall not be used for any unlawful or unauthorized purposes. S&P and any third-party providers, as well as their directors, officers, shareholders, employees or agents (collectively S&P Parties) do not guarantee the accuracy, completeness, timeliness or availability of the Content. S&P Parties are not responsible for any errors or omissions (negligent or otherwise), regardless of the cause, for the results obtained from the use of the Content, or for the security or maintenance of any data input by the user. The Content is provided on an “as is” basis. S&P PARTIES DISCLAIM ANY AND ALL EXPRESS OR IMPLIED WARRANTIES, INCLUDING, BUT NOT LIMITED TO, ANY WARRANTIES OF MERCHANTABILITY OR FITNESS FOR A PARTICULAR PURPOSE OR USE, FREEDOM FROM BUGS, SOFTWARE ERRORS OR DEFECTS, THAT THE CONTENT’S FUNCTIONING WILL BE UNINTERRUPTED OR THAT THE CONTENT WILL OPERATE WITH ANY SOFTWARE OR HARDWARE CONFIGURATION. In no event shall S&P Parties be liable to any party for any direct, indirect, incidental, exemplary, compensatory, punitive, special or consequential damages, costs, expenses, legal fees, or losses (including, without limitation, lost income or lost profits and opportunity costs or losses caused by negligence) in connection with any use of the Content even if advised of the possibility of such damages. Credit-related and other analyses, including ratings, and statements in the Content are statements of opinion as of the date they are expressed and not statements of fact. S&P’s opinions, analyses and rating acknowledgment decisions (described below) are not recommendations to purchase, hold, or sell any securities or to make any investment decisions, and do not address the suitability of any security. S&P assumes no obligation to update the Content following publication in any form or format. The Content should not be relied on and is not a substitute for the skill, judgment and experience of the user, its management, employees, advisers and/or clients when making investment and other business decisions. S&P does not act as a fiduciary or an investment adviser except where registered as such. While S&P has obtained information from sources it believes to be reliable, S&P does not perform an audit and undertakes no duty of due diligence or independent verification of any information it receives. S&P keeps certain activities of its business units separate from each other in order to preserve the independence and objectivity of their respective activities. As a result, certain business units of S&P may have information that is not available to other S&P business units. S&P has established policies and procedures to maintain the confidentiality of certain non-public information received in connection with each analytical process. S&P provides a wide range of services to, or relating to, many organizations, including issuers or underwriters of securities or obligors, investment advisers, broker-dealers, investment banks, other financial institutions and financial intermediaries. As a result, S&P may receive fees or other economic benefits from organizations whose securities or services it may recommend, analyze, rate, include in model portfolios, evaluate, price or otherwise address. The Industry Surveys are not intended to be investment advice and do not constitute any form of invitation or inducement by S&P Capital IQ to engage in investment activity. This material is not intended as an offer or solicitation for the purchase or sale of any security or other financial instrument. Any opinions expressed herein are given in good faith, are subject to change without notice, and are only current as of the stated date of their issue. Past performance is not necessarily indicative of future results. For details on the S&P Capital IQ conflict-of-interest policies, please visit: www.spcapitaliq.com/Policies
Notice to all Non U.S. Residents: S&P Capital IQ’s Industry Surveys may be distributed in certain localities, countries and/or jurisdictions (“Territories”) by independent third parties or independent intermediaries and/or distributors (the “Intermediaries” or “Distributors”). Intermediaries are not acting as agents or representatives of S&P Capital IQ. In Territories where an Intermediary distributes S&P Capital IQ’s Industry Surveys, the Intermediary, and not S&P Capital IQ, is solely responsible for complying with all applicable regulations, laws, rules, circulars, codes and guidelines established by local and/or regional regulatory authorities, including laws in connection with the distribution of third-party investment research, licensing requirements, supervisory and record keeping obligations that the Intermediary may have under the applicable laws and regulations of the territories where it distributes the Industry Surveys. Industry Surveys are not directed to, or intended for distribution to or use by, any person or entity who is a citizen or resident of or located in any locality, state, country or other jurisdiction where such distribution, publication, availability or use would be contrary to law or regulation or which would subject S&P Capital IQ or its affiliates to any registration or licensing requirements in such jurisdiction. Industry Surveys are not directed to, or intended for distribution to or use by, any person or entity who is not in a class qualified to receive Industry Surveys (e.g., a qualified person and/or investor), as defined by the local laws or regulations in the country or jurisdiction where the person is domiciled, a citizen or resident of, or the entity is legally registered or domiciled. S&P Capital IQ’s Industry Surveys are not intended for distribution in or directed to entities, residents or investors in: Albania, Belarus, Bosnia, Burma, Cote d’Ivoire, Croatia, Cuba, Democratic Republic of the Congo, Former Yugoslav Republic of Macedonia, Herzegovina, Iran, Iraq, Kosovo, Lebanon, Libya, Montenegro and Serbia, North Korea, Somali, Sudan, Syria, Taiwan, Yemen and Zimbabwe. For residents of Australia: Industry Surveys are issued and/or distributed in Australia by SPIS. Any express or implied opinion contained in an Industry Survey is limited to “General Advice” and based solely on consideration of the investment merits of the financial product(s) alone. The information in an Industry Survey has not been prepared for use by retail investors and has been prepared without taking account of any particular investor’s financial or investment objectives, financial situation or needs. Before acting on any advice, any investor using the advice should consider its appropriateness having regard to their own or their clients’ objectives, financial situation and needs. Investors should obtain a Product Disclosure Statement relating to the product and consider the statement before making any decision or recommendation about whether to acquire the product. Each opinion must be weighed solely as one factor in any investment decision made by or on behalf of any adviser and any such adviser must accordingly make their own assessment taking into account an individual’s particular circumstances. SPIS holds an Australian Financial Services License Number 258896. Please refer to the SPIS Financial Services Guide for more information at: www.spcapitaliq.com/FinancialServicesGuide For residents of China: Industry Surveys are not distributed in or directed to residents in The People’s Republic of China. Neither S&P Capital IQ nor its affiliates target investors in China. For residents of Kuwait: The Distributor, and not S&P Capital IQ, is responsible for complying with all relevant licensing requirements as set forth by the Kuwait Capital Markets Law (“CML”) and Kuwait Capital Markets Authority (“CMA”) and with all relevant rules and regulations set out in the CML and CMA rule books. For residents of Malaysia: All queries in relation to Industry Surveys should be referred to Ahmad Halim at [email protected]. For residents of Mexico: S&P Capital IQ is not regulated or supervised by the Mexican National Banking and Securities Commission (“CNBV”). S&P Capital IQ has a licensed rating agency affiliate in Mexico (Standard & Poor’s, S.A. De C.V.), of which S&P maintains firewalls and seeks to avoid conflicts of interest, pursuant to approved policies. For residents of Qatar: The Distributor, and not S&P Capital IQ, is responsible for complying with all relevant licensing requirements as set forth by the Qatar Financial Markets Authority or the Qatar Central Bank, and with all relevant rules and regulations set out in the Qatar Financial Markets Authority’s rule book, including third party branded investment research distribution of securities that are admitted for trading on a Qatari securities exchange (Admitted Securities). Copyright © 2014 Standard & Poor’s Financial Services LLC. All rights reserved. STANDARD & POOR’S, S&P, S&P 500, S&P EUROPE 350 and STARS are registered trademarks of Standard & Poor’s Financial Services LLC. S&P CAPITAL IQ is a trademark of Standard & Poor’s Financial Services LLC.
46 RETAILING: SPECIALTY / SEPTEMBER 2014 INDUSTRY SURVEYS