
Results - link.springer.com · Web viewCarrow-Woolfolk, 1999), ... That’s more like it: Multiple...
15
Supplementary Materials Adult Pilot Study The prediction of the NN model that training including only the prototype will increase correct categorization and generalization in the children who show atypical generalization with variable training examples is quite novel. The category learning literature predicts that when people are having trouble generalizing they benefit from more variable training examples. It has been known for over a quarter of a century that adults show better learning and generalization when they learn categories from multiple variable training exemplars rather than a few good examples (e.g., Homa, Sterling, & Trepel, 1981). This benefit of variable training for category generalization has also been shown in a number of studies with typically developing children of various ages. School-age children show advantages for variable examples in visual sorting tasks (e.g., Hayes & Taplin, 1993). Infants show greater generalization and learning with variable examples in visual learning of natural categories (e.g., Kovack-Lesh & Oakes, 2007), and toddlers consistently show an advantage for category generalization and category labelling
-
Upload
nguyendieu -
Category
Documents
-
view
213 -
download
1
Transcript of Results - link.springer.com · Web viewCarrow-Woolfolk, 1999), ... That’s more like it: Multiple...
Supplementary Materials
Adult Pilot Study
The prediction of the NN model that training including only the prototype will increase
correct categorization and generalization in the children who show atypical generalization with
variable training examples is quite novel. The category learning literature predicts that when
people are having trouble generalizing they benefit from more variable training examples. It has
been known for over a quarter of a century that adults show better learning and generalization
when they learn categories from multiple variable training exemplars rather than a few good
examples (e.g., Homa, Sterling, & Trepel, 1981). This benefit of variable training for category
generalization has also been shown in a number of studies with typically developing children of
various ages. School-age children show advantages for variable examples in visual sorting tasks
(e.g., Hayes & Taplin, 1993). Infants show greater generalization and learning with variable
examples in visual learning of natural categories (e.g., Kovack-Lesh & Oakes, 2007), and
toddlers consistently show an advantage for category generalization and category labelling with
variable examples (e.g., Perry, Samuelson, Malloy, & Schiffer, 2010; Twomey, Ranson, &
Horst, 2014). Given all of these examples of greater generalization with variable training in both
adults and children, typical children, and adults should show reduced generalization after training
with only the prototype as compared to training with variable examples. The NN model predicts
that A Type 1 children with HFASD will also show this pattern, but that A Type 2 children will
show increased learning and generalization when trained with only the prototype. To pilot our
tasks to be sure that the particular stimuli and task would produce the normative reduced
generalization after Prototype-Only training typically seen in adults and children, we initially ran
the exact tasks used with the children with HFASD with college students.
Participants. Fifty-one undergraduates from the University of Buffalo participated for
partial fulfillment of their introductory psychology course requirements. Seven participants were
excluded for using one response more than 75% of time. Two participants were excluded
because of experimenter error, and one was dropped for having more than 10 missing values.
Finally eight participants were randomly dropped to equate counterbalancing conditions. Thirty-
two adults were included in the final data analyses. All stimuli, materials, procedure, and design
elements were exactly the same as in the experiment run with the children except they only did
one experiment, and it was run on desktop computers at the University, instead of laptop
computers at the treatment program.
Results
A (2 X 7) GLM using the proportion of category endorsements as the dependent measure,
and Training (Distortion, Prototype Only) and Stimuli (prototype, L2, L3, L4, L5, L7, random)
as the within participant variables found significant main effects of Training, F(1,31) = 10.70, p
= .003, ηp2 = .26, and Stimuli, F(6,186) = 67.33, p < .001, ηp
2 = .69, reflecting greater overall
endorsements after distortion training, and more endorsement of less distorted stimuli. The
interaction between Training and Stimuli was also significant, F(6,186) = 6.45, p = .001, ηp2
= .17, reflecting the reduced generalization seen after prototype only training (See Figure S1).

Prototype L2 L3 L4 L5 L7 Random0
0.10.20.30.40.50.60.70.80.9
1
Distortion ProtoOnly
Figure S1. Proportion of category endorsements across stimulus type after Distortion and Prototype
Only training. Error bars depict standard error of the means.
Criterion for Inclusion in the HFASD Sample
All the children in this study were recruited from a summer psychosocial intervention
treatment program specifically designed for school age children with high functioning autism
spectrum disorder (HFASD). Children completed a series of tests as part of the application
process for the program and only children with a Wechsler Intelligence Scale for Children-4th
Edition (WISC-IV, Wechsler, 2003) short-form IQ composite > 70 (and a major index score
{VCI or PRI} > 80); receptive or expressive language score > 80 on the Comprehensive
Assessment of Spoken Language (CASL short form, Carrow-Woolfolk, 1999), and a score
meeting ASD criteria on the Autism Diagnostic Interview-Revised (ADI-R, Rutter, LeCouteur,
& Lord, 2003) were included in the program. All the children at the summer treatment program
during the time of testing participated in the experiment. The sample size was determined by
number of children available given the recruitment site and days of testing.

Stimuli Construction
Random dot shapes are modifications of random dot patterns. The specific algorithms
used to create these shapes have been used in multiple experiments and their properties and
perceived similarity are well understood (e.g., Church et al, 2010; Posner & Keele, 1968; Smith
Redford & Haas, 2008).They are generated by affixing nine points within a 30x30 pixel central
area of a 50x50 pixel area.
Varying levels of distortion are created by changing the probability that each dot moves
within a five area space. In Area 1, a dot keeps its original position. In Area 2, a dot moves to
one of the 8 pixels immediately surrounding the original dot. In Area 3, a dot moves to a position
on the 16 pixel shell around the previous 8. In Area 4, a dot moves to one of the positions on the
third, fourth, and half of the fifth pixel shell around Areas 1-3. In Area 5, a dot moves to one of
the remaining 300 pixels in a 20x20 peripheral grid outside of Areas 1-4. The probability that
the dots of the prototype (distortion level 0) stay in area 1 is 1.0. See Table S1 for the remaining
location probabilities.
Table S1. Dot location probabilities for each distortion level.
Distortion Level
Area 1 Area 2 Area 3 Area 4 Area 5
2 .75 .15 .05 .03 .023 .59 .20 .16 .03 .024 .36 .48 .06 .05 .055 .2 .3 .4 .05 .057 0 .24 .16 .3 .3
The patterns were magnified three times by mapping each point into the center of a 3x3
pixel area, so that a pattern originally represented in a 50x50 pixel area was displayed in an area
of 150x150 pixels. Shapes were created from the random dot patterns using the DrawPoly
procedure in Turbo Pascal 7.0 to join successively created dots with lines. Lastly, this program
added a variety of colors to fill the shapes.
Random patterns were created by random placement of nine dots in the 50x50 pixel area.
Using identical procedures, the Random patterns were enlarged, joined, and colored (See Figure
S2 for example stimuli).

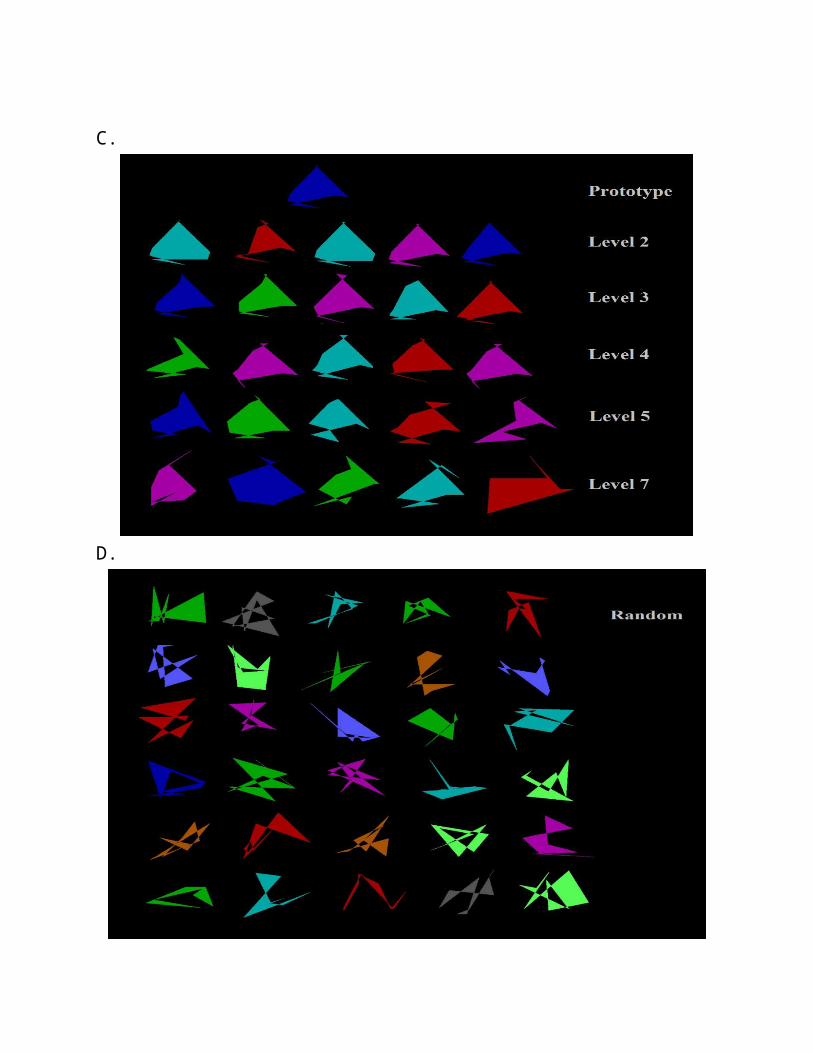
Figure S2. Stimulus Set B: A. Category-members shown during training. B. Non-category-
members shown during training. C. Category-members shown during testing. D. Non-category-members
shown during testing.
A.
B.

C.
D.

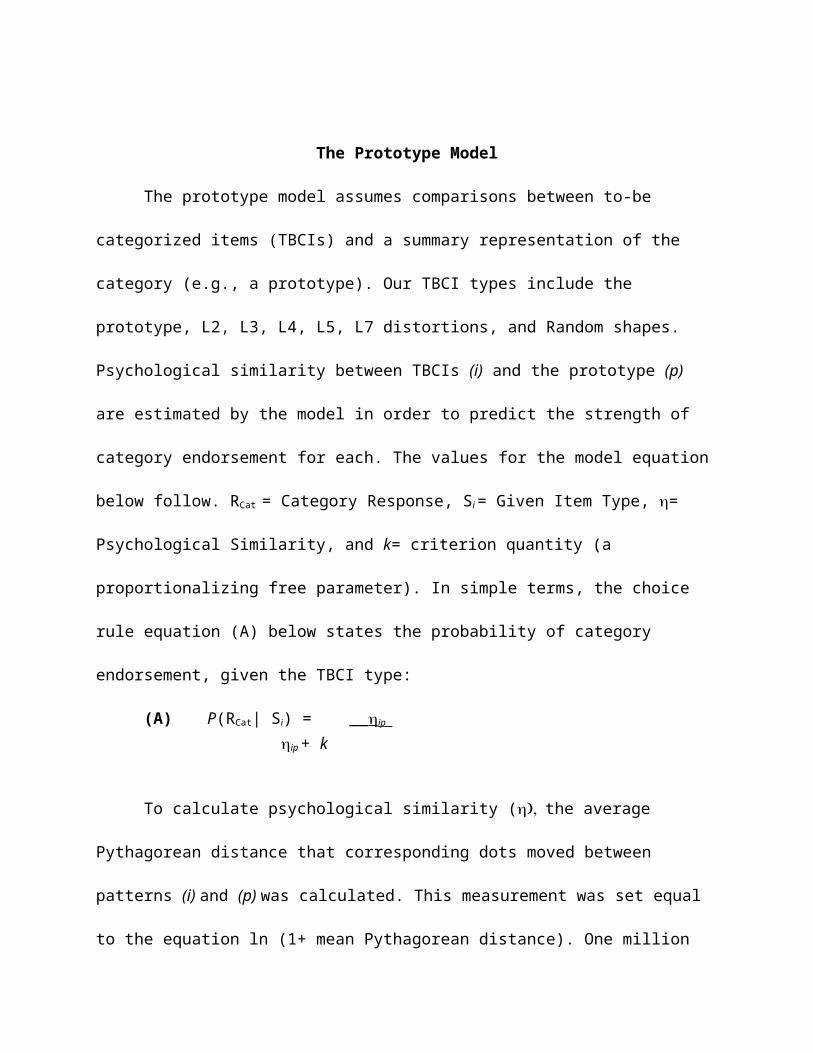
The Prototype Model
The prototype model assumes comparisons between to-be categorized items (TBCIs) and
a summary representation of the category (e.g., a prototype). Our TBCI types include the
prototype, L2, L3, L4, L5, L7 distortions, and Random shapes. Psychological similarity between
TBCIs (i) and the prototype (p) are estimated by the model in order to predict the strength of
category endorsement for each. The values for the model equation below follow. RCat = Category
Response, Si = Given Item Type, = Psychological Similarity, and k= criterion quantity (a
proportionalizing free parameter). In simple terms, the choice rule equation (A) below states the
probability of category endorsement, given the TBCI type:
(A) P(RCat| Si) = __ip__
ip + k
To calculate psychological similarity (the average Pythagorean distance that
corresponding dots moved between patterns (i) and (p) was calculated. This measurement was
set equal to the equation ln (1+ mean Pythagorean distance). One million samplings of each pair
type were modeled to produce the values: 0.0000, 0.4497, 0.6401, 0.8687, 1.094, 1.762, and
2.8479 (average logarithmic distances between the prototype and the prototype, L2, L3, L4, L5,
L7 distortions, and Random shapes respectively).
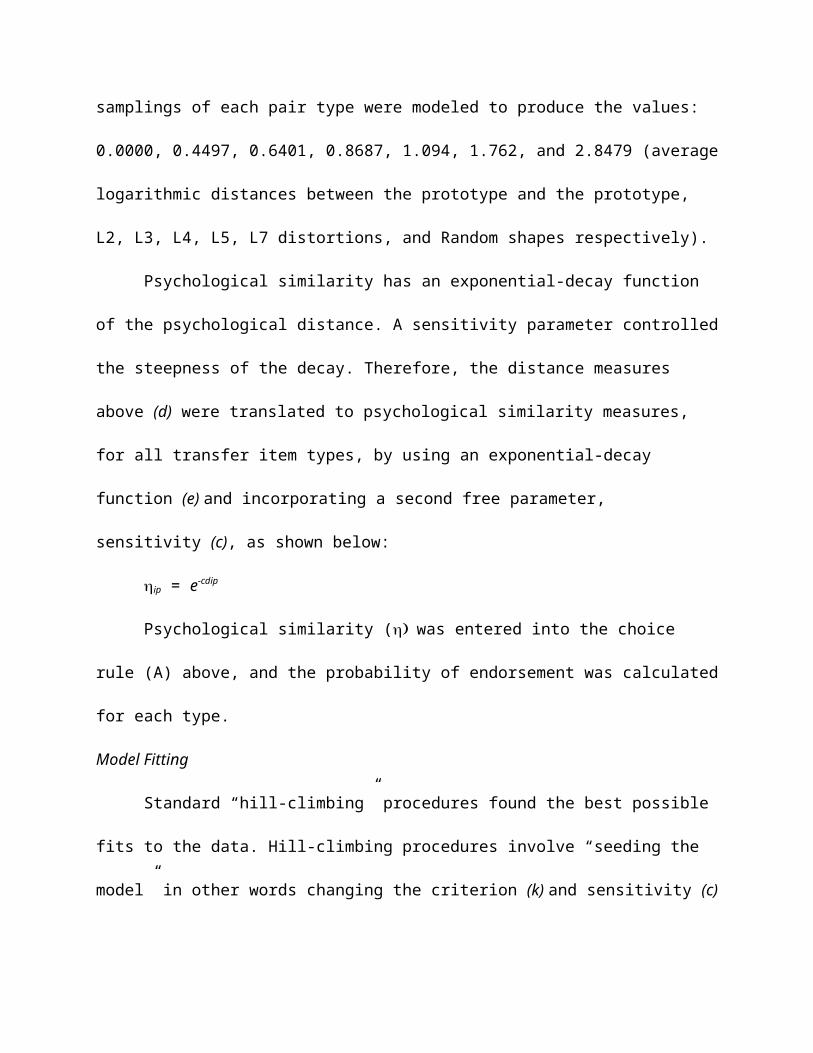
Psychological similarity has an exponential-decay function of the psychological distance.
A sensitivity parameter controlled the steepness of the decay. Therefore, the distance measures
above (d) were translated to psychological similarity measures, for all transfer item types, by
using an exponential-decay function (e) and incorporating a second free parameter, sensitivity
(c), as shown below:
ip = e-cdip
Psychological similarity (was entered into the choice rule (A) above, and the
probability of endorsement was calculated for each type.
Model Fitting
Standard “hill-climbing” procedures found the best possible fits to the data. Hill-climbing
procedures involve “seeding the model” in other words changing the criterion (k) and sensitivity
(c) free parameters to produce the lowest deviation between the model predictions and actual
observed performance.
During each instance of seeding, one parameter and a directional change were randomly
applied, and new values replaced the old values if they produced a better fit. The directional
changes were always very small (1/10,000,000 for criterion and 1/10,000 for sensitivity) and
respected the upper and lower bounds of the free parameters (0.0000001 and .1 for criterion
and .0001 and 10 for sensitivity). At least four hill-climbing attempts (using new configurations
of free parameter values) were made for every item type, to ensure that local minima did not
limit the model’s power. Once the best fit had been determined, the sum of the squared
deviations between the model predictions and the observed values and the values of the
sensitivity (c), and criterion (k) free parameters were recorded for each participant.
References
Carrow-Woolfolk, E. (1999). Comprehension assessment of spoken language. Circle Pines, MN:
American Guidance Service.
Church, B. A., Krauss, M. S., Lopata, C., Toomey, J. A., Thomeer, M. L., Coutinho, M. V., &
Mercado, E., III. (2010). Atypical categorization in children with high-functioning autism
spectrum disorder. Psychonomic Bulletin & Review, 17, 862-868. doi:
10.3758/PBR.17.6.862
Hayes, B. K. & Taplin, J. E. (1993). Developmental differences in the use of prototype and
exemplar-specific information. Journal of Experimental Child Psychology, 55, 329-352.
doi: 10.1006/jecp.1993.1019
Homa, D., Sterling, S., & Trepel, L. (1981). Limitations of exemplar-based generalization and
the abstraction of categorical information. Journal of Experimental Psychology: Human
Learning and Memory, 7, 418-439. doi: 10.1037/0278-7393.7.6.418
Kovack, K. A., & Oakes, L. M. (2007). Hold your horses: How exposure to different items
influences infant categorization. Journal of Experimental Child Psychology, 98, 69-93.
doi:10.1016/j.jecp.2007.05.001
Perry, L. K., Samuelson, L. K., Malloy, L. M., & Schiffer, R. N. (2010). Learn locally, think
globally: Exemplar variability supports higher-order generalization and word learning.
Psychological Science, 21, 1894-1902. doi: 10.1177/0956797610389189
Posner, M.I., & Keele, S.W. (1968). On the genesis of abstract ideas. Journal of Experimental
Psychology, 77, 353-363. doi: 10.1037/h0025953
Rutter, M, LeCouteur, A., & Lord, C. (2003). The Autism Diagnostic Interview- Revised (ADI-
R). Los Angeles, CA: Western Psychological Services.
Smith, J. D., Redford, J. S., & Haas, S. M. (2008). Prototype abstraction by monkeys (Macaca
mulatta). Journal of Experimental Psychology: General, 137, 390-401. doi:
10.1037/0096-3445.137.2.390
Twomey, K. E., Ranson, S. L., & Horst, J. S. (2014). That’s more like it: Multiple exemplars
facilitate word learning. Infant and Child Development, 23, 105-122. doi:
10.1002/icd.1824
Wechsler, D. (2003). Wechsler intelligence scale for children (4th ed.). San Antonio, TX: The
Psychological Corporation.