RESULTS FOR ANNOUNCEMENT TO THE MARKET...ASX Full Year Results Announcement Page: 5 Dated: 20 August...
32
ASX Full Year Results Announcement Page: 1 Dated: 20 August 2007 BLUESCOPE STEEL LIMITED A.B.N. 16 000 011 058 Level 11, 120 Collins Street Melbourne, Victoria 3001 Ph: +61 (03) 9666 4000 Fax: +61 (03) 9666 4111 Website: www.bluescopesteel.com ASX Code: BSL FOR IMMEDIATE RELEASE RESULTS FOR ANNOUNCEMENT TO THE MARKET (Under ASX listing rule 4.2A) Annual Earnings Report Twelve Months Ended 30 June 2007 Note: This report is based on accounts, including the restatement of the comparative corresponding period, prepared in accordance with the Australian Equivalents to International Financial Reporting Standards (AIFRS). In particular, tinplate manufacture, Vistawall North America and Lysaght Taiwan have been reclassified to Discontinued Operations in all periods (refer to Attachment 2 for a breakdown of the financial data by business). Melbourne – 20 August 2007 – BlueScope Steel Limited (ASX Code: BSL) today reported its financial results for the twelve months ended 30 June 2007. Table 1 provides a recap of headlines for FY 2007. Table 1: FY2007 Headlines Earnings performance Record full year revenue of $8,913M. NPAT was up 103% to $686M from $338M and EPS up 47.4 cents to 95.3 cents, with every business segment profitable. Earnings before interest, tax, depreciation and amortisation (EBITDA) was up 67% to $1,423M largely due to improved domestic and export prices, higher sales volumes, improved sales mix and profit on sale of the Vistawall business partly offset by higher raw material costs and adverse foreign exchange impacts. Net cash flow from operating and investing activities (pre-tax) increased by $932M to $802M. During August 2006 the company acquired 19.9% of the shares in Smorgon Steel for $319M. These shares are to be bought back as part of the consideration for the Smorgon Steel distribution business acquired 3 August 2007 for approximately $700M. A gain on sale of the shares of approximately $128M (before tax) will be recognised in the FY 2008 earnings. The Vistawall business was sold on 29 June for US$190M. Financial ratios for FY 2007 vs FY 2006 Return on equity (based on net profit after tax (NPAT) attributable to shareholders) 20.3% 10.4% Return on invested capital (based on NPAT) 14.9% 8.5% Gearing (net debt/net debt plus equity) 28.0% 38.0% Dividends Final ordinary dividend 26cps, fully franked, up 2cps on the previous year’s final dividend. The total FY2007 ordinary dividend was 47cps, up 3cps or 7% on FY 2006.
Transcript of RESULTS FOR ANNOUNCEMENT TO THE MARKET...ASX Full Year Results Announcement Page: 5 Dated: 20 August...

ASX Full Year Results Announcement Page: 1 Dated: 20 August 2007
BLUESCOPE STEEL LIMITED A.B.N. 16 000 011 058 Level 11, 120 Collins Street Melbourne, Victoria 3001 Ph: +61 (03) 9666 4000 Fax: +61 (03) 9666 4111 Website: www.bluescopesteel.com ASX Code: BSL FOR IMMEDIATE RELEASE RESULTS FOR ANNOUNCEMENT TO THE MARKET (Under ASX listing rule 4.2A) Annual Earnings Report Twelve Months Ended 30 June 2007 Note: This report is based on accounts, including the restatement of the comparative corresponding period, prepared in accordance with the Australian Equivalents to International Financial Reporting Standards (AIFRS). In particular, tinplate manufacture, Vistawall North America and Lysaght Taiwan have been reclassified to Discontinued Operations in all periods (refer to Attachment 2 for a breakdown of the financial data by business).
Melbourne – 20 August 2007 – BlueScope Steel Limited (ASX Code: BSL) today reported its financial results for the twelve months ended 30 June 2007.
Table 1 provides a recap of headlines for FY 2007. Table 1: FY2007 Headlines
Earnings performance
Record full year revenue of $8,913M. NPAT was up 103% to $686M from $338M and EPS up 47.4 cents to 95.3 cents, with every business
segment profitable. Earnings before interest, tax, depreciation and amortisation (EBITDA) was up 67% to $1,423M largely due
to improved domestic and export prices, higher sales volumes, improved sales mix and profit on sale of the Vistawall business partly offset by higher raw material costs and adverse foreign exchange impacts.
Net cash flow from operating and investing activities (pre-tax) increased by $932M to $802M. During August 2006 the company acquired 19.9% of the shares in Smorgon Steel for $319M. These
shares are to be bought back as part of the consideration for the Smorgon Steel distribution business acquired 3 August 2007 for approximately $700M. A gain on sale of the shares of approximately $128M (before tax) will be recognised in the FY 2008 earnings.
The Vistawall business was sold on 29 June for US$190M. Financial ratios for FY 2007 vs FY 2006
Return on equity (based on net profit after tax (NPAT) attributable to shareholders) 20.3% 10.4% Return on invested capital (based on NPAT) 14.9% 8.5% Gearing (net debt/net debt plus equity) 28.0% 38.0%
Dividends
Final ordinary dividend 26cps, fully franked, up 2cps on the previous year’s final dividend. The total FY2007 ordinary dividend was 47cps, up 3cps or 7% on FY 2006.

ASX Full Year Results Announcement Page: 2 Dated: 20 August 2007
Operations Upstream
Australia (PKSW) – another outstanding operations performance, with annual production records set for ironmaking, slab, hot rolled coil and plate.
New Zealand – slab production improved year on year.
North America (North Star BlueScope) – another excellent operations result with raw steel production
maintained. More importantly, a number of process initiatives should result in some capacity creep in FY 2008.
Mid and down-stream
Australia - the coated businesses established new metal coating and painting annual production records. The tin plate operations closed in April 2007 whilst the West Sydney COLORBOND® facility commenced operations in August 2007.
New Zealand – achieved new annual production records on the metal coating and paint lines.
Asia – vastly improved operations performance in Vietnam, Thailand and Malaysia, whilst the
Indonesian coating lines continue to exceed expectations. The China metal coating lines came into operation and are being ramped up.
North America – another very strong operations outcome with production up marginally on FY 2006.
Capital Growth Projects
Indonesia – in May 2007 approval was given to recommence the second metal coating line in Indonesia (commence operations end CY 2009).
India – work continues on the metal coating line project (mid CY 2009).
Appointment of new MD & CEO
The Board announced the appointment of Paul O’Malley, the current Chief Financial Officer, to succeed Kirby Adams as Managing Director and CEO of BlueScope Steel. His appointment will be effective from 1 November 2007.

ASX Full Year Results Announcement Page: 3 Dated: 20 August 2007
Consolidated Results Table 2a provides the FY2007 consolidated financial results and the comparable FY 2006 period. Table 2b reconciles underlying operational earnings to reported earnings. Table 2a : Financial Headlines Twelve months ended 30/06/07 (“FY2007”) and 30/06/06 (“FY 2006”) Variance Financial Measure FY 2007 FY 2006 $ % Total revenue(1) A$M 8,913 8,031 882 11 Earnings before interest, tax, depreciation and amortisation (EBITDA)(2)
A$M
1,423
850 573 67
EBIT(2) A$M 1,099 556 543 98 Interest expense A$M (141) (90) (51) (57) NPAT attributable to BlueScope Steel shareholders
A$M
686
338 348 103
Earnings per share ¢/s 95.3 47.9 47.4 99 Diluted earnings per share(3) ¢/s 94.6 47.7 46.9 98 Final dividend ¢/s 26 24 2 8 Full year dividend ¢/s 47 44 3 7 Net cash flow from operating and investing activities (pre-tax)
A$M
802
(130) 932 717
Return on invested capital(4) % 14.9% 8.5% Return on equity(5) % 20.3% 10.4% Gearing (net debt / net debt plus equity) % 28.0% 38.0% Net tangible assets per share $/s 4.87 4.02
(1) Excludes the company’s 50% share of North Star BlueScope Steel revenue of $722M in FY 2007 ($712M in FY 2006). Includes revenue other than sales revenue of $53M ($19M in FY 2006). Includes revenue from discontinued businesses of $748M ($708M in FY 2006).
(2) Includes 50% share of net profit from North Star BlueScope Steel of $156M in FY 2007 ($169M in FY 2006). (3) Earnings per share is diluted for executive share right awards that are likely to vest based on current TSR performance. (4) Return on invested capital is defined as net profit after tax over average monthly capital employed. (5) Return on equity is defined as net profit after tax attributable to shareholders over average monthly shareholders’ equity. Variance Analysis (FY 2007 vs. FY 2006)
Total revenue The $882M (11%) increase principally reflects:
Higher global slab and hot rolled coil prices and the flow on to domestic prices. Favourable mix of value added export coated products following recovery from the Western Port
fire in the comparative period. Favourable mix of Australian domestic sales driven mainly by stronger demand in the pipe and
tube, building and distribution markets. Higher Coated and Building Products sales volumes across all regions within Asia and North
America.
Partially offset by: Higher average AUD:USD exchange rate of 0.786 compared to the previous corresponding period
of 0.747.
ASX Full Year Results Announcement Page: 4 Dated: 20 August 2007
EBIT
The $543M (98%) increase principally reflects: Prices ($646M favourable)
− Higher export slab and hot rolled coil prices from Hot Rolled Products Australia. − Higher domestic and export prices realised by Coated and Building Products Australia were
driven by higher global slab and hot rolled coil prices and the full year impact of the prior year’s price increases in the domestic building sector.
− Higher Coated and Building Products prices in Asia (predominantly Indonesia, Malaysia and Thailand) and North America.
Sales volumes and product mix ($76M favourable)
− Favourable mix of Australian domestic sales driven mainly by stronger domestic demand in the pipe and tube, building and distribution markets.
− Higher domestic sales volumes in the North American Coated and Building Products business.
North Star BlueScope Steel ($13M unfavourable) − Higher conversion costs driven by higher cost of electricity and alloys. − An adverse movement in the AUD:USD relative to the previous comparative period.
Partly offset by: − Higher spread with hot rolled coil prices in North America increasing more than increases in
the price of scrap feed.
Exchange rates ($44M unfavourable) − Unfavourable movement in the AUD:USD relative to the previous comparative period.
Average exchange rate for FY 2007 was 0.786 compared to 0.747 in FY 2006. Raw material costs ($365M unfavourable)
− The benefit of consuming lower priced iron ore from inventories at the start of 1H FY 2006. − Higher scrap costs and higher USD iron ore and coking coal purchase prices at the Port
Kembla Steelworks. − Higher zinc and aluminium coating metal costs. − Higher steel feed costs principally in Coated and Building Products Asia and North America.
Costs ($34M unfavourable) comprising the following components:
Cost improvement initiatives ($109M favourable)
- Cost reductions reflecting the effect on unit costs of initiatives to improve yield, labour productivity and other costs.
Cost escalation ($127M unfavourable)
- Escalation of employment, utilities, consumables and other costs.
One-off and discretionary costs ($26M favourable) - Additional discretionary maintenance at Port Kembla Steelworks to support record
production partially offset by lower maintenance costs mainly at New Zealand Steelworks. - Lower unit costs at Western Port following recovery from the fire at Western Port during
1H FY 2006. - Lower pre-production and business development costs predominantly at the Vietnam,
India and China development projects together with start-up costs associated with the Buildings North America Jackson Plant in 1H FY 2006.
Other costs ($42M unfavourable)
- Higher freight costs primarily due to destination mix, additional cost of fuel and rate increases.
- Reduced contribution from vanadium due to softening world prices.
ASX Full Year Results Announcement Page: 5 Dated: 20 August 2007
Other items ($64M favourable) - Profit on sale of surplus land in New South Wales, partially offset by profit on sale of the
Galesburg, Illinois facility during 1H FY 2006. - Dividend income on 19.9% shareholding in Smorgon Steel, including accrual for special
dividend to be paid in August 2007. - Lower redundancy costs at Hot Rolled Products Australia and Coated and Building Products
Australia primarily due to the staff restructuring provisions taken in June 2006. Discontinued Operations ($213M favourable)
- Provision for tinplate and Lysaght Taiwan closure costs in FY 2006. - Profit on Sale of Vistawall. - Lower than expected tinplate closure costs.
Partly offset by:
- Higher than expected costs to complete pre-existing construction contracts in Lysaght Taiwan. - Provision of costs for the demolition of #1 electrolytic tinning line.
Funding
Financing costs for the 12 months ended 30 June 2007 were $141M ($90M in FY 2006). The increase in costs reflects a $405M increase in average borrowings to $2,000M and an average interest rate of 6.6% (6.0% on FY 2006).
Tax
The effective tax rate for the 12 months ended 30 June 2007 was 27.0% (26.8% in FY 2006). The tax rate differs from the Australian tax rate of 30% primarily due to the recognition of additional deferred tax assets in New Zealand ($43M) combined with the utilisation of tax exemptions in our Thailand Coating operation. These were partly offset by North American operations being taxed at approximately 38% (35% US tax rate plus state taxes).
The additional deferred tax assets in NZ were in relation to timing differences associated with different tax/accounting depreciation rates, employee and other provisions. These were previously not recognised on the balance sheet due to their uncertainty of recoverability while NZ had significant carried forward tax losses.

ASX Full Year Results Announcement Page: 6 Dated: 20 August 2007
Table 2b: Reconciliation of Underlying Operational Earnings to Reported Earnings FY 2007 vs. FY 2006; $ millions Underlying Operational Earnings have been adjusted for unusual or non-recurring events to reflect the underlying financial performance from ongoing operations.
EBIT NPAT EPS Factors FY
2007 FY 2006 FY 2007 FY 2006 FY 2007 FY 2006
Reported earnings 1,099 556 686 338 0.95 0.48 Net (gains)/losses from businesses discontinued(1)
(16) 197 15 146 0.02 0.21
Reported earnings (from continuing operations) 1,083 753 701 484 0.97 0.69 Unusual or non-recurring events: Operating results affected by discontinued businesses(2)
(34) (42) (23) (30) (0.03) (0.04)
Significant production disruptions(3) 0 38 0 27 0 0.04 Business development and pre-operating costs(4)
20 40 17 37 0.02 0.05
Asset impairment(5) 0 17 0 12 0 0.02 Restructure and redundancy costs(6) (5) 48 (4) 34 (0) 0.04 Smorgon dividend income(7) 0 0 0 0 0 0 Asset sales(8) (7) (14) (5) (9) (0.01) (0.01) New Zealand tax adjustments(9) 0 0 (43) 0 (0.06) 0
Underlying Operational Earnings 1,057 840 643 555 0.89 0.79 (1) Profit on sale of Vistawall business in FY2007 plus Vistawall operating results for the two respective years combined with losses
incurred in Packaging Products and Lysaght Taiwan businesses that were closed during 2007. (2) Reflects domestic transfer pricing margins earned by Hot Rolled Products Australia and stranded costs arising from the tinplate
operations which have been closed. (3) Western Port fire in FY 2006. (4) Lower business development and pre-operating costs in Asia, North America and Corporate, partly offset by an increase in pre-
operating costs in Coated and Building Products Australia. (5) Impairment of assets damaged in the Western Port fire and impairment of Chullora solid block paint line in FY 2006. (6) FY 2007 reflects the write back of redundancy provisions at Hot Rolled Products Australia, raised in prior periods, driven by
natural attrition of employees. FY 2006 reflects provision for staff redundancies and other internal restructuring costs. (7) Dividend income on 19.9% shareholding in Smorgon Steel was $29M (fully franked) in FY 2007 compared to approximately
$19M of financing costs. Underlying operational earnings has not been adjusted as these shares formed part of the consideration for the Smorgon Distribution business acquisition on 3 August 2007.
(8) FY 2007 sale of property in New South Wales. FY 2006 sale of property in Western Australia and Galesburg, Illinois. (9) Recognition of deferred tax assets in New Zealand Steel.
Equity, Financial Flexibility and Cash Flow Table 3 below provides a summary of consolidated equity and return measures at 30 June 2007 and 2006. Table 3: Consolidated – Return Statistics FY 2007 and FY 2006; mixed measures Return Statistics FY 2007 FY 2006 % Shares outstanding – end of period (million) 733.8 698.9 5 Average shares – for the period (million) 719.7 704.1 2 Return on equity – based on NPAT attributable to shareholders (%) 20.3% 10.4% 94 Return on equity – based on underlying operational NPAT earnings (%) 19.0% 17.1% 10 Return on invested capital – based on NPAT (%) 14.9% 8.5% 75 Return on invested capital – based on underlying operational NPAT earnings (%)
14.1% 13.1% 7
ASX Full Year Results Announcement Page: 7 Dated: 20 August 2007
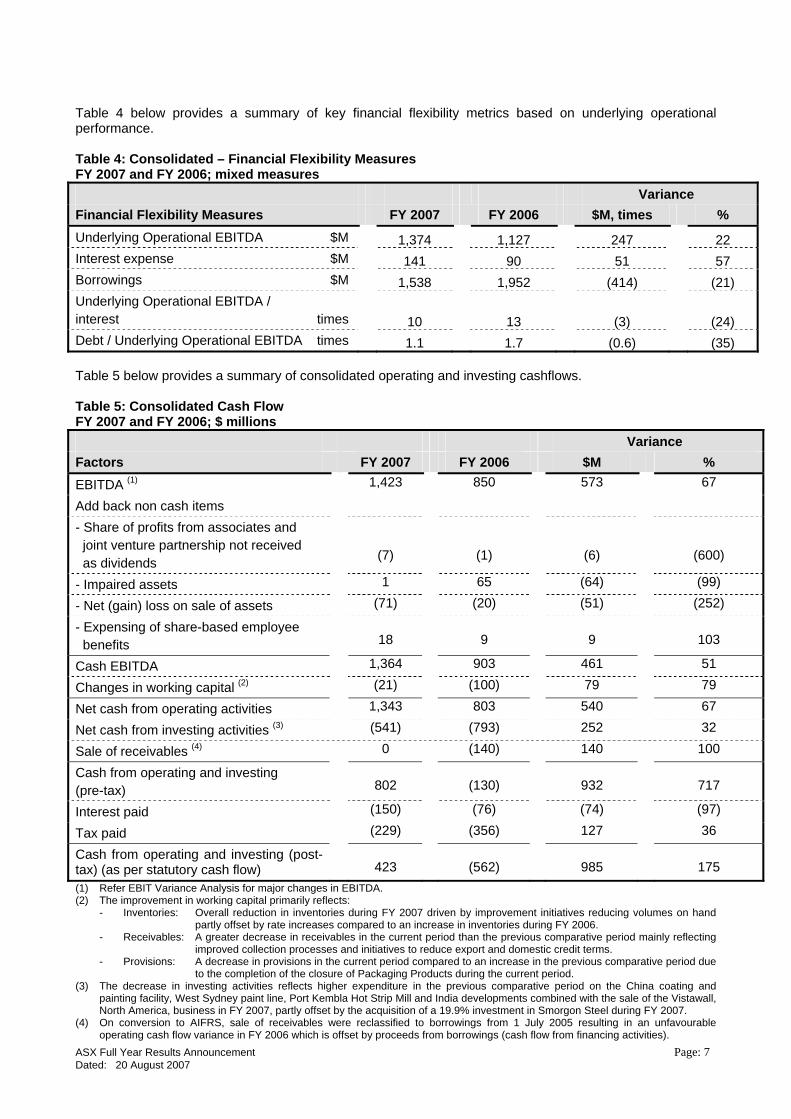
Table 4 below provides a summary of key financial flexibility metrics based on underlying operational performance. Table 4: Consolidated – Financial Flexibility Measures FY 2007 and FY 2006; mixed measures Variance Financial Flexibility Measures FY 2007 FY 2006 $M, times % Underlying Operational EBITDA $M 1,374 1,127 247 22 Interest expense $M 141 90 51 57 Borrowings $M 1,538 1,952 (414) (21) Underlying Operational EBITDA / interest times
10 13 (3) (24)
Debt / Underlying Operational EBITDA times 1.1 1.7 (0.6) (35) Table 5 below provides a summary of consolidated operating and investing cashflows. Table 5: Consolidated Cash Flow FY 2007 and FY 2006; $ millions Variance Factors FY 2007 FY 2006 $M % EBITDA (1) 1,423 850 573 67
Add back non cash items
- Share of profits from associates and joint venture partnership not received as dividends
(7)
(1)
(6)
(600)
- Impaired assets 1 65 (64) (99)
- Net (gain) loss on sale of assets (71) (20) (51) (252)
- Expensing of share-based employee benefits
18
9
9
103
Cash EBITDA 1,364 903 461 51
Changes in working capital (2) (21) (100) 79 79
Net cash from operating activities 1,343 803 540 67
Net cash from investing activities (3) (541) (793) 252 32
Sale of receivables (4) 0 (140) 140 100
Cash from operating and investing (pre-tax)
802
(130)
932
717
Interest paid (150) (76) (74) (97)
Tax paid (229) (356) 127 36
Cash from operating and investing (post-tax) (as per statutory cash flow)
423
(562)
985
175
(1) Refer EBIT Variance Analysis for major changes in EBITDA. (2) The improvement in working capital primarily reflects:
- Inventories: Overall reduction in inventories during FY 2007 driven by improvement initiatives reducing volumes on hand partly offset by rate increases compared to an increase in inventories during FY 2006.
- Receivables: A greater decrease in receivables in the current period than the previous comparative period mainly reflecting improved collection processes and initiatives to reduce export and domestic credit terms.
- Provisions: A decrease in provisions in the current period compared to an increase in the previous comparative period due to the completion of the closure of Packaging Products during the current period.
(3) The decrease in investing activities reflects higher expenditure in the previous comparative period on the China coating and painting facility, West Sydney paint line, Port Kembla Hot Strip Mill and India developments combined with the sale of the Vistawall, North America, business in FY 2007, partly offset by the acquisition of a 19.9% investment in Smorgon Steel during FY 2007.
(4) On conversion to AIFRS, sale of receivables were reclassified to borrowings from 1 July 2005 resulting in an unfavourable operating cash flow variance in FY 2006 which is offset by proceeds from borrowings (cash flow from financing activities).

ASX Full Year Results Announcement Page: 8 Dated: 20 August 2007
Group Review
In commenting on the full year results, Mr Kirby Adams, Managing Director and CEO of BlueScope Steel said:
“We mark FY2007 as another great year for BlueScope Steel shareholders and our second best year ever. New records were achieved in safety and environmental performance, full year revenue of nearly $9 billion and net cash flow of over $1 billion before M&A activity. Relative to FY 2006, NPAT and EPS doubled and our balance sheet gearing dropped from 38% to 28%, providing BlueScope Steel with a very strong financial platform for its continuing growth.
“This is a great financial result delivered by a strong management team and all the employees at BlueScope Steel, and very pleasing personally as I near the end of my seven and one half years’ tenure as CEO of BlueScope Steel.
“Your Board of Directors has declared a total ordinary dividend, fully franked, of 26 cents per share, a 7% increase on FY 2006. When paid, this dividend will bring to $2.3 billion or $3.15 per share, tax effectively returned to shareholders over the five years since public listing.
Five year anniversary
“This year marks our fifth anniversary since demerger and public listing. As we reflect on those five years, we can truly say that BlueScope Steel has been transformed from the former BHP Steel.
“From the beginning, our collective focus has been on creating value for our shareholders as we grow and we have never strayed from this principle, nor the idea that we are “a very different kind of steel company”. BlueScope Steel’s Enterprise Value has more than tripled to approximately $9 billion and the initial share price in 2002 has been fully returned to owners via $2.3 billion in dividends and buybacks.
“The trapezoid strategy is diversifying the Company’s revenue, products, markets and risks with Revenue and EBITDA each doubling over the past 5 years.
“Your company has grown from 11,000 to 18,000 employees, and approximately 90% of our employees are also shareholders.
“In 2002, we were known as an Australian steel maker. Today, we are also a leading global provider of steel building products and solutions.
“We have become a globally diverse company with 91 manufacturing plants in 17 countries around the world. Your Company has invested in its future and over five years, 20 major capital projects in 8 countries have been implemented with operations now ramping up for our next phase of growth.
“Safety is our number one priority. Our safety performance is at world best standards and nothing less than Zero Harm is acceptable.
“It has been an exciting journey and one of which I am truly privileged to have led. But, as every leader knows, these results have been delivered by a strong management team and 18,000 dedicated and inspiring BlueScope Steel people.
Consolidation in the steel industry
“The steel industry globally continues its consolidation theme with a number of transactions being concluded over the last 12-18 months, including Mittal’s acquisition of Arcelor; Tata’s purchase of Corus and more recently Ternium’s acquisition of Grupo IMSA. One of the principal benefits of this consolidation is better matching of production to demand as well as global economies of scale and marketing. I expect this consolidation process to continue its momentum over the next couple of years.
“During FY2007 your Company has been actively participating in the consolidation of the Australian steel industry. Our focus has been on the acquisition of the distribution business of Smorgon Steel and in May the Australian Competition and Consumer Commission (ACCC) gave its approval for it to proceed. Effective 3 August 2007 BlueScope Steel completed acquisition of Smorgon Steel Distribution. This transaction, BlueScope Steel’s single largest acquisition since listing, will provide an important channel to market, significantly expand our existing distribution capability for BlueScope Steel’s high quality products in Australia and further our growth strategy in downstream markets.

ASX Full Year Results Announcement Page: 9 Dated: 20 August 2007
Our Businesses
“One very pleasing outcome in FY 2007 was the excellent operational performance across all of our businesses, including numerous production records achieved by BlueScope Steel women and men.
“All business reporting segments were profitable, with Port Kembla Steelworks continuing to be the profit and cash flow engine of the Company. Pleasingly, our Asian portfolio exhibited substantial volume growth as new operations in China, Vietnam, Thailand and India were commissioned and ramped up. Margin compression in our midstream metallic coating and painting businesses prevailed through most of the year, as these businesses confronted huge increases in zinc costs and growing exports from expanding north Asian production.
“Highlights from the year included stronger pricing, particularly in export markets, improved domestic versus export mix, and more despatches of HRC as we enjoyed the full-year benefit of the Hot Strip Mill expansion as well as record steel production at Port Kembla Steelworks. Raw materials cost inflation was, again, a huge impost on the Company, adding $365 million to our costs of production and was primarily in the form of higher costs for iron ore, scrap, zinc, aluminium and freight.
Upstream Businesses HOT ROLLED PRODUCTS
“Our Port Kembla operation, in New South Wales, had an excellent year, with EBIT up 66% on FY 2006. This was largely due to higher sales prices and another outstanding operations performance resulting in ironmake, slab, hot rolled coil and plate production records. Notably, sales volumes to Australian customers increased.
“In the USA, North Star BlueScope Steel benefited from a higher HRC-Scrap spread over FY 2006 but this was offset by the effect of a stronger Australian dollar and higher electricity costs. Another outstanding operations performance was delivered.
NEW ZEALAND AND PACIFIC ISLANDS PRODUCTS
“Earnings were down 14% principally due to a stronger NZ dollar vs US dollar and higher metal coating costs. Domestic sales were stronger than FY 2006 whilst the annualised Q4 FY 2007 slab production was in excess of 600kt, which bodes well for FY 2008.
Midstream and Downstream Businesses COATED AND BUILDING PRODUCTS ASIA
“The FY 2007 result for our Asian business represents an improvement over FY 2006. While our existing, well-established businesses in Malaysia, Thailand and Indonesia delivered positive results, our newer operations in China and Vietnam faced start-up and market challenges. Indonesia had another strong year, operating at capacity, whilst the turnaround in Malaysia continued to gain real momentum. The political coup has stalled the expected improvement in our Thailand business whilst we made a small first year profit in our Vietnam metal coating facility despite the intense competition. Our biggest disappointment was the China EBIT result where market pressures have prevented recovery of the higher zinc and CRC feed costs. Operationally, the new plant at Suzhou is performing to expectations. One very pleasing outcome in Asia was the vastly improved operational performance over last year. “In May, we announced the recommencement of the US$101 million expansion of our Cilegon operations in Indonesia to complete the construction of a second metallic coating line. The new line, which is expected to be operational by end CY2009, will be dedicated to producing BlueScope Steel's thin gauge (0.2 - 0.4 mm) coil, used primarily in residential construction products.
COATED AND BUILDING PRODUCTS AUSTRALIA
“Record annual coated and paint line production, higher despatches and sales pricing all contributed to a stronger financial result over FY 2006. However, margins were reduced by high coating metal costs and, unfortunately in the second half, a much stronger Australian dollar contributed to higher imports leading to an unfavourable product destination mix change in favour of exports. On the growth front, our Western Sydney COLORBOND® facility commenced operations in August 2007 and BlueScope Water continues to experience strong growth with an expanding order book for our commercial and urban water products.

ASX Full Year Results Announcement Page: 10 Dated: 20 August 2007
COATED AND BUILDING PRODUCTS NORTH AMERICA
“A vastly improved financial performance on FY 2006 was largely due to better margins and lower costs associated with improved operations, better product mix, and a stronger market for pre-engineered buildings (PEBs).
DISCONTINUING BUSINESS
“As part of our ongoing processes, we actively and regularly review our business portfolio. During FY 2007, we ceased our loss-making tinplate production, sold the Vistawall business and closed our Taiwan operations. In April, the tinmill operation ceased; customers were transitioned to alternate suppliers, and closure costs were lower than expected. At June end, we realised the value of the Vistawall business, which we acquired through our purchase of Butler Manufacturing in 2004, through its sale to Oldcastle Glass for US$190 million. The sale represents a strong financial return for shareholders and the excellent improvement reflects work by BlueScope Steel and Vistawall’s management and employees. We continued the withdrawal from our Lysaght Taiwan business but regrettably, costs were higher than expected.
Safety
“FY 2007 stands as the safest year ever for people at BlueScope Steel sites. Records were achieved at most of our 91 operating sites. Our LTIFR for the year is a world best standard at 0.4 compared to the International Iron and Steel Institute (IISI) industry average of around 4.0. This is an outstanding achievement and I congratulate the work by every one of our employees and contractors, for their dedication to the principle of Zero Harm.
Environment
“We continue to improve our environmental compliance systems across all of our operations and are seeing some “best ever” results. We have joined the Greenhouse Challenge Plus Programme and implemented energy savings programs at a number of our operations. On the water front, we announced two major water saving initiatives during FY 2007, including a major water recycling program between BlueScope Steel and Sydney Water to halve the use of fresh water at Port Kembla, equivalent to the annual water use of 26,000 households. Today, 98% of the water used in the Port Kembla operation is recycled or salt water.
“In May, we announced a $21 million landmark project with South East Water and the Victorian government that will cut freshwater use at our Western Port plant by over 60 per cent to 660 mega litres annually - equivalent to water consumption of about 3,000 homes. This project will provide significant benefits for the environment and the community.
“The Company commenced feasibility work on a proposed co-generation electricity plant to reduce greenhouse gas emissions in NSW by recycling waste gases from steelmaking in the Ilawarra for use in electricity production. The feasibility study is expected to be completed during FY 2008.
People
“Two weeks ago, the Company announced that Paul O’Malley will be the next Managing Director and CEO of BlueScope Steel. When I depart, Paul will be a great successor. I am particularly pleased the Board has chosen a new CEO from within the ranks of our very strong ELT. I will be working with Paul and others to ensure an orderly handover.
“After a long and successful career spanning 30 years with BHP and BlueScope Steel, Lance Hockridge, President BlueScope Steel North America, has resigned from the Company to return to Australia with his family to take up the role of CEO at Queensland Rail towards the end of the year. Lance has made an outstanding contribution to BlueScope Steel and was a member of the Executive Leadership Team that led BlueScope Steel’s successful demerger and creation of the new, publicly listed company. Lance’s leadership and wisdom will be greatly missed.
“At the year end, we announced the appointment of Bill Jacob as President North Star BlueScope Steel, our 50 per cent joint venture based in Delta, Ohio. For the last 4 years, Mr Jacob has been President New Zealand Steel and Pacific Islands. Mr Ross Murray, who was President Iron and Slab at the Port Kembla Steelworks, succeeded Mr Jacob. Mark Vassella, formerly Chief Executive of Smorgon Steel Distribution,

ASX Full Year Results Announcement Page: 11 Dated: 20 August 2007
joined BlueScope Steel on 3 August 2007 as President BlueScope Steel Distribution and is a member of our Executive Leadership Team.
Outlook
“This year, the global steel market was very strong with the forecast for global steel demand remaining positive. China, the USA and Europe are driving this healthy outlook. Asia now produces more than half of all the crude steel produced in the world, and China is the largest single market for steel and has the strongest demand growth of any country. While the Chinese government has been working to close and eliminate inefficient mills and reduce exports through its recent export tax, these initiatives have not significantly slowed production growth nor reduced the global effect of exports.
“In Australia, we have started FY 2008 with a stronger Australian dollar, a stable global steel price environment and high metal coating costs. The North American commercial industrial construction market remains strong for our Butler business which has no residential exposure, but the spread between HRC prices and scrap cost has narrowed for our North Star BlueScope business. Asian markets and opportunities are slightly improved, and the operational ramp-up of new sites is growing revenue while coated product margins continue to be under pressure, particularly in China. We will continue to aggressively manage those factors over which we have control, including focusing on safety and environment, containing costs, improving our processes, achieving volume and production efficiencies, and optimising mix and margins. Clearly, our global footprint and the diversity of our product lines will be of benefit going forward.
“We would like to thank our shareholders and customers for their continuing support. I would like to personally thank our employees for the commitment and dedication they have demonstrated to making BlueScope Steel an outstanding Company – of which we are all very proud.
“I thank you for the opportunity to lead, build, and transform the iconic BlueScope Steel. I believe I will leave the business safer, richer, larger, more diverse, more caring, and strongly positioned for its next phase of growth.“

ASX Full Year Results Announcement Page: 12 Dated: 20 August 2007
BUSINESS UNIT REVIEWS Table 6a: Sales Revenue FY 2007 and FY 2006; 2H 2007 and 2H 2006; $ millions
Segment FY 2007 FY 2006 2H 2007 2H 2006 Hot Rolled Products Australia 3,919 3,472 1,919 1,656
Coated and Building Products Australia 3,186 2,767 1,649 1,475
Inter-segment(1) (1,730) (1,499) (857) (665)
Sub-total Australia 5,375 4,740 2,711 2,466
New Zealand and Pacific Steel Products 728 709 365 350
Coated and Building Products Asia 1,387 1,048 711 584
Hot Rolled Products North America(2) 566 500 278 312
Coated and Building Products North America 788 834 342 406
Inter-segment(1) (7) (1) (4) (1)
Sub-total North America 1,347 1,333 616 717
Corporate and Group(3) 465 420 236 232
Inter-segment(1) (945) (723) (533) (501)
Continuing Businesses 8,357 7,527 4,106 3,848
Discontinued Businesses(4) 747 707 365 368
Inter-segment(1) (244) (221) (119) (85)
Total BLUESCOPE STEEL 8,860 8,013 4,352 4,131 Table 6b: EBIT FY 2007 and FY 2006; 2H 2007 and 2H 2006; $ millions
Segment FY 2007 FY 2006 2H 2007 2H 2006 Hot Rolled Products Australia 759 456 320 46
Coated and Building Products Australia 41 (3) (8) 8
Inter-segment(1) (25) 57 9 77
Sub-total Australia 775 510 321 131
New Zealand and Pacific Steel Products 90 105 48 39
Coated and Building Products Asia 42 19 11 17
Hot Rolled Products North America(2) 180 188 69 121
Coated and Building Products North America 37 9 14 14
Inter-segment(1) 0 0 0 0
Sub-total North America 217 197 83 135
Corporate and Group(3) (42) (78) (28) (35)
Inter-segment(1) 1 (10) (4) (26)
Continuing Businesses 1,083 743 431 261
Discontinued Businesses(4) 16 (197) 28 (178)
Inter-segment(1) 0 10 5 24
Total BLUESCOPE STEEL 1,099 556 464 107
(1) Inter-segment revenue reflects the elimination of internal sales between reporting segments. Inter-segment EBIT reflects an entry to eliminate profit-in-stock associated with inter-segment sales.
(2) Excludes the company’s 50% share of North Star BlueScope Steel’s sales revenue of A$722M in FY 2007 (A$712M in FY 2006) and A$349M in 2H FY 2007 (A$388M in 2H FY 2006)
(3) Corporate and Group reflects logistics and corporate office activities. The increase in FY 2007 EBIT primarily reflects dividends from the 19.9% interest in Smorgon Steel and FX gains on net foreign currency denominated debt, including inter-company debt.
(4) Reflects the discontinued Packaging Products, Lysaght Taiwan and Vistawall businesses combined with the gain from the sale of the Vistawall business. Refer Attachment 2 for the revenue and earnings arising from these businesses.

ASX Full Year Results Announcement Page: 13 Dated: 20 August 2007
BLUESCOPE STEEL AUSTRALIA Hot Rolled Products Australia This segment comprises:
Port Kembla Steelworks, NSW, Australia (coke, iron, slab, hot rolled coil and plate production);
(i) Financial Performance
Table 7a: Financial Performance FY 2007 and FY 2006; $ millions Variance Financial Measure FY 2007 FY 2006 $ % Sales revenue(1) 3,919 3,472 447 13 EBITDA 899 589 310 53 EBIT 759 456 303 66 Underlying operational EBIT(2) 727 465 262 56 Capital and investment expenditure(3) 136 202 (66) (33) Net operating assets (pre tax)(4) 1,782 1,837 (55) (3) Return on net assets (pre tax)(5) 41% 24% Table 7b: Financial Performance 2H FY 2007 vs. 2H FY 2006 and 1H FY 2007; $ millions Financial Measure 2H FY 2007 2H FY 2006 Variance 1H FY2007
Sales revenue 1,919 1,656 263 2,000 EBITDA 390 114 276 509 EBIT 321 46 275 438 Underlying operational EBIT(2) 313 64 249 414 Capital and investment expenditure(3) 79 128 (49) 57 Net operating assets (pre tax)(4) 1,782 1,837 (55) 1,829 Return on net assets (pre tax)(5) 35% 5% 46% (1) FY 2007 includes coke sales of 247,518 tonnes (FY 2006 33,690 tonnes). (2) FY 2007 EBIT has been mainly adjusted for domestic transfer pricing margins earned from the tinplate operations which have been
closed. FY 2006 EBIT has been adjusted for redundancy costs for staff, executives and other internal restructuring partly offset by domestic transfer pricing margins earned from the tinplate operations which have been closed.
(3) Reduced capital expenditure reflects the completion of the Hot Strip Mill upgrade project by 30 June 2006. (4) Reduced net operating assets primarily reflects a reduction in inventories and an increase in creditors. (5) Return on net assets is defined as EBIT (annualised in the case of half year comparison)/average monthly net operating assets.
(ii) Variance Analysis (FY 2007 vs. FY 2006)
The $447M increase in sales revenue is primarily due to higher international slab and hot rolled coil prices, higher domestic plate and hot rolled coil prices, higher mix of domestic sales and inter-segment sales to Coated and Building Products Australia mainly due to the Western Port fire in the previous comparative period. The export product mix was improved with increased hot rolled coil sales, due to the increased capacity from the hot strip mill expansion and consequently lower slab sales. These were partly offset by a strengthening AUD:USD exchange rate compared to the previous comparative period.

ASX Full Year Results Announcement Page: 14 Dated: 20 August 2007
The $303M EBIT increase was largely due to:
Higher slab and hot rolled coil prices attained in international markets. Higher plate and hot rolled coil prices attained in domestic markets and higher prices to Coated and
Building Products Australia. Favourable domestic/export mix primarily due to higher domestic demand in the pipe and tube
market and improved inter-segment sales to Coated and Building Products Australia (FY 2006 sales adversely affected by Western Port fire, i.e. required to export an additional 300,000t of slab on the spot export market). Furthermore, a favourable export product mix resulted from the hot strip mill expansion.
Reduction in redundancy costs for staff, executives and other internal restructuring compared to FY 2006.
These were partly offset by: The benefit of consuming lower-priced iron from inventories at the start of FY 2006. Higher scrap costs and higher USD iron ore and coking coal purchase prices. Higher freight and discretionary repairs and maintenance costs to support record production rates.
(iii) Operations Report – another outstanding operations performance at the Port Kembla
Steelworks
Iron & Slab
Record annual ironmaking production of 5.23 million tonnes (Mt) (vs. previous record of 5.21Mt in FY 2006), due to good blast furnace availability (low unplanned interruptions) and improved operating stability despite the age of blast furnace No. 5 (BF5).
Record annual slab production of 5.30Mt (vs. previous record of 5.28Mt in FY 2006). This was achieved due to record hot metal (iron) production and improvements in process yields.
As at 30 June 2007 BF5 achieved a campaign to date production of 38.88Mt (5,865 days). Previous campaign was 25.19Mt (4,452 days).
BF5 reline planning and preparation is continuing in line with the planned timing for the reline of March 2009. BF5, which currently produces about 2.5 Mtpa of hot metal, was built in 1972 and the last reline took place in 1991. The expected cost of the reline scope of work remains around A$330M.
Company announced $134m sinter (an agglomeration of iron ore, coke and limestone fines) plant upgrade, which will principally include the installation of a new feeder and ignition furnace and lengthening and deepening of the strand, (the strand is the travelling grate (continuous conveyor) that carries the prepared material through the sintering process).
The project will be completed during a 35 day shut down, timed to coincide with the BF5 reline in March 2009. This project will increase the competitiveness of the Port Kembla steelworks through reducing the use of more expensive iron ore pellets and using less expensive iron ore fines to produce additional sinter.
Principal raw material usage in FY 2007: iron ore – 7,676kt coal • coking coal – 2,752kt • coal used in the Pulverised Coal Injection – 664kt
scrap – 1,000kt
Hot Strip Mill (HSM)
Record hot rolled coil production of 2.818Mt (vs. previous best of 2.556Mt for FY 2005). Increased HSM production was made possible by the successful commissioning of the $100M
HSM second reheat furnace with the first slab heated and rolled in July 2006. The ramp-up to the planned increased throughput rate (equivalent to 400,000tpa) was achieved by December 2006.
A 15 day scheduled maintenance program is planned for September 2007.

ASX Full Year Results Announcement Page: 15 Dated: 20 August 2007
Plate Mill
Record plate mill production of 0.414Mt (vs. previous best of 0.374Mt for FY 2005). Improved performance was due to high plant availability (low unscheduled stops).
Rail Operations
The company outsourced the rail operations within the Port Kembla steelworks to leading freight
rail operator Asciano/Pacific National commencing from September 2007. Asciano will provide significant equipment and process improvements. They are contracted to 2014.
Cogeneration Plant
The company is undertaking a feasibility study into the construction of a cogeneration plant. The
study will take approximately 15 months. The capital cost is likely to be in the range of $700 – 1,000M.
Coated and Building Products Australia (excludes tinplate manufacture in all periods) This segment comprises:
Illawarra Coated Products at Port Kembla, NSW (comprising Springhill Coated Products, noting the tin mill ceased operating from April 2007 and has been transferred to discontinued operations);
Western Port at Hastings, Victoria; Service Centres, with 7 sites across Australia; BlueScope Lysaght, with 41 manufacturing sites throughout Australia; BlueScope Water; and Western Sydney COLORBOND® Steel Centre.
(i) Financial Performance Table 8a: Financial Performance FY 2007 and FY 2006; $ millions Variance Financial Measure FY 2007 FY 2006 $ %
Sales revenue 3,186 2,767 419 15 EBITDA 118 72 46 64 EBIT 41 (3) 44 1,467 Underlying operational EBIT(1) 33 41 (8) (20) Capital and investment expenditure(2) 134 213 (79) (37) Net operating assets (pre tax)(3) 1,486 1,381 105 8 Return on net assets (pre tax)(4) 3% (0%)

ASX Full Year Results Announcement Page: 16 Dated: 20 August 2007
Table 8b: Financial Performance 2H FY 2007 vs. 2H FY 2006 and 1H FY 2007; $ millions Financial Measure 2H FY 2007 2H FY 2006 Variance 1H FY2007
Sales revenue 1,650 1,475 175 1,536 EBITDA 31 44 (13) 87 EBIT (8) 8 (16) 49 Underlying operational EBIT(1) (5) 14 (19) 38 Capital and investment expenditure(2) 75 134 (59) 59 Net operating assets (pre tax)(3) 1,486 1,381 105 1,416 Return on net assets (pre tax)(4) (1%) 1% 7%
(1) FY 2007 EBIT has been adjusted for pre-operating costs on the Western Sydney paint line, stranded costs in Packaging Products and profit on the sale of property in New South Wales. FY 2006 EBIT has been adjusted for stranded costs in Packaging Products, the Western Port fire, Chullora solid block paint line asset impairment and closure costs and redundancy costs for staff, executives and other internal restructuring partly offset by profit on the sale of property in Western Australia.
(2) Capital and investment expenditure decrease is due to higher capital maintenance and West Sydney COLORBOND® development project costs during FY 2006.
(3) Increase in net operating assets reflects an increase in net fixed assets. (4) Return on net assets is defined as EBIT (annualised in case of half year comparison)/average monthly net operating assets. (ii) Variance Analysis (FY 2007 vs FY 2006) The $419M increase in sales revenue is primarily due to higher domestic demand and prices in the building and distribution markets, higher export volumes due to the effect on production volumes of the fire at Western Port during 1H FY 2006 combined with higher export prices driven by higher global slab and hot rolled coil prices. The $44M EBIT increase was largely due to:
Higher domestic and export sales prices. Increased despatches in 1H FY 2007 particularly in the building sector due to increased commercial
and industrial activity and recovery of market share lost in the distribution sector during FY 2006. However, domestic despatches were slightly lower in 2H FY 2007 compared to 2H FY 2006 driven by an increase in import competition largely due to the stronger AUD and a softer residential market in the eastern states of Australia.
FY 2006 volumes and costs being negatively impacted by the Western Port fire. Impairment of Chullora solid block paint line during FY 2006.
These were partly offset by:
Significantly higher coating metal costs, in particular zinc. Higher steel feed costs. An adverse mix change with a higher proportion of lower margin export sales. Stronger AUD:USD exchange rate compared to the previous comparative period. Pre-operating costs associated with the new Western Sydney COLORBOND® Steel Centre. Profit on sale of land in Myaree, Western Australia in FY 2006, partly offset by profit on sale of land
in Erskine Park, New South Wales, in FY 2007. Higher research and development costs. Higher costs in the Lysaght Australian businesses due to a number of sites relocating, in particular
within the Sydney Basin, combined with lower demand, predominantly across the Eastern seaboard, increasing conversion costs.
ASX Full Year Results Announcement Page: 17 Dated: 20 August 2007
(iii) Operations Report
Springhill Coated Products
Achieved a cold rolled full hard annual production record of 963kt up by 2% (vs. previous record of 942kt in FY 2006), largely due to an improvement in line uptime (better maintenance strategies).
Achieved a metal coating annual production record of 822kt up by 8% (vs. previous record of 761kt in FY 2005), largely due to a focus on manufacturing excellence initiatives and a furnace upgrade on Metal Coating Line 1.
For the first time the paint line recorded over 200kt of production, 202kt up by 11% (vs. previous record of 182kt in FY 2005), largely due to increased line speed.
Recorded the best ever full year quality performance on the metal coating and paint lines with less than 2.4% and 0.99% Non-Prime First Time respectively (previous best on the metal coating line was 4.4% in FY 2005 and on the paint line 1.4% in FY 2006).
On 19th April 2007 the No.2 Temper Mill and No.3 Electrolytic Tinning line ceased operations, signalling the closure of the tinplating business.
The Packaging pickle line and cold rolling mill will continue to operate as part of Springhill operations and a study continues into the viability of utilising this cold rolling mill to produce cold rolled coil feed for BlueScope’s metal coating lines and external customers.
Western Port
Collectively the three metal coating lines achieved their second best year on record with 775kt (vs. 778kt in FY 2000).
Metal coating line No. 6 achieved a full year production record of 355kt in FY 2007 (vs. the previous best of 336kt in FY 2000).
In May, the company welcomed the Victorian Government’s Budget announcement that it would provide $4.1M towards a major water-recycling project. This project, in conjunction with South East Water, will see the Western Port plant cut its fresh water use by over 60 per cent or 660 mega-litres per annum – equivalent to the annual water consumption of approximately 3,000 homes. The total project cost is $21.5M, with BlueScope Steel contributing $8M and the balance of $9.4M being funded by South East Water.
Service Centres
The Western Sydney COLORBOND® facility commenced commissioning with production beginning in August 2007.
A number of production records were set in painting, slitting and despatches at Acacia Ridge, largely due to strong demand in Queensland and good operational performance.
The new Western Australian facility in Forrestfield has continued improving its operational and service performance and the site is now achieving high service levels and meeting market requirements.
BlueScope Lysaght
Market conditions continued to be difficult in the residential building market particularly in NSW and Victoria, whilst buoyant in Queensland and Western Australia. Drought conditions and water restrictions also had a softening effect on building activity.
Lysaght acquired Kiteley’s Roofing World (NSW South Coast) in November 2006 and Highline Limited (Perth) in June 2007. Both businesses are part of the Building Solutions activities of Lysaght.
Lysaght Building Solutions through its Lysaght Design & Construction activity completed work with various business partners in industrial buildings.
New products are also being introduced such as Facades™ and Quikform®. BlueScope Water
BlueScope Water is currently expanding capacity in Queensland and Victoria to support the strong growth in demand for rainwater harvesting solutions and water storage. New factories are expected to open in Brisbane and Melbourne before the end of CY 2007.
Pioneer Water Tanks is expanding production capacity to meet strong growth in demand in Australian rural, commercial and in export markets for water storage solutions. The new production facility is expected to be commissioned late CY 2007.
BlueScope Water had a breakeven result in only the third year of operation.

ASX Full Year Results Announcement Page: 18 Dated: 20 August 2007
BLUESCOPE STEEL NEW ZEALAND New Zealand and Pacific Steel Products This segment comprises:
New Zealand Steel; and Lysaght Pacific.
(i) Financial Performance
Table 9a: Financial Performance FY 2007 and FY 2006; $ millions Variance Financial Measure FY 2007 FY 2006 $ %
Sales revenue 728 709 19 3 EBITDA 119 132 (13) (10) EBIT 90 105 (15) (14) Underlying operational EBIT(1) 90 107 (17) (16) Capital and investment expenditure(2) 40 55 (15) (27) Net operating assets (pre tax)(3) 431 342 89 26 Return on net assets (pre tax)(4) 24% 32%
Table 9b: Financial Performance 2H FY 2007 vs. 2H FY 2006 and 1H FY 2007; $ millions Financial Measure 2H FY 2007 2H FY 2006 Variance 1H FY 2007 Sales revenue 364 350 14 364 EBITDA 63 52 11 56 EBIT 47 39 8 43 Underlying operational EBIT(1) 47 41 6 43 Capital and investment expenditure(2) 19 46 (27) 21 Net operating assets (pre tax)(3) 431 342 89 370 Return on net assets (pre tax)(4) 26% 23% 24%
(1) FY 2006 EBIT has been adjusted for internal restructuring/redundancy costs. (2) Additional maintenance and process improvement capital initiatives completed during FY 2006. (3) Increase in net operating assets mainly reflects lower provision for defined benefit superannuation. (4) Return on net assets is defined as EBIT (annualised in the case of half year comparison) / average monthly net operating assets.
(ii) Variance Analysis (FY 2007 vs. FY 2006) The $19M increase in sales revenue is primarily due to improved New Zealand market conditions (commercial building, residential & plate) driving a 9% increase in domestic sales volumes. This was offset by a corresponding decrease in export tonnes (due to capacity constraints). Both domestic and export prices were higher than the previous period. The $15M EBIT decrease was largely due to:
Unfavourable movement in the NZD:USD exchange rate relative to FY 2006. Higher coating metal costs, mainly zinc and aluminium. Reduced contributions from vanadium due to softening world prices. Higher imported steel feed costs.
ASX Full Year Results Announcement Page: 19 Dated: 20 August 2007
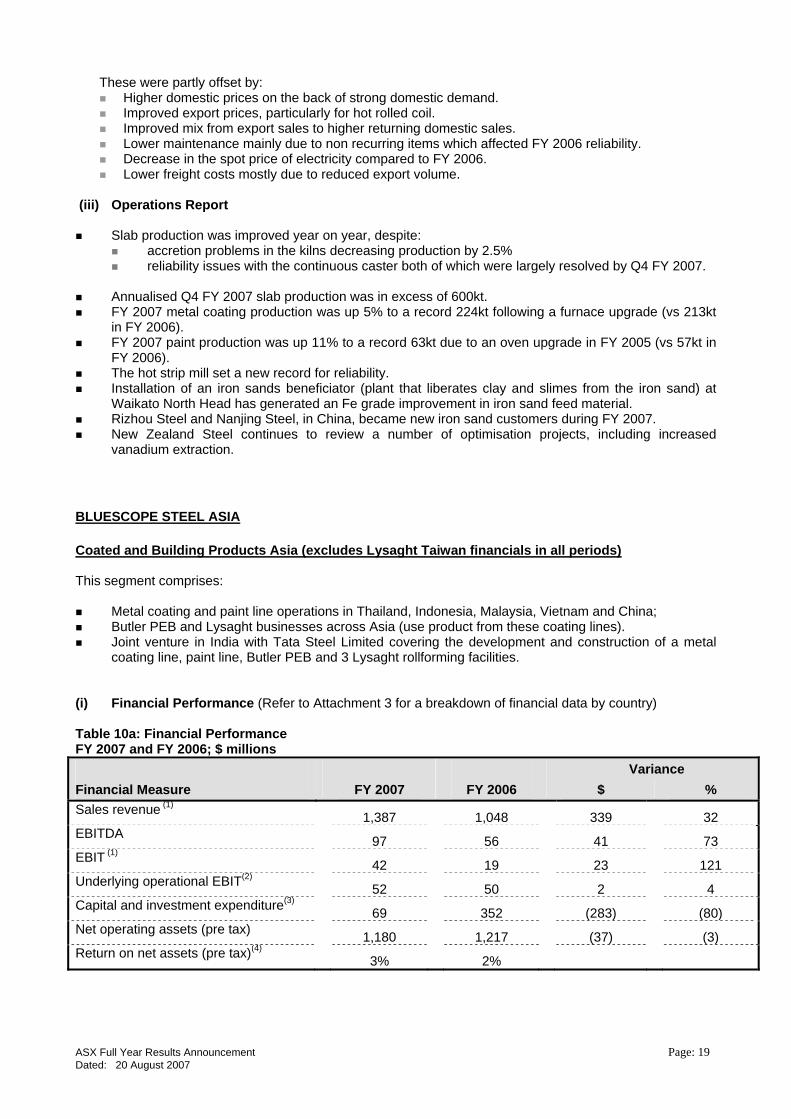
These were partly offset by: Higher domestic prices on the back of strong domestic demand. Improved export prices, particularly for hot rolled coil. Improved mix from export sales to higher returning domestic sales. Lower maintenance mainly due to non recurring items which affected FY 2006 reliability. Decrease in the spot price of electricity compared to FY 2006. Lower freight costs mostly due to reduced export volume.
(iii) Operations Report
Slab production was improved year on year, despite: accretion problems in the kilns decreasing production by 2.5% reliability issues with the continuous caster both of which were largely resolved by Q4 FY 2007.
Annualised Q4 FY 2007 slab production was in excess of 600kt. FY 2007 metal coating production was up 5% to a record 224kt following a furnace upgrade (vs 213kt
in FY 2006). FY 2007 paint production was up 11% to a record 63kt due to an oven upgrade in FY 2005 (vs 57kt in
FY 2006). The hot strip mill set a new record for reliability. Installation of an iron sands beneficiator (plant that liberates clay and slimes from the iron sand) at
Waikato North Head has generated an Fe grade improvement in iron sand feed material. Rizhou Steel and Nanjing Steel, in China, became new iron sand customers during FY 2007. New Zealand Steel continues to review a number of optimisation projects, including increased
vanadium extraction. BLUESCOPE STEEL ASIA Coated and Building Products Asia (excludes Lysaght Taiwan financials in all periods) This segment comprises:
Metal coating and paint line operations in Thailand, Indonesia, Malaysia, Vietnam and China; Butler PEB and Lysaght businesses across Asia (use product from these coating lines). Joint venture in India with Tata Steel Limited covering the development and construction of a metal
coating line, paint line, Butler PEB and 3 Lysaght rollforming facilities. (i) Financial Performance (Refer to Attachment 3 for a breakdown of financial data by country) Table 10a: Financial Performance FY 2007 and FY 2006; $ millions Variance Financial Measure FY 2007 FY 2006 $ % Sales revenue (1) 1,387 1,048 339 32 EBITDA 97 56 41 73 EBIT (1) 42 19 23 121 Underlying operational EBIT(2) 52 50 2 4 Capital and investment expenditure(3) 69 352 (283) (80) Net operating assets (pre tax) 1,180 1,217 (37) (3) Return on net assets (pre tax)(4) 3% 2%
ASX Full Year Results Announcement Page: 20 Dated: 20 August 2007
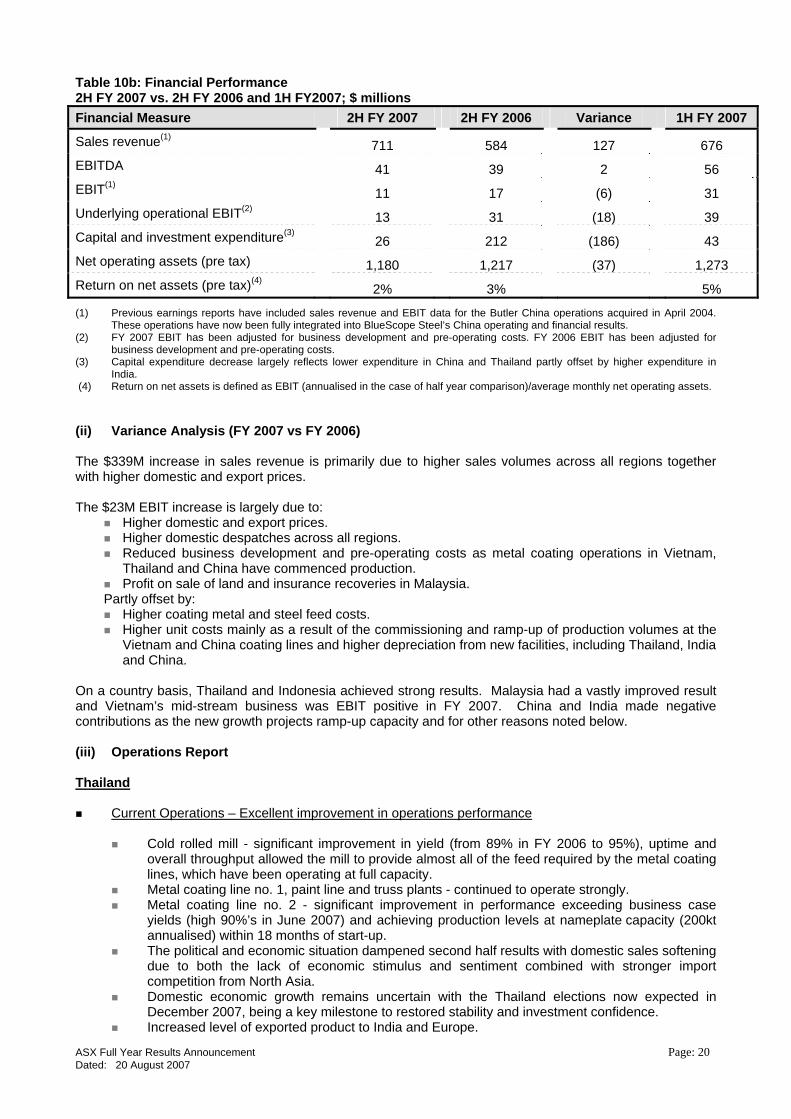
Table 10b: Financial Performance 2H FY 2007 vs. 2H FY 2006 and 1H FY2007; $ millions Financial Measure 2H FY 2007 2H FY 2006 Variance 1H FY 2007
Sales revenue(1) 711 584 127 676 EBITDA 41 39 2 56 EBIT(1) 11 17 (6) 31 Underlying operational EBIT(2) 13 31 (18) 39 Capital and investment expenditure(3) 26 212 (186) 43 Net operating assets (pre tax) 1,180 1,217 (37) 1,273 Return on net assets (pre tax)(4) 2% 3% 5%
(1) Previous earnings reports have included sales revenue and EBIT data for the Butler China operations acquired in April 2004. These operations have now been fully integrated into BlueScope Steel’s China operating and financial results.
(2) FY 2007 EBIT has been adjusted for business development and pre-operating costs. FY 2006 EBIT has been adjusted for business development and pre-operating costs.
(3) Capital expenditure decrease largely reflects lower expenditure in China and Thailand partly offset by higher expenditure in India.
(4) Return on net assets is defined as EBIT (annualised in the case of half year comparison)/average monthly net operating assets. (ii) Variance Analysis (FY 2007 vs FY 2006) The $339M increase in sales revenue is primarily due to higher sales volumes across all regions together with higher domestic and export prices. The $23M EBIT increase is largely due to:
Higher domestic and export prices. Higher domestic despatches across all regions. Reduced business development and pre-operating costs as metal coating operations in Vietnam,
Thailand and China have commenced production. Profit on sale of land and insurance recoveries in Malaysia.
Partly offset by: Higher coating metal and steel feed costs. Higher unit costs mainly as a result of the commissioning and ramp-up of production volumes at the
Vietnam and China coating lines and higher depreciation from new facilities, including Thailand, India and China.
On a country basis, Thailand and Indonesia achieved strong results. Malaysia had a vastly improved result and Vietnam’s mid-stream business was EBIT positive in FY 2007. China and India made negative contributions as the new growth projects ramp-up capacity and for other reasons noted below.
(iii) Operations Report Thailand
Current Operations – Excellent improvement in operations performance
Cold rolled mill - significant improvement in yield (from 89% in FY 2006 to 95%), uptime and overall throughput allowed the mill to provide almost all of the feed required by the metal coating lines, which have been operating at full capacity.
Metal coating line no. 1, paint line and truss plants - continued to operate strongly. Metal coating line no. 2 - significant improvement in performance exceeding business case
yields (high 90%’s in June 2007) and achieving production levels at nameplate capacity (200kt annualised) within 18 months of start-up.
The political and economic situation dampened second half results with domestic sales softening due to both the lack of economic stimulus and sentiment combined with stronger import competition from North Asia.
Domestic economic growth remains uncertain with the Thailand elections now expected in December 2007, being a key milestone to restored stability and investment confidence.
Increased level of exported product to India and Europe.

ASX Full Year Results Announcement Page: 21 Dated: 20 August 2007
Launched a number of new products to improve market penetration. The downstream (Lysaght and building solutions) business grew sales volumes in every
segment during FY 2007, a great result given the weak domestic market.
Capital growth project status
Commissioned the pre-engineered building manufacturing facility. Commissioned the pickle line tension leveller which will be used to help reduce incoming feed
costs as well as assist in increased capacity on the cold rolled mill.
Vietnam
Current Operations – Vast improvement in operations performance in the second half.
Manufacturing performance and yields have exceeded targets across both the metal coating and paint lines in the second half. First half performance was affected by equipment related operational issues.
Vietnam continued to experience intense domestic competition as local producers attempted to maintain and/or grow share position, which is expected to continue into FY 2008. This, coupled with low price imports affected volume ramp up. Despite these market pressures, the coated business achieved an EBIT positive result in its first full operating year on the back of price maintenance, internal cost management and various business efficiency improvement projects.
PEB business had some teething problems, including the availability of the right skills mix. This is being addressed.
Marketing - extensive activities focussed on new product innovation, with six new products launched, brand positioning and aggressive channel expansion.
Indonesia
Current Operations – Very strong operational performance
The current metal coating and paint lines are operating at full capacity with additional coated steel products being imported from other BlueScope Steel sites in order to satisfy increased market demand.
Continued strong market demand with the infrastructure and construction segment still the biggest contributor. The residential segment is also experiencing strong growth, in particular metal tiles and trusses.
Initiatives have been taken in order to improve performance, including: Increased plant up time, e.g. metal coating line increased from 83% in FY 2006 to 90% in
FY2007 Geographic expansion
The downstream business (Lysaght and building solutions) finished the year strongly with their highest monthly despatches in May and June.
The strong increase in cash generated during FY 2007 was largely due to significant working capital improvement initiatives.
Capital growth project status
Second metal coating line with in line painting at Cilegon (US$113M), (including US$12m spent to
April 2006). Project approved to re-commence in May 2007. Project expected to be completed towards end of calendar year 2009 with total additional metal
coated capacity of 165,000t (focus on thin gauge). Current metal coating capacity is 100,000t.
Malaysia
Current Operations - the business turnaround continued.
Achieved metal coated and painted domestic sales despatches of 102,000 tonnes (vs 82,000 tonnesFY 2007), which was a record. The downstream business also had record domestic despatches.
Downstream businesses were all profitable with improved earnings largely due to greater penetration of selling solutions including pre-engineered buildings.

ASX Full Year Results Announcement Page: 22 Dated: 20 August 2007
Yield performance improvements were achieved on the metal coating line, ie. 89% in FY 2006 to 94% in FY 2007, whilst the paint line yield was maintained at 98.4%.
In late July BlueScope Steel signed a supply agreement with Mycron Steel Bhd, based in Malaysia, to supply cold rolled coil feed for its coated lines. Under the arrangement Mycron will also purchase hot rolled coil from BlueScope’s Port Kembla Steelworks.
Launched six new products during the year, including TrueCore, Improved Zincalume and Elements. A material improvement in working capital due to a range of initiatives, including tighter management
of receivables and reduction in semi finished and finished goods inventory. Value creation program (business improvement program to capture and implement revenue and cost
improvements) delivered MYR10 million (A$3.6M) in improvements in FY 2007. Re-established a presence in South Africa, after successfully defending a dumping action, with
12,000 tonnes despatched in FY 2007. Steady GDP growth in Malaysia of approximately 6% per annum, inflation of approximately 3%,
recovery in Foreign Direct Investment and infrastructure growth spending with 9th Malaysian Plan all bode well for continued improvements in business performance.
China
Current Operations
Coated Suzhou – a solid operational performance in the first year of operations
Metal coating line was commissioned in September 2006. Metal coating yields continue to improve in line with ramp up schedule. The inline painting facility has not been commissioned as additional equipment is required to make
two coat paint systems (a new regulatory requirement). Installation of the new equipment was completed in July 2007.
Margin lower than expected due to high level of competition, increased metal costs and lower sales prices.
Buildings
Strong steel pre-engineered building (PEB) sales order intake in FY2007 of $370M vs $322M in FY 2006 driven by increased activity in the Northern and Southern regions, partly offset by lower sales in other segments, in particular, in the Central and Southern region.
New facilities at Guangzhou and Langfang became fully operational during the year and will provide improved conversion performance for FY 2008.
Margin erosion in 2H FY 2007 resulted from increased steel feed prices and higher mix of low margin projects.
Reduction of VAT rebate on exports had a negative impact on Q4 FY 2007 results. India (Activities in India fall under the (50:50) joint venture arrangement between Tata Steel and BlueScope Steel).
Current Operations
All projects were completed ahead of schedule:
Pune Lysaght/Butler PEB facility commenced operations August 2006; Chennai Lysaght sales and rollforming facility commenced operations January 2007; and Bhiwadi (New Delhi) Lysaght sales and rollforming facility commenced operations October 2006;
Capital growth project status
The metal coating line and paint line project (A$270M) (100%) (BSL’s 50% share A$135M), is being
built at Jamshedpur. Progress on the project is: Start-up date is currently expected to be mid CY 2009; Piling is in progress and preliminary engineering has been undertaken; and Contract negotiations have commenced with the preferred equipment supplier for the metal
coating line and paint line.

ASX Full Year Results Announcement Page: 23 Dated: 20 August 2007
BLUESCOPE STEEL NORTH AMERICA Hot Rolled Products North America
BlueScope Steel’s 50% interest in North Star BlueScope Steel, USA (hot rolled coil production). BlueScope Steel’s 47.5% interest in Castrip LLC, USA (thin strip casting technology), in joint venture
with Nucor and Ishikawajima-Harima Heavy Industries Limited. North American and European export trading activities.
(i) Financial Performance Table 11a: Financial Performance FY 2007 and FY 2006; $ millions Variance Financial Measure FY 2007 FY 2006 $ % Sales revenue(1) 566 500 66 13 EBITDA(2) 180 188 (8) (4) EBIT(2) 180 188 (8) (4) Underlying operational EBIT 180 188 (8) (4) Capital and investment expenditure 1 2 (1) (50) Net operating assets (pre tax) 233 258 (25) (10) Return on net assets (pre tax)(3) 67% 68% Table 11b: Financial Performance 2H FY2007 vs. 2H FY 2006 and 1H FY2007; $ millions Financial Measure 2H FY 2007 2H FY 2006 Variance 1H FY 2007
Sales revenue(1) 278 312 (34) 288 EBITDA(2) 68 121 (53) 112 EBIT(2) 68 121 (53) 112 Underlying operational EBIT 68 121 (53) 112 Capital and investment expenditure 1 1 0 0 Net operating assets (pre tax) 233 258 (25) 280 Return on net assets (pre tax)(3) 51% 88% 83%
(1) Excludes the company’s 50% share of North Star BlueScope Steel’s sales revenue being A$722M in FY 2007 (A$712M FY 2006) and A$349M in 2H FY 2007, (A$ 388M in 2H FY 2006).
(2) Includes 50% share of net profit from North Star BlueScope Steel of A$156M in FY 2007 (A$169M FY 2006) and A$55M in 2H FY 2007, (A$107M in 2H FY 2006).
(3) Return on net assets is defined as EBIT (annualised in the case of half year comparison) /average monthly net operating assets.
(ii) Variance Analysis (FY 2007 vs. FY 2006)
The $66M increase in sales revenue is primarily due to higher inter-segment export sales from Australia to North America due to additional volumes following recovery from the Western Port fire and improved sales mix from slab to hot rolled coil. The $8M EBIT decrease was largely due to:
Unfavourable movement in the AUD:USD relative to the previous comparative period. Higher conversion costs at North Star BlueScope Steel driven by higher cost of electricity and alloys.
Partly offset by:
Higher spread from North Star BlueScope Steel (in US$ terms) with hot rolled coil prices in North America improving more than increases in the price of scrap feed.
Higher export volumes increasing earnings from trading activities.

ASX Full Year Results Announcement Page: 24 Dated: 20 August 2007
(iii) Operations Report
North Star BlueScope Steel (BlueScope Steel has a 50% interest)
Raw steel production during FY 2007 was 956kt (50% share) (vs 961kt in FY 2006). Record despatches of 942kt (50% share) for FY 2007 (vs 941kt in FY 2006).
Excellent work on improving operational performance should result in some production capacity creep during FY 2008.
Voted No. 1 flat rolled steel supplier to the service centre segment in North America in the latest Jacobson Survey of steel customers for the fifth year in a row.
BlueScope Steel received US$65 million (A$80M) in dividends from North Star BlueScope Steel during the second half FY 2007 and US$115M (A$145M) for the full year FY 2007.
The new baghouse has been successfully installed and commissioned (mid CY 2007). The US$40M (BlueScope’s share 50%) project will significantly improve working conditions within the building.
Castrip LLC
Nucor continued to make progress with their Castrip™ facility located at Crawfordsville, IN.
Significant progress has been made in developing higher strength steels and improving product quality.
Typical applications are currently building products, decking and racking where Castrip’s™ light gauge capability gives Castrip™ an advantage over conventional hot rolled coil.
The construction of Nucor’s second Castrip™ plant in Blythesville, Arkansas has commenced. BlueScope continues to support Nucor with several technical experts working with Nucor in the
US as well as product and process development work at our Port Kembla Research Laboratories.
North American and European export trading
The Americas region remains a very important export market for BlueScope operations in
Australia and Asia. In 2H FY 2007, 522,472 tonnes were shipped (predominantly to the USA) with a product mix that included slab as well as finished products, whilst shipments were 1,103,446 tonnes for FY 2007.
Shipments to Europe totalled 295,465 tonnes for 2H FY 2007 and 432,754 tonnes for FY 2007, primarily hot rolled coil and coated steel exported from Australia.
Recent favourable trade legislation in the USA is opening up another export market to BlueScope for coated steel. The U.S. International Trade Commission voted in December 2006 to remove dumping duties on imports of corrosion resistant sheet from Australia that had been in place since 1993. This will also provide an opportunity to Butler Buildings to access BlueScope’s high quality coated products.

ASX Full Year Results Announcement Page: 25 Dated: 20 August 2007
Coated and Building Products North America (excludes Vistawall financials in all periods) This segment comprises:
Butler Buildings; and Developing businesses.
The segment previously included Vistawall architectural products. This business was sold to an affiliate of Oldcastle Glass ®, Inc, as US subsidiary of CRH plc on 29 June, 2007 for US$190M. (i) Financial Performance and Operating Report (excludes Vistawall financials in all periods) Table 12a: Financial Performance FY 2007 and FY 2006; $ millions Variance Financial Measure FY 2007 FY 2006 $ % Sales revenue 788 834 (46) (6) EBITDA 51 23 28 122 EBIT 37 9 28 311 Underlying operational EBIT(1) 37 13 24 185 Capital and investment expenditure 11 17 (6) (35) Net operating assets (pre tax) 63 67 (4) (6) Return on net assets (pre tax)(2) 50% 11% Table 12b: Financial Performance 2H FY 2007 vs. 2H FY 2006 and 1H FY 2007; $ millions Financial Measure 2H FY 2007 2H FY 2006 Variance 1H FY 2007
Sales revenue 342 406 (64) 446 EBITDA 20 21 (1) 31 EBIT 14 14 0 23 Underlying operational EBIT(1) 14 20 (6) 23 Capital and investment expenditure 3 10 (7) 8 Net operating assets (pre tax) 63 67 (4) 50 Return on net assets (pre tax)(2) 47% 38% 54%
(1) FY 2006 EBIT has been adjusted for business development costs, partly offset by profit on the sale of the Galesburg, Illinois facility. 2H FY 2006 EBIT has been adjusted for business development and restructuring costs.
(2) Return on net assets is defined as EBIT (annualised in the case of half year comparison)/average monthly net operating assets.
(ii) Variance Analysis (FY 2007 vs FY 2006)
The $46M decrease in sales revenue is primarily due to an unfavourable movement in the AUD:USD relative to the previous comparative period. The $28M EBIT improvement was largely due to:
Improved margins (improved plant efficiencies, increased output at lower cost Mexico facility combined with higher costs associated with the Jackson plant start-up problems in FY 2006).
Sales price increases exceeding raw material cost increases. Partly offsetting these were:
Unfavourable movement in the AUD:USD exchange rate.

ASX Full Year Results Announcement Page: 26 Dated: 20 August 2007
(iii) Operations Report Butler Buildings (100% Sales into non-residential market).
Total despatches for FY 2007 were up 1% to 196,135 tonnes (vs. 194,383 tonnes in FY 2006), noting industry despatches, as reported by the Metal Building Manufacturers Association (“MBMA”), were marginally down year on year.
However total despatches in the second half were down 7% on the previous corresponding period. Second half FY 2006 despatches were the highest since 2000, due largely to resolving the start-up issues at the specialty parts plant in Jackson, Tennessee in 1H FY 2006 and milder winter weather in the Northern regions. MBMA despatches decreased 3% over the same period last year.
Second half FY 2007 despatches were down 14% on first half typical of the industry’s seasonality (MBMA down 19%).
Strong order bookings resulted in a 25% higher year end backlog than for FY 2006. Completing the final stages of US military contract in the Middle East in conjunction with the
company’s 30% owned affiliate, Saudi Building Systems. Continued to expand steel supply from the North Star BlueScope JV in Delta, Ohio and other
BlueScope operations. Completed the feasibility study for the new engineering detailing system and continued to
increase offshore engineering capability leveraging BlueScope’s world wide reach. Consolidated roll forming operations in the Southeast region at Jackson, Tennessee and
introduced a new standing seam roof panel at Liberty Building Systems. Completed framing line expansions at the low cost operations in North Carolina and Mexico. Increased focus on improving operations performance, including productivity and yield, during
FY 2008. OTHER INFORMATION Capital Management
Debt Facilities At the end of August 2006, the company entered into an arrangement whereby various Western Port
and Pork Kembla assets were sold to a partnership in which the company holds a 9% interest. The assets are in turn leased back from the partnership for five years. The assets were sold for a total of $297.1 million, excluding GST, with the net cost of the transaction over the term of the lease being materially lower than the company’s equivalent net cost of debt. Proceeds were applied against borrowings under the company’s $1,200 million syndicated bank debt facility. Under AIFRS, the transaction remains on balance sheet as a financing transaction.
During the period the company also extended two of its bank bilateral 364 day working capital facilities
of $50 million and $300 million for a further 364 days. The $50 million facility is now scheduled to mature on the 19 December 2007, whilst the $300 million facility is scheduled to mature on the 4 October 2007.
The 364 day tranche of the company’s $1,200 million syndicated bank debt facility was also extended
although the tranche was reduced from $100 million to $91.7 million. The total syndicated bank debt facility size is now $1,191.7 million with the 364 day tranche maturing 19 December 2007.
Dividend reinvestment program (DRP)
On the 21 August 2006, the company announced its intention to establish a DRP with effect from and
including the FY 2006 final dividend. A discount of 2.5% per share was applied to the reinvestment of the FY 2006 final dividend (paid in October 2006) resulting in 29% of shareholders participating in the DRP. Consequently, 7,494,951 shares were issued on 24 October 2006 at a DRP issue price of $6.52.
At the same time as announcing the DRP, the company also announced its intention to fully underwrite
the DRP in respect of the October 2006 dividend only. As a consequence, the company entered into an underwriting agreement with Credit Suisse First Boston and issued 17,856,029 shares to that company on 24 October 2006 at an issue price of $6.68.

ASX Full Year Results Announcement Page: 27 Dated: 20 August 2007
The DRP discount of 2.5% was also applied to the reinvestment of the FY 2007 interim dividend (paid in April 2007) resulting in approximately 32% of shareholders participating in the program. Consequently, 5,233,909 shares were issued on 2 April 2007 at a DRP issue price of $9.35.
The DRP discount of 2.5% will also be applied to the reinvestment of the FY 2007 final dividend.
Net debt
During the period, the company’s borrowings decreased by $414M to $1,538M resulting in a gearing ratio of 28.0% (net debt/(net debt plus equity)). The operating cash flow of $1,343M (before interest and income taxes paid) and proceeds on the sale of Vistawall $217M were primarily applied to reducing the level of outstanding debt, funding capital expenditure and investments ($437M), dividends ($100M), tax payments ($228M), interest payments ($151) and the acquisition of a 19.9% stake in Smorgon Steel ($319M).
Safety, Environment & Health
Safety
BlueScope Steel incurred no fatal incidents for this past year. Our goal remains zero harm. The Company's injury levels remain at world best standards with a Lost Time Injury Frequency
Rate of 0.4, remaining below 1 for the third year running. The Medically Treated Injury Frequency Rate finished at 6.4. (Both of these rates are per one million hours worked.)
The key leading indicators for the Company show that 95% of all employees were involved in monthly safety auditing (doing 197,000 audits for the year) with 28,000 near misses being reported. These are just two examples of the Company’s comprehensive proactive effort on safety.
Some of the other noteworthy safety achievements in the year include:
BlueScope Asia achieved 18 months or 23 million hours worked lost time injury free – i.e. every
business in every country in Asia achieved zero lost time injuries for the full year. Asia facilities continue to set new safety benchmark levels; for example, Thailand Map Ta Phut - over 19 million hours lost time injury free; BlueScope Steel Malaysia - 9 consecutive months without an injury and Lysaght Singapore - Zero injuries for the full year.
Australia & New Zealand Industrial Markets achieved 5.9 million hours lost time injury free. Australian Manufacturing Markets also achieved a record lost time injury free period of 3.8 million hours.
Other Australia and New Zealand achievements included: the Port Kembla Steelworks - 15 million hours lost time injury free; Illawarra Coated Products - a full year, over 2 million hours, lost time injury free; Port Kembla Iron & Slab - Slabmaking - 5 million hours lost time injury free; Port Kembla, Transfield Services Alliance - 1 year lost time injury free; New Zealand Steel Contractors - 2 years lost time injury free; Queensland Logistics achieved 1000 days without a lost time injury; Braeside Service Centre - 1 year medically treated injury free; Sunshine Service Centre – 5 months all injury free; the Western Sydney Service Centre was built lost time injury free; BlueScope Steel Research - 12 years lost time injury free and Western Port ended the year with no medically treated injury for the last 3 months.
A number of North America businesses achieved new record lost time injury free periods; for example, Butler Buildings Laurinburg - 3 years and 2 million hours lost time injury free; Visalia - 3 years no lost time injury; Vistawall - 2 million hours lost time injury free and their Tennessee facility - 1 million hours lost time injury free.
Environment
Implementation of BlueScope Steel's environmental compliance system was completed at all
103 operations. The compliance register defines each operation's environmental compliance obligations in terms of the specific actions required. Line management is then required to sign off against their defined obligations on a monthly basis.
An audit review program is undertaken commensurate to the nature, scale and risk of each BlueScope Steel operation. Each year a review is undertaken on a specific governance focus. 38 reviews focusing on risk management were undertaken in FY 2007 which was the third year of reviews.

ASX Full Year Results Announcement Page: 28 Dated: 20 August 2007
The Western Port Works 2006-2011 Environmental Improvement Plan has been finalised with the local Victorian EPA.
The Port Kembla Steel Works and the NSW Department of Environment and Climate Change have signed an agreement for a fifth Pollution Reduction Program for the five year period, 2008-2012.
Across its Australian operations, BlueScope Steel consumed approximately 9,400 megalitres of freshwater from domestic water supplies in FY 2007 reduced from 14,600 megalitres in FY 2006.
The largest improvement in water reduction was at Port Kembla Steelworks, which reduced domestic freshwater consumption from 37 megalitres per day in FY 2006 to 17 megalitres per day in FY 2007. A significant contributor to the reduction was the Sydney Water – Port Kembla treated wastewater project which was commissioned in September 2006. Recently, the milestone of 4 billion litres of recycled water was reached.
Western Port signed an agreement with the Victorian Government and South East Water for the supply of 660 million litres per year of recycled water. This project is planned for completion in 2009 and will reduce fresh water usage by 60%.
BlueScope Seel joined the Australian Government Greenhouse Challenge Plus Programme and has implemented energy savings plans at CRM, Port Kembla Steel Works, Springhill and Western Port Works.
Transport & Logistics Operations
Contracted Linfox after a tender process to become the sole interstate road contractor from early 2008
through to 2012. This contract takes BlueScope into a single source integrated relationship with Linfox on this important service including full system integration.
Through New Zealand Steel, the rail transport requirements for both inbound raw materials and outbound with finished products, particularly for export, was reviewed with a contract extension with Toll Rail completed May until 2014.
During the year the company established a centralised Marine Freight Desk for the growing export task of its Asian operations which is now in full operation and has provided improvement for the growing export task out of Asia.
A global procurement team was formed to ensure BlueScope’s leverage of procured goods and services across its footprint is delivered. Record procurement savings has been achieved during FY 2007 with significant improvements planned for FY 2008.
Interim Dividend Schedule
Ex-dividend date – 24 September 2007 Record date – 28 September 2007 Payment date – 23 October 2007.
Senior Management Changes
The Board announced the appointment of Paul O’Malley, the current Chief Financial Officer, to succeed Kirby Adams as Managing Director and CEO of BlueScope Steel. His appointment will be effective from 1 November 2007.
Other senior executive announcements, effective from 1 July 2007, included:
Bill Jacob appointed President of the North Star BlueScope Steel joint venture in Delta, Ohio; and Ross Murray will succeed Bill as president of New Zealand Steel and Pacific Islands.
Effective 9 August 2007 Lance Hockridge, President North America, gave notice to the Company that he
will leave within the next three months to return to Australia and take up a role at Queensland Rail. For further information:
Media - Sandi Harwood, Manager - External Affairs Tel: +61 3 9666 4039 +61 (0)411 027 006
Investor Relations - John Knowles, Vice President Investor Relations Tel: +61 3 9666 4150 +61 (0)419 893 491

ASX Full Year Results Announcement Page: 29 Dated: 20 August 2007
ATTACHMENT 1 PRODUCTION AND DESPATCH REPORT
OOO Tonnes FY 2007 FY 2006 Variance 2H FY 2006
1H FY 2007
2H FY 2007
AUSTRALIA
Raw Steel Production (1) 5,307 5,283 0% 2,594 2,684 2,623 External Despatches Port Kembla Steelworks - Domestic 1,004 826 22% 416 538 466 - Export 1,572 2,109 (25%) 1,039 790 782 Sub-total 2,576 2,935 (12%) 1,455 1,328 1,248 Coated & Building Products Australia - Domestic 1,468 1,410 4% 715 786 682 - Export 695 542 28% 428 215 480 Sub-total 2,163 1,952 11% 1,143 1,001 1,162 Total Australian Despatches - Domestic 2,472 2,236 11% 1,131 1,324 1,148 - Export 2,267 2,651 (14%) 1,467 1,005 1,262 Total 4,739 4,887 3% 2,598 2,329 2,410 NEW ZEALAND / PACIFIC (2) Raw Steel Production 594 589 1% 284 293 300 External Despatches - Domestic 302 278 9% 144 162 140 - Export 261 300 (13%) 154 121 140 Total 563 578 (3%) 298 283 280 ASIA (Coated & Building Products) Raw Steel Production (3) - - - - - - External Despatches - Domestic 777 631 23% 362 390 387 - Export (4) 157 77 103% 40 44 113 Total 934 708 32% 402 434 500 NORTH AMERICA Raw Steel Production (5) 956 961 (0%) 479 465 492 External Despatches North Star BlueScope Steel - Domestic 942 926 2% 465 451 490 - Export - 15 (100%) 11 - - Coated & Building Products North America
- Domestic 182 183 (1%) 91 99 83 - Export 14 11 35% 5 7 8 Total 1,138 1,135 0% 572 557 581 DISCONTINUED BUSINESSES (6) Raw Steel Production - - - - - - External Despatches - Domestic 157 144 9% 71 91 66 - Export 90 107 (16%) 73 46 44 Total 247 251 (1%) 144 137 110 GROUP 6,857 6,833 0% 3,358 3,442 3,415 Raw Steel Production External Despatches - Domestic 4,832 4,398 10% 2,264 2,517 2,315 - Export 2,789 3,161 (12%) 1,750 1,223 1,566 Total 7,621 7,559 1% 4,014 3,740 3,881

ASX Full Year Results Announcement Page: 30 Dated: 20 August 2007
Notes: (1) Port Kembla Steelworks. (2) Includes New Zealand Steel and Pacific Island operations. (3) BlueScope Steel does not make steel in Asia. The Asian businesses typically source steel from local suppliers, some of whom
source slab or HRC from BlueScope Steel’s Port Kembla or New Zealand operations. (4) Reflects despatches from the Asian country of production to external customers in other countries within Asia, the Pacific
Islands, South Africa and Europe. (5) Reflects BlueScope Steel’s 50% share from North Star BlueScope Steel. (6) Discontinued businesses include Lysaght Taiwan closed in December 2006, Packaging Products closed in April 2007 and
Vistawall sold in June 2007.

ASX Full Year Results Announcement Page: 31 Dated: 20 August 2007
ATTACHMENT 2 PACKAGING PRODUCTS, LYSAGHT TAIWAN AND VISTAWALL DISCONTINUED BUSINESSES FY 2007 and FY 2006; 2H FY 2007 and 2H FY 2006 tonnes $ millions
Financial Measure
FY 2007
FY 2006
$M Change
2H FY 2007
2H FY 2006
$M Change
External despatches (tonnes)
- Packaging Products 247 246 1 110 142 (32)
- Lysaght Taiwan 0 4 (4) 0 2 (2) - Vistawall 0 0 0 0 0 0 - Total 247 250 (3) 110 144 (34) Sales revenue ($M) - Packaging Products 324 298 26 162 160 2 - Lysaght Taiwan 9 30 (21) 0 6 (6) - Vistawall 414 380 34 203 201 2 - Total 747 708 39 365 367 (2) EBIT ($M) - Packaging Products (53) (195) 142 (24) (176) 152 - Lysaght Taiwan (17) (20) 3 (20) (14) (6) - Vistawall (1) 86 18 68 72 11 61 - Total 16 (197) 213 28 (179) 207 Net operating assets (pre-tax) ($M)
- Packaging Products 6 (41) 47 6 (41) 47 - Lysaght Taiwan (24) (2) (22) (24) (2) (22) - Vistawall 0 164 (164) 0 164 (164) - Total (18) 121 (139) (18) 121 (139)
(1) 2H FY 2007 includes the gain on sale of business. Notes:Packaging Products was previously included in Coated and Building Products Australia segment. Lysaght Taiwan previously included in Coated and Building Products Asia segment. Vistawall previously included in Coated and Building Products North America segment.

ASX Full Year Results Announcement Page: 32 Dated: 20 August 2007
ATTACHMENT 3 COATED AND BUILDING PRODUCTS ASIA - COUNTRY FINANCIAL DETAILS FY 2007 and FY 2006; 2H2007 and 2H2006 tonnes $ millions Financial Measure(1)
FY 2007
FY 2006
Tonnes, $M Change
2H FY 2007
2H FY 2006
Tonnes, $M Change
External despatches (tonnes)
- Thailand 306 240 66 177 146 31 - Indonesia 120 98 22 65 54 11 - Malaysia 156 138 18 79 74 5 - Vietnam 73 56 17 40 43 (3) - China 276 173 103 138 83 55 - Other 3 3 0 1 2 (1) - Total 934 708 226 500 402 98 Sales revenue ($M) - Thailand 444 340 104 242 191 51 - Indonesia 190 161 29 99 89 10 - Malaysia 237 210 27 118 113 5 - Vietnam 115 74 41 61 53 8 - China(2) 407 312 95 198 150 48 - Other (6) (49) 43 (7) (12) 5 - Total 1,387 1,048 339 711 584 127 EBIT ($M) - Thailand 48 30 18 18 16 2 - Indonesia 17 19 (2) 8 11 (3) - Malaysia 16 3 13 9 8 1 - Vietnam (3) (10) 7 (1) (4) 3 - China(2) (27) (12) (15) (20) (9) (11) - Other (9) (11) 2 (3) (5) 2 - Total 42 19 23 11 17 (6) Net operating assets (pre-tax) ($M)
- Thailand 325 332 (7) 325 332 (7) - Indonesia 95 134 (39) 95 134 (39) - Malaysia 124 142 (18) 124 142 (18) - Vietnam 152 164 (12) 152 164 (12) - China 405 381 24 405 381 24 - Other 79 64 15 79 64 15 - Total 1,180 1,217 (37) 1,180 1,217 (37) (1) Does not include financial measures relating to discontinued business. Taiwan was reported as discontinued during 1H FY 2007.
Previously Taiwan was reported as part of China (all historical numbers for China have been restated to exclude Taiwan). (2) Previous earnings reports have included sales revenue and EBIT data for the Butler China operations acquired in April 2004. These
operations have now been fully integrated into BlueScope Steel’s China operating and financial results. Coating facilities came into operation in CY 2006.