Resultados Twitter 2T 2014
14
1 Twitter 2Q 2014 Earnings Report
-
Upload
unience -
Category
Economy & Finance
-
view
206 -
download
1
description
Buenos resultados para la red de información en el segundo trimestre, en el que logra mejorar notablemente sus ingresos y actividad
Transcript of Resultados Twitter 2T 2014

1
2Q 2014 Earnings Report

2
Forward-looking statements and non-GAAP information
This presentation and the accompanying press release and conference call contain “forward-looking” statements that are based on our
management’s beliefs and assumptions and on information currently available to management. Forward-looking statements include
statements about expected financial metrics, such as revenue, non-GAAP adjusted EBITDA and EPS, as well as non-financial metrics,
such as average monthly active users, mobile monthly active users and timeline views, for the third quarter of 2014, the full fiscal year
and beyond. They also include statements about our possible or assumed business strategies, competitive position, industry
environment, potential growth opportunities, potential market opportunities and the effects of competition.
Forward-looking statements include all statements that are not historical facts and can be identified by terms such as “anticipates,”
“believes,” “could,” “seeks,” “estimates,” “intends,” “may,” “plans,” “potential,” “predicts,” “projects,” “should,” “will,” “would” or similar
expressions and the negatives of those terms. Forward-looking statements involve known and unknown risks, uncertainties and other
factors that may cause our actual results, performance or achievements to be materially different from any future results, performance
or achievements expressed or implied by the forward-looking statements. For a discussion of these risks, you should read our filings
with the Securities and Exchange Commission (SEC), including our Annual Report on Form 10-K for the year ended December 31,
2013, Quarterly Report on Form 10-Q for the quarter ended March 31, 2014, and the Quarterly Report on Form 10-Q we will file for the
quarter ended June 30, 2014. In addition, please note that the date of this presentation is July 29, 2014, and any forward-looking
statements contained herein are based on assumptions that we believe to be reasonable as of this date. Except as required by law, we
assume no obligation to update these forward-looking statements publicly, or to update the reasons actual results could differ materially
from those anticipated in the forward-looking statements, even if new information becomes available in the future.
This presentation includes certain non-GAAP financial measures as defined by SEC rules. As required by Regulation G, we have
provided a reconciliation of those measures to the most directly comparable GAAP measures, which is available in the Appendix.

3
A Note About Metrics The numbers of active users and timeline views presented in our earnings materials are based on internal company data. While these
numbers are based on what we believe to be reasonable estimates for the applicable period of measurement, there are inherent
challenges in measuring usage and user engagement across our large user base around the world. For example, there are a number of
false or spam accounts in existence on our platform. We have performed an internal review of a sample of accounts and estimated that
false or spam accounts represented less than 5% of our MAUs. In making this determination, we applied significant judgment, so our
estimation of false or spam accounts may not accurately represent the actual number of such accounts, and the actual number of false
or spam accounts could be higher than we have estimated. We are continually seeking to improve our ability to estimate the total
number of spam accounts and eliminate them from the calculation of our active users. For example, we made an improvement in our
spam detection capabilities in the second quarter of 2013 and suspended a large number of accounts. Spam accounts that we have
identified are not included in the active user numbers presented in our earnings materials. We treat multiple accounts held by a single
person or organization as multiple users for purposes of calculating our active users because we permit people and organizations to
have more than one account. Additionally, some accounts used by organizations are used by many people within the organization. As
such, the calculations of our active users may not accurately reflect the actual number of people or organizations using our platform.
Our metrics are also affected by applications that automatically contact our servers for regular updates with no user action involved, and
this activity can cause our system to count the users associated with such applications as active users on the day or days such contact
occurs. In the three months ended June 30, 2014, approximately fourteen percent of all active users used applications that have the
capability to automatically contact our servers for regular updates. As such, the calculations of MAUs presented in our earnings
materials may be affected as a result of automated activity.
In addition, our data regarding user geographic location for purposes of reporting the geographic location of our MAUs is based on the
IP address associated with the account when a user initially registered the account on Twitter. The IP address may not always
accurately reflect a user’s actual location at the time such user engaged with our platform.
We present and discuss timeline views, but have estimated a small percentage of the timeline views in the three months ended
September 30, 2013 to account for certain timeline views that were logged incorrectly during the quarter as a result of a product update.
We believe these estimates to be reasonable, but actual numbers could differ from our estimates. Further, timeline views in 2012
exclude an immaterial number of timeline views for our mobile applications, certain of which were not fully tracked until June 2012.
We present and discuss the size of our audience based on both internal metrics and data from Google Analytics, which measures
unique visitors to our properties.
We regularly review and may adjust our processes for calculating our internal metrics to improve their accuracy. Our measures of user
growth and user engagement may differ from estimates published by third parties or from similarly-titled metrics of our competitors due
to differences in methodology.

4
Key metrics Q2 2014
271 Million MAUs
Reach
640 Timeline Views
/ MAU
Engagement
$1.60 Ad Revenue / 1000
Timeline Views
Monetization
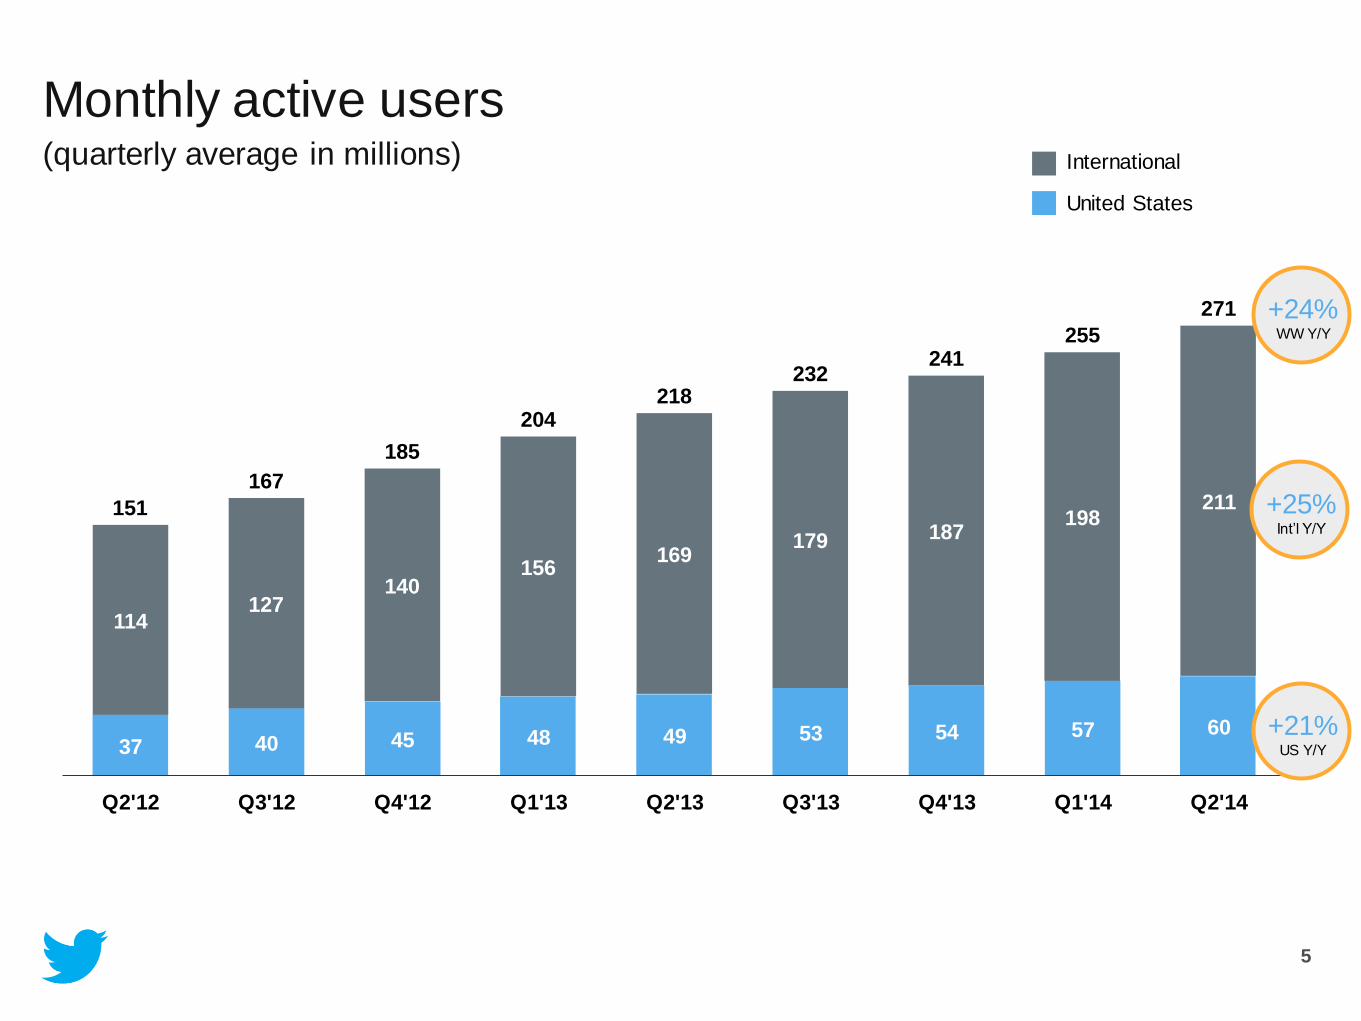
5
Monthly active users (quarterly average in millions) International
United States
37 40 45 48 49 53 54 57 60
114 127
140 156
169 179 187
198 211 151
167
185
204 218
232 241
255
271
Q2'12 Q3'12 Q4'12 Q1'13 Q2'13 Q3'13 Q4'13 Q1'14 Q2'14
+25% Int’l Y/Y
+21% US Y/Y
+24% WW Y/Y

6
Timeline views (in billions) International
United States
28 33 36 39 41 43 41 46 47
61
73 81
97 110
116 107
111 126
89
106
117
136
151 159
148 157
173
Q2'12 Q3'12 Q4'12 Q1'13 Q2'13 Q3'13 Q4'13 Q1'14 Q2'14
+14% Int’l Y/Y
+16% US Y/Y
+15% WW Y/Y

7
Timeline views / MAU (in units) Worldwide
International
United States
763 804 803
828 825 819
756 804 792
536 580 582
619 652 646
572 560 596
591 635 635
668 691 685
613 614 640
Q2'12 Q3'12 Q4'12 Q1'13 Q2'13 Q3'13 Q4'13 Q1'14 Q2'14
-7% WW Y/Y
-9% Int’l Y/Y
-4% US Y/Y

8
$57 $69 $99 $100
$121 $153
$220 $226
$277
$11 $13
$13 $14
$18
$16
$23 $24
$35
$68 $82
$112 $114
$139
$169
$243 $250
$312
Q2'12 Q3'12 Q4'12 Q1'13 Q2'13 Q3'13 Q4'13 Q1'14 Q2'14
Data Licensing & Other
Advertising
+90% DL&O Y/Y
+129% Adv Y/Y
+124% Total Y/Y
Quarterly revenue (in millions)
14% 26% 20% 19% 22% 27% 27% % Int’l 28% 33%

9
Worldwide
International
United States
$1.72 $1.72
$2.20
$1.95
$2.17
$2.58
$3.80
$3.47
$3.87
$0.14 $0.17 $0.25 $0.24 $0.30 $0.36
$0.60 $0.61 $0.75
$0.64 $0.65 $0.85
$0.74 $0.80 $0.97
$1.49 $1.44 $1.60
Q2'12 Q3'12 Q4'12 Q1'13 Q2'13 Q3'13 Q4'13 Q1'14 Q2'14
+100% WW Y/Y
+152% Int’l Y/Y
+79% US Y/Y
Ad revenue / 1,000 timeline views

10
$2 $3
$18
$12 $10 $9
$45
$37
$54
Q2'12 Q3'12 Q4'12 Q1'13 Q2'13 Q3'13 Q4'13 Q1'14 Q2'14
+461% Y/Y
Quarterly adjusted EBITDA (in millions)
Note: Adjusted EBITDA is defined as net loss adjusted to exclude stock -based compensation expense, depreciation and amortization expense, interest and other expenses and provision (benefit)
for income taxes. See Appendix for a reconciliation of net loss to Adjusted EBITDA.
2% 6% 16% 4% 10% 7% 18% % Margin 15% 17%

11
Appendix

12
Adjusted EBITDA reconciliation (in thousands)
Reconciliation of Net Loss to Adjusted EBITDA
Three Months Ended Six Months Ended
Q2’2012 Q3’2012 Q4’2012 Q1’2013 Q2’2013 Q3’2013 Q4’2013 Q1’2014 Q2’2014 Q2’2013 Q2’2014
Net loss $(27,583) $(21,590) $(8,705) $(27,026) $(42,225) $(64,601) $(511,471) $(132,362) $(144,642) $(69,251) $(277,004)
Stock-based
compensation expense
10,900 4,268 5,346 12,922 22,646 43,602 521,197 126,369 158,411 35,568 284,780
Depreciation and
amortization expense
17,520 19,956 21,001 22,730 25,917 29,023 33,224 39,951 45,631 48,647 85,582
Interest and other
expense (income) 266 (172) 1,357 2,762 2,532 909 5,112 1,769 330 5,294 2,099
Provision (benefit)
for income taxes 442 461 (1,428) 357 777 360 (3,317) 1,222 (5,599) 1,134 (4,377)
Adjusted EBITDA $1,545 $2,923 $17,571 $11,745 $9,647 $9,293 $44,745 $36,949 $54,131 $21,392 $91,080
Note: Adjusted EBITDA is defined as net loss adjusted to exclude stock -based compensation expense, depreciation and amortization expense, interest and other expenses and provision (benefit)
for income taxes.

13
GAAP to Non-GAAP reconciliations (in thousands)
Three Months Ended June 30, 2014
GAAP Stock-based
compensation expense
Amortization of acquired
intangible assets Non-GAAP
Cost of Revenue 100,027 13,869 5,754 80,404
Research and development 177,095 92,493 140 84,462
Sales and marketing 140,261 37,547 2,205 100,509
General and administrative 44,694 14,502 - 30,192
Six Months Ended June 30, 2014
GAAP Stock-based
compensation expense
Amortization of acquired
intangible assets Non-GAAP
Cost of Revenue 185,530 23,700 9,894 151,936
Research and development 326,486 170,811 280 155,395
Sales and marketing 246,496 65,348 4,101 177,047
General and administrative 83,428 24,921 - 58,507

14