Result Update (CONSOLIDATED): Q2 FY1 5 CMP 615.00...
13
CMP 615.00 Target Price 676.00 ISIN: INE036A01016 DECEMBER 2 nd 2014 RELIANCE INFRASTRUCTURE LIMITED Result Update (CONSOLIDATED): Q2 FY15 BUY BUY BUY BUY Index Details Stock Data Sector Infrastructure BSE Code 500390 Face Value 10.00 52wk. High / Low (Rs.) 820.00/350.85 Volume (2wk. Avg.) 402000 Market Cap (Rs. in mn.) 161486.70 Annual Estimated Results (A*: Actual / E*: Estimated) YEARS FY14A FY15E FY16E Net Sales 190336.80 196046.90 211730.66 EBITDA 40709.20 47476.23 50880.92 Net Profit 19136.70 20376.69 20923.63 EPS 72.88 77.60 79.68 P/E 8.44 7.93 7.72 Shareholding Pattern (%) 1 Year Comparative Graph RELIANCE INFRASTRUCTURE LTD S&P BSE SENSEX SYNOPSIS Reliance Infrastructure Ltd (RInfra) is India's largest infrastructure company and leading utility company having presence in power business. Total Income of Rs. 44870.8 mn (US$ 727 mn) in Q2 FY15 against Rs. 52734.0 mn in the previous quarter. During Q2 FY15, Net Profit was Rs. 4311.9 mn (US$ 70 mn) against Rs. 4266.0 mn in the previous quarter. During Q2 FY15, EBIDTA is Rs. 11539.5 min as against Rs. 10598.0 mn in Q2 FY14, grew by 8.88%. As on September 30, 2014, the consolidated Networth of the Company stood at Rs. 280400 mn and is conservatively financed with debt to equity of 0.91x. The Company has generated 1,091 million units in Q2 FY15 at Dahanu Thermal Power Station. In Q2 FY15, revenue from Electricity business was Rs. 326774.9 mn. Recovered Rs. 2210 mn arrears in Q2FY15; Recovered Rs. 9660 mn arrears in last 12 months. During Q2 FY15, recovered Rs. 560 mn Cross Subsidy Surcharge and 77500 new consumers added in Mumbai and Delhi discom. RInfra’s EPC business revenue was Rs. 5770 mn & Order Book of Rs. 61060 mn as on September 30, 2014. Infrastructure segment has earned revenue of Rs. 2151.7 mn in Q2 FY15 against Rs. 1730.9 mn in Q2 FY14, an increase 24%. Reliance cement commercially launched in 6 states with 5.8 mtpa operational Capacity. PEER GROUPS CMP MARKET CAP EPS P/E (X) P/BV(X) DIVIDEND Company Name (Rs.) Rs. in mn. (Rs.) Ratio Ratio (%) Reliance Infrastructure Ltd 615.00 161486.70 72.88 8.44 0.62 75.00 Power Grid Corporation of India Ltd 142.40 744978.40 8.71 16.35 2.38 27.50 GMR Infrastructure Ltd 19.30 84172.10 0.23 83.91 1.14 10.00 NTPC Ltd 142.65 1176215.50 12.40 11.50 1.29 57.50
Transcript of Result Update (CONSOLIDATED): Q2 FY1 5 CMP 615.00...
CMP 615.00
Target Price 676.00
ISIN: INE036A01016
DECEMBER 2nd
2014
RELIANCE INFRASTRUCTURE LIMITED Result Update (CONSOLIDATED): Q2 FY15
BUYBUYBUYBUY
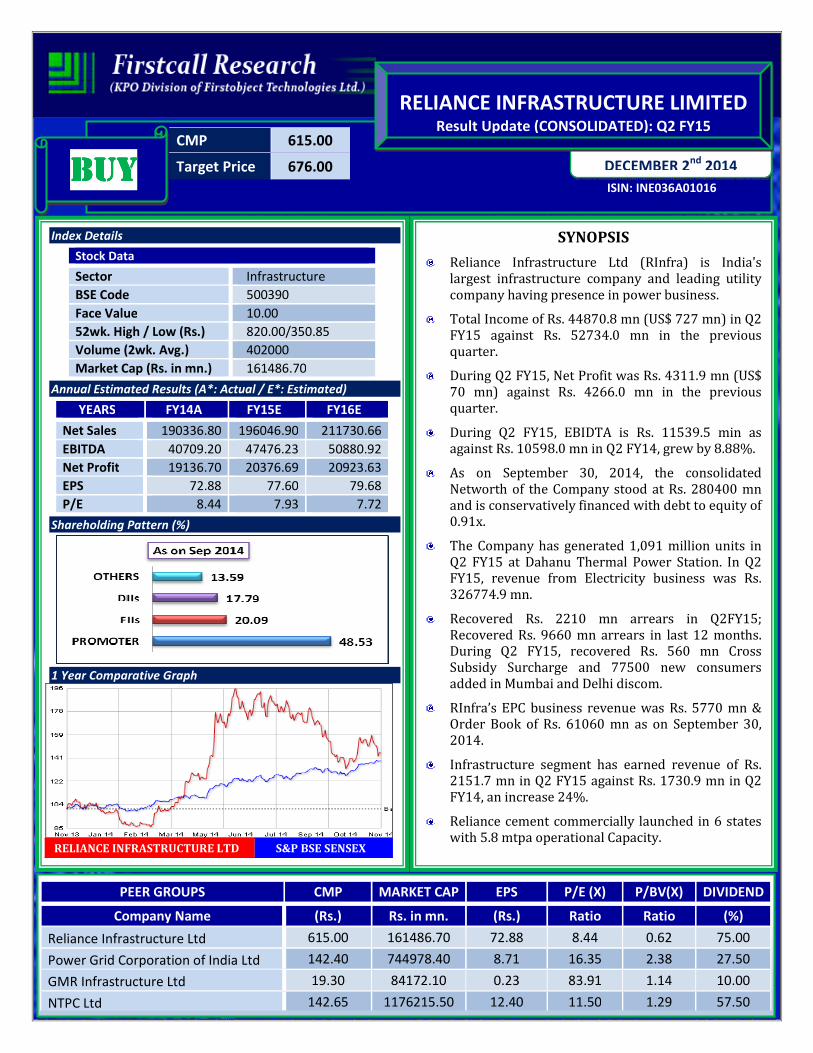
Index Details
Stock Data
Sector Infrastructure
BSE Code 500390
Face Value 10.00
52wk. High / Low (Rs.) 820.00/350.85
Volume (2wk. Avg.) 402000
Market Cap (Rs. in mn.) 161486.70
Annual Estimated Results (A*: Actual / E*: Estimated)
YEARS FY14A FY15E FY16E
Net Sales 190336.80 196046.90 211730.66
EBITDA 40709.20 47476.23 50880.92
Net Profit 19136.70 20376.69 20923.63
EPS 72.88 77.60 79.68
P/E 8.44 7.93 7.72
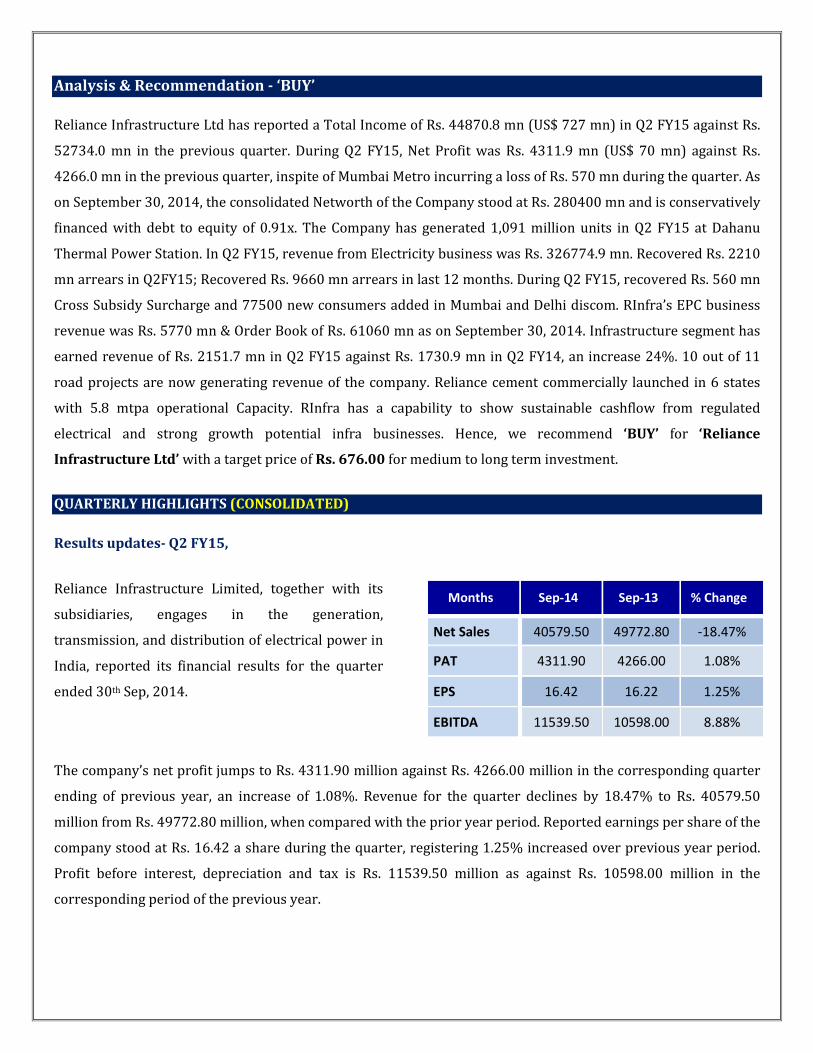
Shareholding Pattern (%)
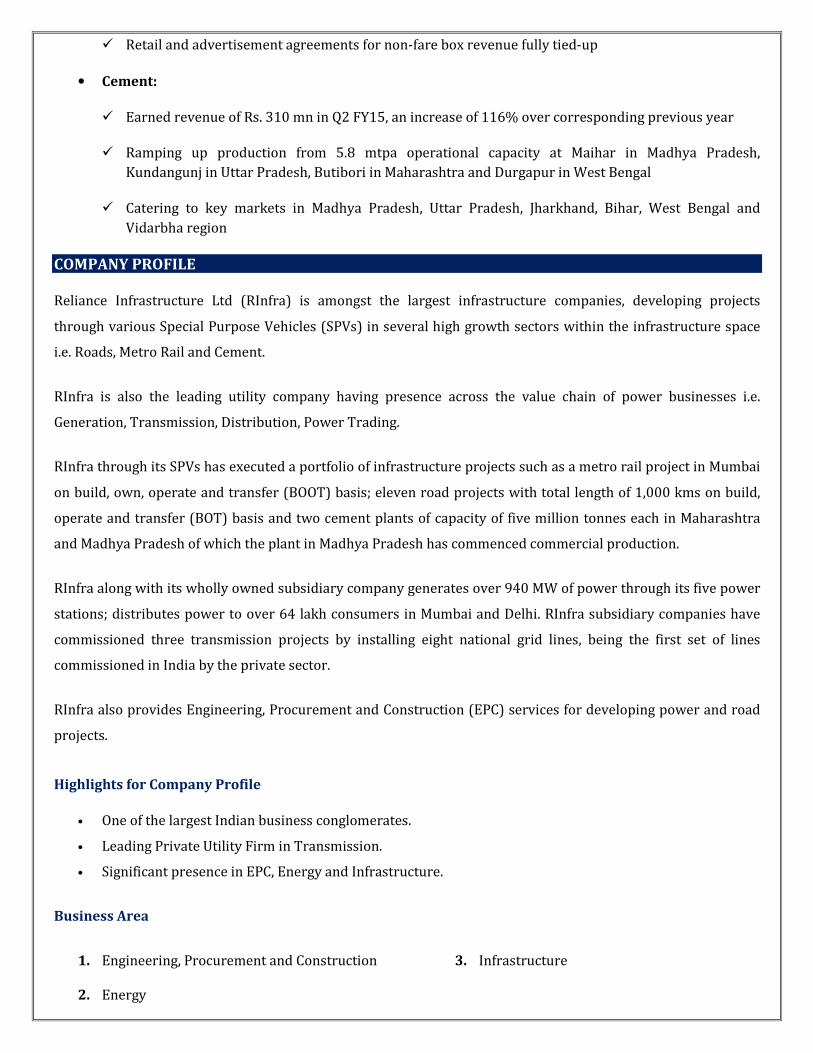
1 Year Comparative Graph
RELIANCE INFRASTRUCTURE LTD S&P BSE SENSEX
SYNOPSIS
Reliance Infrastructure Ltd (RInfra) is India's largest infrastructure company and leading utility company having presence in power business.
Total Income of Rs. 44870.8 mn (US$ 727 mn) in Q2 FY15 against Rs. 52734.0 mn in the previous quarter.
During Q2 FY15, Net Profit was Rs. 4311.9 mn (US$ 70 mn) against Rs. 4266.0 mn in the previous quarter.
During Q2 FY15, EBIDTA is Rs. 11539.5 min as against Rs. 10598.0 mn in Q2 FY14, grew by 8.88%.
As on September 30, 2014, the consolidated Networth of the Company stood at Rs. 280400 mn and is conservatively financed with debt to equity of 0.91x.
The Company has generated 1,091 million units in Q2 FY15 at Dahanu Thermal Power Station. In Q2 FY15, revenue from Electricity business was Rs. 326774.9 mn.
Recovered Rs. 2210 mn arrears in Q2FY15; Recovered Rs. 9660 mn arrears in last 12 months. During Q2 FY15, recovered Rs. 560 mn Cross Subsidy Surcharge and 77500 new consumers added in Mumbai and Delhi discom.
RInfra’s EPC business revenue was Rs. 5770 mn & Order Book of Rs. 61060 mn as on September 30, 2014.
Infrastructure segment has earned revenue of Rs. 2151.7 mn in Q2 FY15 against Rs. 1730.9 mn in Q2 FY14, an increase 24%.
Reliance cement commercially launched in 6 states with 5.8 mtpa operational Capacity.
PEER GROUPS CMP MARKET CAP EPS P/E (X) P/BV(X) DIVIDEND
Company Name (Rs.) Rs. in mn. (Rs.) Ratio Ratio (%)
Reliance Infrastructure Ltd 615.00 161486.70 72.88 8.44 0.62 75.00
Power Grid Corporation of India Ltd 142.40 744978.40 8.71 16.35 2.38 27.50
GMR Infrastructure Ltd 19.30 84172.10 0.23 83.91 1.14 10.00
NTPC Ltd 142.65 1176215.50 12.40 11.50 1.29 57.50
Analysis & Recommendation - ‘BUY’
Reliance Infrastructure Ltd has reported a Total Income of Rs. 44870.8 mn (US$ 727 mn) in Q2 FY15 against Rs.
52734.0 mn in the previous quarter. During Q2 FY15, Net Profit was Rs. 4311.9 mn (US$ 70 mn) against Rs.
4266.0 mn in the previous quarter, inspite of Mumbai Metro incurring a loss of Rs. 570 mn during the quarter. As
on September 30, 2014, the consolidated Networth of the Company stood at Rs. 280400 mn and is conservatively
financed with debt to equity of 0.91x. The Company has generated 1,091 million units in Q2 FY15 at Dahanu
Thermal Power Station. In Q2 FY15, revenue from Electricity business was Rs. 326774.9 mn. Recovered Rs. 2210
mn arrears in Q2FY15; Recovered Rs. 9660 mn arrears in last 12 months. During Q2 FY15, recovered Rs. 560 mn
Cross Subsidy Surcharge and 77500 new consumers added in Mumbai and Delhi discom. RInfra’s EPC business
revenue was Rs. 5770 mn & Order Book of Rs. 61060 mn as on September 30, 2014. Infrastructure segment has
earned revenue of Rs. 2151.7 mn in Q2 FY15 against Rs. 1730.9 mn in Q2 FY14, an increase 24%. 10 out of 11
road projects are now generating revenue of the company. Reliance cement commercially launched in 6 states
with 5.8 mtpa operational Capacity. RInfra has a capability to show sustainable cashflow from regulated
electrical and strong growth potential infra businesses. Hence, we recommend ‘BUY’ for ‘Reliance
Infrastructure Ltd’ with a target price of Rs. 676.00 for medium to long term investment.
QUARTERLY HIGHLIGHTS (CONSOLIDATED)
Results updates- Q2 FY15,
Reliance Infrastructure Limited, together with its
subsidiaries, engages in the generation,
transmission, and distribution of electrical power in
India, reported its financial results for the quarter
ended 30th Sep, 2014.
Months Sep-14 Sep-13 % Change
Net Sales 40579.50 49772.80 -18.47%
PAT 4311.90 4266.00 1.08%
EPS 16.42 16.22 1.25%
EBITDA 11539.50 10598.00 8.88%
The company’s net profit jumps to Rs. 4311.90 million against Rs. 4266.00 million in the corresponding quarter
ending of previous year, an increase of 1.08%. Revenue for the quarter declines by 18.47% to Rs. 40579.50
million from Rs. 49772.80 million, when compared with the prior year period. Reported earnings per share of the
company stood at Rs. 16.42 a share during the quarter, registering 1.25% increased over previous year period.
Profit before interest, depreciation and tax is Rs. 11539.50 million as against Rs. 10598.00 million in the
corresponding period of the previous year.

Break up of Expenditure
Break up of
Expenditure
Value in Rs. Million
Q2 FY15 Q2 FY14 %
Change
Cost of Electrical
Energy Purchased 18928.00 21816.40 -13%
Cost of Fuel 2974.50 3701.10 -20%
Cost of Material
Consumed & Sub
Contracting Charges
4463.10 10775.70 -59%
Purchase of stock-in-
trade 70.80 12.00 490%
Employee Benefit
Expenses 3014.80 2763.50 9%
Depreciation &
Amortization Expense 2273.60 1420.40 60%
Other Expenses 3866.30 3064.30 26%
Segment Revenue

1. Electrical Business
• Distribution Business: Largest private sector distributor of power serving over 64 lakh consumers
Mumbai Distribution:
� Recovered Rs. 2210 mn arrears in Q2FY15; Recovered Rs. 9660 mn arrears in last 12 months
� Recovered Rs. 560 mn Cross Subsidy Surcharge in Q2 FY15
� 19,000 new consumers added in Q2FY15; Total consumers: 29.4 lakhs
Delhi Distribution:
� Tariff hike of 8.3% approved by regulator wef July 2014
� Regulator approved recovery of ~Rs. 21000 mn arrears including carrying cost in Delhi discom
� 58,700 new consumers added in Q2FY15; Total consumers: 34.8 lakh
• Transmission:
� WRSS project in Maharashtra is fully commissioned
� 92% of the Parbati Koldam transmission project in Himachal Pradesh commissioned
� All projects to be revenue operational within FY15
• Generation :
The Company has generated 1,091 million units in Q2FY15 at Dahanu Thermal Power Station
2. EPC Business
Revenue of Rs. 5770 mn & Order Book of Rs. 61060 mn as on September 30, 2014
3. Infrastructure Business
• Road Projects
� Earned revenue of Rs. 1460 mn in Q2 FY15 against Rs. 1590 mn in the corresponding previous year.
Decrease is mainly due to restructuring of shareholding in TD, SU and TK Toll road projects
� 10 out of 11 road projects are revenue generating
• Mumbai Metro
� Over 40 million commuters travelled in first 5 months of operations
� Around 45,000 trips made with service efficiency of over 99%
� Travel time substantially reduced from ~90 mins to ~21 mins
� Retail and advertisement agreements for non-fare box revenue fully tied-up
• Cement:
� Earned revenue of Rs. 310 mn in Q2 FY15, an increase of 116% over corresponding previous year
� Ramping up production from 5.8 mtpa operational capacity at Maihar in Madhya Pradesh,
Kundangunj in Uttar Pradesh, Butibori in Maharashtra and Durgapur in West Bengal
� Catering to key markets in Madhya Pradesh, Uttar Pradesh, Jharkhand, Bihar, West Bengal and
Vidarbha region
COMPANY PROFILE
Reliance Infrastructure Ltd (RInfra) is amongst the largest infrastructure companies, developing projects
through various Special Purpose Vehicles (SPVs) in several high growth sectors within the infrastructure space
i.e. Roads, Metro Rail and Cement.
RInfra is also the leading utility company having presence across the value chain of power businesses i.e.
Generation, Transmission, Distribution, Power Trading.
RInfra through its SPVs has executed a portfolio of infrastructure projects such as a metro rail project in Mumbai
on build, own, operate and transfer (BOOT) basis; eleven road projects with total length of 1,000 kms on build,
operate and transfer (BOT) basis and two cement plants of capacity of five million tonnes each in Maharashtra
and Madhya Pradesh of which the plant in Madhya Pradesh has commenced commercial production.
RInfra along with its wholly owned subsidiary company generates over 940 MW of power through its five power
stations; distributes power to over 64 lakh consumers in Mumbai and Delhi. RInfra subsidiary companies have
commissioned three transmission projects by installing eight national grid lines, being the first set of lines
commissioned in India by the private sector.
RInfra also provides Engineering, Procurement and Construction (EPC) services for developing power and road
projects.
Highlights for Company Profile
• One of the largest Indian business conglomerates.
• Leading Private Utility Firm in Transmission.
• Significant presence in EPC, Energy and Infrastructure.
Business Area
1. Engineering, Procurement and Construction
2. Energy
3. Infrastructure

FINANCIAL HIGHLIGHT (CONSOLIDATED) (A*- Actual, E* -Estimations & Rs. In Millions)
Balance Sheet as at March 31, 2013 -2016E
FY13A FY14A FY15E FY16E
SOURCES OF FUNDS
Shareholder's Funds
Share Capital 2630.30 2625.80 2625.80 2625.80
Reserves and Surplus 258579.80 268808.60 287371.39 308295.02
1. Sub Total - Net worth 261210.10 271434.40 289997.19 310920.82
2. Minority interest 2312.20 2524.30 2423.33 2520.26
Non Current Liabilities
Long term borrowings 126357.10 150491.20 161025.58 169076.86
Deferred Tax Liabilities 5652.30 5067.20 4712.50 4524.00
Other Long term liabilities 34690.80 30397.00 32828.76 34470.20
Long Term Provisions 4184.10 3960.10 4197.71 4365.61
3. Sub Total - Non Current Liabilities 170884.30 189915.50 202764.55 212436.67
Current Liabilities
Short Term Borrowings 79784.70 81888.30 81069.42 82690.81
Trade Payables 68126.40 65402.30 66710.35 69378.76
Other Current Liabilities 79134.50 79135.90 84675.41 88909.18
Short Term Provisions 3507.40 4829.90 5602.68 6275.01
4. Sub Total - Current Liabilities 230553.00 231256.40 238057.86 247253.75
Total Liabilities (1+2+3+4) 664959.60 695130.60 733242.93 773131.51
APPLICATION OF FUNDS
Non-Current Assets
Fixed Assets
Tangible assets 84150.80 87034.00 91385.70 95041.13
Intangible assets 29013.00 15976.10 17573.71 18979.61
Capital Work in Progress 45228.40 49789.20 52776.55 55415.38
Intangible assets under development 54178.70 63270.60 69597.66 74469.50
a) Sub Total - Fixed Assets 212570.90 216069.90 231333.62 243905.61
b) Non-current investments 100339.50 141182.10 158281.44 174109.58
c) Long Term loans and advances 23476.80 24970.50 15481.71 16255.80
d) Other non-current assets 95216.80 76373.30 75609.57 71072.99
1. Sub Total - Non Current Assets 431604.00 458595.80 480706.34 505343.98
Current Assets
Current Investment 29342.80 41622.20 35795.09 38658.70
Inventories 4707.20 5186.90 4564.47 4929.63
Trade receivables 37578.80 50196.70 54212.44 56923.06
Cash and Bank Balances 4924.20 6523.50 7697.73 8621.46
Short-terms loans & advances 132950.50 104714.00 115185.40 120065.07
Other current assets 23852.10 28291.50 35081.46 38589.61
2. Sub Total - Current Assets 233355.60 236534.80 252536.59 267787.52
Total Assets (1+2) 664959.60 695130.60 733242.93 773131.51

Annual Profit & Loss Statement for the period of 2013 to 2016E
Value(Rs.in.mn) FY13A FY14A FY15E FY16E
Description 12m 12m 12m 12m
Net Sales 223815.50 190336.80 196046.90 211730.66
Other Income 10514.30 12400.40 15128.49 15733.63
Total Income 234329.80 202737.20 211175.39 227464.28
Expenditure -194159.10 -162028.00 -163699.16 -176583.37
Operating Profit 40170.70 40709.20 47476.23 50880.92
Interest -16874.30 -16960.70 -20013.63 -22014.99
Gross profit 23296.40 23748.50 27462.60 28865.93
Depreciation -5511.00 -5340.80 -7957.79 -8912.73
Exceptional Items 3828.00 0.00 0.00 0.00
Profit Before Tax 21613.40 18407.70 19504.81 19953.20
Tax -2026.40 -2743.30 -3042.75 -3112.70
Profit After Tax 19587.00 15664.40 16462.06 16840.50
Minority Interest -63.70 -58.80 595.40 631.12
Share of Profit & Loss of Asso 2945.00 3531.10 3319.23 3452.00
Net Profit 22468.30 19136.70 20376.69 20923.63
Equity capital 2630.30 2625.80 2625.80 2625.80
Reserves 249183.60 256581.60 287371.39 308295.02
Face value 10.00 10.00 10.00 10.00
EPS 85.42 72.88 77.60 79.68
Quarterly Profit & Loss Statement for the period of 31st Mar, 2014 to 31st Dec, 2014E
Value(Rs.in.mn) 31-Mar-14 30-Jun-14 30-Sep-14 31-Dec-14E
Description 3m 3m 3m 3m
Net sales 47076.90 41508.90 40579.50 43825.86
Other income 3283.10 3976.00 4291.30 4548.78
Total Income 50360.00 45484.90 44870.80 48374.64
Expenditure -40333.10 -34654.80 -33331.30 -36375.46
Operating profit 10026.90 10830.10 11539.50 11999.17
Interest -4512.30 -4807.50 -5646.40 -5307.62
Gross profit 5514.60 6022.60 5893.10 6691.56
Depreciation -1263.50 -1420.30 -2273.60 -2387.28
Profit Before Tax 4251.10 4602.30 3619.50 4304.28
Tax 852.00 -1061.40 -528.10 -645.64
Profit After Tax 5103.10 3540.90 3091.40 3658.64
Minority Interest -2.40 13.80 254.70 267.44
Share of Profit & Loss of Asso 1113.50 1021.50 965.80 888.54
Net Profit 6214.20 4576.20 4311.90 4814.61
Equity capital 2625.80 2625.80 2625.80 2625.80
Face value 10.00 10.00 10.00 10.00
EPS 23.67 17.43 16.42 18.34

Ratio Analysis
Particulars FY13A FY14A FY15E FY16E
EPS (Rs.) 85.42 72.88 77.60 79.68
EBITDA Margin (%) 17.95% 21.39% 24.22% 24.03%
PBT Margin (%) 9.66% 9.67% 9.95% 9.42%
PAT Margin (%) 8.75% 8.23% 8.40% 7.95%
P/E Ratio (x) 7.20 8.44 7.93 7.72
ROE (%) 7.78% 6.04% 5.68% 5.42%
ROCE (%) 9.98% 9.37% 10.42% 10.63%
Debt Equity Ratio 0.82 0.90 0.83 0.81
EV/EBITDA (x) 8.31 8.49 7.58 7.19
Book Value (Rs.) 957.36 987.16 1104.41 1184.10
P/BV 0.64 0.62 0.56 0.52
Charts

OUTLOOK AND CONCLUSION
� At the current market price of Rs.615.00, the stock P/E ratio is estimated 7.93 x FY15E and 7.72 x FY16E
respectively.
� Earning per share (EPS) of the company for the earnings for FY15E and FY16E is seen at Rs. 77.60 and Rs.
79.68 respectively.
� Operating Profit of the company is expected to grow at a CAGR of 8% over 2013 to 2016E respectively.
� On the basis of EV/EBITDA, the stock trades at 7.58 x for FY15E and 7.19 x for FY16E.
� Price to Book Value of the stock is expected to be at 0.56 x and 0.52 x respectively for FY15E and FY16E.
� We recommend ‘BUY’ in this particular scrip with a target price of Rs.676.00 for Medium to Long term
investment.
INDUSTRY OVERVIEW
Infrastructure Industry Structure and Development
The rapid growth of the Indian economy in recent years has placed increasing stress on physical infrastructure
i.e. electricity, railways, roads, ports, irrigation, water supply and sanitation, all of which already suffer from
deficit in terms of capacities as well as efficiencies. The pattern of inclusive growth averaging at 9 per cent per
year as conceived under the 12th Plan (2012-17) can be achieved only if this infrastructure deficit is overcome
and adequate investment takes place to support higher growth and improved quality of life for both urban and
rural communities.

Based on projections provided in the Mid-Term Appraisal of the 12th Plan, in order to attain a 9 per cent real GDP
growth rate, infrastructure investment should be on an average of almost 10 per cent of GDP during the 12th Plan.
Therefore, the Government of India (the Government) has set a massive target for doubling investment in
infrastructure from Rs. 21 trillion in 11th Plan to Rs. 56 trillion during the 12th Plan, out of which 50 per cent is
expected from the private sector.
Roads
India has the second largest road network in the world aggregating 4.7 million kms of road which constitutes 77
per cent passenger traffic and 62 per cent freight traffic in the country. However, road sector in India has been in
the grip of slowdown in the last two years due to execution delays arising out of delay in obtaining
environmental and regulatory clearances and land acquisition. This has resulted in project cost escalations and
highly leveraged balance sheet of developers. The inordinate delay by National Highways Authority of India
Limited (NHAI) in resolving the impediments to project execution has further aggravated the situation. In 2013-
14, there has been muted traffic growth across the country due to overall slowdown in the macro-economy and
only 1,646 kms of road was awarded mostly on EPC basis mainly due to land acquisition issues. However NHAI is
now better placed especially with respect to land acquisition problems and is planning to award 5,600 kms of
road projects worth Rs. 450 billion in FY2014-15 especially in the state of Gujarat, Madhya Pradesh, Rajasthan
and Uttar Pradesh. The Government has proposed to setup a regulatory authority to address financial stress,
construction risks and contract management in the sector and has envisaged total investment of Rs. 9,200 billion
in the 12th Plan out of which 33 per cent is expected to be financed by the private sector.
Rail Transport
India has the world’s fourth largest rail network and the second largest network under single management. The
Government has planned total investment of Rs. 5,200 billion in the 12th Plan as against Rs. 2,320 billion in 11th
Plan excluding Metro rails, out of which Rs. 1000 billion (i.e 20 per cent) is expected to be financed by the private
sector and balance funding through internal generation of funds. According to the working sector group report
for 12th Plan, the internal requirement of funds will be met through 12 per cent Compounded Annual Growth
Rate (CAGR) in passenger receipts and 9.9 per cent increase in freight receipts. The Government has also laid
special emphasis on development of Mass Rapid Transit System (MRTS) like Metro Rails and Mono Rails and has
planned that any city with population of more than 2 million to have a metro/mono rail.
The Government has identified 16 new cities like Ahmedabad, Chandigarh, Hyderabad, Gurgaon, Jaipur, Kochi,
Patna, etc. with metro rail network of more than 1,500 kms in next 10 years. The total investment in the metro
rail sector is envisaged to be Rs. 1,250 billion in 12th Plan against Rs. 420 billion in 11th Plan, with significant
investment of about 42 per cent coming from the private sector.

Cement
India is the second largest cement producer in the world with nearly 364 million tones of installed cement
production capacity. The per capita consumption in India is very low i.e. 192 kg against world average of 365 kg
and this sector has grown at CAGR of 8 per cent in the last decade. The housing sector is the biggest demand
driver of cement, followed by infrastructure sector, commercial construction and industrial construction. The
sector is mainly dominated by private players with nearly 98 per cent under the private sector. Cement, being a
bulk commodity, is a freight intensive industry and transporting it over long distances can prove to be
uneconomical. This has resulted in cement being largely a regional play with the industry divided into five main
regions viz. north, south, west, east and the central region.
The Southern region of India has the highest installed capacity, accounting for about one-third of the country's
total installed cement capacity. Given the high potential for growth, quite a few foreign transnational companies
have ventured into the Indian markets. While companies like Lafarge, Heidelberg and Italicementi have already
made a couple of acquisitions, Holcim has increased its stake in domestic companies, Ambuja Cements and ACC,
to over 50 per cent to gain controlling interest.
Power
India has perennially remained a power deficit country. Huge potential exists for power generation, transmission
and distribution companies as the country’s per capita electricity consumption of 917 kwh is much lower than
the world average of 2,933 kwh. However, the power sector has remained under pressure due to issues like, fuel
(coal and gas availability), fuel cost escalations due to import of coal and gas, poor financial health of State
Electricity Boards (SEBs), land and environmental issues, etc. which have adversely affected the performance
and financial position of the companies in the private sector.
However recognizing the impact, the Government and regulatory agencies have taken many steps to resolve the
issues hampering the growth of the sector. These steps include financial restructuring of many SEBs to improve
their financial health, cost pass through allowed for some power plants for increased fuel cost, regular electricity
tariff hikes allowed by electricity regulatory commissions to meet the escalating power purchase cost for
discoms, etc. which are likely to revive the momentum and improve the capial expenditure cycle of utility players
in the sector. Given the power shortages and increasing demand or electricity, the total investment in the sector
is expected to increase to Rs. 15,000 billion in 12th Plan from Rs. 8,045 billion in 11th Plan, out of which 48 per
cent is expected from the private sector.

Disclaimer:
This document is prepared by our research analysts and it does not constitute an offer or solicitation for the
purchase or sale of any financial instrument or as an official confirmation of any transaction. The information
contained herein is from publicly available data or other sources believed to be reliable but we do not represent that
it is accurate or complete and it should not be relied on as such. Firstcall Research or any of its affiliates shall not be
in any way responsible for any loss or damage that may arise to any person from any inadvertent error in the
information contained in this report. Firstcall Research and/ or its affiliates and/or employees will not be liable for
the recipients’ investment decision based on this document.

Firstcall India Equity Research: Email – [email protected]
C.V.S.L.Kameswari Pharma & Diversified
U. Janaki Rao Capital Goods
B. Anil Kumar Auto, IT & FMCG
M. Vinayak Rao Diversified
C. Bhagya Lakshmi Diversified
G. Amarender Diversified
Firstcall Research Provides
Industry Research on all the Sectors and Equity Research on Major Companies
forming part of Listed and Unlisted Segments
For Further Details Contact:
Tel.: 022-2527 2510/2527 6077 / 25276089 Telefax: 022-25276089
040-20000235 /20000233
E-mail: [email protected]
www.firstcallresearch.com