Restriction-Map Variation Associated with the G6PD...
14
Restriction-Map Variation Associated with the G6PD Polymorphism in Natural Populations of Drosophila melanogaster ’ Walter F. Eanes, James W. Ajioka, 2 Jody Hey, 3 and Cedric Wesley Department of Ecology and Evolution, State University of New York at Stony Brook Restriction-map variation was studied in 126 copies of the G6pd region in X chro- mosome lines of Drosophila melanogaster from North America, Europe, and Africa. Special attention was focused on the distribution of variation relative to the geo- graphically variable polymorphism for two electrophoretic variants. Nucleotide heterozygosity as determined by eight six-cutter restriction enzymes for the 13-kb region is estimated, on the basis of the worldwide sample, to be 0.065%, which is the lowest value reported for any comparable region in the D. melanogaster genome. Significant linkage disequilibrium between electrophoretic alleles and restriction- site variation is observed for several sites. In contrast to published studies of other genetic regions, there are large insertions that reach significant frequencies and are found across considerable geographic distances. There is a clustering of this variation inside the first large intervening sequence of the G6PD gene. Introduction The DNA sequence diversity revealed by restriction-site mapping offers population geneticists the opportunity to explore questions associated with specific enzyme poly- morphisms that have been the target of intense study. Irrespective of the issue of enzyme polymorphism, studies of the A& ( Aquadro et al. 1986)) white (Langley and Aquadro 1987; Miyashita and Langley 1988), Notch (Schaeffer et al. 1988), hsp70 (Leigh Brown 1983), Amy (Langley et al. 1988), and rosy (Aquadro et al. 1988) regions in the Drosophila melanogaster genome have established a recurrent pattern of single base substitution, small insertion-deletion variation, and large insertions typical of mobile genetic elements. Each category of variation appears to possess a characteristic frequency spectrum, with extensive polymorphism of single base substitutions, lower frequency polymorphism of the small insertion-deletion events, and the observation that individual large insertions are always recovered as unique events, never as poly- morphisms (see Golding et al. 1986). The pattern of restriction-map variation associated with the regions coding for allozyme variants has the potential to contribute to our understanding of these poly- morphisms in several ways. First, the pattern of linkage disequilibrium across the region of DNA spanning a polymorphism defines the physical limits over which non- 1. Key words: restriction-map variation, Drosophila melanogaster, glucose-6-phosphate dehydrogenase. 2. Current address: Department of Genetics, Washington University School of Medicine, St. Louis, Missouri 63 110. 3. Current address: Museum of Comparative Zoology, Harvard University, Cambridge, Massachusetts 01238. Address for correspondence and reprints: Walter F. Eanes, University of New York at Stony Brook, New York 11794. Department of Ecology and Evolution, State Mol. Biol. Evol. 6(4):384-397. 1989. 0 1989 by The University of Chicago. All rights reserved. 0737-4038/89/0604-0006$02.00
Transcript of Restriction-Map Variation Associated with the G6PD...

Restriction-Map Variation Associated with the G6PD Polymorphism in Natural Populations of Drosophila melanogaster ’
Walter F. Eanes, James W. Ajioka, 2 Jody Hey, 3 and Cedric Wesley Department of Ecology and Evolution, State University of New York at Stony Brook
Restriction-map variation was studied in 126 copies of the G6pd region in X chro- mosome lines of Drosophila melanogaster from North America, Europe, and Africa. Special attention was focused on the distribution of variation relative to the geo- graphically variable polymorphism for two electrophoretic variants. Nucleotide heterozygosity as determined by eight six-cutter restriction enzymes for the 13-kb region is estimated, on the basis of the worldwide sample, to be 0.065%, which is the lowest value reported for any comparable region in the D. melanogaster genome. Significant linkage disequilibrium between electrophoretic alleles and restriction- site variation is observed for several sites. In contrast to published studies of other genetic regions, there are large insertions that reach significant frequencies and are found across considerable geographic distances. There is a clustering of this variation inside the first large intervening sequence of the G6PD gene.
Introduction
The DNA sequence diversity revealed by restriction-site mapping offers population geneticists the opportunity to explore questions associated with specific enzyme poly- morphisms that have been the target of intense study. Irrespective of the issue of enzyme polymorphism, studies of the A& ( Aquadro et al. 1986)) white (Langley and Aquadro 1987; Miyashita and Langley 1988), Notch (Schaeffer et al. 1988), hsp70 (Leigh Brown 1983), Amy (Langley et al. 1988), and rosy (Aquadro et al. 1988) regions in the Drosophila melanogaster genome have established a recurrent pattern of single base substitution, small insertion-deletion variation, and large insertions typical of mobile genetic elements. Each category of variation appears to possess a characteristic frequency spectrum, with extensive polymorphism of single base substitutions, lower frequency polymorphism of the small insertion-deletion events, and the observation that individual large insertions are always recovered as unique events, never as poly- morphisms (see Golding et al. 1986).
The pattern of restriction-map variation associated with the regions coding for allozyme variants has the potential to contribute to our understanding of these poly- morphisms in several ways. First, the pattern of linkage disequilibrium across the region of DNA spanning a polymorphism defines the physical limits over which non-
1. Key words: restriction-map variation, Drosophila melanogaster, glucose-6-phosphate dehydrogenase.
2. Current address: Department of Genetics, Washington University School of Medicine, St. Louis, Missouri 63 110.
3. Current address: Museum of Comparative Zoology, Harvard University, Cambridge, Massachusetts 01238.
Address for correspondence and reprints: Walter F. Eanes, University of New York at Stony Brook, New York 11794.
Department of Ecology and Evolution, State
Mol. Biol. Evol. 6(4):384-397. 1989. 0 1989 by The University of Chicago. All rights reserved. 0737-4038/89/0604-0006$02.00

G6PD Restriction-Map Variation 385
random associations persist. This establishes the genetic distance over which we may expect cis-acting regulation and flanking gene loci to appear nonrandomly associated with an electrophoretic polymorphism (Aquadro et al. 1986; Langley et al. 1988). Both Adh and Amy allozyme variants show linkage disequilibrium with flanking re- striction-map polymorphism, and this can extend as far as kilobases from the site of the amino acid replacement (or coding region, if that specific site is unknown). These associations must potentially confound the study of fitness relationships associated with allozyme polymorphisms. Second, through the analysis of activity variation and restriction-site variation, it is possible to identify potential c&acting sequence variants that associate with within-allele or line regulatory variation (Aquadro et al. 1986; Langley et al. 1988). Last, restriction-map variation permits the exploration of ge- nealogical relationships among gene copies. When juxtaposed with the enzyme poly- morphism, the geographic distribution offers the opportunity to reject historical hy- potheses associated with the origin and spread of a polymorphism. This information has been important in deciphering the population genetics of the human sickle cell polymorphism (Chebloune et al. 1988), the t locus in Mus (Silver et al. 1987), and the ADH locus in D. melanogaster ( Aquadro et al. 1986; Hudson and Kaplan 1986; Kreitman and Aguade 1986; Hudson et al. 1987).
The glucose-(j-phosphate dehydrogenase (G6PD) polymorphism has emerged over the past 20 years as the focus of a number of population (Bijlsma and Van Delden 1977; Cavener and Clegg 198 1; Oakeshott et al. 1983; Eanes et al. 1985; Eanes and Hey 1986), biochemical (Steele et al. 1968; Bijlsma and Van der Meulen-Bruijns 1979; Hori and Tanda 1980; Williamson and Bentley 1983; Ganguly et al. 1985; Fouts et al. 1988), and regulatory (Laurie-Ahlberg et al. 1980; Miyashita and Laurie-Ahlberg 1984) studies. The G6PD electrophoretic polymorphism genetically maps to 62.9 on the X chromosome (Eanes 1983) and has been placed cytologically at band 18F (Ganguly et al. 1985). The two common electrophoretic variants, designated A and B, separate by molecular size under electrophoresis (A is a dimer, and B a tetramer ; Steele et al. 1968), and both in vivo and in vitro studies indicate that A has significantly lower activity (Eanes 1984; Eanes and Hey 1986). These activity differences support the hypothesis that this could constitute a polymorphism for pentose shunt function. The G6PD locus has been cloned by Ganguly et al. ( 1985) and Hori et al. ( 1985), and the nucleotide sequence and intron-exon structure of the gene have been described based on genomic and cDNA clones (Fouts et al. 1988).
There is marked geographic variation in G6PD allele frequencies. A global study of allele frequency variation shows reciprocal latitudinal clines in Northern and South- ern Hemispheres (Oakeshott et al. 1983)) as well as large continental differences in allele frequency. African populations have predominantly the B allele, European pop- ulations mostly have the A allele, and North American populations segregate for a spectrum of frequencies.
In this report we begin our analysis of the G6PD polymorphism by using data from six-cutter restriction mapping to describe the sequence diversity and its geographic pattern that are associated with 126 lines of D. melanogaster sampled from five localities on three continents.
Material and Methods
The X chromosomes examined were recovered from isofemale lines established from wild collections made in Davis Peach Farm, Mt. Sinai, N.Y. in 1985 (42 lines), Watsonville, Calif., in 1985 ( 32 lines), Menetreol, France in 1986 ( 15 lines), Tubingen,

386 Eanes et al.
West Germany in 1986 ( 10 lines), and Okango Delta, Botswana in 1985 (27 lines). Individual iso-X chromosome lines were established by crossing a single male from each line with virgin FM6 / N264-84 females and extracting the wild X chromosome to homozygosity. The electrophoretic allele carried by each line was determined by starch- gel electrophoresis as described by Eanes and Hey ( 1986).
From each line, DNAs were prepared by the method of McGinnis et al. ( 1983)) and each was cut with eight six-cutter restriction enzymes listed in figure 1. Digested samples were separated by electrophoresis in 0.8% agarose gels, and the separated fragments were transferred to nylon filters. Probe DNAs were labeled with 32P by either nick-translation or random primer extension ( Feinberg and Vogelstein 1983 ) . Hybridizations were carried out overnight at 42°C. The filters were washed as rec- ommended in the manufacturers protocol and were autoradiographed.
The phage clone, designated hDmG2 1 and spanning 13 kb of the G6PD region, was obtained from Dr. Jerry Manning. The restriction map of this clone has been described by Ganguly et al. ( 1985 ) .
To clone the unknown 12.5kb insertion i, a library was made in hEMBL4 from EcoRI-digested genomic DNA from line CC3. DNA for cloning was size selected for an expected 1 l- 17-kb fragment bearing the insertion. The resultant plaques were screened with the 3.9-kb EcoRI-EcoRI fragment from hDmG21 that had been gel- purified. This is the fragment into which the unknown insertion was localized by restriction mapping.
In situ hybridizations with known and unknown insertions were carried out using dUTP-biotinylated DNA probes according to the methods described by Montgomery et al. (1987).
Results Overall Variation
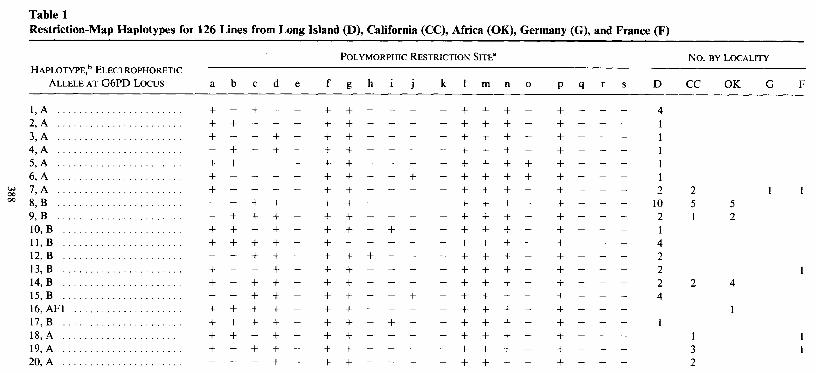
Using the hDmG2 1 probe we recognize three types of restriction-map variation within the 13-kb G6PD region. As is typical in such studies, we observe gains and losses of restriction sites, small insertion-deletions of several hundred base pairs, and, finally, large insertions several kilobases in length. Some restriction-site variation is detectable for the distal sites of fragments extending beyond the region hybridizing to the hDmG2 1 probe. Figure 1 summarizes the distribution of variation within the 13- kb region, as well as several sites and features recognized outside the region which also serve as useful markers. The original restriction map as determined by Ganguly et al. ( 1985) and Hori et al. ( 1985 )is depicted. The structure and orientation of the G6PD gene has been described by Fouts et al. ( 1988 ) . The gene consists of four exons coding for 523 amino acids. The first exon codes for fewer than six amino acids and is separated from the second exon by an intervening sequence of -2.8 kb. Exons 2 and 3 and exons 3 and 4 are separated by small intervening sequences of only 6 1 and 63 bases, respectively. The scale (in kilobases) used to denote positions in figure 1 sets the start of the cDNA sequence at zero. Table 1 shows the haplotypes found and their locality.
Population Allele Frequencies
As do other studies of worldwide allele frequency variation (Oakeshott et al. 1983), we observe substantial differences in A and B electrophoretic variant frequencies among these populations. In screening more than 3,9 16 and more than 462 chro- mosomes from the Mt. Sinai, New York and Watsonville, California localities, re-

G6PD Restriction-Map Variation 387
-7 -6 -5 -4 -3 -2 -1 6 7 6 9 10
I DmG21 I
FIG. 1 .-Restriction-map variation associated with the G6PD region. The original map of hDmG21 by Ganguly et al. ( 1985) is depicted, and the limits of the G6pd gene are determined on the basis of data of Fouts et al. ( 1988). The scale is expressed in kilobases, with the start of the cDNA sequence set at zero. Polymorphic restriction sites are denoted by a filled circle attached to the sites designated by lowercase letters (a-s). The limits of the observed insertions are shown. Uppercase letters denote the restriction sites for AvaI (A), BumHI (B), BglII (G), PstI (P), EcoRI (R), Sal1 (S), SstI (T), and XhoI (X). The restriction sites for PstI and AvaI have not been determined for insertion i.
spectively, we estimate the DPF (New York) and CC (California) populations to be 16% and 46% A, respectively (Eanes and Hey 1986). In 98 isofemale lines screened from the Botswana collection (OK), only a single A allele ( 1%) was recovered. In Europe the A frequency for 66 isofemale lines (4 1 from Germany and 25 from France) was estimated as 85%, and a second electrophoretic allele, possessing slightly faster mobility (designated AFI ) had a frequency of - 1 OS, the B allele frequency being 5%.
Restriction-Site Polymorphism
Among the 122 lines screened (five lines could not be completely characterized because of large insertions) using the eight six-base recognizing enzymes, five restriction- site polymorphisms are observed out of 28 total sites present within the 13-kb DmG2 1 region. Two other restriction-site polymorphisms could be unambiguously identified in the flanking regions not covered by the probe. Site variation differed between the continents. The North American lines showed three variable restriction sites (including sites a and j ) , while the African lines showed five polymorphic sites. The European lines displayed only the single polymorphic Sal1 site r at +9.5, and that site was restricted to the German and French chromosomes. Most polymorphic sites are limited to a small number of lines and appear restricted to a particular geographic region. The two exceptions were the BgZII site detected at -7.4 in the left flanking region and the AvaI/ XhoI site at + 11.2. These were the only two sites to segregate at intermediate frequencies in North America and Africa, and they were not present in Europe.
The observed restriction-site polymorphism can be used to estimate the per- nucleotide heterozygosity for this region. Using the approach of Nei and Li ( 1979)
d’
III1 III
II III
II III
III
I II
II I
I I
I I
I I
I I
I I
I I
II
III1 II
III Ill
II II
III I
++++++++++++++++++++
IIll++lllllllllllllI
+++++++++-I-++++++++++
++++++++++++++++++++
++++++++++++++++++++
II II
II III
I I
I I
I II
III I
11111+11111111+11111
111111111+111111+111
IIIIIIIIIll+lllllllI
++++++++++I+++++++++
++++++++++++-t+++++++
II II
I I
I I
I III
II III
II I
ll++llI+++++++++++++
+111111++1++1++++1+1
1+1++111+++1111+++11
+++1+++11++1++1++++1
.................... .................... .................... .................... .................... .................... .................... .................... .................... .................... .................... .................... .................... .................... .................... .................... .................... .................... .................... .................... ...............
.... .............
.._ ....
......... m
mm
Qm
bQ<b
44bdd<<cPc9
n 0
,” r\i
c4 d lo” u5 t=
cc” &
0” 2
6 6
< II;‘
\o” g 00” o\” d
d d
-t__C(dd_fl
388

389

390 Eanes et al.
and Nei and Tajima ( 198 1) we estimate Z, which is the average pairwise genetic distance or the proportion of heterozygous sites between randomly sampled allele copies. A second parameter used to characterize nucleotide heterozygosity is 0. Under a Wright-Fisher model (Ewens 1979)) 8 = ~N,cL, where N, and p are the effective population size and neutral mutation rate (per base), respectively. This parameter will approximate the per-base heterozygosity when 8 6 1, since its expected value is e/( 1 + 0). Hudson ( 1982) has presented an estimator of 8 and its variance (under either the assumption of free or the assumption of no recombination). Restricting our analysis to the 13-kb G6PD region defined by the XDmG21 clone, we observe five variant sites out of 28 total sites in 122 lines, and we estimate z as 0.00065 and 8 as 0.0035 + 0.00 18 (SD assuming no recombination), respectively. A discrepancy between these values will arise if the site frequency distribution deviates from that expected under the Fisher-Wright neutral model.
This estimate is inflated by the more variable African lines, for which 8 = 0.0030 & 0.0020 and n: = 0.00125. When considered separately, the values of ‘it and 8 are 0.00035 and 0.0007 + 0.0008, respectively, for the North American lines and are 0.0007 and 0.00 10 + 0.00 10 for the European lines.
Small Insertion-Deletion Variation
There were five small insertion-deletion sites estimated to be 120-300 bp in length. Size changes smaller than this will likely go undetected. Sites b, c, and d con- stitute widespread polymorphisms.
Large Insertions
Twenty lines show large insertions of 4.2-l 2.5 kb in the G6PD region. These appear to be the result of at least six independent insertion events, since three specific types of insertion have been multiply recovered. All the insertion-deletion variation of both size classes is confined to two regions: one -2-kb region in the right half of intron I and another 2-kb region at +5.8 to +7.0.
Insertion e is a 4.2-kb insert recovered in the intervening sequence in eight of 25 lines from both German and French populations. This insertion has been cloned from the same site in a Japanese line by Dr. S. Hori (personal communication). The clone restriction map corresponds very closely to the map inferred from our lines. This clone associates strongly, by in situ hybridization, with the G6PD site in European lines possessing the insertion. We also observe this clone to hybridize to the chromocenter as well as to several varying sites in the euchromatin. A second large 12.5-kb insertion (i) is observed in seven of 65 North American lines. We cloned this insertion from line CC3 and observe that it hybridizes in situ to the chromocenter as well as to a low number of variable euchromatic sites. Neither of these high-frequency insertions pos- sesses a restriction map reminiscent of the 30 published elements listed by Finnegan and Fawcett (1986).
Three lines (CC38, CC1 3, and CC 11) in North America show - 5-kb insertions (sites k and q) in the 3’ region of the intron I. Each possesses restriction sites consistent with being an F element (Dawid et al. 198 1). These insertions were not cloned, but an F element-bearing pDm 10 1 clone (Dawid et al. 198 1) hybridizes in situ at the G6PD site (region 18F) of each of the three lines, arguing for the presence of an F element in this region. Line CC27 possesses a large IO-kb insertion (site r) in the same region as is projected for the proposed F element insertions. This insertion is associated with a 40% drop in G6PD activity (W. F. Eanes, L. Katona, and M. Longtine, un-

G6PD Restriction-Map Variation 39 1
Table 2 Estimates of D and r2 between Selected Sites within the G6PD Region, for 42 Chromosomes from Davis Peach Farm, New York
G6pd A/B a b C d
G6pd A/B . . . a . . . . . b :: . . . . . . . ; ::::::::::
0.090** 0.004 -o.ot30* -0.156*** 0.172 0.043 -0.120*** -0.092** 0.00 1 0.040 -0.010 0.003 0.152 0.770 0.269 0.210 0.002 0.000 0.048 0.064
NOTE.-Values of D and r2 are given above and below the diagonal, respectively. Sites refer to those in fig. 1. Statistical significance is derived from x2 test with 1 df.
* P < 0.05. * P < 0.01. *** P c 0.005.
published results) and with a restriction map consistent with the roo or B104 element (Scherer et al. 1982). A BI04-bearing clone [cloned from the white locus by Z. Zachar (Zachar and Bingham 1982)] hybridizes strongly to this site. We propose that this insertion is the B104 transposon. These elements have been shown by in situ hy- bridization to several inbred lines to be present in 30-70 copies/ haploid genome and are the two most common transposable elements in the euchromatin (J. Hey and W. F. Eanes, unpublished results).
Lines DPFSB and DPF26B show a second homologous region outside the region covered by the DmG21 probe. This region appears as fragments in addition to the normal fragment array for digests with MI, SalI, BamHI, and PstI, while XhoI, EcoRI, BglI, and AvaI also show consistent size increases. These observations place the region approximately at site h in figure 1. The 3-kb SalI-Sal1 fragment spanning exon I of G6PD hybridizes strongly to the extra fragments. This suggests that the region is duplicated for G6PD and that it may be a pseudogene.
Linkage Disequilibrium
Nonrandom associations between site variants were examined only in the DPF lines, since this was the largest collection to be segregating for the G6PD polymorphism; and the pooling of haplotype data across collections will potentially inflate d&equilibria because of covariance in site frequencies ( Cavalli-Sfvorza and Bodmer 197 1) . Fur- thermore, estimates were limited to those polymorphisms segregating at intermediate frequencies sufficient to provide reasonable statistical tests of association. Because of the low heterozygosity in the region, only four sites (a, b, c, and d) including the G6PD polymorphism were judged informative. Since the traditional measure of linkage disequilibrium, D , has its maximum attainable value determined by allele frequencies, we also computed the squared correlation, r2, as a relative measure of association (Hill and Robertson 1968). Significance was determined by the x2 statistic with 1 df.
Table 2 presents the estimates of D and r2 between these five polymorphic sites. The G6PD polymorphism is in statistically significant linkage disequilibrium with three of the four sites, including site a ( y2 = 0.172, P < 0.0 1 ), which is - 10 kb from the likely site of the allozyme polymorphism (exons 2-3). Site d, likely the closest site to the allozyme site, is in very strong disequilibrium ( r2 = 0.770, P < 0.00 1).

392 Eanes et al.
Discussion
The use of restriction mapping via six-cutter enzymes offers a low-resolution image of the DNA sequence variation, but it clearly reveals the large insertion-deletion variation for the region around the G6pd locus. The unique aspects of variation in the G6PD region are the relatively low level of base-pair heterozygosity, the clustering of small insertion-deletions and large insertions at positions + 1.2 to +2.9 and +5.9 to +7.0, and the segregation of two large insertions at relatively high frequencies.
Compared with the heterozygosity estimates of other genomic regions recently examined in Drosophila melanogaster via restriction mapping, the 13-kb G6PD region (at 0.065%) has the lowest heterozygosity yet reported. Unfortunately, objective sta- tistical comparison with other regions is confounded by heterogeneity in geographic sampling and by the large stochastic variance associated with measures such as 8. Furthermore, the direct estimate of heterozygosity (as ‘71: = 0.00065 ) for this region is much smaller than the indirect estimate, 0 = 0.0035 * 0.00 18 (this assumes no re- combination). This discrepancy arises because in the G6PD region none of the variant restriction sites segregate at intermediate frequencies in any population.
There are several studies in which heterozygosity has been estimated for worldwide collections of gene copies. These gene copies include the white locus at 1.1% hetero- zygosity (Langley and Aquadro 1987), Amy at 0.8% heterozygosity (Langley et al. 1988), and Notch at 0.5% heterozygosity (Schaeffer et al. 1988). While the observed heterozygosity is the lowest yet reported, the estimates of 0 are not significantly different from G6PD.
The low level of heterozygosity revealed by six-cutter restriction enzymes offers little statistical power to test the a priori hypothesis that one G6pd allele possesses less base variation, as has been shown for the Adh Fast allele in a number of studies (Kreitman 1983; Aquadro et al. 1986; Keitman and Aguade 1986) and as has been used to argue for the recent derivation of that allele. Using our eight endonucleases, we estimate that we recognize fewer than 93 “site equivalents” (Kreitman and Aguade 1986) in the entire 1,569-base coding region. Therefore, we do not yet possess a good estimate of heterozygosity for the G6pd locus. It should be pointed out that Fouts et al. ( 1988) sequenced both a genomic copy of the region from Oregon-R and a cDNA- derived sequence from Canton-S. Both strains carry the A allele, and three nucleotide substitutions were observed (all in synonymous sites) in 1,569 total bases. This level of heterozygosity (n: = 0.0019) is the same as that observed between Fast alleles at Adh (Kreitman 1983). Clearly this hypothesis will require a finer level of resolution, focusing on the coding region and using either four-cutter analysis or DNA sequencing.
The clustering of large insertions has been observed in the Adh (Aquadro et al. 1986) and hsp70 regions (Leigh Brown 1983). What is unique is that the most ex- tensively disrupted portion of the region corresponds to the right side of the first intervening sequence of the G6PD gene. Insertions here lead to a doubling of the genomic region specifying G6PD. While many transposon insertions within introns of cloned mutants have been recovered because they disrupt gene expression (see Kidd et al. 1983; Levis et al. 1984), it would appear that in some instances the insertion of large elements into introns is possible without significant consequence on fitness (or function). For natural populations, Miyashita and Langley ( 1988) show two large insertions within the first intron of the white locus, and Aquadro et al. ( 1988) also observed a single large copy of a large insertion in the first large intron of the rosy

G6PD Restriction-Map Variation 393
locus. The present study shows intron-associated insertion at unprecedented high fre- quencies in natural populations.
A final significant observation is that two insertions appear to reach high fre- quencies across geographic areas. The frequency of the 4.2-kb e insertion is estimated at 32% in Europe and appears to be common in Japanese lines (S. Hori, personal communication). The 12.5kb i insertion is seen in 11% of the North American lines. Both insertions are similar to a small but variable number of euchromatic sites as well as to the chromocenter. It is not known whether these constitute (a) members of the different structural classes of mobile elements described by Finnegan and Fawcett ( 1986) or (b) something different. Nevertheless, published studies so far have em- phasized that individual large insertions are present at low frequencies, consistent with deleterious selection against transposon insertion (Golding et al. 1986 ) . These insertions in the G6PD region represent important exceptions to this observation. We do not know whether these insertions (a) represent repeated insertion events into the same or very close to the same site or (b) are identical by descent. This is an important question that can be addressed by more detailed molecular sequencing. Finally, it is possible that these common insertions constitute ancestral states and that the deleted state is derived. This can be examined by comparison of the region in D. simulans.
Of the other five insertions (h, k, q, r, and s) observed, three appear to be F elements and one the B104 element. Both elements possess high copy number and have been repeatedly observed as the cause of visible mutations in the D. melanogaster genome (see Kidd et al. 1983; O’Hare et al. 1983; Swaroop et al. 1985)) and they were also reported in the study of the Adh region ( Aquadro et al. 1986).
Although we do not yet know the site of the amino acid substitution responsible for the A/B difference, there is covariance of site variation with the G6PD alleles. There is little sharing of haplotypes between alleles, and strong linkage disequilibrium is observed where it is statistically appropriate to examine. For example, 70 of the 7 1 B alleles from both North America and Africa (CC 18 is the exception) lack the small deletion (site d), and most lack the second deletion (site c) seen in intron I in A variants. These deletions probably arose in an A-bearing haplotype and, because of low recombination, have had little time to reach equilibrium in the B allele. Even the single A allele (line OK70A) collected in the Botswana locality possesses both the c and d deletions.
One hypothesis for the establishment of the G6PD polymorphism and allele frequency cline in North America would involve multiple recruitment and mixing from both the African and European populations, each with its very different allele frequencies (this could contribute to the linkage disequilibrium discussed above). Recently, David and Capy ( 1988) reviewed the biogeographic information on D. melanogaster. The species appears to be of Afrotropical origin, since the melanogaster group possesses its highest diversity in west-central Africa. There are distinct mor- phological and allozyme differences between African and European-Asian D. mela- nogaster, and this reflects a relatively old evolutionary divergence. David and Capy propose that D. melanogaster spread to the New World with European human colo- nization and slavery but that it did not appear in North America until more recently, possibly with the introduction of temperate-adapted European populations. If we accept this historical scenario, then the polymorphism could have been established by the admixture of European and African flies. If we assume that the haplotype features associated with our samples are representative of continental populations and that

394 Eanes et al.
these features are stable over the time spans implied here, then it may be possible to reject certain historical scenarios.
The results at this juncture appear equivocal. The absence of both the large 4.2- kb insertion (site e) and the polymorphic Sal1 site r polymorphisms in North American A allele-bearing G6PD haplotypes argues against any large-scale contribution of Eu- ropean genes to the New World population. Furthermore, absence of the AFl allele, whose frequency averages 5%-l 5% in Europe, from a survey of more than 15,000 chromosomes screened in North America (Eanes and Hey 1986), also argues against any significant contribution. On the other hand, the three site polymorphisms (1, m, and n) seen in the African B alleles were also not seen in North American samples, although the polymorphic a and j sites are held in common by Africa and North America, and both are missing in Europe. It is possible that the Botswana locality sampled here is not typical of west African regions which are more likely to be sources of New World introduction. It is reported that among European and North American populations there is little population structuring, and the haplotype data presented here and in earlier studies certainly support this proposition with regard to North America (Kreitman and Aquade 1986; Miyashita and Langley 1988). However, Af- rican populations are more genetically structured than are European populations (Da- vid 1982), suggesting significant evolutionary divergence within the sub-Saharan region. The Botswana collection possesses a high-frequency endemic 3L inversion (at 22% and 38%) and lacks the cosmopolitan P inversion. There is also an X-linked inversion polymorphism unique to this region ( W. F. Eanes, J. Hey, and C. Wesley, unpublished results). Further speculation must await a systematic analysis of those regions on the west coast of Africa that most likely are the source of New World populations. These studies are in progress.
Acknowledgments
We thank D. Houle, M. Kreitman, and A. Fleuriet for providing a number of valuable Drosophila isofemale lines. J. Manning contributed the clones used to probe the G6PD region. We are grateful to C. Aquadro for offering a number of helpful protocols and advice during the early stages of the study. D. Futuyma and D. Dykhuizen read and commented on an early version of the manuscript. This study was supported by funds from NSF grants BSR-850046 1 and BSR-8402967 to W.F.E. This is contri- bution 7 12 from Graduate Studies in Ecology and Evolution, State University of New York at Stony Brook.
LITERATURE CITED
AQUADRO, C. F., S. F. DESSE, M. BLAND, C. H. LANGLEY, and C. C. LAURIE-AHLBERG. 1986. Molecular population genetics of the alcohol dehydrogenase gene region of Drosophila mel- anogaster. Genetics 114: 1165- 1190.
AQUADRO, C. F., K. M. LADO, and W. A. NOON. 1988. The rosy region of Drosophila mela- nogaster and Drosophila simulans. I. Contrasting levels of naturally occurring DNA restriction map variation and divergence. Genetics 119:875-888.
BIJLSMA, R., and W. VAN DELDEN. 1977. Polymorphism at the G6PD and 6PGD loci in Drosophila melanogaster. I. Evidence for selection in experimental populations. Genet. Res. 30:22 l-236.

G6PD Restriction-Map Variation 395
BIJLSMA, R., and C. VAN DER MEULEN-BRUIJNS . 1979. Polymorphism at the G6PD and 6PGD loci in Drosophila melanogaster. III. Developmental and biochemical aspects. Biochem. Genet. 17:1131-l 144.
CAVALLI-SFORZA, L. L., and W. F. BODMER. 197 1. The genetics of human populations. W. H. Freeman, San Francisco and London.
CAVENER, D. R., and M. T. CLEGG . 198 1. Evidence for biochemical and physiological differences between enzyme genotypes in Drosophila melanogaster. Proc. Natl. Acad. Sci. USA 78: 4444-4447.
CHEBLOUNE, Y., J. PAGNIER, G. TRABUCHET, C. FAURE, G. VERDIER, D. LABIE, and V. NIGON. 1988. Structural analysis of the 5’ flanking region of the B-globin gene in African sickle cell anemia patients: further evidence for three origins of the sickle cell mutation in Africa. Proc. Natl. Acad. Sci. USA 85:443 l-4435.
DAVID, J. R. 1982. Latitudinal variability of Drosophila melanogaster: allozyme frequencies divergence between European and Afrotropical populations. Biochem. Genet. 20:747-759.
DAVID, J. R., and P. CAPY. 1988. Genetic variation of Drosophila melanogaster populations. Trends Genet. 4: 106- 111.
DAWID, I. B., P. C. HILLIER, and B. CLARK. 198 1. Ribosomal insertion-like elements in Dro- sophila melanogaster are dispersed with mobile elements. Cell 25:339-408.
EANES, W. F. 1983. Genetic localization and sequential electrophoresis of G6pd in Drosophila melanogaster. Biochem. Genet. 21:703-7 11.
. 1984. Viability interactions, in vivo activity and the G6PD polymorphism in Drosophila melanogaster. Genetics 106:95- 107.
EANES, W. F., B. BINGHAM, J. HEY, and D. D. HOULE. 1985. Targeted selection experiments and enzyme polymorphism: negative evidence for octanoate selection at the G6PD locus in Drosophila melanogaster. Genetics 109:379-39 1.
EANES, W. F., and J. HEY. 1986. In vivo function of rare G6pd variants from natural populations of Drosophila melanogaster. Genetics 113~679-693.
EWENS, W. J. 1979. Mathematical population genetics. Springer, New York. FEINBERG, A. P., and B. VOGELSTEIN. 1983. A technique for radiolabelling DNA restriction
endonuclease fragments to high specific activity. Anal. Biochem. 132:6- 13. FINNEGAN, D. J., and D. H. FAWCETT. 1986 Transposable elements in Drosophila melanogaster.
Oxf. Surv. Eukaryotic Genes 3: l-62. FOUTS, D., R. GANGULY, A. G. GUTIERREZ, J. C. LUCCHESI, and J. E. MANNING. 1988. Nu-
cleotide sequence of the Drosophila glucose-6-phosphate dehydrogenase gene and comparison with the homologous human gene. Gene 63:26 l-275.
GANGULY, R., N. GANGULY, and J. E. MANNING. 1985 Isolation and characterization of the glucose-6-phosphate dehydrogenase gene in Drosophila melanogaster. Gene 35:9 1- 10 1.
GOLDING, G. D., C. F. AQUADRO, and C. H. LANGLEY. 1986. Sequence evolution within populations under multiple types of mutation. Proc. Natl. Acad. Sci. USA 83:427-43 1.
HILL, W. G., and A. ROBERTSON. 1968. Linkage disequilibrium in finite populations. Theor. Appl. Genet. 38:226-23 1.
HORI, S. H., M. AKASAKA, H. ITO, T. HANAOKA, S. TANDA, E. OHTSUKA, K. MIURA, T. TAKAHASI, and J. J. N. TANG. 1985. Cloning of the glucose-6-phosphate dehydrogenase gene of Drosophila melanogaster using 17-base oligonucleotide mixture as probes. Jpn. J. Genet. 60:455-463.
HORI, S. H., and S. TANDA . 1980. Purification and properties of wild-type and mutant glucose- 6-phosphate dehydrogenase and 6-phosphogluconate dehydrogenase in Drosophila mela- nogaster. Jpn. J. Genet. 55:21 l-223.
HUDSON, R. R. 1982. Estimating genetic variability with restriction endonucleases. Genetics 100:711-719.

396 Eanes et al.
HUDSON, R. R., and N. L. KAPLAN. 1986. On the divergence of alleles in nested subsamples from finite populations. Genetics 113: 1057- 1076.
HUDSON, R. R., M. KREITMAN, and M. AGUADE. 1987. A test of neutral molecular evolution based on nucleotide data. Genetics 116: 153-l 59.
KIDD, S., T. J. LOCKETT, and M. W. YOUNG. 1983. The Notch locus of Drosophila melanogaster. Cell 34:42 l-433.
KREITMAN, M. 1983. Nucleotide polymorphism at the alcohol dehydrogenase locus of Drosophila melanogaster. Nature 304:4 12-4 17.
KREITMAN, M., and M. AGUADE. 1986. Genetic uniformity in two populations of Drosophila melanogaster as revealed by filter hybridization of four-nucleotide-recognizing restriction enzyme digests. Proc. Natl. Acad. Sci. USA 83:3562-3566.
LANGLEY, C. H., and C. F. AQUADRO. 1987. Restriction-map variation in natural populations of Drosophila melanogaster: white-locus region. Mol. Biol. and Evol. 4:65 l-663.
LANGLEY, C. H., A. E. SHRIMPTON, T. YAMAZAKI, N. MIYASHITA, Y. MATSUO, and C. F. AQUADRO. 1988. Naturally occurring variation in the restriction map of the Amy region of Drosophila melanogaster. Genetics 119~6 19-629.
LAURIE-AHLBERG, C. C., G. MARONI, G. C. BEWLEY, J. C. LUCCHESI, and B. S. WEIR. 1980. Quantitative genetic variation of enzyme activities in natural populations of Drosophila melanogaster. Proc. Natl. Acad. Sci. USA 77: 1073-1077.
LEIGH BROWN, A. J. 1983. Variation at the 87A heat shock locus in Drosophila melanogaster. Proc. Natl. Acad. Sci. USA 80:5350-5354.
LEVIS, R., K. O’HARE, and G. M. RUBIN. 1984. Effects of transposable element insertions on RNA encoded by the white gene of Drosophila. Cell 38:47 l-48 1.
MCGINNIS, W., A. W. SHERMOEN, and S. K. BECKENDORF. 1983. A transposable element inserted just 5 ’ to a Drosophila glue gene alters gene expression and chromatin structure. Cell 34:75-84.
MIYASHITA, N., and C. H. LANGLEY. 1988. Molecular and phenotypic variation of the white locus region in Drosophila melanogaster. Genetics 120: 199-2 12.
MIYASHITA, N., and C. C. LAURIE-AHLBERG. 1984. Genetic analysis of chromosomal interaction effects on the activities of the glucose-6-phosphate and 6-phosphogluconate dehydrogenases in Drosophila melanogaster. Genetics 106:655-668.
MONTGOMERY, E. A., B. CHARLESWORTH, and C. H. LANGLEY. 1987. A test for the role of natural selection in the stabilization of transposable element copy number in a population of Drosophila melanogaster. Genet. Res. 49~3 l-4 1.
NEI, M., and W.-H. LI. 1979. Mathematical model for studying genetic variation in terms of restriction endonucleases. Proc. Natl. Acad. Sci. USA 76:5269-5273.
NEI, M., and F. TAJIMA. 198 1. DNA polymorphism detectable by restriction endonucleases. Genetics 97: 145- 163.
OAICESHOTT, J. G., G. K. CHAMBERS, J. B. GIBSON, W. F. EANES, and D. A. WILLCOCKS. 1983. Geographic variation in G6pd and Pgd allele frequencies in Drosophila melanogaster. Heredity 50:67-72.
O’HARE, K., R. LEVIS, and G. M. RUBIN. 1983. Transcription of the white locus in Drosophila melanogaster. Proc. Natl. Acad. Sci. USA 80:69 17-692 1.
SCHAEFFXR, S. W., C. F. AQUADRO, and C. H. LANGLEY. 1988. Restriction-map variation in the Notch region of Drosophila melanogaster. Mol. Biol. Evol. 5:30-40.
SCHERER, G., C. TSCHUDI, J. PERERA, H. DELINUS, and V. PIRROTTA . 1982. B 104, a new dispersed repeated gene family in Drosophila melanogaster and its analogies with retroviruses. J. Mol. Biol. 157:435-45 1.
SILVER, L. M., M. HAMMER, H. Fox, J. GARRELS, M. BUCAN, B. HERRMANN, A.-M. FRISCHAUF, H. LEHRACH, H. WINKING, F. FIGUEROA, and J. KLEIN. 1987. Molecular evidence for the

G6PD Restriction-Map Variation 397
rapid propagation of mouse t haplotypes from a single, recent, ancestral chromosome. Mol. Biol. Evol. 4:473-482.
STEELE, M. W., W. J. YOUNG, and B. CHILDS. 1968. Glucose-6-phosphate dehydrogenase in Drosophila melanogaster: starch gel electrophoretic variation due to molecular instability. Biochem. Genet. 2: 159- 175.
SWAROOP, A., M. L. PACO-LARSON, and A. GAREN . 1985. Molecular genetics of a transposon- induced dominant mutation in the Drosophila locus Glued. Proc. Natl. Acad. Sci. USA 82: 1751-1755.
WILLIAMSON, J. H., and M. M. BENTLEY. 1983. Comparative properties of three forms of glucose-6-phosphate dehydrogenase in Drosophila melanogaster. Biochem. Genet. 21: 1153- 1165.
ZACHAR, Z., and P. M. BINGHAM. 1982. Regulation of white locus expression: the structure of mutant alleles at the white locus of Drosophila melanogaster. Cell 30:529-54 1.
WALTER M. FITCH, reviewing editor
Received October 24, 1988; revision received March 14, 1989